
Spatio-Temporal Assessment of Global Gridded Evapotranspiration Datasets across Iran
by
 , , , and
Davood Moshir Panahi
1,† ,
,
Sadegh Sadeghi Tabas
1,†,
Zahra Kalantari
2,3,4,*,
Carla Sofia Santos Ferreira
2,3 and
and
Bagher Zahabiyoun
1 1
School of Civil Engineering, Iran University of Science and Technology, Tehran 16846-13114, Iran
2
Department of Physical Geography and Bolin Centre for Climate Research, Stockholm University, SE-10691 Stockholm, Sweden
3
Navarino Environmental Observatory, 24001 Messinia, Greece
4
Department of Sustainable Development, Environmental Science and Engineering, KTH Royal Institute of Technology, SE-10044 Stockholm, Sweden
*
Author to whom correspondence should be addressed.
†
The authors D. Moshir Panahi and S. Sadeghi Tabas have equally contributed to this study.
Remote Sens. 2021, 13(9), 1816; https://doi.org/10.3390/rs13091816
Submission received: 19 February 2021
/
Revised: 29 April 2021
/
Accepted: 30 April 2021
/
Published: 7 May 2021
(This article belongs to the Section Remote Sensing in Geology, Geomorphology and Hydrology)
Abstract
:Estimating evapotranspiration (ET), the main water output flux within basins, is an important step in assessing hydrological changes and water availability. However, direct measurements of ET are challenging, especially for large regions. Global products now provide gridded estimates of ET at different temporal resolution, each with its own method of estimating ET based on various data sources. This study investigates the differences between ERA5, GLEAM, and GLDAS datasets of estimated ET at gridded points across Iran, and their accuracy in comparison with reference ET. The spatial and temporal discrepancies between datasets are identified, as well as their co-variation with forcing variables. The ET reference values used to check the accuracy of the datasets were based on the water balance (ETwb) from Iran’s main basins, and co-variation of estimated errors for each product with forcing drivers of ET. The results indicate that ETERA5 provides higher base average values and lower maximum annual average values than ETGLEAM. Temporal changes at the annual scale are similar for GLEAM, ERA5, and GLDAS datasets, but differences at seasonal and monthly time scales are identified. Some discrepancies are also recorded in ET spatial distribution, but generally, all datasets provide similarities, e.g., for humid regions basins. ETERA5 has a higher correlation with available energy than available water, while ETGLEAM has higher correlation with available water, and ETGLDAS does not correlate with none of these drivers. Based on the comparison of ETERA5 and ETGLEAM with ETwb, both have similar errors in spatial distribution, while ETGLDAS provided over and under estimations in northern and southern basins, respectively, compared to them (ETERA5 and ETGLEAM). All three datasets provide better ET estimates (values closer to ETWB) in hyper-arid and arid regions from central to eastern Iran than in the humid areas. Thus, the GLEAM, ERA5, and GLDAS datasets are more suitable for estimating ET for arid rather than humid basins in Iran.
1. Introduction
Evapotranspiration (ET) is the main water output flux from the water system [1]. The amount of ET is regulated by available water and energy [1,2,3]. ET is the variable interconnecting land and climate, through joint hydro-climate variables. Thus, assessing changes in ET is widely used to estimate hydrological changes [2,4]. However, direct measurements of ET and its variations are more difficult than measuring other hydro-climate variables, such as precipitation, temperature, and river discharge. Direct measurements of ET are possible for very limited and small regions, e.g., using flux towers, but ET estimations for wider regions require different methods such as water balance and various global datasets [5].
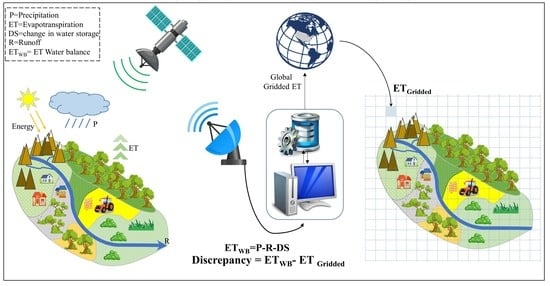
The water balance is a widely accepted method for estimating ET over a wide area, especially in basins with closed boundaries, and has been used in many studies [2,6]. In the water balance method, ET is calculated as ET = P-R-DS where P, R, and DS are precipitation, runoff, and storage change, respectively, and DS is typically assumed to be almost zero [2,7]. This assumption, however, can provide errors in ET calculations, particularly in areas with significant withdrawals from groundwater and surface water resources [6,8]. In this method, the spatial and temporal scale of ET is the same as for other hydro-climate variables.
In addition to the water balance method, different global product datasets of ET, created by improved remote sensing techniques and satellite equipment, are increasingly available [5]. Different global product datasets of ET, generated using various efficient remote sensing techniques and satellite equipment, are increasingly available [5]. Moreover, taking advantage of recent data-driven methods, the estimation accuracy of these global product datasets is significantly enhanced [9]. As ET plays a pivotal role in the land-atmosphere connection, it is essential to study and investigate various modeling approaches in estimating ET relationship components such as soil evaporation, interception, transpiration, and their interactions. Estimating these components is improved by employing high-resolution datasets and updated interrogation approaches [9,10,11].
The main advantages of using global products for ET estimation are the high-spatial extent with different temporal scales (e.g., daily), providing good feasibility for use at spatial and temporal scales required for various purposes, without concerns about ground-based data availability or the need to rely on time consuming field measurements. Each global product dataset uses its own method for ET estimation based on different data sources, and thus each dataset has its own specification. Models are considered to be prognostic or diagnostic [12,13] on the basis of ET estimation. In the former case, ET is calculated by modeling the budget components of water, requiring several input parameters (e.g., alsike rainfall, air temperature radiation). In contrast, in the diagnostic models, remote sensing-based observations are used with no need for prognostic calculations of water availability. The main advantage of diagnostic models is that they need fewer prior data about soil and vegetation characteristics for estimating balance elements of the energy. Their disadvantage, on the other hand, is the existence of large temporal and spatial gaps due to cloud cover and infrequent image accessibility defined by the satellite overpass schedule [13,14,15,16]. ET estimates based on prognostic models are beneficial in applications requiring time-continuous water budget data [12]. Additionally, before using a dataset for a region, its spatial and temporal characteristics must be investigated [17,18,19,20,21,22,23,24]. This can be done by comparing the dataset values with validated or measured data (reference), but it would be difficult in the case ET due to the lack of data driven by the need for establishing many measurement stations across large basins. Comparing and understating differences between distinct spatio-temporal datasets is an essential strategy to use appropriate data for ET assessments [5,17,18,24,25].
Several countries such as Iran, with extensive arid and semi-arid areas, inherently face water shortages due to climate conditions [26], but these natural water shortages are currently being intensified by human activities and climate change [2,7] and thus water security is of increasing concern. To identify the different drivers for hydrological change in arid and semi-arid areas and improve water management, ET losses are critical [6]. Accurate estimate of ET and its fluctuations can improve assessments in hydrological monitoring programs and water management strategies, since ET is the main output flux in dry and semi-dry regions [27,28]. Despite its importance, few studies have focused on estimating ET at national and basin scales [29,30,31]. In Iran, annual-scale ET values have been calculated for the period 1986–2016, based on the water balance equation [6]. However, no previous study has evaluated the use of global product ET datasets for Iran and its basins despite of the growing potential of this type of datasets. To fill this research gap, the present study assesses the application of the GLEAM, ERA5, and GLDAS gridded datasets of ET across Iran and its main basins, and investigates the reliability of using these datasets in ET estimations. Differences in the datasets will be obtained by investigating their statistical characteristics and their differences with reference values of ET and related errors. This is done by performing a spatio-temporal assessment on ET values derived from different gridded datasets (including GLDAS, GLEAM and ERA5) and then comparing them with the reference ET (ET computed from water balance) in various temporal scales during 1986–2018. Second, ET from the gridded datasets (ETGLEAM, ETERA5, and ETGLDAS) are compared with those based on annual water balance (ETwb) at basin scale, considered as the reference value for ET, by determining discrepancies and errors. To achieve this, the ETERA5, ETGLEAM, and ETGLDAS values are aggregated at the basin scale in the same period as ETwb (1986–2016). Understanding the reliability of each global dataset of ET (ERA5, GLEAM, and GLDAS) over Iran and its main basins is helpful for water resource management and to support policy making in order to improve water security.
2. Materials and Method
2.1. Study Area
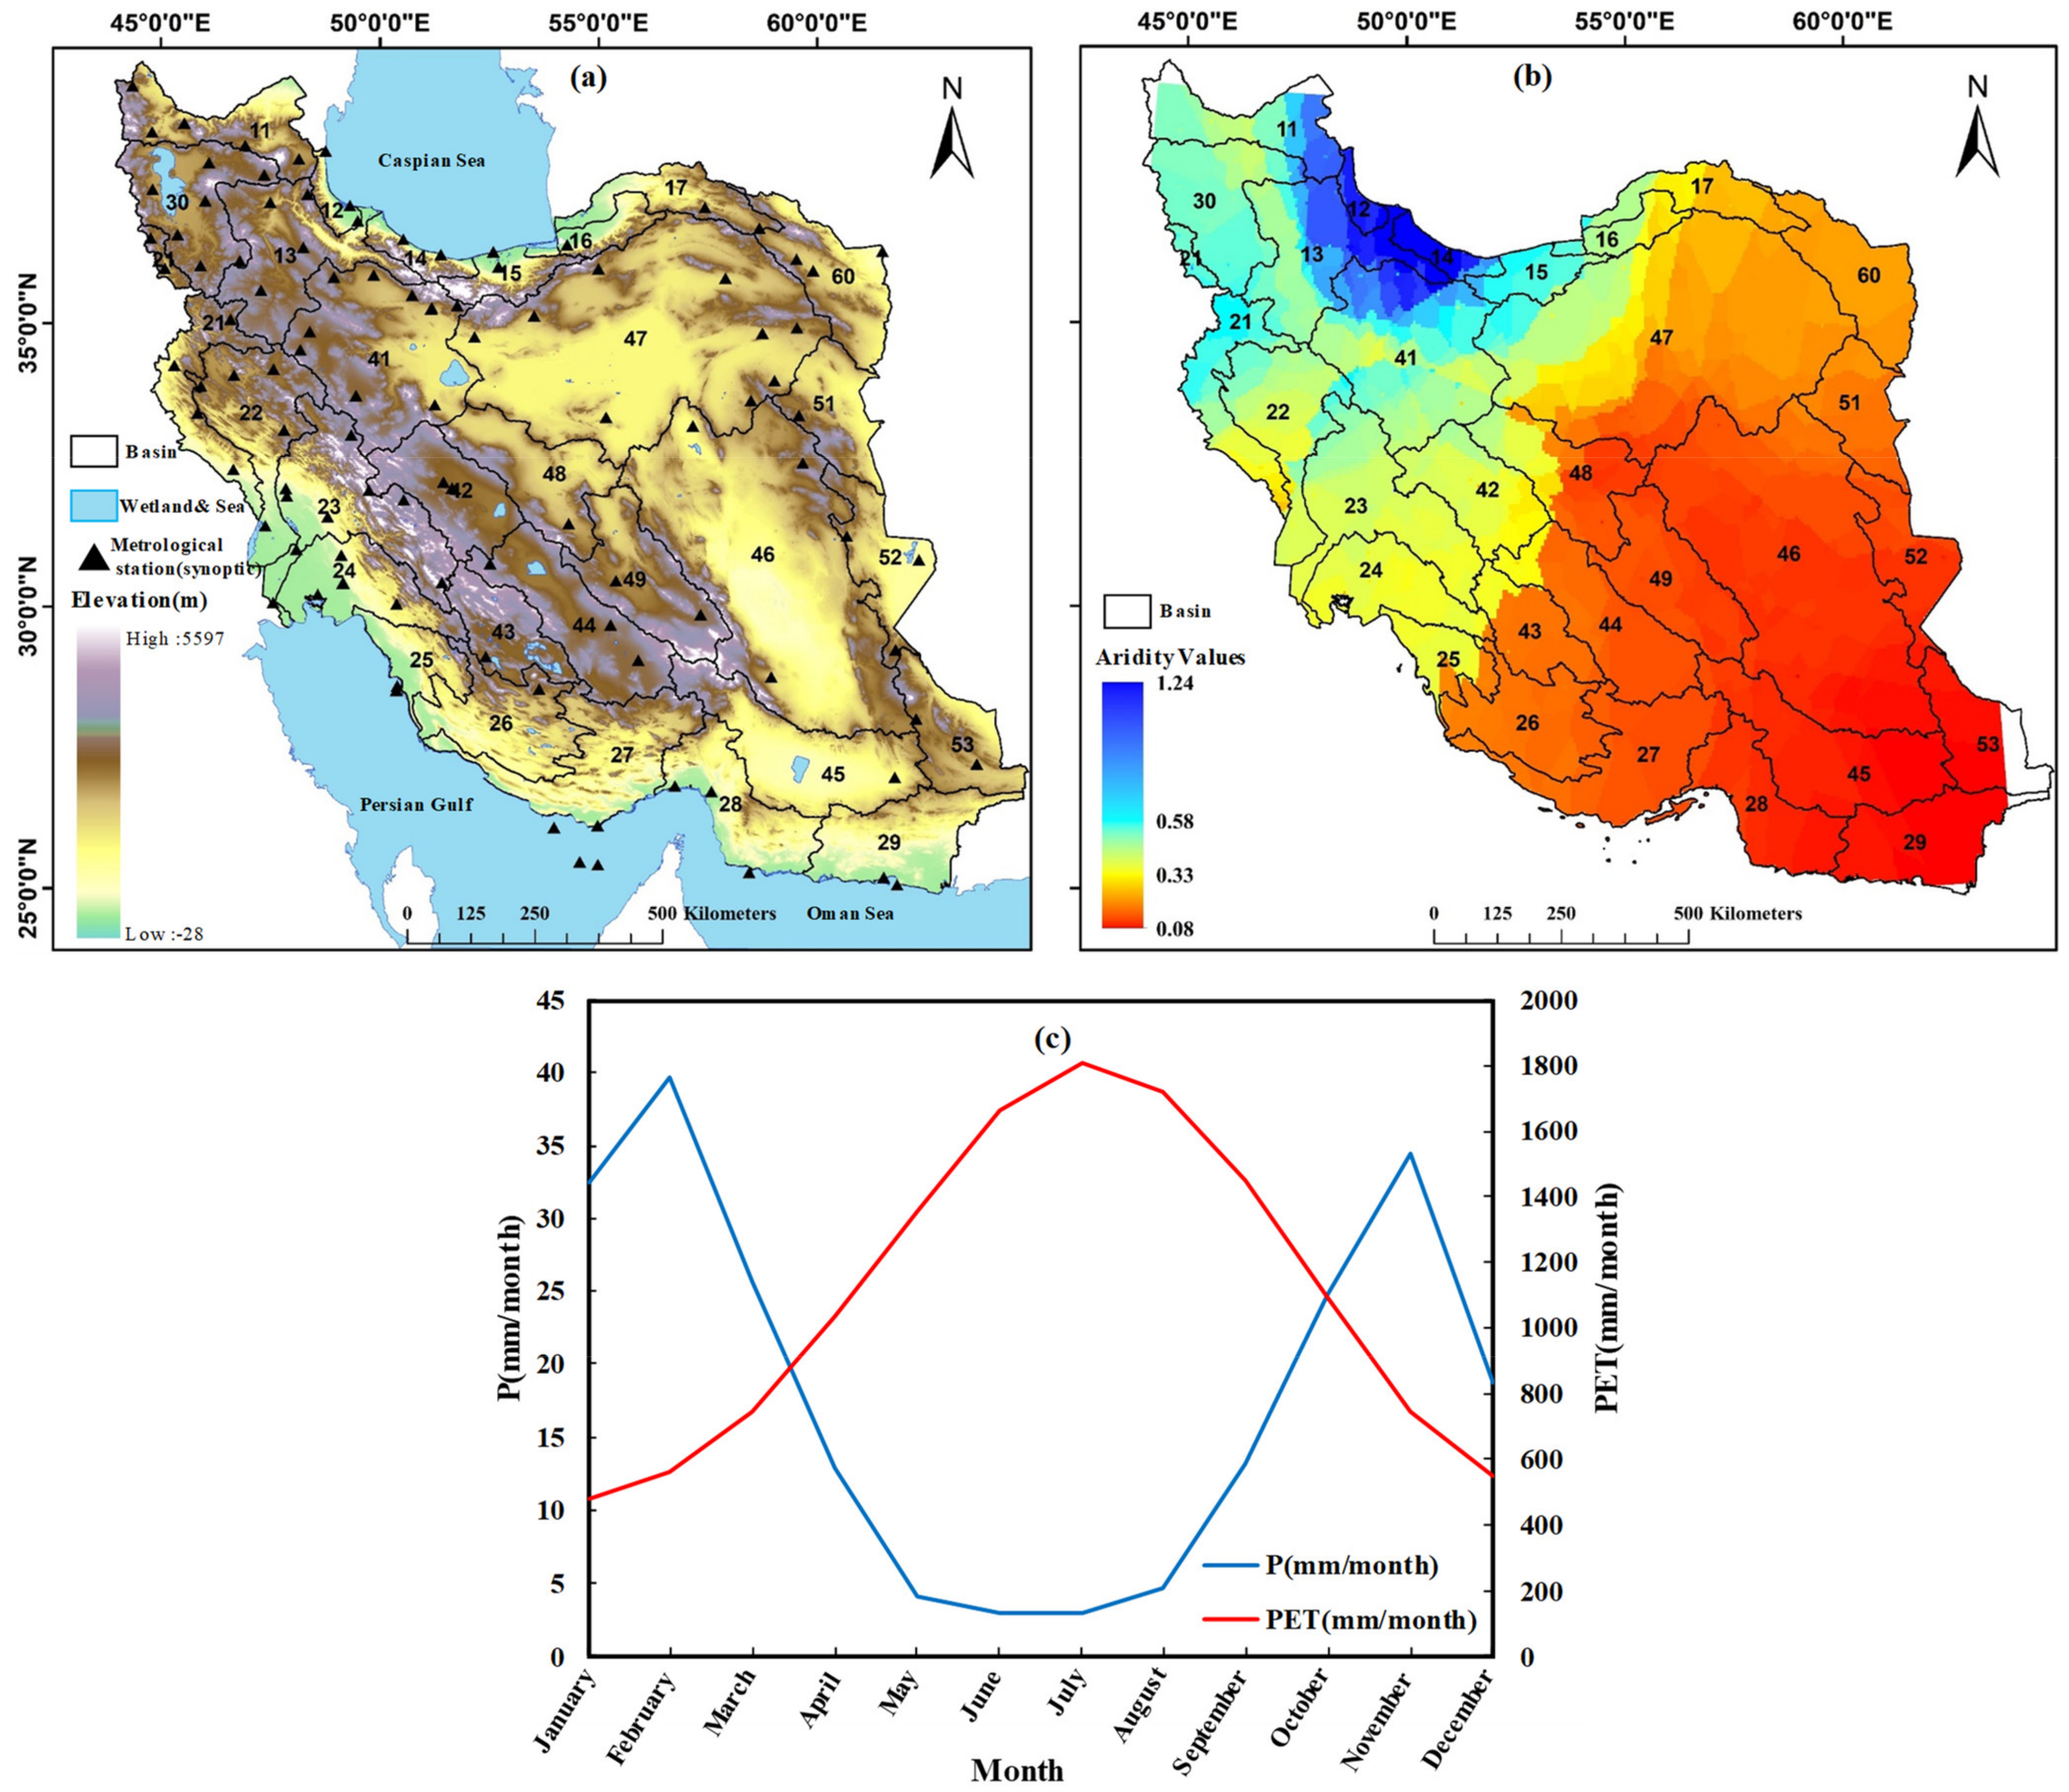
Iran is located 25°4′ N–39°46′ N latitude and 44°2′ E–63°19′ E longitude (Figure 1a), with access to the sea in north and south. The mean annual precipitation (P) over Iran is 311 mm, and the mean annual temperature (T) is 16.7 °C [6]. Based on the UNEP climate classification [32], most parts of Iran have an arid and semi-arid climate, but some areas in the north-west have a dry sub-humid climate, and the north has a humid climate based on global aridity values (Figure 1b). Iran has 30 main independent basins with different amounts of P and potential evapotranspiration (PET) based on their climate zones. In Figure 1 each basin is represented by a specific official two-digit code. For example, basin 12 (Figure 1b) in the north of Iran has the highest mean annual precipitation (1187 mm), whereas basin 47 located in the center has the lowest (77 mm). These basins have mean annual PET of 787 and 1083 mm, respectively (Supplementary Table S1), about 10 times higher than precipitation. Iran experiences high mean PET in June-August, the months with lowest precipitation, and lowest PET during the Jan–March and October–December when the precipitation is more than average (Figure 1c).
2.2. Methodology
2.2.1. Gridded ET Datasets
Since GLEAM, ERA5, and GLDAS gridded datasets, with distinct temporal time and spatial resolution scales, are easily accessible for academics, they are chosen in the present study. These cover long periods, enabling long-term evaluations in Iran in particular. However, the evaluation and comparison of the datasets are needed since the data source and methodology are relatively different. Although in some studies GLEAM was considered as a diagnostic method for ET estimation [33,34], other studies assume it as a prognostic model due to ET estimates using stress factors derived from soil moisture [13,35]. The diagnostic methods need much less knowledge of soil and vegetation characteristics (such as root-zone depth). They depend rather on remote observations of surface states based on sensing about humidity without overtly specifying moisture inputs into the system. Moreover, such models may estimate fluxes over regions where existing rainfall data are erroneous, or surface moisture is partly decoupled from local precipitation (owing to irrigation, shallow water levels) as they do not depend on inputs of precipitation. Further, since these models offer a robust connection to remote sensing applications established to utilize the growing amount of accessible satellite imagery, they are becoming more common [36]. For example, ALEXI [37,38] and MOD16 [39,40] are models for estimating the ET based on diagnostic available models [13,33]. GLDAS, on the other hand, applies a hybrid process of satellite- and ground-based measurements for ET estimation. In contrast, ERA5 involves the latest reanalysis in the European Centre for Medium-Range Weather Forecast’s family (ECMWF). The two latter models are combined as prognostic land surface methods [13,34,41,42]. Atmospheric forcing data (rainfall, radiation, wind, moisture, air temperature) and variables associated with soil and vegetation (Leaf Area Index (LAI), greenness, albedo, rooting depth, moisture-holding capacity, soil thermal and hydraulic conductivity) are applied by prognostic models in order to solve the energy–water balance along the soil–plant–atmosphere interface [14]. Then, in order to down-regulate ET from a possible rate obtained by radiative and meteorological forcing drivers, soil moisture estimates are applied. For applications requiring time-continuous water budget data, prognostic-model-based ET estimates are advantageous. Further, such estimates are often applied in order to provide background predictions needed by land data assimilation systems for the state observation integration (snow or soil moisture) with model-based energy and water forecasts [14,36]. The following sub-sections present additional information about each dataset.
- GLEAM dataset
GLEAM (Global Land Evaporation Amsterdam Model), a land surface model, applies satellite remote sensing forcing datasets to create a global ET dataset at a 0.25° × 0.25° latitude–longitude grid with daily temporal resolution. GLEAM estimates ET based on satellite observations of transpiration, interception loss, bare soil evaporation, snow sublimation, and open-water evaporation [43]. Intermediate outputs of the model used to estimate ET include potential evaporation, root-zone soil moisture, surface soil moisture, and evaporation.
To estimate PET using surface net radiation flux and near-surface air temperature dataset, GLEAM model is employed the Priestley–Taylor equation [44]. Using microwave vegetation optical depth (VOD) and root-zone soil moisture datasets, the estimated land fractions PET, such as bare soil, tall canopy, and short canopy, are changed into actual evaporation values based on a multiplicative evaporative stress factor. The root-zone soil moisture values are estimated using a multi-layer running-water balance and in order to eliminate random forcing errors, surface soil moisture data are also added to the soil profile. In addition, interception loss is estimated separately in GLEAM using a Gash analytical model [45]. Finally, to estimate actual ET values for water bodies and regions covered by ice and/or snow, the adapted Priestley-Taylor equation is used. The GLEAM estimation of actual ET values validated against eddy covariance towers worldwide and the errors resulted through a triple-collocation analysis. The results were shown that the GLEAM model generated more accurate evapotranspiration values than other available datasets used to quantify the water balance over a broad range of hydrological catchments. The GLEAM’s ET dataset was validated at 43 micrometeorological FLUXNET measurement locations under different vegetation and climatic scenarios [46].
In this study, GLEAM version 3.3a was used to provide data for the period 1980–2018. The recent 3.3a version of GLEAM, released in 2019, has three main updated parts: (i) new assimilation method, (ii) new water balance method with more accurate infiltration, soil moisture, and vertical gradient, and (iii) more efficient evaporative stress function [35,43,46]. The ETGLEAM dataset was downloaded in NetCDF format from https://www.gleam.eu, accessed on 18 February 2021, [47].
- ERA5 dataset
The advanced re-analysis model ERA5 [48] was launched in 1950. ERA5 helps to achieve a quality re-analysis of universal oceanic, atmospheric, and land surface fields at hourly time steps, with a ~30 km horizontal resolution and 137 vertical pressure up to 0.01 hPa from the surface up to a height of 80 km, leading to a high-quality reanalysis of global atmospheric, oceanic, and land-surface fields at hourly time steps. In ERA5, the surface energy partitioning is replaced the ERA-Interim by some improvements initiated in 1979 [48], including (i) improved solar irradiance forcing, greenhouse gases, and stratospheric sulfate aerosols affecting the available surface energy, (ii) significant high-spatial resolution, enabling the highly realistic representation of surface-atmosphere interactions in complex lands, such as coastal or mountainous areas, and (iii) an improved land surface model. The ETERA5 dataset for Iran, available for the same period as GLEAM (1980–2018), was downloaded and extracted from Climate Data Store website (https://cds.climate.copernicus.eu/,accessed on 10 July 2020).
- GLDAS dataset
The Ground System Information System (GLDAS) model consists of several offline models which integrate large volume of observational data, and the Earth Information System (LIS) with a resolution from 0.25 to 1 [49]. The GLDAS model estimates the optimal soil and flow condition based on a combination of satellite and terrestrial data products using advanced surface modeling and simulation techniques. The model was proposed by four groups of scientists from the National Aeronautics and Space Administration (NASA), the Goddard Space Flight Center (GSFC), the National Oceanic and Atmospheric Administration (NOAA), and the National Center for Environmental Prediction (NCEP). The system simulates land surface parameters such as soil moisture and surface temperature, and also fluxes such as evaporation and sensible heat using four land surface models (LSMs), including Community Land Model, NOAH, Mosaic, and Variable Infiltration Capacity [50]. These models incorporate a large number of ground-based observations.
GLDAS provides an integrated dataset (https://ldas.gsfc.nasa.gov/gldas/, accessed on 15 June 2020), which assimilates measurements that are based on ground and satellite data. Using innovative data integration and complex land-surface modeling methods, it has been developed to deliver different flux fields and land-surface states [51]. Global fluxes are delivered with fine and coarse (0.01° and 0.25°) spatial resolutions, from 3-hour to monthly temporal scales. NASA’s Hydrology Data and Information Services Center (http://disc.sci.gsfc.nasa.gov/hydrology, accessed on 17 June 2020) are the free sources to download the GLDAS LSMs and detailed documentation on their forcing datasets. In the present research, the ETGLDAS products are used at monthly temporal resolution and a 0.25° × 0.25° spatial resolution from GLDAS 2.0. This product uses the land surface variables including soil moisture and surface temperature, and fluxes such as precipitation and sensible heat fluxes to simulate ET from NOAH products [50]. However, each of these datasets has its own time scale, and we retrieved the daily datasets and aggregated them to a monthly time scale.
2.2.2. ET Based on Water Balance
The fundamental water balance equation, as ET = P-R-DS (here, ET = Evapotranspiration, P = Precipitation, R = Runoff, and DS = water storage change), is a commonly used strategy for estimating ET, which is called ET water balance (ETWB). This equation is applicable for closed boundaries, such as basins. The annual water balance for the 30 main basins of Iran calculated by [6] is the first and only source of ET data for Iran’s basins. To calculate the ETWB, it is necessary to determine P, R, and DS in advance. [6] calculated P by using over 103 metrological stations. The area-weighted averaging method was used to calculate the yearly average precipitation. To calculate R, each basin was divided into several sub-basins based on the river network and elevation. At the outlet of each new sub-division basin, one hydrometric station with continuous observed data over 1986–2016 was located. The R at each sub-division basin was calculated by dividing the discharge of the related hydrometric station area. To determine the R at each main basin, the sequence of sub-division basins was considered. Although most studies assume DS to be neglectable [2,7], in areas with significant withdrawals from groundwater and surface water resources this assumption can provide errors in ET calculation in regions which ground or surface water alter significantly [8]. Thus, to determine the DS (water storage changes), the summation of ground water and surface water storage changes instead of assuming DS equal to zero was used. The DS time step had annual time scale and so the computed ET had annual as well. All the data used to calculate ET using water balance equation was based on observations. In the present study, ETwb is used as a reference when evaluating the reliability of the investigated ET datasets.
In this study, monthly precipitation and temperature for the 30 basins of Iran are calculated by the kriging method, using data at monthly time scale for the period 1986–2016 from 103 synoptic stations provided by Iran’s Meteorological Organization (http://www.irimo.ir/, accessed on 10 April 2020) [52] (Figure 1b). All of these stations have continuous monthly observation data. PET is determined after calculating the average temperature for each basin using the Arora formula (Arora, 2002). Groundwater data for each basin were provided by the Iranian Ministry of Energy (http://waterplan.moe.gov.ir/, accessed on 5 April 2020) [53]. The GW information is reported in volume (MCM: million cubic meters), but other hydro-climate data (P, PET, ET) are in mm. For comparison purposes, the GW data are divided by basin area to convert the values to mm.
2.2.3. Comparison of ETERA5, ETGLEAM, and ETGLDAS
To compare ET from the global datasets ETERA5, ETGLEAM, and ETGLDAS, long-term average values were calculated at each grid point in Iran over 1980–2018. Temporal (monthly, seasonal, annual) variations were considered to gain a better understanding of possible differences between the datasets. The difference between dataset values (ETERA5-ETGLEAM, ETERA5-ETGLDAS, and ETGLEAM-ETGLDAS) were calculated in order to assess spatial and temporal variations. Statistical characteristics on each season, including mean, median, and standard deviation (SD), were used to obtain more information about differences in seasonal variations in ETERA5, ETGLEAM, and ETGLDAS. All of these comparisons provided a better understanding of ET characteristics, variations, and differences between the three global ET datasets over their full range values (ETERA5, ETGLEAM, and ETGLDAS).
Each product (ETERA5, ETGLEAM, and ETGLDAS) uses different sources of energy and water (PET and P) for ET determination, which can be a source of error. Since ET is controlled by available energy and water, PET was used in this study as a metric of available energy. In the case of available water (input flux), both P and P + GW were considered. The relationship between ETERA5, ETGLEAM, and ETGLDAS and PET, P, and P+GW. P and GW were determined based on measurements at observation stations, whereas PET values were calculated by Arora formulation (Arora, 2002) using the observed average temperature in metrological stations (PET = 325 + 21 × T + 0.9 × T2, where T in °C). The Arora formulation [54] was selected for consistency with calculation by [6].
For evaluating ETERA5, ETGLEAM, and ETGLDAS accuracy in Iran, the datasets were compared with the ETwb reference values [6]. For this, ETERA5, ETGLEAM, and ETGLDAS values were aggregated for each basin in the same period as ETwb (1986–2016). The annual average for each basin was compared with ETwb as: ETwb-ETERA5, ETwb-ETGLEAM, ETwb-ETGLDAS. Mean Absolute Error (MAE) and Root Mean Squared Error (RMSE) were calculated for ETGLEAM, ETERA5, and ETGLDAS during the period 1986–2016, to show the accuracy of estimation of each dataset compared with the reference value, i.e., the estimation error related to each dataset. Both measures have been widely used to assess differences between values in different studies [50,55,56,57]. MAE and RMSE are calculated as:
where is the model (estimated) value, xi is the reference value, and n is the total number of data points.
Since part of the error in the global datasets are related to the drivers of ET (available energy and water), the co-variation of MAE for each dataset with PET and available water fluxes (i.e., P and P+GW) was evaluated for each basin. Based on MAE and its co-variation with ET drivers, the ETERA5, ETGLEAM, and ETGLDAS data were interpreted.
3. Result and Discussion
3.1. Spatial and Temporal Discrepancy in ETERA5, ETGLEAM, and ETGLDAS
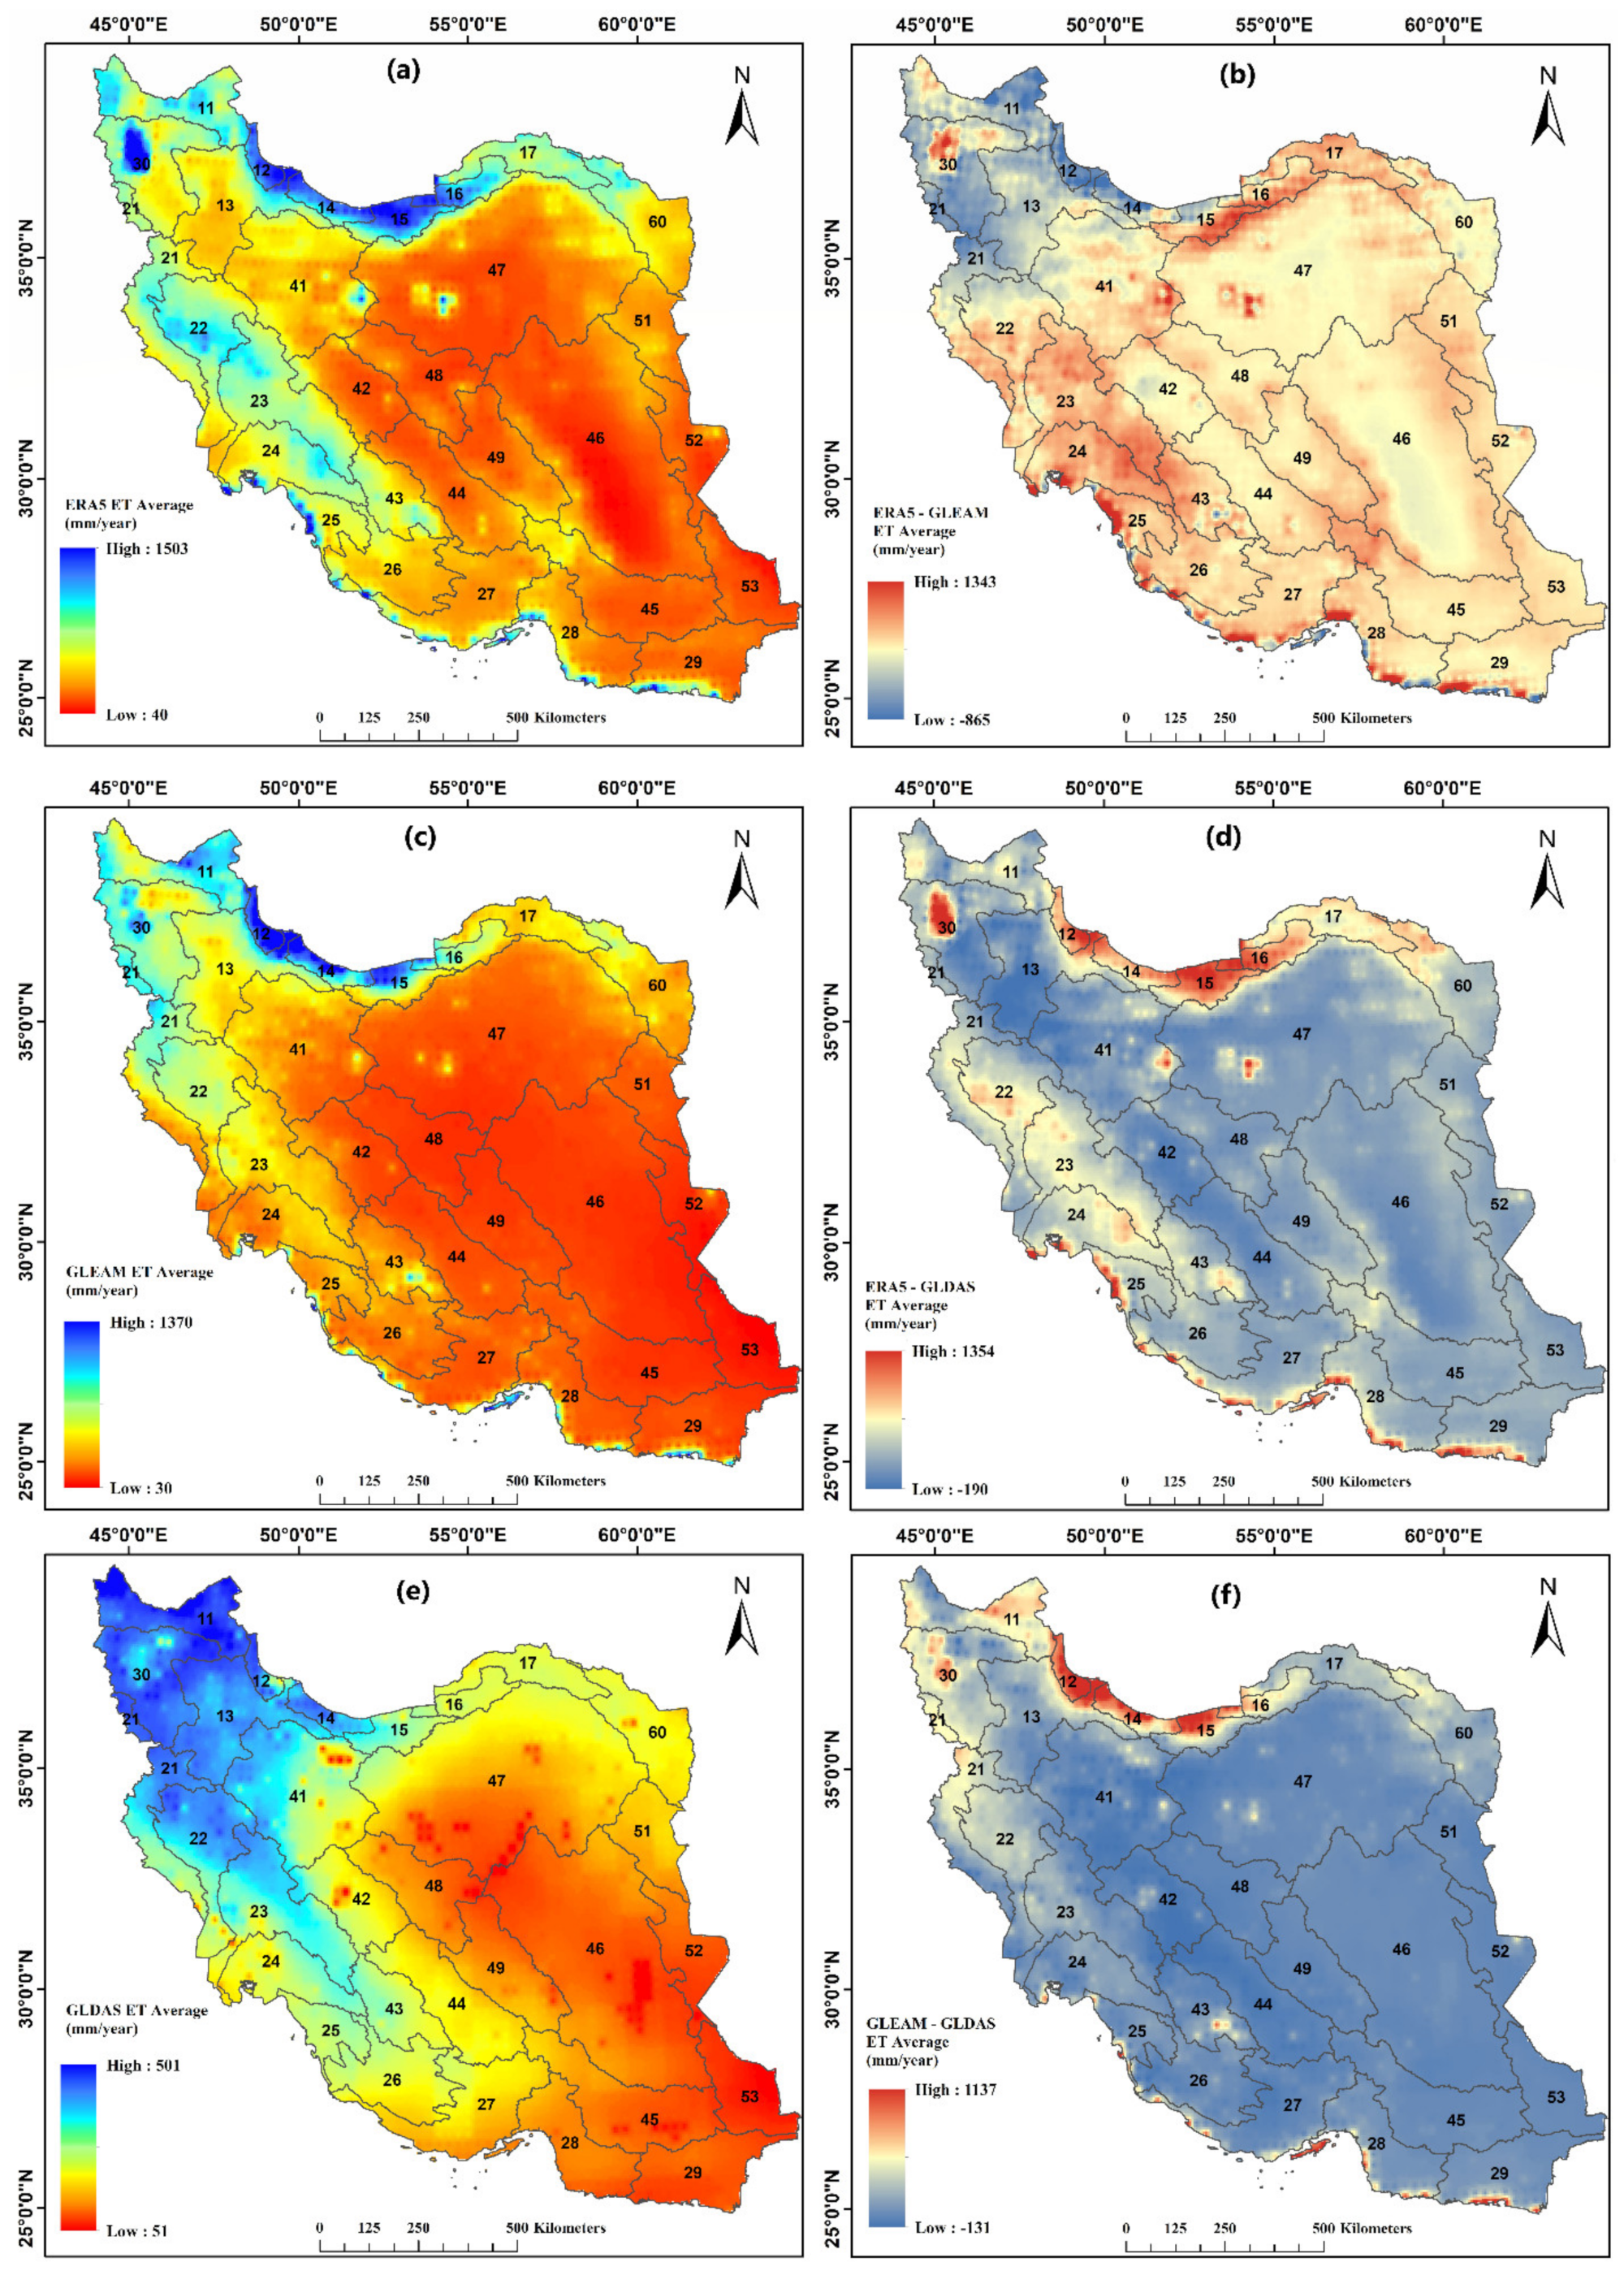
Long-term gridded average of ETERA5, ETGLEAM, and ETGLDAS in Iran (1980–2018) is illustrated in Figure 2a,c,e, respectively. All datasets show a wide spatial range of ET (ETERA5: 40–1502 mm/yr, ETGLEAM: 31–1369 mm/yr, and ETGLDAS: 51–501 mm/yr), although ETGLDAS range is much smaller compared with two other datasets. The general spatial pattern of ET is similar between the three datasets while ETGLEAM and ETERA5 are more alike, displaying for example, high values in the north of Iran, close to the Caspian Sea, and at some grid points in the south close to the Persian Gulf and Oman sea (Figure 1a), and low levels in central parts occupied by deserts. ETGLDAS shows a more extensive cover of low values, extending over areas in the north, northwest, and western region of Iran. The central to the south-eastern areas have a lower range of ET in all datasets, mostly in desert-lands with arid and hyper-arid climate conditions (Figure 1b).
For almost all parts of Iran, spatial discrepancies are available between ERA5 and GLEAM datasets (Figure 2d), spanning a wide range of values (ETERA5-ETGLEAM: −864 mm to 1343 mm). These discrepancies are not uniform and show prevalent spatial fluctuations, but some general patterns are discernible. ETERA5 shows higher values than ETGLEAM in south-western regions located in the Zagros mountains and also at some grid points close to the southern coastline. In contrast, ETGLEAM indicates higher values than ETERA5 in some northern parts and north-western regions, except for Lake Urmia (located in basin 30). For areas located in central Iran, which are almost covered by desert, ETERA5 and ETGLEAM show more similar values and lower than ETGLDAS (Figure 2e,f). Other regions do not follow these general patterns. The comparison of ETGLDAS with the two other datasets indicates higher ET on almost all parts of Iran, but in areas close to the sea (north and south part, Figure 1a) the estimations are lower (Figure 2e,f).
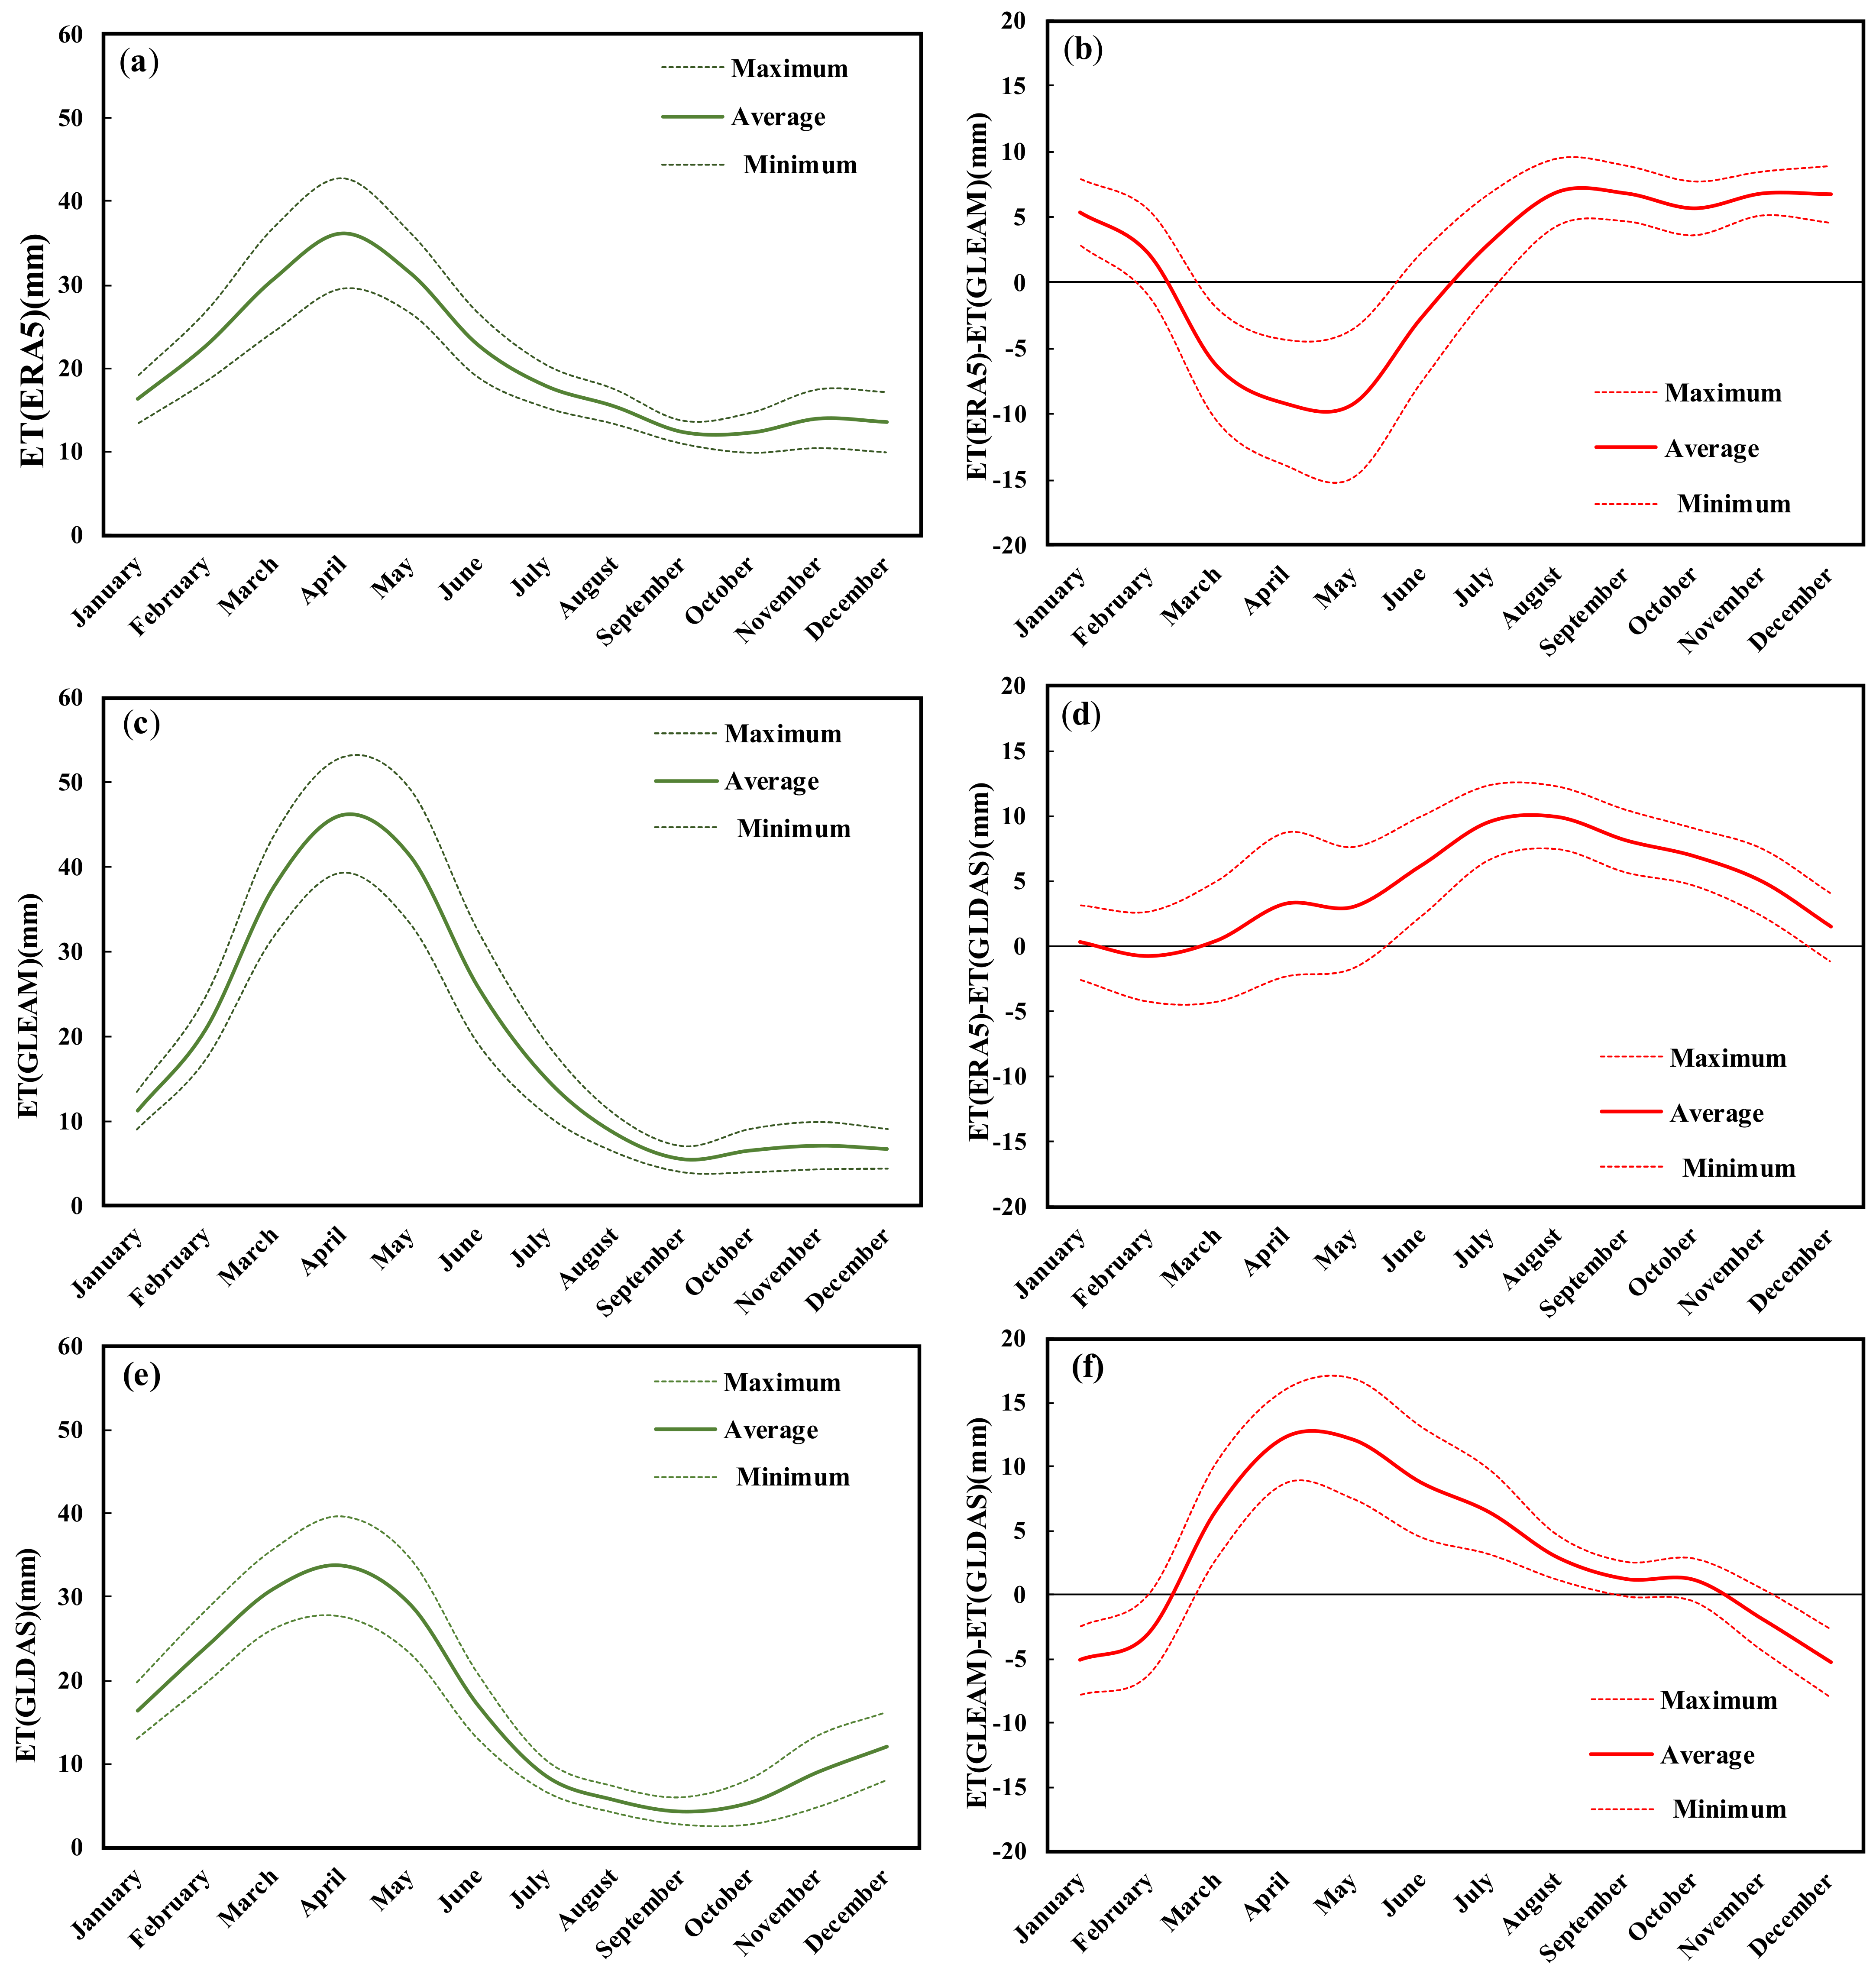
In addition to the spatial annual discrepancy between ETGLEAM, ETERA5 and ETGLDAS, the datasets display temporal differences over months (Figure 3) and seasons (Figure 4). The general pattern of temporal variation in three datasets (ERA5, Gleam, and GLDAS) over months are similar (at annual scale): ET started to increase in January and reaches maximum values in April–May. After the peak period, ET declines until reaching a minimum at the end of September, followed by a somewhat quicker rise in November and December for the ETGLDAS than the other two datasets (Figure 3a,c,e).
The ETERA5 has a higher base value than other datasets (minimum of ETERA5 = 12.3 mm, Figure 3a,c,e) while ETGLEAM has higher maximum values (46.1 mm, Figure 3c). These differences indicate that ETERA5 lower boundary is higher, and the maximum values of ETERA5 and ETGLDAS are lower than ETGLEAM (Figure 3b,d,f). Over the periods January–February and June–December, ETERA5 has a higher value than ETGLEAM (Figure 3b) and the maximum differences happened in May, and reached −9.2 mm. The minimum difference also occurred in February and corresponds to 2.3 mm. Over all the months, except February, the ERA5 estimated ET higher than GLDAS dataset (Figure 3d). The minimum is 0.3 mm, recorded in January, and a maximum of 9 mm occurred in August. Comparison of ET estimations of GLEAM and GLDAS show that during the period February–October, GLEAM provides higher values of ET (Figure 3f).
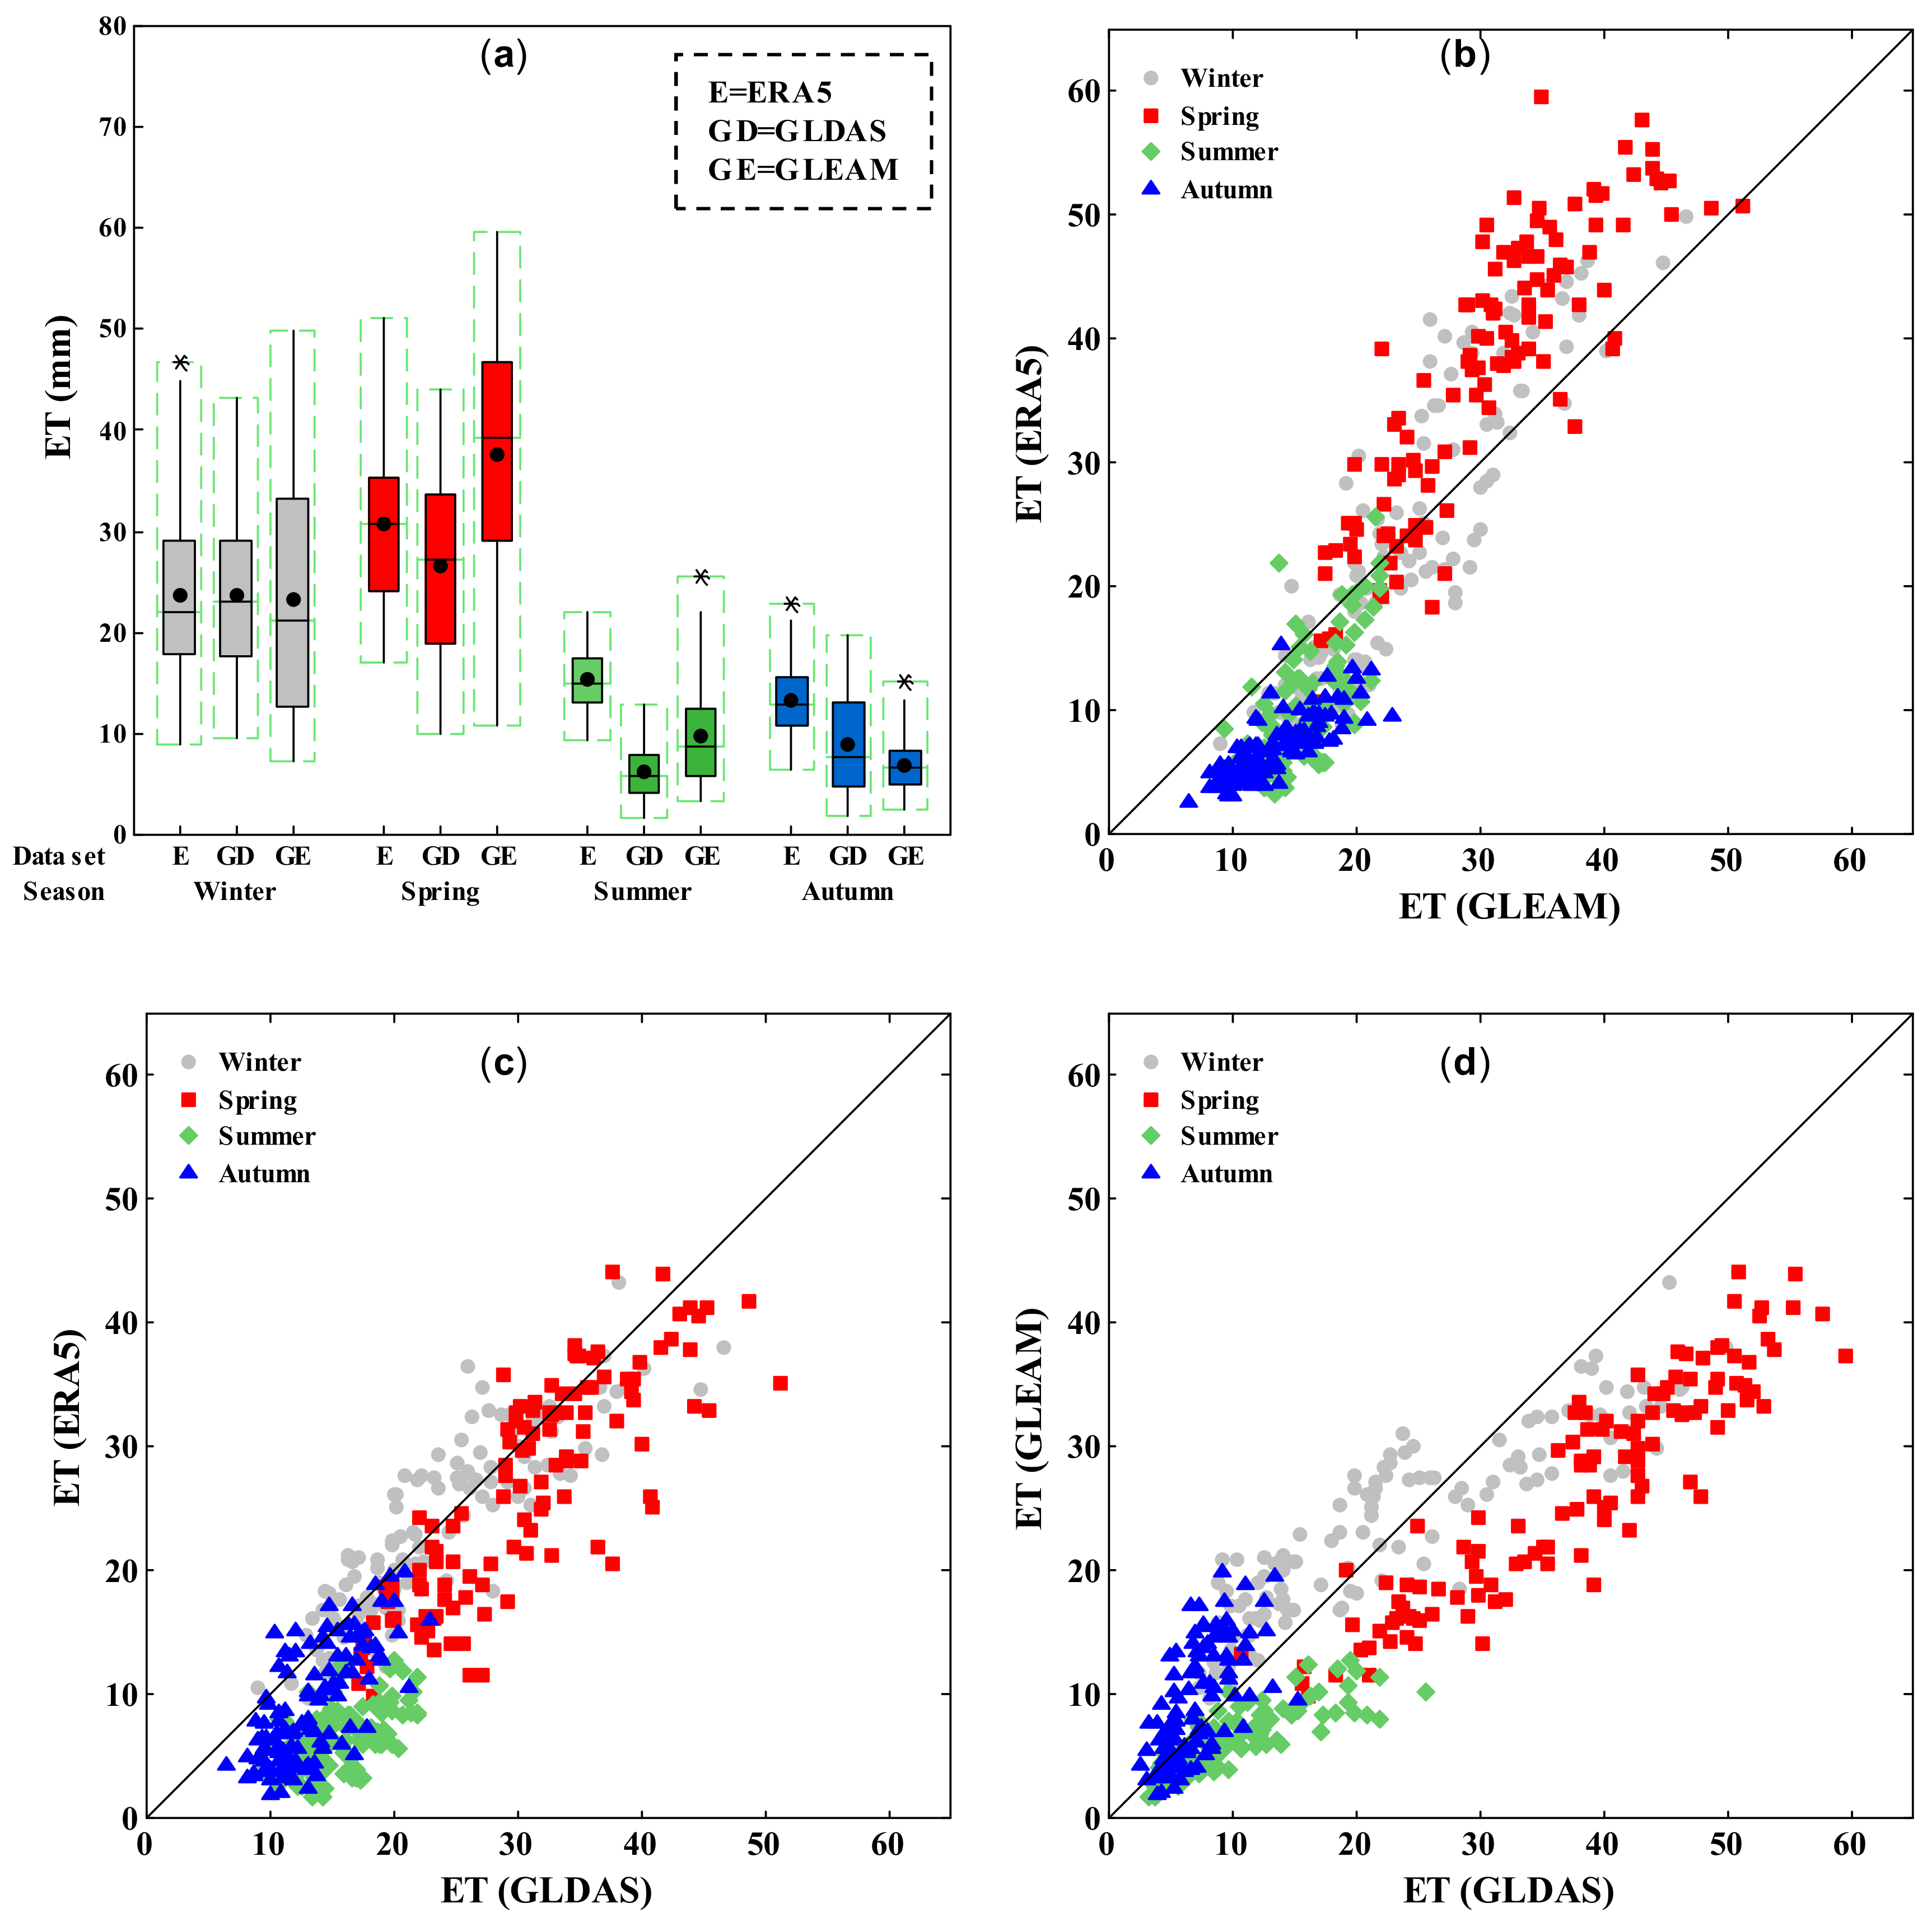
The box plots in Figure 4a show the seasonal statistical characteristics of ETGLEAM, ETERA5, and ETGLDAS, including the median (horizontal black line), average (black point) and SD (black box), and the range of estimated values (green dashed box). In all seasons, ETGLEAM has a higher degree of variation (SD) than ETERA5 and ETGLDAS, except in autumn when ETGLDAS has a higher range of values variation. In winter, the ET mean values are very similar between all datasets (ETERA5 = 23.75 mm, ETGLDAS = 23.78 mm, and ETGLEAM = 23.3 mm).
Figure 4b–d illustrate the seasonal discrepancies between ETGLEAM, ETERA5, and ETGLDAS. During the winter season, ETERA5 and ETGLEAM are distributed on both sides of the 1:1 line (Figure 4b). In spring, almost all ET points are located above the 1:1 line and inclined to the GLEAM axis (vertical). During summer and autumn, all points are located below the 1:1 line and inclined to the ERA5 axis (horizontal). A comparison between ETERA5 and ETGLDAS (Figure 4c) indicates that during the spring and summer, the GLDAS estimates higher values of ET and almost all points are located below the 1:1 line. However, during the autumn and winter, the points are distributed on both sides of 1:1 line; thus, in these seasons, they do not have special over/under differences. The comparison between the distribution of estimated ETGLEAM and ETGLDAS values illustrates that GLDAS have higher ET values, except in winter when points are distributed on both sides of 1:1 line (Figure 4d).
3.2. Correlations of ETERA5, ETGLEAM, and ETGLDAS with Forcing Drivers
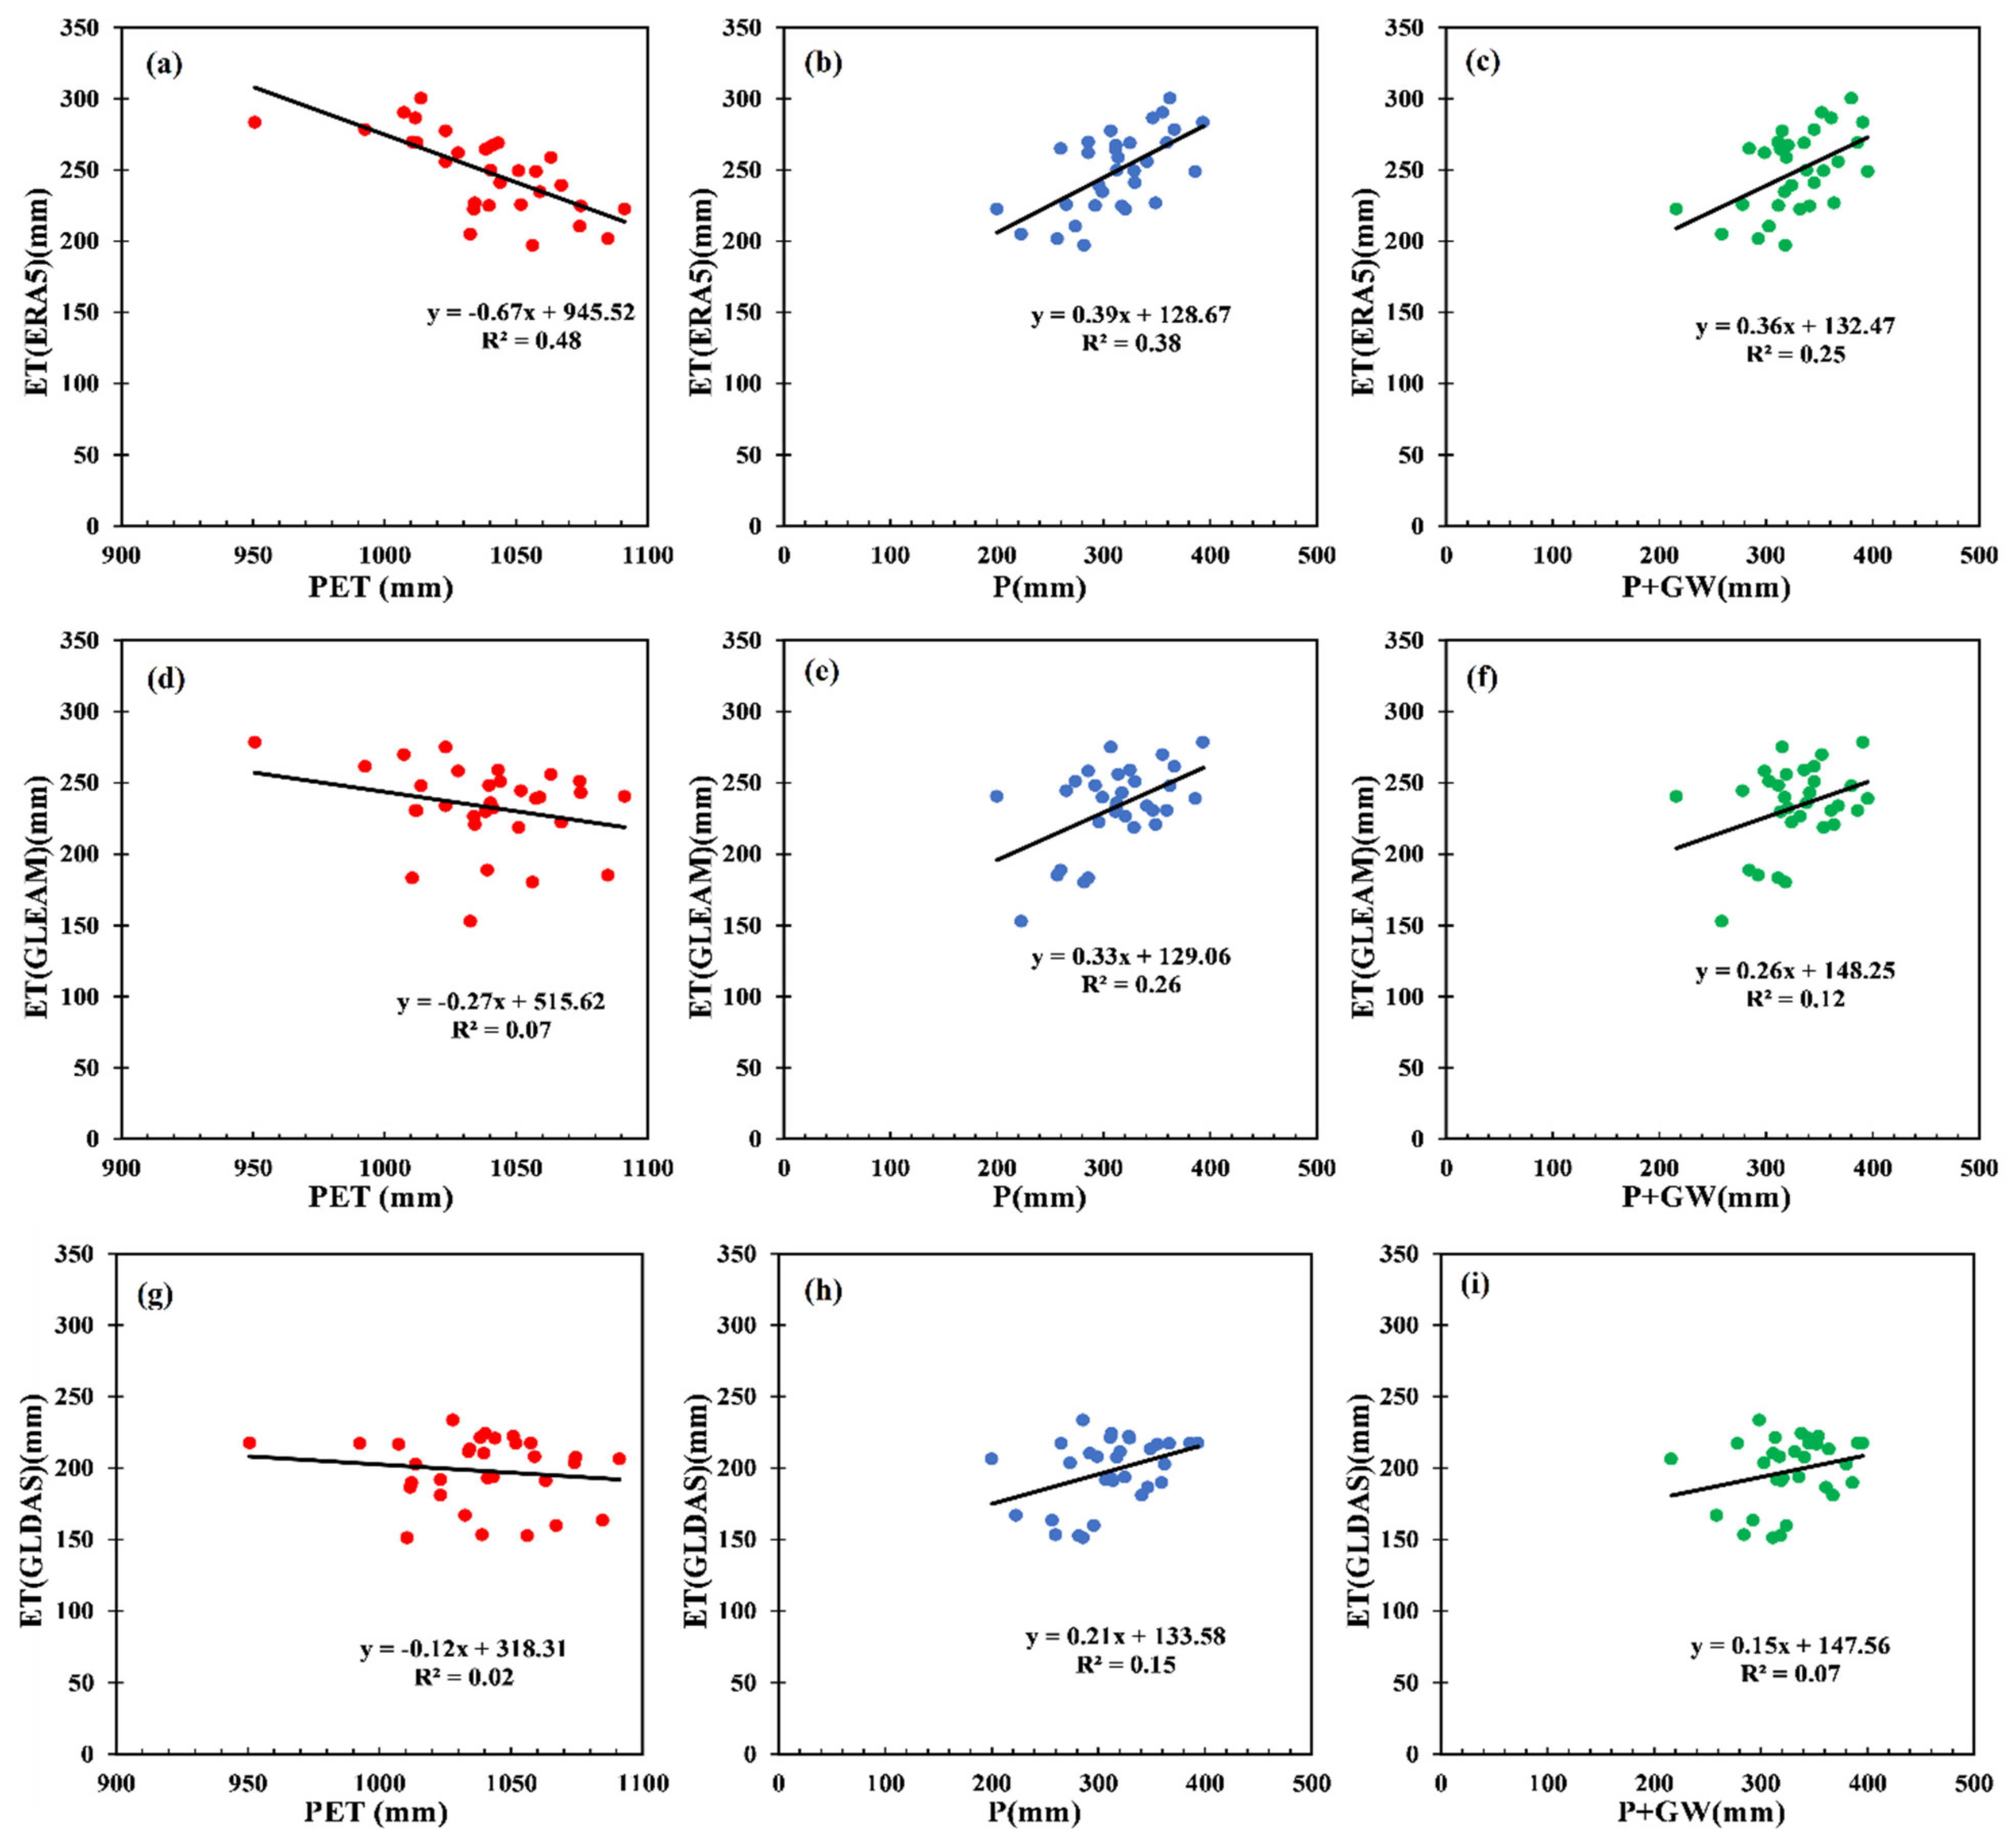
ET adjusted by available energy and water [2] to find the role of each controlling driver in estimation of ET in the different datasets (ERA5, GLEAM, and GLDAS). It is important to investigate the ET correlation with the forcing drivers as the ET is dominated by the combination of climate and water inputs due to human activities [58,59]. To do that, the co-variation of ETGLEAM, ETERA5, and ETGLDAS datasets with controlling drivers (available energy and water) is investigated and shown in Figure 5. This investigation helps to reveal each dataset’s limitations. To do this investigation, the PET is considered, as mentioned before, for available energy. For available water, first P (precipitation) and second the summation of precipitation and groundwater (P+GW) are considered, as groundwater is an important source of water in semi-arid/arid regions [6,8].
Figure 4a–c indicate the co-variation of ETERA5 with the PET, P and P+GW, respectively. The ETERA5 has higher co-variation with PET than P and P+GW. Conversely, the ETGLEAM shows lower co-variation with PET (R2 = 0.07) than P and P+GW, Figure 4d–f. The co-variation of ETGLEAM with P is 0.26, which decreases when considering GW as an additional water input flux (0.12) (Figure 5d–f). ETGLDAS has a low correlation with all drivers (Figure 5g–i) comparing with the two other ET datasets (ERA5 and GLEAM). The correlation of ETGLDAS with P is higher than other drivers, even than P+GW.
The ETGLEAM, ETERA5, and ETGLDAS have an inverse correlation with PET and a positive correlation with input water fluxes (P and P+GW). These correlations indicate that increasing PET causes a decrease in ET, since water limitation does not allow a higher energy level to be more effective in improving ET. These findings are in accordance with those from previous studies [58,60,61] that show the direct correlation between the ET and water input flux, meaning that ET starts to increase by increasing the available water. This confirms the available water as an effective factor in the ET across Iran. In addition, all ET datasets have higher correlation with P than P+GW, implying that all datasets used for estimation ET have lower consideration by groundwater changes (as depicted in Section 2.2.1). However, in semi-arid and arid regions groundwater are important sources of water and has a pivotal role in ET [8].
3.3. Comparison of ETERA5, ETGLEAM, and ETGLDAS with ETwb in Iran’s Basins
Values of ETwb are available for each Iran’s basins at an annual scale for the period 1986–2016 [6]. These values, as well as the annual average ETERA5, ETGLEAM, and ETGLDAS in the same period, aggregated per Iran’s basins, are shown in Figure 6. The ETwb indicates a broader range of long-term average values comparing with ETGLEAM, ETERA5, and ETGLDAS, although the minimum values of all three datasets are lower than ETwb, and the maximum values of ETwb are higher than the maximum values of the datasets.
Comparing the results of the three global datasets (Figure 6a–c), some similarities are apparent, e.g., high values in the northern basins (12, 14, and15) which have higher level of average precipitation with humid climate condition, especially for ERA5 and GLEAM, and lower values in central basins (46, 49, and 48) of Iran. These basins are located in arid climate condition. The ETGLEAM is the dataset that has a wider spatial distribution of the lowest range (ET < 150 mm/yr) of ET among all of the considered ET estimation datasets, and it includes ten basins in the center, east, and south-east of Iran (42,44,45,46,47,48,49,51,52,53).
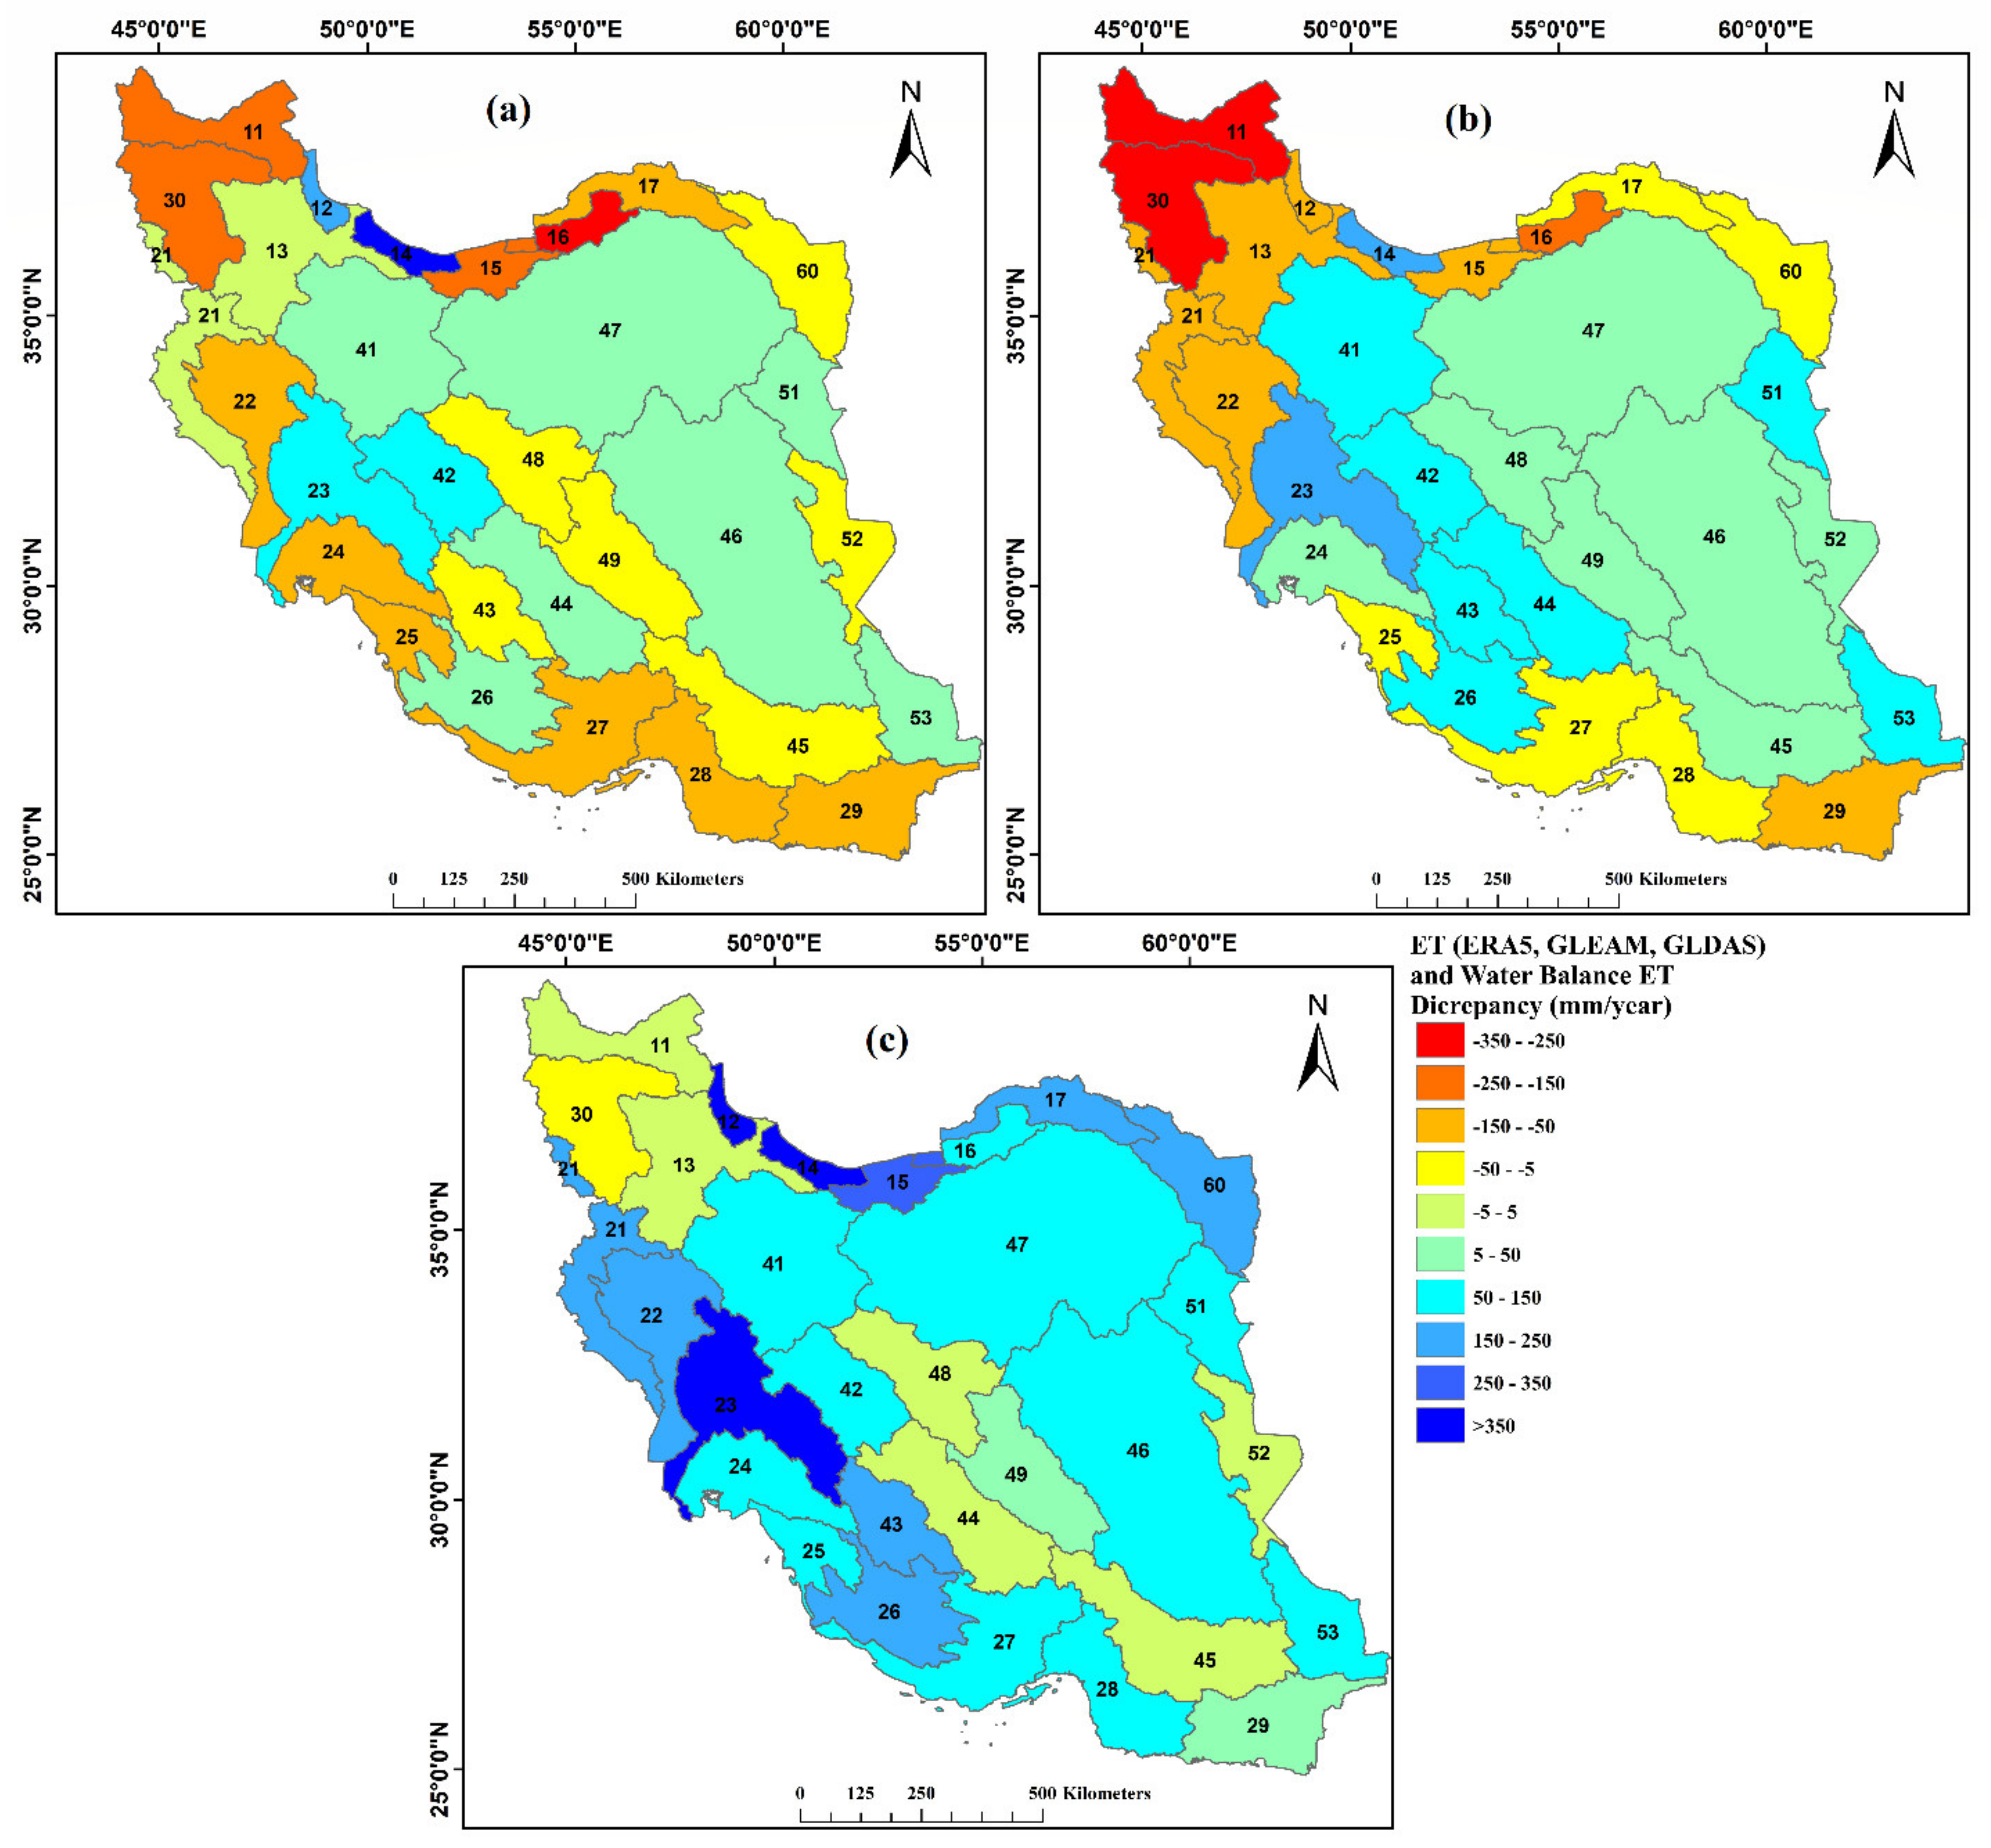
To estimate the discrepancies of ETERA5, ETGLEAM, and ETGLDAS with ETwb (ETwb as reference ET) at basin-scale, their differences in the long-term annual average are calculated as ETwb- ETERA5, ETwb- ETGLEAM, and ETwb- ETGLDAS (Figure 7). The discrepancies in the three datasets compared with ETwb do not seem to follow any particular spatial variation pattern. ETGLEAM and ETERA5 indicate similar discrepancies (without considering the value of differences and just considering the over/under estimation) in some basins (e.g., 14, 15, 47, 46, 23, 25, 27, 22, 28, 29), while in other basins (e.g., 12, 45, 43) their values are completely different and in contrast between datasets. In northern basins (12, 14, 15) and some southern basins (27, 28, 29), ETGLDAS indicates inverse values comparing with ETERA5 and ETGLEAM with similar estimation (over/under) comparing with reference ET.
The lowest discrepancy values are for ETERA5, in basins 13 and 21 (1 mm), whereas in ETGLDAS lowest discrepancies are recorded in basins 29 (1 mm), 49 (4 mm), and 24 (7 mm). Moreover, all central basins have a discrepancy range of ±50 mm for the three datasets. For ETERA5, basin 14 has the highest overestimation (379 mm) compared with ETwb. For ETGLEAM, basins 11 have the highest overestimation (350 mm), while ETGLDAS in basins 14 has the biggest overestimation (711 mm), compared with ETwb. All these basins which have highest over estimation of ET are located in northern part of Iran, with humid climate and high level of average precipitation (P > 600 mm/yr).
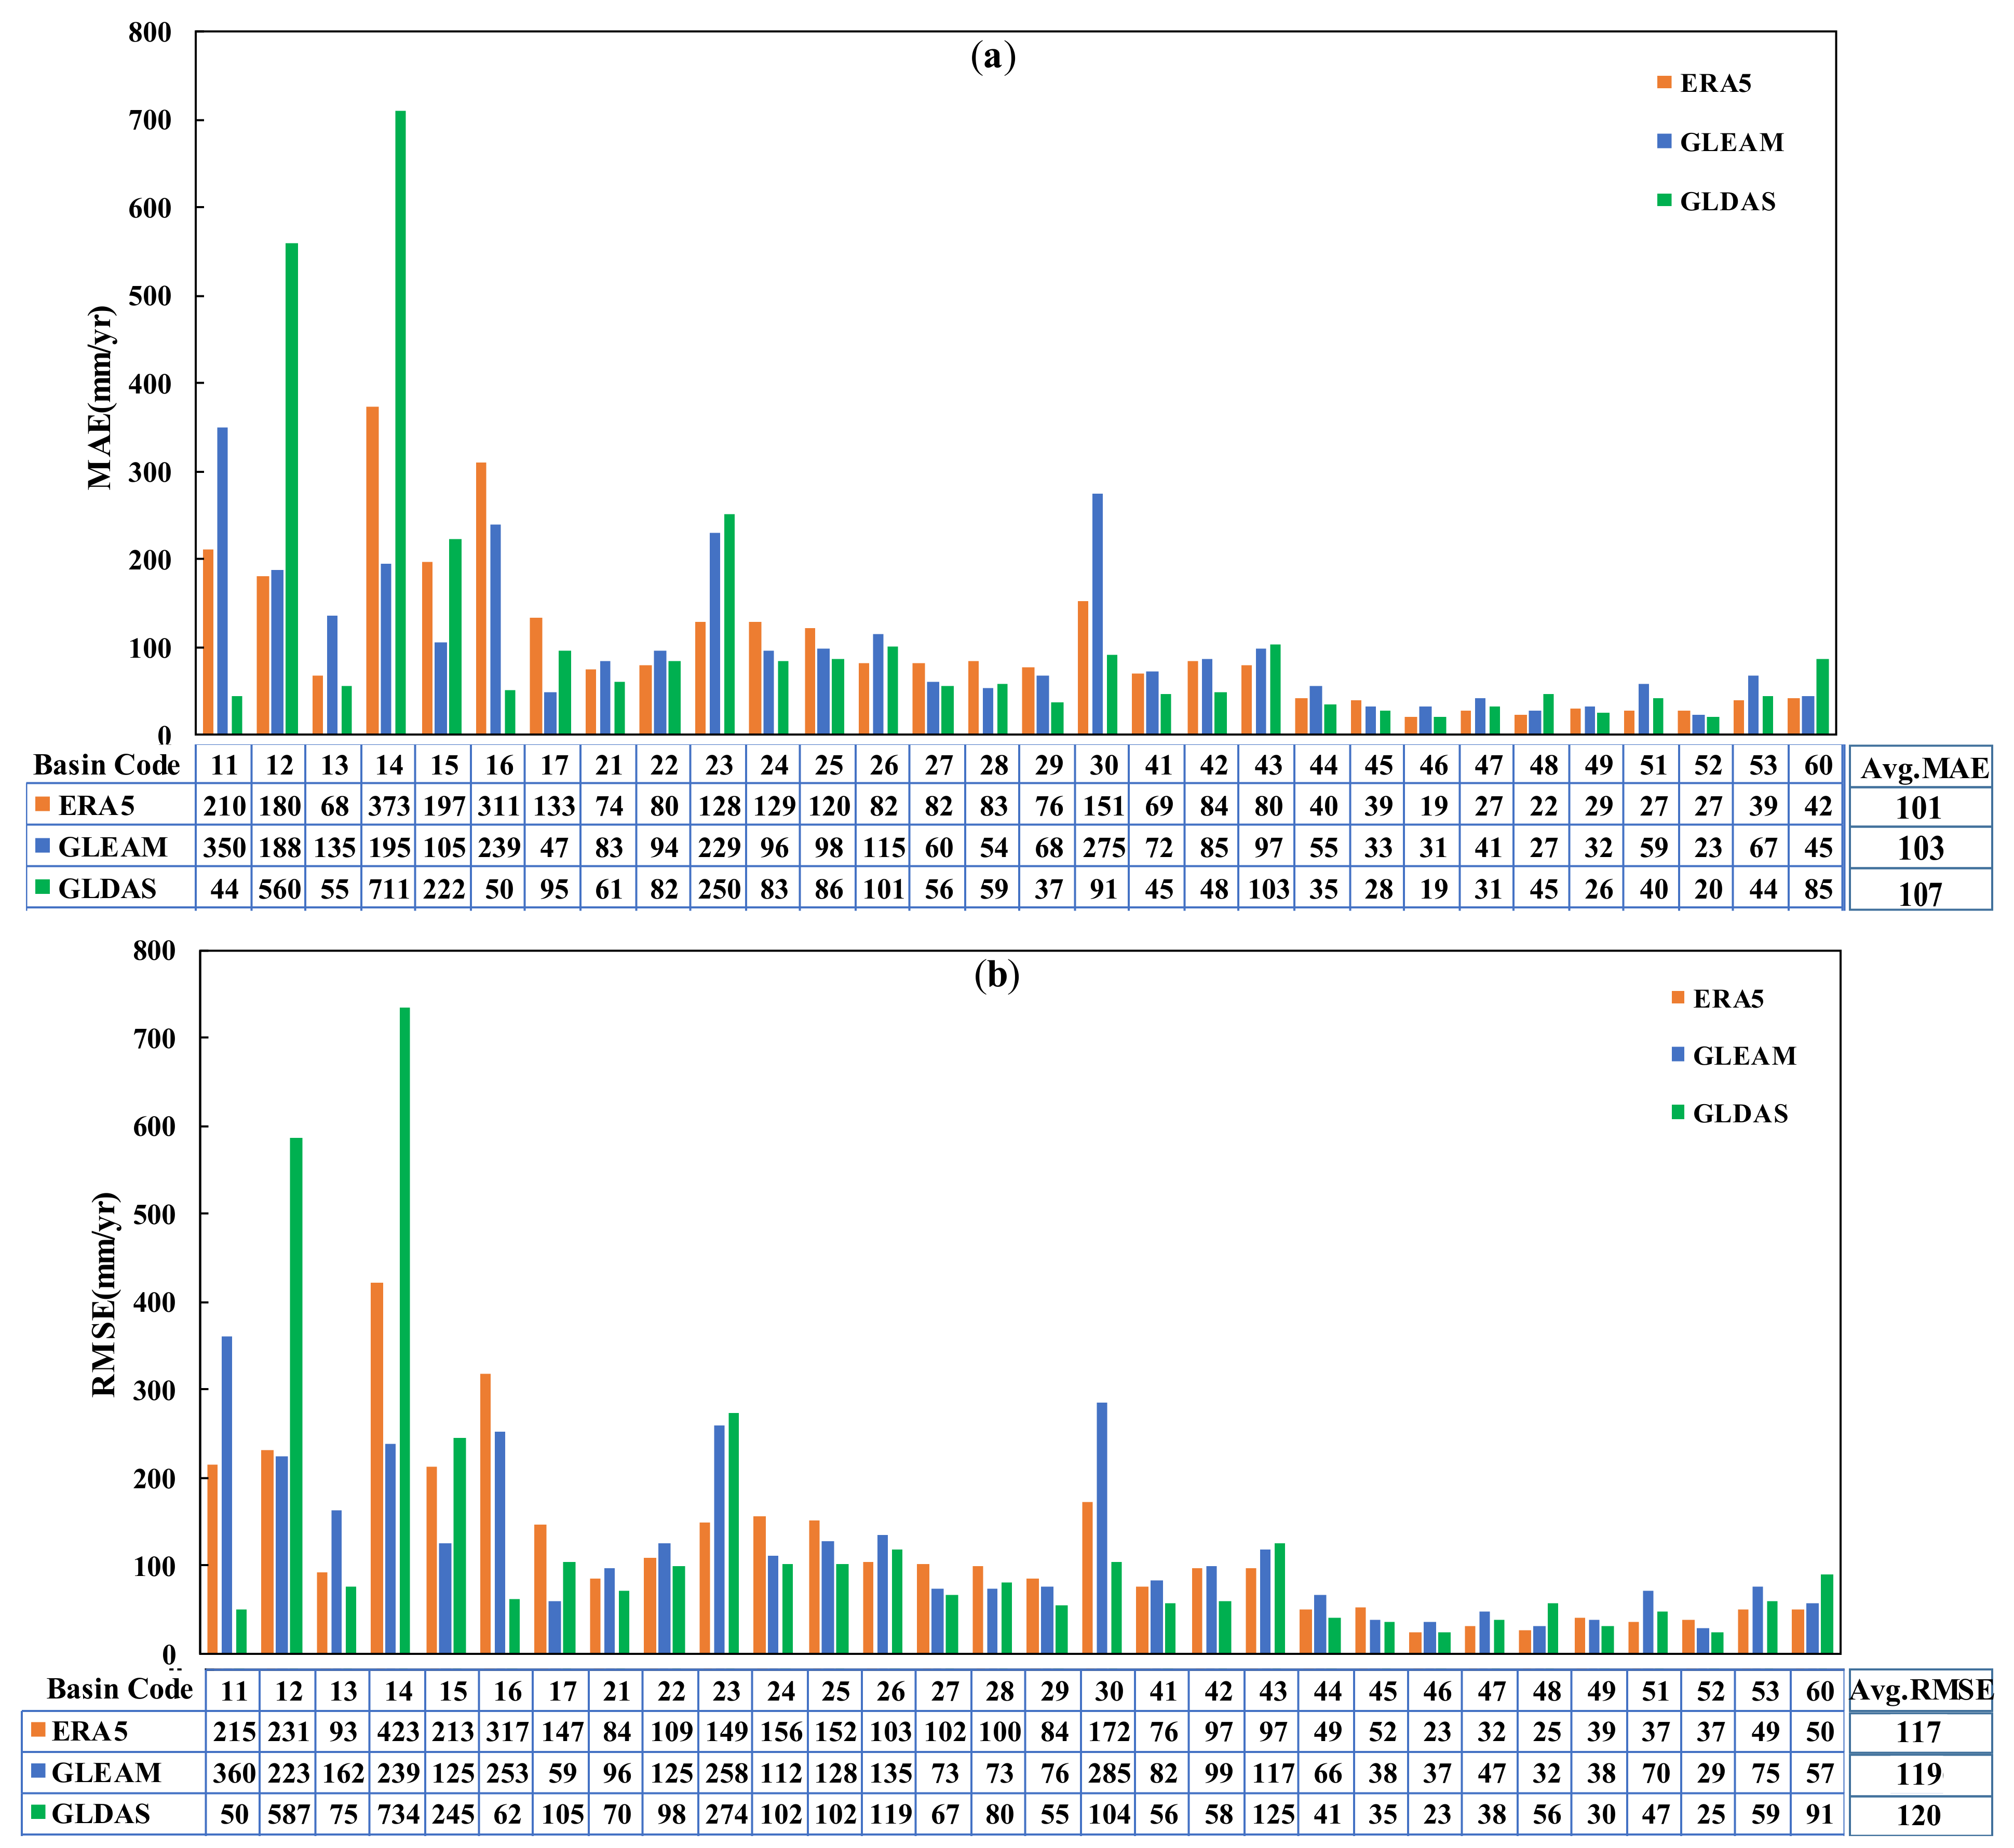
In addition to assessing the discrepancy in ET datasets, it is necessary to evaluate the error over the study period. The MAE and RMSE values of each basin dataset are displayed in Figure 8a,b, respectively. The lowest MAE with ETERA5 is recorded in basin 46 (19 mm/yr), while in the case of ETGLEAM, basin 52 has the lowest MAE (23 mm/yr), and the lowest MAE of ETGLDAS is for basin 46 (19 mm/yr). The highest MAE for ETERA5, and ETGLDAS are observed in basin 14 (373 mm/yr and 710 mm/yr, respectively), and basin 11 (350 mm/yr) for ETGLEAM dataset. The largest difference between MAE of ETGLEAM, ETERA5, and ETGLDAS is for basin 14, and the lowest is for basin 49. Generally, basins located in arid and semi-arid, central and eastern parts of Iran had lower MAE values, and basins located in humid northern parts had higher MAE (Figure 8).
The lowest RMSE of ETERA5 and ETGLDAS were found in basin 46 with values of 22.9, 23.3 mm/yr, respectively. The lowest RMSE of ETGLDAS happens in basin 52 (28 mm/yr). The highest RMSE of ETERA5 and ETGLDAS are determined in basin 14, while the highest RMSE for ETGLEAM is observed in basin 11 (Figure 8b). Basin 14 has the most significant difference in RMSE between ETGLEAM, ETERA5, and ETGLDAS, and basin 49 the least significant. Generally, basins located in arid and semi-arid central and eastern parts of Iran had lower MAE and RMSE, and basins located in humid northern parts had higher MAE and RMSE (Figure 8). Considering the average MAE and RMSE for each dataset (Figure 8) shows that ERA5 has a lower average error among the datasets studied.
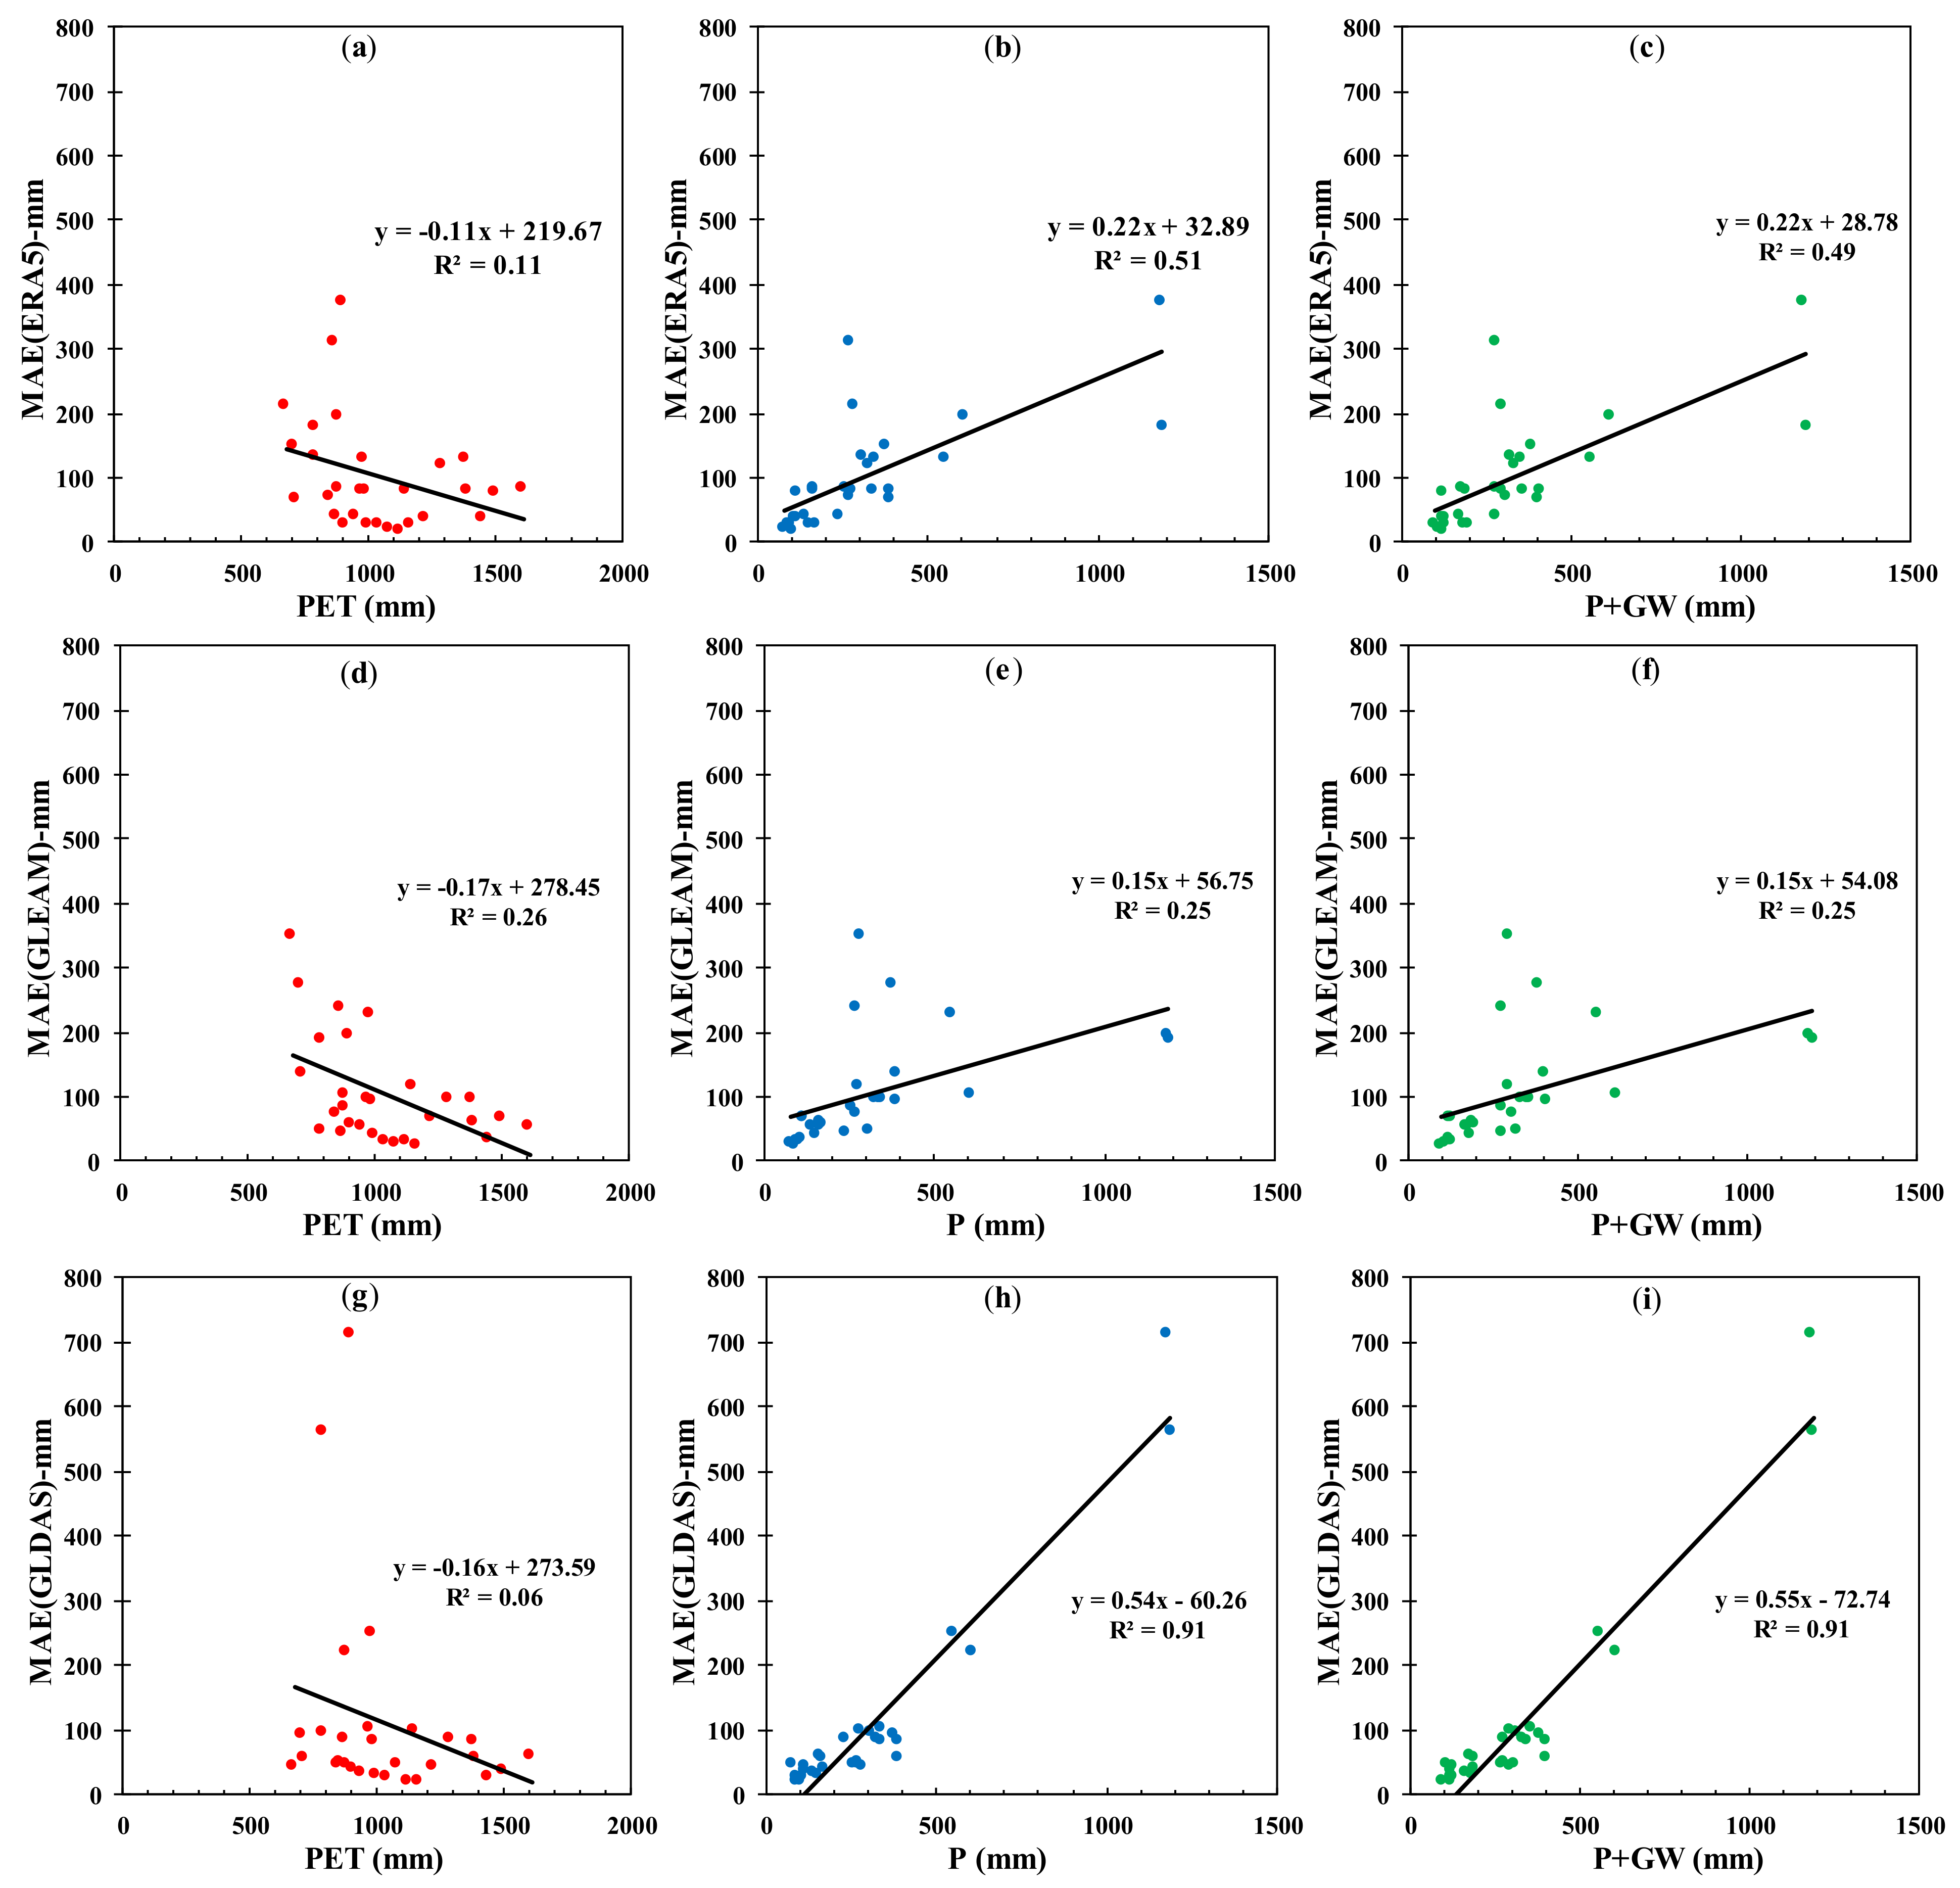
Errors deriving from the hydro-climate variables used by each dataset are estimated from the MAE for application of ETERA5, ETGLEAM, and ETGLDAS to Iran’s basins, and the RMSE correlation with the ET forcing drivers are presented in Figure S1 of Supplementary Materials. To determine the variables’ contribution, the co-variation of MAE with PET, P, and P+GW is calculated for the three global datasets (Figure 9). As mentioned before, GW is an important water source in semi-arid/arid regions such as in Iran and it cannot be assumed as zero due to relevant water withdrawals during recent decades [6,62,63].
The MAE, and RMSE of ETERA5 has an inverse correlation with PET and a positive correlation with P and P+GW (Figure 9a–c, Figure S1a–c). Co-variation of MAE (ETERA5) with P is greater than with other variables, and co-variation of MAE (ETERA5) with P and P+GW are greater than with PET (Figure 9b,c and same for RMSE co-variation (Figure S1a–c). This implies that most of the errors in ETERA5 derive from P values.
The MAE of ETGLEAM also shows an inverse correlation with PET and a positive correlation with P and P+GW (Figure 9d–f), the RMSE has same correlation (Supplementary Figure S1d–f). Co-variation of MAE, and RMSE (ETGLEAM) with PET is about twice greater than with other variables. The co-variation of P and P+GW are similar, although slightly higher for P. This indicates that most of the errors in ETGLEAM derive from PET, representing available energy. The MAE, and RMSE of ETGLDAS is low and inverse while it has a high and positive correlation with P and P+GW (Figure 9g–i, Supplementary Figure S1g–i). Co-variations of MAE and RMSE (ETGLDAS) with P and P+GW are the same, and they are greater than all co-variations investigated for ETERA5 and ETGLEAM (Figure 9, Supplementary Figure S1). Thus, the major error of ETGLDAS derives from P values (input water flux) like found by [18,64], confirming that the amount of precipitation and irrigation are effective factors in increasing the GLDAS discrepancies. Moreover, the differences between co-variation ETERA5, ETGLEAM, and ETGLDAS (Figure 9) with PET, P, and P+GW, considering both MAE and RMSE values (Figure 8) indicate the high level of energy (PET), and a lower amount of P as the causes for smaller discrepancies and errors in ET estimated values of all datasets, which confirms that errors and discrepancies are related to how driving forces of ET are taken into account [18]. Consequently, using these datasets for hyper-arid and arid basins in Iran gives a lower error than using them for humid or colder basins, agrees with the findings previous studies [33,65] that investigated ET over different (various) climate conditions in Africa. It is necessary to consider the basin’s characteristics once we want to select an ET dataset [5,66]. Most of Iran’s agricultural lands are located in the north, west, and south-west of Iran’s basins [67], which showed higher MAE and RMSE values than average. On the other hand, there is much less agricultural lands in the central and eastern basins of Iran. Thus, these small areas may have been neglected when the resolution of the data set is coarser, and this could be another reason for the lower values of MAE and RMSE in semi-arid and arid areas. Therefore, this suggests that human activities have a significant impact on ET which may not have been considered in various models.
4. Conclusions
This study examines the differences in the ERA5, GLEAM, and GLDAS gridded ET datasets over Iran and their spatiotemporal variations, and the accuracy of the datasets through comparison with reference ET (ETWB, derived from water balance method). The results show that these global datasets have similar temporal variability at the annual and seasonal scales, but their estimates of ET vary in spatial and temporal extents. GLEAM includes wider range of underestimation compared to the other two datasets (ERA5, GLDAS) and GLDAS has wider overestimation compared to GLEAM and ERA5. While the ERA5 has lower range of estimated ET values. In addition, the investigation of the correlation between estimated ET and forcing ET factors (PET, P, and P+GW) helps to understand the weakness points or strengths of each ET dataset for further improvements in their methods to obtain accurate values of ET. All three datasets indicated low correlation with storage change, which implies the weakness in estimating the ET over dry/semi dry regions, as water input flux is important in semi-arid and arid areas.
Each global model uses its own specific procedure and input data. Hence, it is necessary to evaluate their accuracy with the reference value of ET across Iran’s basins. GLDAS overestimates ET values compared to ETWB in almost all basins. In the central and eastern basins of Iran, ERA5 and GLEAM overestimated ET as well. Overall, based on MAE and RMSE performance criteria, all ET datasets capture lees error in dryer basins compared to basins with higher precipitation and a low level of available energy (PET). Thus, the datasets are more suitable for hyper-arid basins in Iran than for humid basins. In the three datasets, the groundwater level is not an effective driver of errors, although it is an essential variable in the water system, particularly in dry and semi-dry regions. The result of this study can be used for developing the considered datasets to improve their method and to increase their accuracy and get a better estimation of ET. In addition, the result is useful for other studies about water resources in Iran, epically on a basin scale, and to improve water management.
Supplementary Materials
The following are available online at https://www.mdpi.com/article/10.3390/rs13091816/s1, Figure S1: Co-variation of RMSE of (a–c) ETERA5, (d–f) ETGLEAM, and (g-if) ETGLDAS with (a,d,g) potential evapotranspiration (PET), (b,e,h) precipitation (P), and (c,f,i) P + groundwater (GW), Table S1: Long-term annual average values of hydro-climate variables in the main basins in Iran over the study period. PET = potential evapotranspiration, P = precipitation, over Iran’s basin (1986–2016).
Author Contributions
Conceptualization, D.M.P.; data curation, S.S.T.; formal analysis, D.M.P.; methodology, D.M.P.; software, S.S.T.; supervision, Z.K. and B.Z.; visualization, D.M.P. and S.S.T.; writing—original draft, D.M.P. and S.S.T.; writing—review & editing, Z.K., C.S.S.F., and B.Z. All authors have read and agreed to the published version of the manuscript.
Funding
This research received no external funding.
Conflicts of Interest
The authors declare no conflict of interest.
References
- Jaramillo, F.; Destouni, G. Developing water change spectra and distinguishing change drivers worldwide. Geophys. Res. Lett. 2014, 41, 8377–8386. [Google Scholar] [CrossRef]
- Destouni, G.; Jaramillo, F.; Prieto, C. Hydroclimatic shifts driven by human water use for food and energy production. Nat. Clim. Chang. 2013, 3, 213–217. [Google Scholar] [CrossRef]
- Jarsjo, J.; Asokan, S.M.; Prieto, C.; Bring, A.; Destouni, G. Hydrological responses to climate change conditioned by historic alterations of land-use and water-use. Hydrol. Earth Syst. Sci. 2012, 16, 1335. [Google Scholar] [CrossRef] [Green Version]
- Wang, D.; Hejazi, M. Quantifying the relative contribution of the climate and direct human impacts on mean annual streamflow in the contiguous United States. Water Resour. Res. 2011, 47. [Google Scholar] [CrossRef] [Green Version]
- Trambauer, P.; Dutra, E.; Maskey, S.; Werner, M.; Pappenberger, F.; Van Beek, L.P.H.; Uhlenbrook, S. Comparison of different evaporation estimates over the African continent. Hydrol. Earth Syst. Sci. 2014, 18, 193–212. [Google Scholar] [CrossRef] [Green Version]
- Panahi, D.M.; Kalantari, Z.; Ghajarnia, N.; Seifollahi-Aghmiuni, S.; Destouni, G. Variability and change in the hydro-climate and water resources of Iran over a recent 30-year period. Sci. Rep. 2020, 10, 1–9. [Google Scholar] [CrossRef]
- Bring, A.; Asokan, S.M.; Jaramillo, F.; Jarsjö, J.; Levi, L.; Pietroń, J.; Prieto, C.; Rogberg, P.; Destouni, G. Implications of freshwater flux data from the CMIP5 multimodel output across a set of Northern Hemisphere drainage basins. Earth’s Futur. 2015, 3, 206–217. [Google Scholar] [CrossRef]
- Istanbulluoglu, E.; Wang, T.; Wright, O.M.; Lenters, J.D. Interpretation of hydrologic trends from a water balance perspective: The role of groundwater storage in the Budyko hypothesis. Water Resour. Res. 2012, 48. [Google Scholar] [CrossRef] [Green Version]
- McCabe, M.F.; Miralles, D.G.; Holmes, T.R.; Fisher, J.B. Advances in the Remote Sensing of Terrestrial Evaporation. Remote. Sens. 2019, 11, 1138. [Google Scholar] [CrossRef] [PubMed] [Green Version]
- Moyano, M.C.; Garcia, M.; Palacios-Orueta, A.; Tornos, L.; Fisher, J.B.; Fernández, N.; Recuero, L.; Juana, L. Vegetation Water Use Based on a Thermal and Optical Remote Sensing Model in the Mediterranean Region of Doñana. Remote Sens. 2018, 10, 1105. [Google Scholar] [CrossRef] [Green Version]
- Talsma, C.J.; Good, S.P.; Jimenez, C.; Martens, B.; Fisher, J.B.; Miralles, D.G.; McCabe, M.F.; Purdy, A.J. Partitioning of evapotranspiration in remote sensing-based models. Agric. For. Meteorol. 2018, 260-261, 131–143. [Google Scholar] [CrossRef]
- Yilmaz, M.T.; Anderson, M.C.; Zaitchik, B.; Hain, C.R.; Crow, W.T.; Ozdogan, M.; Chun, J.A.; Evans, J.P. Comparison of prognostic and diagnostic surface flux modeling approaches over the Nile River basin. Water Resour. Res. 2014, 50, 386–408. [Google Scholar] [CrossRef]
- Dembélé, M.; Ceperley, N.; Zwart, S.J.; Salvadore, E.; Mariethoz, G.; Schaefli, B. Potential of satellite and reanalysis evaporation datasets for hydrological modelling under various model calibration strategies. Adv. Water Resour. 2020, 143, 103667. [Google Scholar] [CrossRef]
- Menzel, W.P.; Purdom, J.F. Introducing GOES-I: The first of a new generation of geostationary operational envi-ronmental satellites. Bull. Am. Meteorol. Soc. 1994, 75, 757–782. [Google Scholar] [CrossRef] [Green Version]
- Anderson, M.C.; Kustas, W.P.; Norman, J.M.; Hain, C.R.; Mecikalski, J.R.; Schultz, L.; González-Dugo, M.P.; Cammalleri, C.; D’Urso, G.; Pimstein, A.; et al. Mapping daily evapotranspiration at field to continental scales using geostationary and polar orbiting satellite imagery. Hydrol. Earth Syst. Sci. 2011, 15, 223–239. [Google Scholar] [CrossRef] [Green Version]
- Zhao, Y.; Lu, Z.; Wei, Y. An Assessment of Global Precipitation and Evapotranspiration Products for Regional Applications. Remote Sens. 2019, 11, 1077. [Google Scholar] [CrossRef] [Green Version]
- Bai, P.; Liu, X. Intercomparison and evaluation of three global high-resolution evapotranspiration products across China. J. Hydrol. 2018, 566, 743–755. [Google Scholar] [CrossRef]
- Khan, M.S.; Baik, J.; Choi, M. Inter-comparison of evapotranspiration datasets over heterogeneous landscapes across Australia. Adv. Space Res. 2020, 66, 533–545. [Google Scholar] [CrossRef]
- Srivastava, P.K.; Han, D.; Islam, T.; Petropoulos, G.P.; Gupta, M.; Dai, Q. Seasonal evaluation of evapotranspiration fluxes from MODIS satellite and mesoscale model downscaled global reanalysis datasets. Theor. Appl. Clim. 2015, 124, 461–473. [Google Scholar] [CrossRef]
- Zhao, J.; Chen, X.; Zhang, J.; Zhao, H.; Song, Y. Higher temporal evapotranspiration estimation with improved SEBS model from geostationary meteorological satellite data. Sci. Rep. 2019, 9, 1–15. [Google Scholar] [CrossRef] [PubMed] [Green Version]
- Long, D.; Longuevergne, L.; Scanlon, B.R. Uncertainty in evapotranspiration from land surface modeling, remote sensing, and GRACE satellites. Water Resour. Res. 2014, 50, 1131–1151. [Google Scholar] [CrossRef] [Green Version]
- Sörensson, A.A.; Ruscica, R.C. Intercomparison and Uncertainty Assessment of Nine Evapotranspiration Estimates Over South America. Water Resour. Res. 2018, 54, 2891–2908. [Google Scholar] [CrossRef] [Green Version]
- Allen, R.G.; Pereira, L.S.; Howell, T.A.; Jensen, M.E. Evapotranspiration information reporting: I. Factors governing measurement accuracy. Agric. Water Manag. 2011, 98, 899–920. [Google Scholar] [CrossRef] [Green Version]
- Tang, D.; Feng, Y.; Gong, D.; Hao, W.; Cui, N. Evaluation of artificial intelligence models for actual crop evapotranspiration modeling in mulched and non-mulched maize croplands. Comput. Electron. Agric. 2018, 152, 375–384. [Google Scholar] [CrossRef]
- Ma, N.; Szilagyi, J.; Zhang, Y.; Liu, W. Complementary-Relationship-Based Modeling of Terrestrial Evapotranspiration Across China During 1982–2012: Validations and Spatiotemporal Analyses. J. Geophys. Res. Atmos. 2019, 124, 4326–4351. [Google Scholar] [CrossRef]
- Abbaspour, K.C.; Faramarzi, M.; Ghasemi, S.S.; Yang, H. Assessing the impact of climate change on water resources in Iran. Water Resour. Res. 2009, 45. [Google Scholar] [CrossRef] [Green Version]
- Owen, C.R. Water budget and flow patterns in an urban wetland. J. Hydrol. 1995, 169, 171–187. [Google Scholar] [CrossRef]
- Fahle, M.; Dietrich, O. Estimation of evapotranspiration using diurnal groundwater level fluctuations: Comparison of different approaches with groundwater lysimeter data. Water Resour. Res. 2014, 50, 273–286. [Google Scholar] [CrossRef]
- Jamshidi, S.; Zand-Parsa, S.; Pakparvar, M.; Niyogi, D. Evaluation of Evapotranspiration over a Semiarid Region Using Multiresolution Data Sources. J. Hydrometeorol. 2019, 20, 947–964. [Google Scholar] [CrossRef]
- Javadian, M.; Behrangi, A.; Gholizadeh, M.; Tajrishy, M. METRIC and WaPOR Estimates of Evapotranspiration over the Lake Urmia Basin: Comparative Analysis and Composite Assessment. Water 2019, 11, 1647. [Google Scholar] [CrossRef] [Green Version]
- Ahmad, M.-U.-D.; Giordano, M. The Karkheh River basin: The food basket of Iran under pressure. Water Int. 2010, 35, 522–544. [Google Scholar] [CrossRef]
- Middleton, N.; Thomas, D. World Atlas of Desertification 2ED, 2nd ed.; United Nations Environment Programm: London, UK, 1997. [Google Scholar]
- Jung, H.C.; Getirana, A.; Arsenault, K.R.; Holmes, T.R.; McNally, A. Uncertainties in Evapotranspiration Estimates over West Africa. Remote Sens. 2019, 11, 892. [Google Scholar] [CrossRef] [Green Version]
- Bhattarai, N.; Mallick, K.; Stuart, J.; Vishwakarma, B.D.; Niraula, R.; Sen, S.; Jain, M. An automated multi-model evapotranspiration mapping framework using remotely sensed and reanalysis data. Remote Sens. Environ. 2019, 229, 69–92. [Google Scholar] [CrossRef]
- Martens, B.; Miralles, D.; Lievens, H.; Fernández-Prieto, D.; Verhoest, N.E. Improving terrestrial evaporation esti-mates over continental Australia through assimilation of SMOS soil moisture. Int. J. Applied Earth Obs. Vation Geoinf. 2016, 48, 146–162. [Google Scholar] [CrossRef]
- Pan, S.; Pan, N.; Tian, H.; Friedlingstein, P.; Sitch, S.; Shi, H.; Arora, V.K.; Haverd, V.; Jain, A.K.; Kato, E.; et al. Evaluation of global terrestrial evapotranspiration using state-of-the-art approaches in remote sensing, machine learning and land surface modeling. Hydrol. Earth Syst. Sci. 2020, 24, 1485–1509. [Google Scholar] [CrossRef] [Green Version]
- Anderson, M. A Two-Source Time-Integrated Model for Estimating Surface Fluxes Using Thermal Infrared Remote Sensing. Remote. Sens. Environ. 1997, 60, 195–216. [Google Scholar] [CrossRef]
- Anderson, M.C.; Norman, J.M.; Mecikalski, J.R.; Otkin, J.A.; Kustas, W.P. A climatological study of evapotranspiration and moisture stress across the continental United States based on thermal remote sensing: 1. Model formulation. J. Geophys. Res. Space Phys. 2007, 112. [Google Scholar] [CrossRef]
- Mu, Q.; Heinsch, F.A.; Zhao, M.; Running, S.W. Development of a global evapotranspiration algorithm based on MODIS and global meteorology data. Remote Sens. Environ. 2007, 111, 519–536. [Google Scholar] [CrossRef]
- Mu, Q.; Zhao, M.; Running, S.W. Improvements to a MODIS global terrestrial evapotranspiration algorithm. Remote Sens. Environ. 2011, 115, 1781–1800. [Google Scholar] [CrossRef]
- Ghilain, N.; Arboleda, A.; Barrios, J.M.; Gellens-Meulenberghs, F. Water interception by canopies for remote sensing based evapotranspiration models. Int. J. Remote Sens. 2019, 41, 2934–2945. [Google Scholar] [CrossRef]
- Wang, G.; Pan, J.; Shen, C.; Li, S.; Lu, J.; Lou, D.; Hagan, D.F.T. Evaluation of Evapotranspiration Estimates in the Yellow River Basin against the Water Balance Method. Water 2018, 10, 1884. [Google Scholar] [CrossRef] [Green Version]
- Martens, B.; Gonzalez Miralles, D.; Lievens, H.; Van Der Schalie, R.; De Jeu, R.A.M.; Fernández-Prieto, D.; Beck, H.E.; Dorigo, W.A.; Verhoest, N. GLEAM v3: Satellite-based land evaporation and root-zone soil moisture. Geosci. Model Dev. 2017, 10, 1903–1925. [Google Scholar] [CrossRef] [Green Version]
- Priestley, C.H.B.; Taylor, R.J. On the assessment of surface heat flux and evaporation using large-scale param-eters. Mon. Weather. Rev. 1972, 100, 81–92. [Google Scholar] [CrossRef]
- Gash, J.H.C. An analytical model of rainfall interception by forests. Q. J. R. Meteorol. Soc. 1979, 105, 43–55. [Google Scholar] [CrossRef]
- Gonzalez Miralles, D.; Holmes, T.R.H.; De Jeu, R.A.M.; Gash, J.H.; Meesters, A.G.C.A.; Dolman, A.J. Global land-surface evaporation estimated from satellite-based observations. Hydrol. Earth Syst. Sci. 2011, 15, 453–469. [Google Scholar] [CrossRef] [Green Version]
- Available online: https://www.gleam.eu (accessed on 6 July 2020).
- Hersbach, H.; Bell, B.; Berrisford, P.; Hirahara, S.; Horányi, A.; Muñoz-Sabater, J.; Nicolas, J.; Peubey, C.; Radu, R.; Schepers, D.; et al. The ERA5 global reanalysis. Q. J. R. Meteorol. Soc. 2020, 146, 1999–2049. [Google Scholar] [CrossRef]
- Kumar, S.; Peters-Lidard, C.; Tian, Y.; Houser, P.; Geiger, J.; Olden, S.; Lighty, L.; Eastman, J.; Doty, B.; Dirmeyer, P. Land information system: An interoperable framework for high resolution land surface modeling. Environ. Model. Softw. 2006, 21, 1402–1415. [Google Scholar] [CrossRef]
- Rodell, M.; Houser, P.R.; Jambor, U.; Gottschalck, J.; Mitchell, K.; Meng, C.-J.; Arsenault, K.; Cosgrove, B.; Radakovich, J.; Bosilovich, M.; et al. The Global Land Data Assimilation System. Bull. Am. Meteorol. Soc. 2004, 85, 381–394. [Google Scholar] [CrossRef] [Green Version]
- Dee, D.P.; Uppala, S.M.; Simmons, A.J.; Berrisford, P.; Poli, P.; Kobayashi, S.; Andrae, U.; Balmaseda, M.A.; Balsamo, G.; Bauer, P.; et al. The ERA-Interim reanalysis: Configuration and performance of the data assimilation system. Q. J. R. Meteorol. Soc. 2011, 137, 553–597. [Google Scholar] [CrossRef]
- Iran’s Meteorological Organization. Available online: http://www.irimo.ir (accessed on 10 April 2020).
- Iran’s Ministry of Energy (IME). Iran’s Annually Bolton of Water. (in Persian). Available online: http://waterplan.moe.gov.ir/ (accessed on 5 April 2020).
- Arora, V.K. The use of the aridity index to assess climate change effect on annual runoff. J. Hydrol. 2002, 265, 164–177. [Google Scholar] [CrossRef]
- Ghose, D.; Das, U.; Roy, P. Modeling response of runoff and evapotranspiration for predicting water table depth in arid region using dynamic recurrent neural network. Groundw. Sustain. Dev. 2018, 6, 263–269. [Google Scholar] [CrossRef]
- He, X.; Luo, J.; Zuo, G.; Xie, J. Daily Runoff Forecasting Using a Hybrid Model Based on Variational Mode Decomposition and Deep Neural Networks. Water Resour. Manag. 2019, 33, 1571–1590. [Google Scholar] [CrossRef]
- Hu, C.; Wu, Q.; Li, H.; Jian, S.; Li, N.; Lou, Z. Deep Learning with a Long Short-Term Memory Networks Approach for Rainfall-Runoff Simulation. Water 2018, 10, 1543. [Google Scholar] [CrossRef] [Green Version]
- Chen, H.; Huo, Z.; Dai, X.; Ma, S.; Xu, X.; Huang, G. Impact of agricultural water-saving practices on regional evapotranspiration: The role of groundwater in sustainable agriculture in arid and semi-arid areas. Agric. For. Meteorol. 2018, 263, 156–168. [Google Scholar] [CrossRef]
- Tran, A.P.; Rungee, J.; Faybishenko, B.; Dafflon, B.; Hubbard, S.S. Assessment of Spatiotemporal Variability of Evapotranspiration and Its Governing Factors in a Mountainous Watershed. Water 2019, 11, 243. [Google Scholar] [CrossRef] [Green Version]
- Gao, X.; Bai, Y.; Huo, Z.; Xu, X.; Huang, G.; Xia, Y.; Steenhuis, T.S. Deficit irrigation enhances contribution of shallow groundwater to crop water consumption in arid area. Agric. Water Manag. 2017, 185, 116–125. [Google Scholar] [CrossRef]
- Gao, X.; Huo, Z.; Qu, Z.; Xu, X.; Huang, G.; Steenhuis, T.S. Modeling contribution of shallow groundwater to evapotranspiration and yield of maize in an arid area. Sci. Rep. 2017, 7, 1–13. [Google Scholar] [CrossRef] [Green Version]
- Karandish, F. Socioeconomic benefits of conserving Iran’s water resources through modifying agricultural practices and water management strategies. Ambio 2021, 1–17. [Google Scholar] [CrossRef]
- Madani, K. Water management in Iran: What is causing the looming crisis? J. Environ. Stud. Sci. 2014, 4, 315–328. [Google Scholar] [CrossRef]
- Zohaib, M.; Choi, M. Satellite-based global-scale irrigation water use and its contemporary trends. Sci. Total Environ. 2020, 714, 136719. [Google Scholar] [CrossRef]
- Yang, J.; Wang, W.; Hua, T.; Peng, M. Spatiotemporal variation of actual evapotranspiration and its response to changes of major meteorological factors over China using multi-source data. J. Water Clim. Chang. 2021, 12, 325–338. [Google Scholar] [CrossRef]
- Weerasinghe, I.; Bastiaanssen, W.; Mul, M.; Jia, L.; Griensven, A.V. Can we trust remote sensing evapotranspiration products over Africa? Hydrol. Earth Syst. Sci. 2020, 24, 1565–1586. [Google Scholar] [CrossRef] [Green Version]
- Mirzaei, A.; Saghafian, B.; Mirchi, A.; Madani, K. The Groundwater‒Energy‒Food Nexus in Iran’s Agricultural Sector: Implications for Water Security. Water 2019, 11, 1835. [Google Scholar] [CrossRef] [Green Version]
Figure 1.
(a) A: Digital elevation model (DEM) of Iran, location of its 30 main basins and spatial distribution of synoptic stations, (b) climate classification of Iran based on aridity values (UNEP, 1997), and (c) mean monthly precipitation (P) and mean potential evapotranspiration (PET) in Iran (1986–2020).

Figure 2.
Long term annual average (1980–2018) evapotranspiration (ET; mm/yr) and the long-term annual average difference between datasets over Iran according to (a) the average of ETERA5, (b) ETERA5-ETGLDAS, (c) the average of ETGLEAM, (d) ETERA5-ETGLDAS, (e) the average of ETGLDAS, and (f) ETGLEAM-ETGLDAS.

Figure 3.
Long term (1980–2018) monthly average, maximum and minimum values of evapotranspiration (ET, mm) and monthly average, maximum and minimum difference between datasets over Iran according to (a) the ETERA5 dataset, (b) ETERA5–ETGLEAM, (c) the ETGLEAM dataset, (d) ETERA5–ETGLDAS, (e) the ETGLDAS dataset, and (f) ETGLEAM–ETGLDAS.

Figure 4.
Seasonal comparison of ETGLEAM, ETERA5, and ETGLDAS in Iran between 1980 and 2018. (a) Box plot of seasonal ET values based on ERA5, GLDAS, GLEAM datasets, including average (black point), median (black line), standard deviation (black box), and range of values (green dashed box), and average seasonal differences between (b) ETGLEAM and ETERA5, (c) ETGLEAM and ETGLDAS, and (d) ETERA5 and ETGLDAS.

Figure 5.
Correlation of annual evapotranspiration (ET) according to the ERA5 (a,b,c), GLEAM datasets (d,e,f), and, GLDAS datasets (g,h,i) with potential evapotranspiration (PET) (a,c,g), precipitation (P) (b,d,h), P + groundwater (GW) (c,f,i) over 1986–2016.
Figure 5.
Correlation of annual evapotranspiration (ET) according to the ERA5 (a,b,c), GLEAM datasets (d,e,f), and, GLDAS datasets (g,h,i) with potential evapotranspiration (PET) (a,c,g), precipitation (P) (b,d,h), P + groundwater (GW) (c,f,i) over 1986–2016.

Figure 6.
Long-term annual average evapotranspiration (ET, mm) in Iran’s basins during the period 1986–2016, according to (a) ERA5, (b) GLEAM, (c) GLDAS, and (d) Water Balance (WB).
Figure 6.
Long-term annual average evapotranspiration (ET, mm) in Iran’s basins during the period 1986–2016, according to (a) ERA5, (b) GLEAM, (c) GLDAS, and (d) Water Balance (WB).

Figure 7.
Spatial Discrepancy of annual average evapotranspiration (ET, mm) across the Iran’s 30 basins in the period 1980–2016 between different datasets and the reference values. (a) ETwb-ETERA5, (b) ETwb-ETGLEAM, and (c) ETwb-ETGLDAS.
Figure 7.
Spatial Discrepancy of annual average evapotranspiration (ET, mm) across the Iran’s 30 basins in the period 1980–2016 between different datasets and the reference values. (a) ETwb-ETERA5, (b) ETwb-ETGLEAM, and (c) ETwb-ETGLDAS.

Figure 8.
Error estimation of annual average ETERA5, ETGLEAM, and ETGLDAS comparing with ETWB. (a) Mean Absolute Error (MAE), and (b) Root Mean Square Error (RMSE).
Figure 8.
Error estimation of annual average ETERA5, ETGLEAM, and ETGLDAS comparing with ETWB. (a) Mean Absolute Error (MAE), and (b) Root Mean Square Error (RMSE).

Figure 9.
Co-variation of mean absolute error (MAE) of (a,b,c) ETERA5, (d,e,f) ETGLEAM, and (g,h,i) ETGLDAS with (a,d,g) potential evapotranspiration (PET), (b,e,h) precipitation (P), and (c,f,i) P + groundwater (GW).
Figure 9.
Co-variation of mean absolute error (MAE) of (a,b,c) ETERA5, (d,e,f) ETGLEAM, and (g,h,i) ETGLDAS with (a,d,g) potential evapotranspiration (PET), (b,e,h) precipitation (P), and (c,f,i) P + groundwater (GW).

Publisher’s Note: MDPI stays neutral with regard to jurisdictional claims in published maps and institutional affiliations. |
© 2021 by the authors. Licensee MDPI, Basel, Switzerland. This article is an open access article distributed under the terms and conditions of the Creative Commons Attribution (CC BY) license (https://creativecommons.org/licenses/by/4.0/).
Share and Cite
MDPI and ACS Style
Moshir Panahi, D.; Sadeghi Tabas, S.; Kalantari, Z.; Ferreira, C.S.S.; Zahabiyoun, B. Spatio-Temporal Assessment of Global Gridded Evapotranspiration Datasets across Iran. Remote Sens. 2021, 13, 1816. https://doi.org/10.3390/rs13091816
AMA Style
Moshir Panahi D, Sadeghi Tabas S, Kalantari Z, Ferreira CSS, Zahabiyoun B. Spatio-Temporal Assessment of Global Gridded Evapotranspiration Datasets across Iran. Remote Sensing. 2021; 13(9):1816. https://doi.org/10.3390/rs13091816
Chicago/Turabian StyleMoshir Panahi, Davood, Sadegh Sadeghi Tabas, Zahra Kalantari, Carla Sofia Santos Ferreira, and Bagher Zahabiyoun. 2021. "Spatio-Temporal Assessment of Global Gridded Evapotranspiration Datasets across Iran" Remote Sensing 13, no. 9: 1816. https://doi.org/10.3390/rs13091816
Note that from the first issue of 2016, this journal uses article numbers instead of page numbers. See further details here.