Article

Effects of Operating Parameters on the Froth and Collection Zone Recovery in Flotation: An Industrial Case Study in a 10 m3 Cell

1
Faculty of Mining & Metallurgical Engineering, Yazd University, Yazd 98195, Iran
2
Iranian Mines & Mining Industries Development & Recovery Organization (IMIDRO), Tehran 15816, Iran
3
Process Optimisation for Future, Adelaide 5000, Australia
*
Author to whom correspondence should be addressed.
Minerals 2021, 11(5), 494; https://doi.org/10.3390/min11050494
Submission received: 14 March 2021 / Revised: 27 April 2021 / Accepted: 4 May 2021 / Published: 7 May 2021
(This article belongs to the Section Mineral Processing and Extractive Metallurgy)

Abstract

:
The effects of flotation operation parameters, including froth depth, air flowrate, and frother dosage, on the froth and collection zone recovery and the flowrate of particles into the froth phase were investigated in a 10 m3 industrial cell. The results showed that froth recovery increases upon increasing air flowrate and frother dosage, as well as reducing froth depth. While all tested parameters affected the particles that entered into the froth phase, air flowrate and frother dosage showed the most and least significance, respectively. When the air flowrate, frother dosage, and froth depth were 146 m3/h, 150 mL/min, and 5 cm, respectively, froth recovery was found to be above 84%. Also, the effect of the parameters studied on collection zone recovery was different from their effect on the froth zone, with air flowrate having the greatest impact on the former.

1. Introduction

The froth phase plays an important role in the recovery of minerals and the production of concentrates in the flotation process. The flotation zone includes two parts of collection (pulp) and froth zone, and the performance of each section can be considered separately [1,2]. The collision between the particle and bubble occurs in the collection zone; particles attach to the air bubbles and move towards the froth zone. In the froth zone, some of the materials are returned back to the pulp, resulting in a reduction in the total recovery. Accordingly, the froth recovery model can be represented as Figure 1:
Equation (1) shows the relationship between the total flotation recovery (RG), froth recovery (Rf), and collection zone recovery (Rc) [2]:
R G = R c R f 1 R c ( 1 R f )
Froth recovery can be measured either directly or indirectly. In direct methods, froth recovery is calculated by measuring the bubble loading [3]. Direct methods have been used by various researchers [4,5,6,7]. Indirect methods include froth depth changes and overall flotation recovery [8], mass balance [9,10], and mathematical models [11,12,13]. For example, froth recovery can be obtained from the maximum froth depth changes due to the constant kinetics variations at different depths [1,10,14]. Also, recently, Amelunxen [15] presented a relationship for calculating froth recovery based on water recovery at a laboratory scale, assuming that there is no reattachment of the particle to the bubble. Froth recovery can be also obtained based on froth stability [13].
Froth instability can be considered as the main cause of low froth recovery, especially in the scavenger cells where froth is composed of minerals with low hydrophobicity [16]. Therefore, froth recovery can affect the overall flotation performance. Determining froth recovery is empirically associated with many problems and errors. In the first few centimeters of the froth zone, many particles fall off and return back to the collection zone. As a consequence of changes in the environment from pulp to froth (and increasing the bubble density), a rapid drop in the bubble velocity occurs.
It is evident that froth recovery is affected by froth stability. One of the most important factors affecting froth stability is the presence of hydrophobic particles (i.e., the amount and properties of the particles) [17]. Froth stability increases by reducing the particle size and increasing the particle hydrophobicity (to some extent). Park et al. [18] reported that particles with around a 70° contact angle led to the most stable froth. This phenomenon has been also observed by other researchers [19]. The dosage and type of frother also affects froth recovery; for example, in a research on copper ore at laboratory scale, it was found that increasing the solid content, the grade of chalcopyrite mineral, and the frother dosage, all resulted in an increase in the froth stability [16]. Increasing the concentration of ions in the solution can cause particles to accumulate, and thus froth stability changes [20]. Air recovery and superficial gas velocity have a direct relationship with the froth stability [21]. In excess of the air flowrate, air recovery decreases [22]. Also, increasing the froth residence time can reduce froth recovery [10].
As shown above, previously conducted work in the areas of collection and froth zone recovery are mainly limited to small laboratory scales (except a few examples as cited above). Therefore, the aim of this study is to examine the effect of operating parameters on the froth and collection zone recovery at the industrial scale. The work was conducted in a 10 m3 cell, and the parameters studied were froth depth, air flowrate, and frother dosage (as the main operation parameters).

2. Materials and Methods

All tests were conducted in a 10 m3 flotation cell of a processing plant (rotation 243 rpm, motor power 22 kW, and cell diameter and height 2.5 and 3.2 m, respectively). Potassium amyl xanthate (PAX) and methyl isobutyl carbinol (MIBC) were used as a collector and frother, respectively. The collector dosage was 60 g/t, and it was kept constant for all tests, while the frother dosage varied between 70 and 150 mL/min.

2.1. Test Conditions

The air flowrate, froth depth, and frother dosage were adjusted using an air adjustment valve, a level gauge, and a flowmeter, respectively. It is acknowledged that there are other parameters (e.g., turbulence and collector and frother type) that can affect the flotation process, and those parameters should be also systematically investigated.
A two-level factorial design [23,24] was applied to study the effect of flotation parameters (froth depth, frother dosage, and air flowrate) on the flowrate of the mineral particles to the froth phase, froth recovery, and collection zone recovery. Results reveal the significance of each factor, as well as any possible interactions between them. The conditions of the flotation feed for each test are given in Table 1. The minimum and maximum froth depth, air flowrate, and frother dosage were chosen as 5 and 30 cm, 45 and 146 m3/h, and 70 and 150 mL/min, respectively, based on the plant operation parameters and practical limitations. The Jg values corresponding to the minimum and maximum air flowrate values were 0.25 and 0.83 cm/s, respectively.

2.2. Feed Characterisation

The feed used in this study was an iron ore concentrate mainly containing magnetite and hematite. Other minerals as identified by the mineralogy tests were pyrite, talc, quartz, apatite, and calcite. The chemical analysis of the feed showed 65.75% Fe, 24.1% FeO, and 1.1% S as the main elements (these data are the average of 10 tests as shown in Table 1). Particle size analysis showed that 80% of the particles were less than 100 μm.

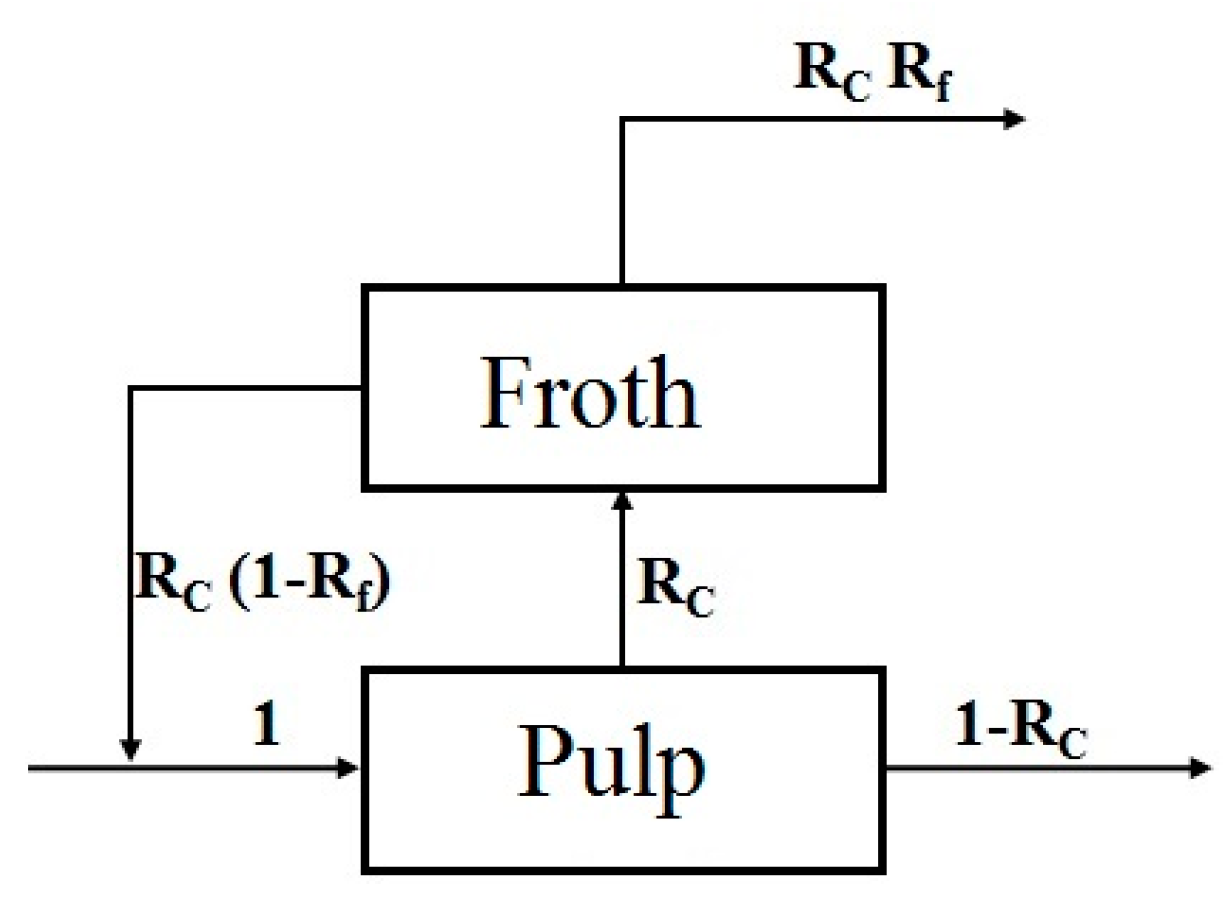
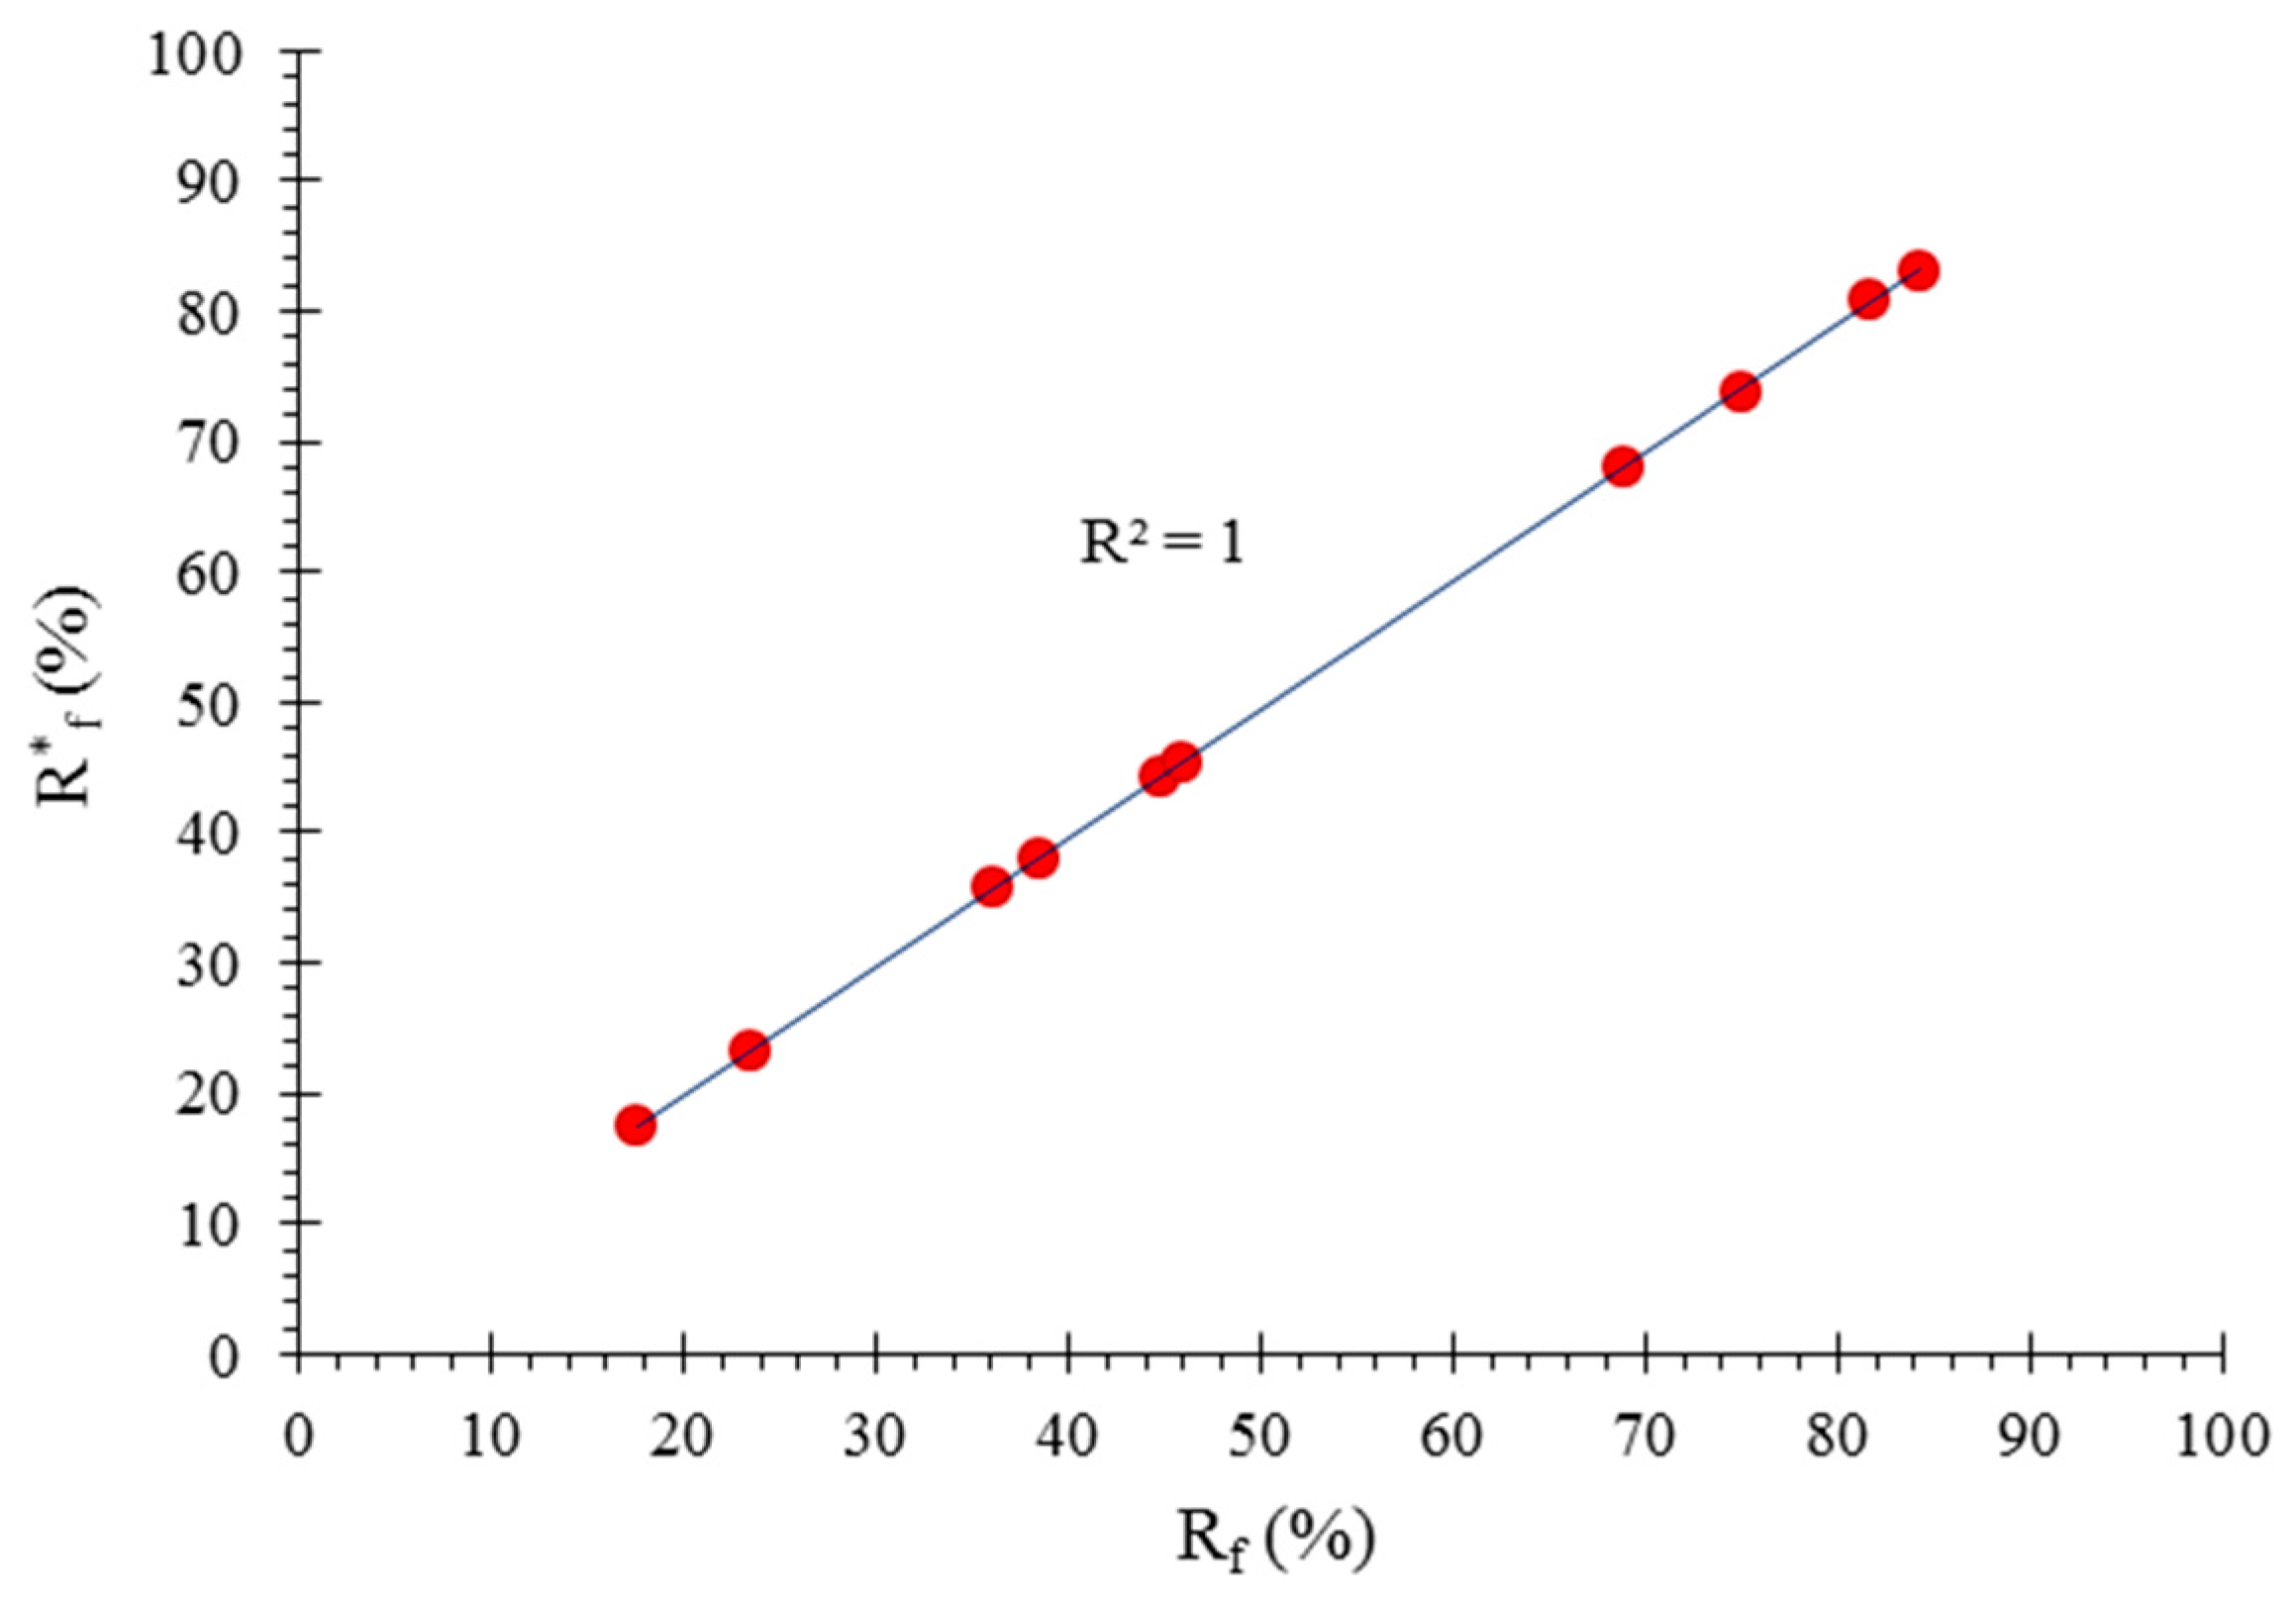
2.3. Froth Recovery Measurements

Froth recovery was calculated using a bubble loading method by a special device as previously explained by the authors [25]. This device is similar to that used by Yianatos et al. [2]. The tank was initially filled with water, and the nozzle was placed about 10 cm below the froth–pulp intersection. After a certain time, the air volume and particle mass inside the tank were measured.
Froth recovery (Rf) is defined as the ratio of mass flowrate of the valuable minerals recovered into the concentrate (by true flotation) (MC) to the mass flowrate of minerals entering the froth phase (as particle–bubble aggregate) across the pulp/froth interface (MB) [2] (Equation (2)). Mc is calculated using Equation (3):
Rf = MC/MB
MC = CXC − EREfXE
where C is the mass flowrate of the concentrate, XC is the grade of the minerals in the concentrate, REf is the froth recovery due to the entrainment, E is the mass of entrained particles across the pulp–froth interface, and XE is the grade of entrained minerals reported to the concentrate.
According to Yianatos et al. [2,11], the amount of entrained valuable minerals is negligible compared to the amount of minerals carried by true flotation, and the grade of the latter is much higher. By inserting the mass transfer rate to the froth phase in Equation (3), froth recovery is equal to
Rf = CXC/(BXB)
where B is the rate of the mass transfer of particles to the froth phase (t/h) and is calculated using Equation (5):
B = λBQg
where Qg is the air flowrate (m3/h), and λB is the bubble load (g/cm3). It is supposed that the grades of the particles at the top of the froth (Xtop) and the tail (XT) represent the grade of attached particles to the bubbles and entrained particles, respectively. M*C (the mass flowrate of valuable minerals recovered into the concentrate by true flotation) can be calculated using Equation (6):
M*C = (XC − XT)C Xtop/(Xtop − XT)
Therefore, froth recovery when entrained valuable particles are present (R*f) is calculated using Equation (7):
R*f = M*C/(BXB)

3. Results and Discussion

The results of the designed experiments as well as other characteristics of the concentrate are presented in Table 1. The froth depth and frother dosage have the maximum and minimum effects on froth recovery, respectively. Air flowrate and frother dosage have a positive effect, while froth height has a negative effect, which is due to the froth residence time, the presence of solid particles in the froth phase, and the froth stability. The interactions between these parameters have a negligible effect on the froth recovery. In addition, all measured parameters have a positive effect on the flowrate of minerals into the froth phase. The effect of the interaction between the froth depth and air flowrate (Bc) is significant, resulting in increasing flowrate of the particles to the froth phase. Also, froth recovery data (Rf and R*f) obtained from both Equation (4) and Equation (7) are overlapping, suggesting that entrainment has a negligible effect on the froth recovery in the current case (Figure 2). This is similar to what previously reported by Yianato et al. [2]. However, many researchers have shown that entrainment can affect froth recovery [26].

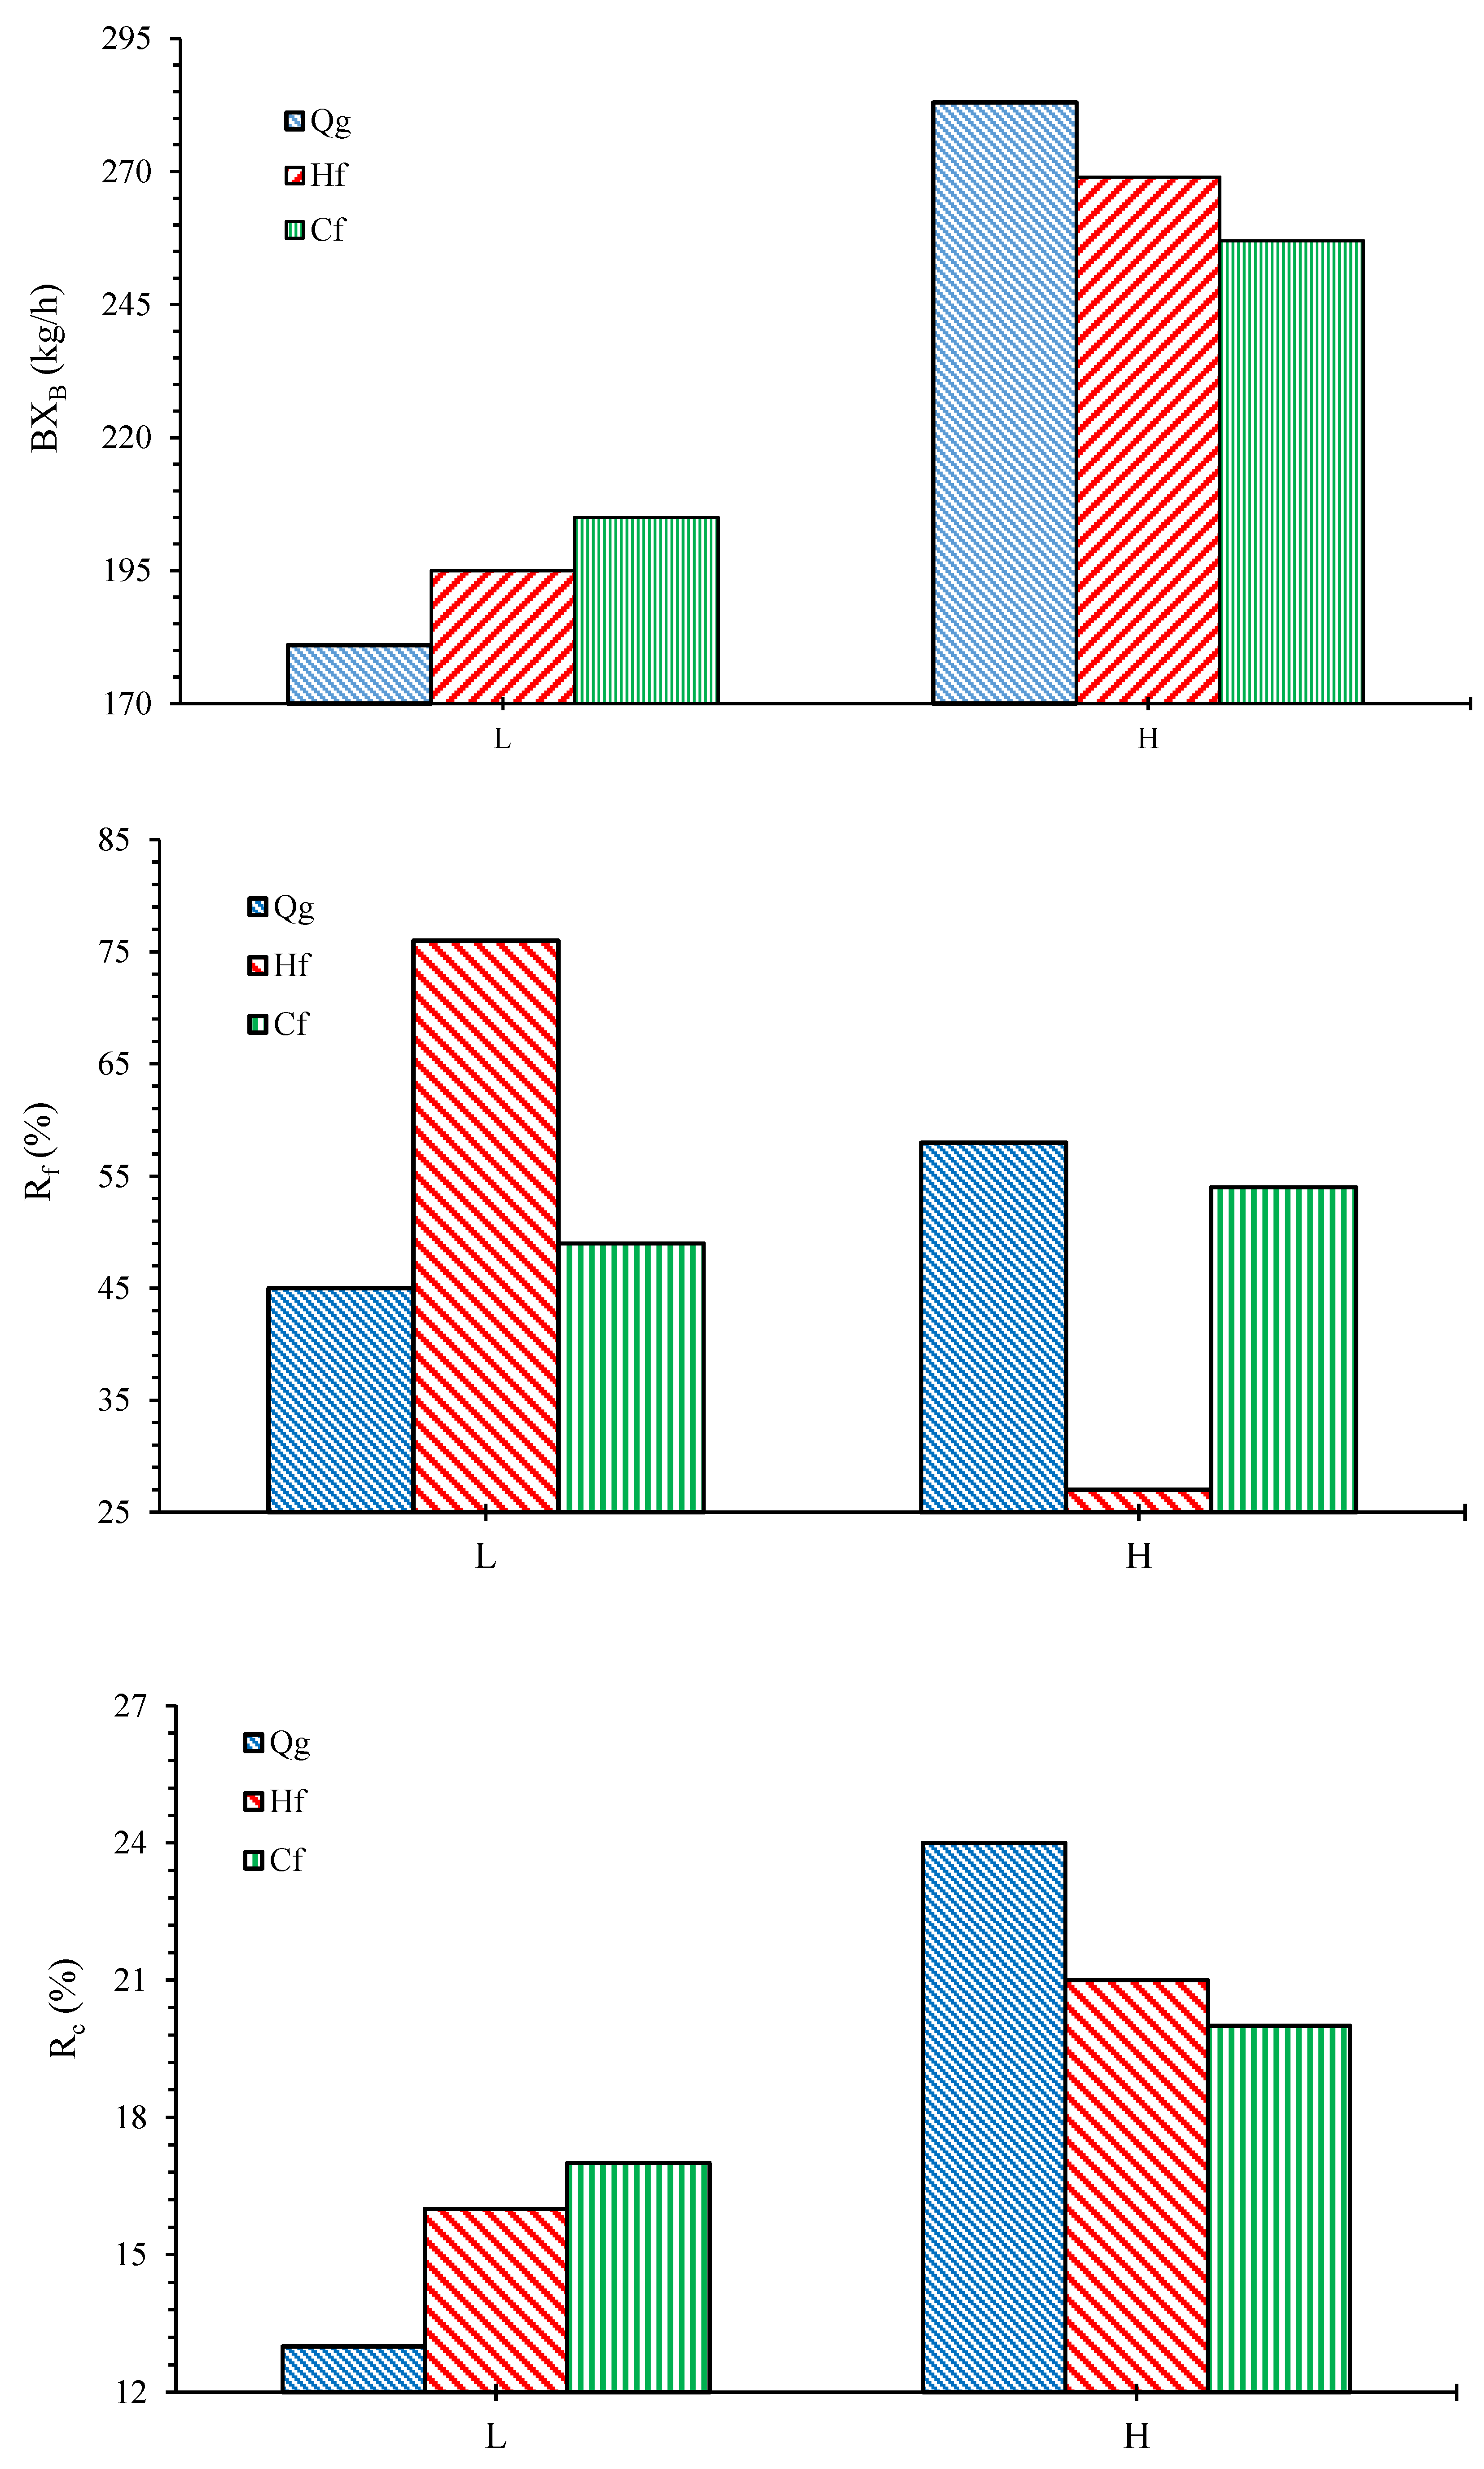
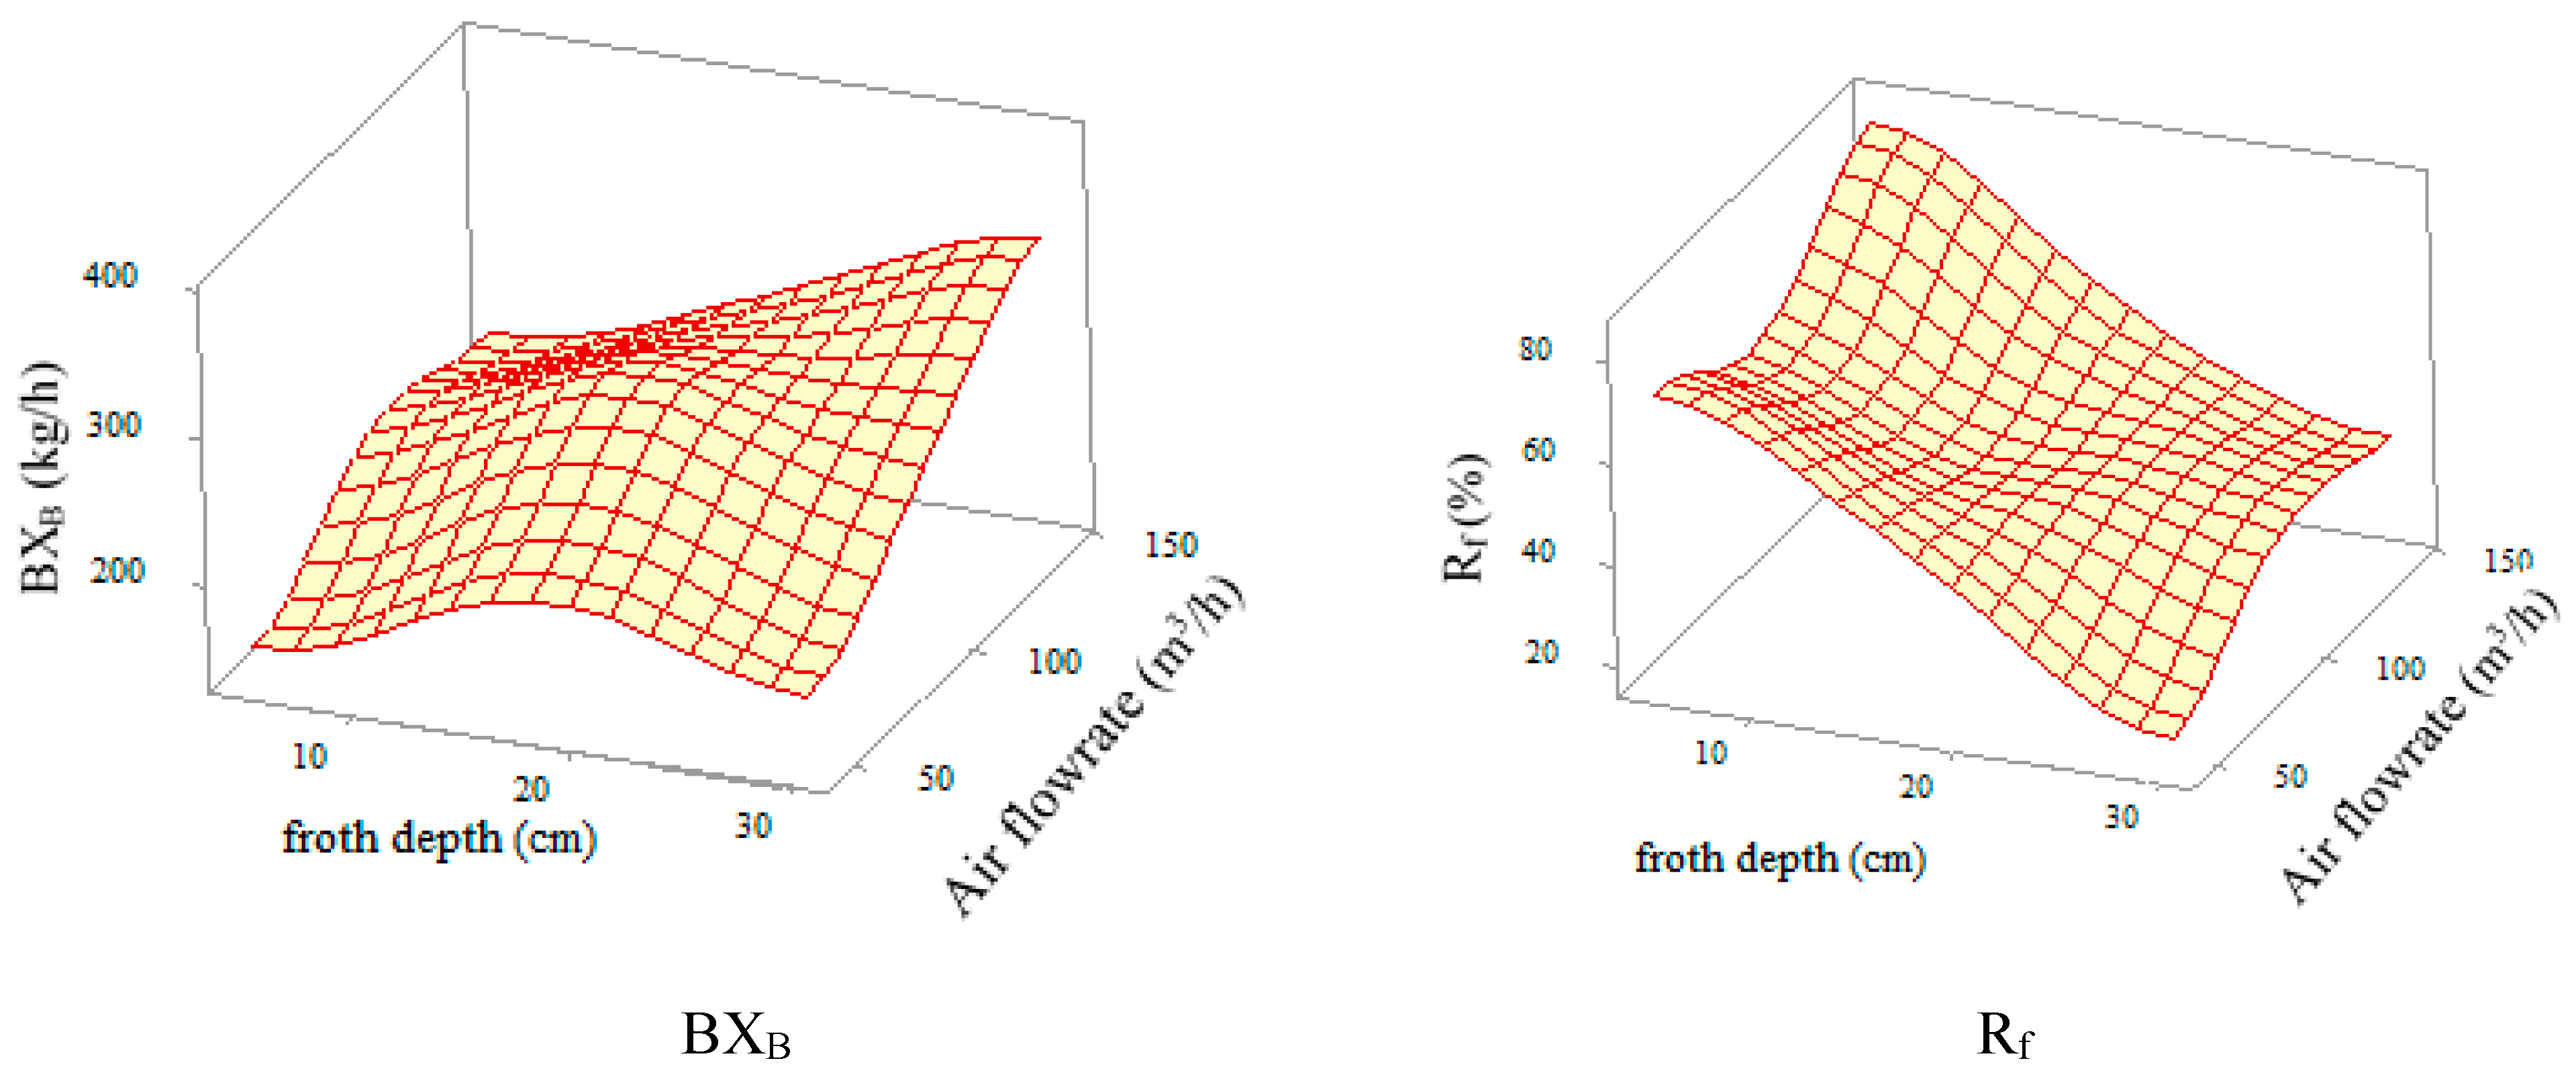
3.1. Mass Flowrate of the Minerals to the Froth Phase

The effective parameters on the mass flowrate of minerals entering the froth phase were statistically analyzed (Table 2). While all tested parameters affected the entered particles into the froth phase, air flowrate and frother dosage show the most and least significance, respectively (Figure 3). It was found that the number of attached particles to the bubbles, and thus, the amount of particles entering into the froth phase increases by increasing the air flowrate.

3.2. Froth Recovery

It can be said with 95% confidence that all examined parameters affect the froth recovery (Table 2). However, froth depth and frother dosage have the most and the least effect, respectively (Figure 3). Froth recovery decreases by increasing the froth depth. The change in the air recovery is what determines the change in the metallurgical recovery, and a decrease in the air flowrate can thus lead to higher air recoveries and higher metallurgical recoveries [27]. While froth stability is an important parameter in determining froth recovery [28], it is beyond the scope of the current study. It is worth mentioning that Mesa et al. [29] have recently shown the reduction in the bubble size in a flotation system and, consequently, improvement in the flotation performance by affecting the froth stability.

3.3. Collection Zone Recovery

Air flowrate and frother dosage show a great influence on the number of particles entering the froth phase (Table 2). It is noteworthy that the effect of the studied parameters on the collection zone recovery was different from their effect on the froth zone, and air flowrate had the greatest impact on the former (Figure 3). While the collection zone rate constant shows a strong dependency on the air flowrate, the interaction of parameters on the collection zone recovery was found to be nonsignificant. An increase in the froth recovery is associated with a decrease in the concentrate grade. However, as froth recovery increases, flotation recovery also increases. It should be noted that these results are only valid for the cell where the current tests were conducted (and within the tested range).
The response surface plots for the froth recovery and flowrate of the mineral into the froth phase are presented in Figure 4. It shows that the maximum and minimum flowrate of the minerals into the froth phase (BXB) occur when the air flowrate and froth depth are at their highest and lowest levels, respectively. The rate of drop back of the particles increases with increasing the froth depth. Therefore, when the number of bubbles increases with increasing the air flowrate, it is more likely that the separated particles reattach to the air bubbles and enter the froth phase. The same argument can be made for the minimum BXB. The highest froth recovery occurs when the froth depth and the air flowrate are at their minimum and maximum possible values, respectively. At the opposite point—i.e., when the froth depth is at its maximum and the air flowrate is at its minimum—the lowest froth recovery occurs (Figure 4). It should be noted that the effect of increasing the air flowrate to prevent the reduction of froth recovery at a higher froth depth is more obvious because increasing the air flowrate results in increasing the presence of bubbles in the froth zone. Therefore, those particles that have been separated from the bubble due to increasing the froth residence time (as a result of increasing the froth depth) may reattach to the bubbles and enter the concentrate zone, causing the froth recovery to increase. The interaction for collection zone recovery was found to be nonsignificant in this analysis.

4. Conclusions

The effect of froth depth, air flowrate, and frother dosage on the froth and zone recoveries and flowrate of the minerals to the froth was investigated in an industrial cell. When froth depth increased from 5 to 30 cm, froth recovery considerably reduced (as one may expect). On the other hand, air flowrate showed the greatest impact on the collection zone recovery. When air flowrate increased from 45 to 146 m3/h, collection zone recovery increased by 71%. The air flowrate compared to froth depth and frother dosage had the greatest effect on the number of particles transported to the froth zone. For example, when air flowrate increased by three times, the number of particles transported to the froth zone increased by only 1.5 times (at its maximum level). This study also showed that due to a large difference between the grade of particles transported by true flotation and entrainment, the effect of the latter on the froth recovery is negligible. While in the current study the number of parameters was chosen based on the available resources, testing a greater number of parameters is suggested for future work.

Author Contributions

Conceptualization M.O., S.F., Investigation, M.O.; Methodology, M.O., S.F.; Project administration, K.G.; Supervision, K.G., A.D. and S.F.; Writing—original draft, M.O.; Writing—review & editing, S.F. All authors have read and agreed to the published version of the manuscript.

Funding

This research received no external funding.

Acknowledgments

The authors gratefully acknowledge the R&D division of Golgohar Mining & Industrial Co and Iran Mineral Processing Research Center (especially Vafaei Fard and Farahani) for their help during this project.

Conflicts of Interest

The authors declare no conflict of interest.

References

  1. Vera, M.; Mathe, Z.; Franzidis, J.-P.; Harris, M.; Manlapig, E.; O’Connor, C. The modelling of froth zone recovery in batch and continuously operated laboratory flotation cells. Int. J. Miner. Process. 2002, 64, 135–151. [Google Scholar] [CrossRef]
  2. Yianatos, J.; Moys, M.; Contreras, F.; Villanueva, A. Froth recovery of industrial flotation cells. Miner. Eng. 2008, 21, 817–825. [Google Scholar] [CrossRef]
  3. Bhondayi, C.; Moys, M. Determination of sampling pipe (riser) diameter for a flotation bubble load measuring device. Miner. Eng. 2011, 24, 1664–1676. [Google Scholar] [CrossRef]
  4. Falutsu, M.; Dobby, G. Froth performance in commercial sized flotation columns. Miner. Eng. 1992, 5, 1207–1223. [Google Scholar] [CrossRef]
  5. Seaman, D.R.; Franzidis, J.P.; Manlapig, E.V. Bubble load measurement in the pulp zone of industrial flotation machines-a new device for determining the froth recovery of attached particles. Int. J. Miner. Process. 2004, 74, 1–13. [Google Scholar] [CrossRef]
  6. Dyer, C. An investigation into the Properties of the Froth Phase in the Flotation Process. Master’s Thesis, University of Witwatersrand, Johannesburg, South Africa, 1995. [Google Scholar]
  7. Rahman, R.M.; Ata, S.; Jameson, G.J. Froth recovery measurements in an industrial flotation cell. Miner. Eng. 2013, 53, 193–202. [Google Scholar] [CrossRef]
  8. Vera, M.; Franzidis, J.; Manlapig, E. Simultaneous determination of collection zone rate constant and froth zone recovery in a mechanical flotation environment. Miner. Eng. 1999, 12, 1163–1176. [Google Scholar] [CrossRef]
  9. Savassi, O.N.; Alexander, D.J.; Johnson, N.W.; Manlapig, E.V.; Franzidis, J.P. Measurement of froth recovery of attached particles in industrial cells. In Proceedings of the Sixth Mill Operators Conference, Melbourne, Australia, 6–8 October 1997. [Google Scholar]
  10. Alexander, D.; Franzidis, J.; Manlapig, E. Froth recovery measurement in plant scale flotation cells. Miner. Eng. 2003, 16, 1197–1203. [Google Scholar] [CrossRef]
  11. Yianatos, J.; Bergh, L.; Cortés, G. Froth zone modelling of an industrial flotation column. Miner. Eng. 1998, 11, 423–435. [Google Scholar] [CrossRef]
  12. Neethling, S. Simple approximations for estimating froth recovery. Int. J. Miner. Process. 2008, 89, 44–52. [Google Scholar] [CrossRef]
  13. Ostadrahimi, M.; Farrokhpay, S.; Gharibi, K.; Dehghani, A.; Aghajanloo, M. Effects of flotation operational parameters on froth stability and froth recovery. J. S. Afr. Inst. Min. Met. 2021, 121, 11–20. [Google Scholar] [CrossRef]
  14. Seaman, D.; Manlapig, E.; Franzidis, J.-P. Selective transport of attached particles across the pulp–froth interface. Miner. Eng. 2006, 19, 841–851. [Google Scholar] [CrossRef]
  15. Amelunxen, P.; Ladouceur, R.; Amelunxen, R.; Young, C. A phenomenological model of entrainment and froth recovery for interpreting laboratory flotation kinetics tests. Miner. Eng. 2018, 125, 60–65. [Google Scholar] [CrossRef]
  16. Farrokhpay, S. The significance of froth stability in mineral flotation—A review. Adv. Colloid Interface Sci. 2011, 166, 1–7. [Google Scholar] [CrossRef] [PubMed]
  17. Ata, S. Phenomena in the froth phase of flotation—A review. Int. J. Miner. Process. 2012, 102–103, 1–12. [Google Scholar] [CrossRef]
  18. Park, S.; Huang, K.; Yoon, R.-H. Predicting bubble coarsening in flotation froth: Effect of contact angle and particle size. Miner. Eng. 2018, 127, 256–264. [Google Scholar] [CrossRef]
  19. Pugh, R. Foaming, foam films, antifoaming and defoaming. Adv. Colloid Interface Sci. 1996, 64, 67–142. [Google Scholar] [CrossRef]
  20. Farrokhpay, S.; Zanin, M. An investigation into the effect of water quality on froth stability. Adv. Powder Technol. 2012, 23, 493–497. [Google Scholar] [CrossRef]
  21. Xuan, Q.; Wang, L.; Nguyen, V. Correlation of air recovery with froth stability and separation efficiency in coal flotation. Miner. Eng. 2013, 41, 25–30. [Google Scholar]
  22. Gorain, B.; Oravainen, H.; Allenius, H.; Peaker, R.; Weber, A.; Tracyzk, F. Mechanical Froth Flotation Cells, in Froth Flotation A Century of Innovation; Fuerstenau, M.C., Jameson, G.J., Yoon, R., Eds.; Society for Mining, Metallurgy, and Exploration, SME: Englewood, CO, USA, 2009; pp. 709–710. [Google Scholar]
  23. Napier-Munn, T.J. Statistical Methods for Mineral Engineers-How to Design Experiments and Analyse Data; JKMRC: Brisbane, Australia, 2014. [Google Scholar]
  24. Li, C.; Runge, K.; Shi, F.; Farrokhpay, S. Effect of froth rheology on froth and flotation performance. Miner. Eng. 2018, 115, 4–12. [Google Scholar] [CrossRef]
  25. Ostadrahimi, M.; Gharibi, K.; Dehghani, A.; Farrokhpay, S. Estimating Bubble Loading in Industrial Flotation Cells. Minerals 2019, 9, 222. [Google Scholar] [CrossRef] [Green Version]
  26. Wang, L.; Xing, Y.; Wang, J. Mechanism of the combined effects of air rate and froth depth on entrainment factor in copper flotation. Physicochem. Probl. Miner. Process. 2020, 56, 43–53. [Google Scholar]
  27. Hadler, K.; Cillier, J.J. The relationship between the peak in air recovery and flotation bank performance. Miner. Eng. 2009, 22, 451–455. [Google Scholar] [CrossRef]
  28. Neethling, S.; Brito-Parada, P. Predicting flotation behaviour—The interaction between froth stability and performance. Miner. Eng. 2018, 120, 60–65. [Google Scholar] [CrossRef]
  29. Mesa, D.; Morrison, A.J.; Brito-Parada, P.R. The effect of impeller-stator design on bubble size: Implications for froth stability and flotation performance. Miner. Eng. 2020, 157, 106533. [Google Scholar] [CrossRef]
Figure 1. Froth and pulp recovery model [2].
Minerals 11 00494 g001
Figure 2. Comparison between the froth recovery data (Rf and R*f) obtained from Equations (6) and (7).
Minerals 11 00494 g002
Figure 3. Effect of air flowrate (Qg), froth depth (Hf), and frother dosage (Cf) on the flowrate of the minerals into froth phase (BXB), froth recovery (Rf), and collection zone recovery (Rc) at two different conditions (L: Qg = 45 m3/h, Cf = 70 mL/min, Hf = 5 cm, and H: Qg = 146 m3/h, Cf = 150 m L/min, Hf = 30 cm).
Minerals 11 00494 g003
Figure 4. The response surface plots for the flowrate of the minerals into the froth phase (BXB) and froth recovery (Rf) (the interaction for the collection zone recovery (Rc) was found to be nonsignificant).
Minerals 11 00494 g004
Table 1. The statistical factorial design data (a) and the froth recovery results (b).
NO.ab
Frother Dosage
(mL/min)
Froth Depth
(cm)
Air Flowrate
(m3/h)
Feed Flowrate
(t/h)
S
%
Fe
%
B (t/h)XB (%)C
(t/h)
Xc
(%)
M*c
(kg/h)
RG
(%)
Rc
(%)
(Equation (1))
Rf
(%)
(Equation (5))
R*f
(%)
(Equation (7))
|Rf − R*f|
(%)
1705451081.0965.700.9415.070.7912.35968.2911.7268.8768.070.80
21505451101.0965.020.9916.750.9812.6712210.3613.5374.8873.811.07
37030451081.0466.151.08150.1914.98282.5312.9417.5717.490.08
41503045981.1965.711.1916.670.315.45463.9715.1423.3723.20.16
57051461040.9366.601.2314.741.2611.7414715.2918.2281.5981.050.54
615051461151.0665.751.4216.381.7411.2619416.0718.784.2383.250.99
770301461050.9365.421.9414.550.7713.2410110.4424.4936.1235.930.18
8150301461160.966.202.3416.111.1013.1514313.8629.7338.3738.020.35
911017.595.51050.9965.421.84160.9114.4513112.6524.5744.6744.450.22
1011017.595.51101.1065.561.7715.890.9114.1512810.6420.7645.7845.450.34
Average1081.0365.75
Variance280.010.21
Standard Deviation50.090.46
Table 2. The variance analysis of effective parameters on flowrate of the minerals into the froth phase (BXB), froth recovery (Rf), and collection zone recovery (Rc).
BXBRfRc
SourceSum of SquaredfMean SquareF Valuep-ValueSum of SquaredfMean SquareF Valuep-ValueSum of SquaresdfMean SquareF Valuep-Value
Model41,612.34410,403.0827.605155.9551031.194617.77<0.0001 267.34466.8420.090.0065
Frother dosage, A5332.2415332.2414.1514.1534.85134.85156.07011.82111.823.550.1325
Froth depth, B11,118.09111,118.0929.50.014711.8814711.8821,100.25<0.000150.66150.6615.230.0175
Air flowrate, C20,532.09120532.0954.470386.791386.791732.07<0.0001178.681178.6853.710.0018
AC-----5.9515.9526.670.0126.18126.187.870.0485
BC4629.9114629.9112.280.0216.48116.4873.8026.18126.187.870.0485
Curvature7885.2617885.2620.920.0199.91199.91447.39033.99133.9910.220.0330
Residual1507.664376.91 0.6730.22 13.3143.33
Lack of Fit1421.243473.755.480.30.0520.020.040.966.0432.010.280.85
Pure Error86.42186.42 0.6210.62 7.2617.26
Cor Total51,005.269 5256.539 314.649
Publisher’s Note: MDPI stays neutral with regard to jurisdictional claims in published maps and institutional affiliations.

