
Abstract
Bitcoin is designed as a peer-to-peer cash system. To work as a currency, it must be stable or be backed by a government. In this paper, we show that the volatility of Bitcoin prices is extreme and almost 10 times higher than the volatility of major exchange rates (US dollar against the euro and the yen). The excess volatility even adversely affects its potential role in portfolios. Our analysis implies that Bitcoin cannot function as a medium of exchange and has only limited use as a risk-diversifier. In contrast, we use the deflationary design of Bitcoin as a theoretical basis and demonstrate that Bitcoin displays store of value characteristics over long horizons.
1 Introduction
Cryptocurrencies are a new phenomenon compared to traditional fiat currencies and assets such as gold. The most prominent cryptocurrency, Bitcoin, is designed as a peer-to-peer cash system (see Nakamoto 2008) and thus has features of a currency. However, due to its high volatility, most empirical studies classify Bitcoin as an investment (Glaser et al. 2014; Baur et al. 2018; Bedi and Nashier 2020). In this article, we conduct a detailed analysis of the Bitcoin market with a particular focus on volatility. Both aspects—investment or currency—are heavily influenced by the level and nature of volatility, and our results suggest that Bitcoin does not work as a currency.
The literature on Bitcoin is relatively new and has grown very fast in recent years. Trading aspects are considered by Cheah and Fry (2015) and Blau (2018) who investigate speculative behavior in Bitcoin trading. Whether Bitcoin serves to diversify the risk of an investment portfolio is analyzed by Brière et al. (2015), Guesmi et al. (2019), and Hussain Shahzad et al. (2020). There are numerous studies that look into the volatility of Bitcoin. Dwyer (2015), for example, analyzes monthly standard deviations of Bitcoin prices from Mt. Gox, BTC, and Bitstamp and concludes that these are 5–7 times higher than what is generally observed in stock markets. Bouoiyour and Selmi (2016), Bouri et al. (2017), Katsiampa (2017), and Ardia et al. (2019) rely on GARCH models to estimate daily volatility. All authors conclude that the volatility level is comparatively high, offering different explanations such as cyber attacks, information asymmetry, decentralization, or the absence of regulation.
We contribute to the literature with an in-depth analysis of Bitcoin volatility and its implications on the usage of Bitcoin as a currency, a diversifier or hedge, and a store of value. We use data from six different markets, covering Bitcoin exchange rates with the US dollar, the euro, and the Japanese yen and compare them with USD/EUR and USD/YEN exchange rates. We find that Bitcoin markets exhibit excess volatility in the sense that the volatility is up to 10 times higher than the volatility of the exchange rates. We understand such a high level of volatility as an obstacle for Bitcoin to perform all functions associated with a currency (means of exchange, unit of account, and store of value) in a reliable and efficient manner. Also, we find that the dynamics of Bitcoin volatility are different from and unrelated to FX volatility which suggests that Bitcoin does not (yet) belong to the global market of currencies.
The article proceeds as follows. We first describe the Bitcoin market and related regulatory aspects in Sect. 2. In Sect. 3, we present the dataset and descriptive statistics. The empirical analysis follows in Sect. 4 where we look at Bitcoin during crisis periods, consider Bitcoin’s use as a portfolio diversifier, analyze how it relates to major currencies, and finally consider money and store of value aspects of Bitcoin. Section 5 concludes.
2 The Bitcoin market
2.1 Market characteristics
The Bitcoin market is a fully electronic market which has been introduced on October 31, 2008 by Satoshi Nakamoto (2008) as a peer-to-peer network without any central authority. Hence, there is no central bank (or any other single intermediary) involved and transactions are verified by a network of nodes that check the accuracy of the latest transaction against their register of total transactions, called the blockchain. The transaction is subsequently added to the ledger, and information is redistributed to other nodes.Footnote 1
Unlike “classical” fiat currencies where central banks create money in, theoretically, unlimited amounts, the total number of Bitcoins is limited and capped at 21 million. This is one fundamental difference.Footnote 2 Bitcoins are mined by providing network services like verifying and collecting newly broadcast transactions which are added to a block. In order for a block to be accepted in the network, miners have to provide proof of authenticity by finding a specific number called a nonce. A hash function which maps the nonce back to an easily verifiable bit string ensures that the block is valid (cp. Antonopoulos 2014). As of August 31, 2020, there were 18.476 million Bitcoins in circulation. They amounted to a total market value of 216 billion USD. Figure 1 presents the development of the total number of Bitcoins tradeable and the market capitalization (MCAP, in USD). While the number of bitcoins has increased steadily since its introduction, demand and, thus, market value, has also increased albeit less steadily. The plot of MCAP clearly shows that the Bitcoin price is very volatile. For example, during 2017 the price for one Bitcoin increased from less than 1,000 US dollars to more than 19,000 US dollars and fell back to 8,000 US dollars by mid of 2018.
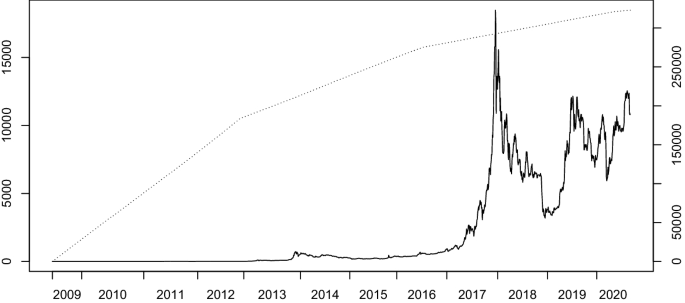
Total Number of Bitcoins and Market Capitalization. The figure presents the total number of Bitcoins in circulation (dotted line, left axis) and the market capitalization in million USD (solid line, right axis) from March 1, 2009 to September 9, 2020
In light of this high volatility, many people have questioned whether Bitcoin can ever fulfill the tasks of a currency. Aiming to avoid the excessive volatility of cryptocurrencies while preserving the benefits of the blockchain technology led to the concept of low volatility stablecoins (Lyons and Viswanath-Natraj 2020; Eichengreen 2019) like Tether (Tether Operations Ltd. 2016; Griffin and Shams 2020) or Libra proposed by Facebook (Libra Association 2020).
2.2 Trading and regulation
In our analysis, we consider five Bitcoin markets (Bitfinex, bitFlyer, BitStamp, BTCBOX, and Kraken), and it is worthwhile to note that the trading environment is not unified across these markets. Also, a consolidated tape is not available albeit all markets trade the same object. The minimum tick size during the sample period is subject to change as the exchanges adjust it in response to the Bitcoin price. Transaction fees are charged by the different platforms as a percentage of total transaction volume. For example, BitStamp charges between 0.1% and 0.25% based on the total transaction volume realized during a 30-day period. Kraken additionally distinguishes between order types and submitting a market order is slightly more costly than submitting a limit order. There may be additional fixed costs for wire transfers or other services provided.
A critical issue in the Bitcoin framework is the regulation of cryptocurrencies which is heterogeneous across countries. In some jurisdictions, Bitcoin is completely banned (e.g., Bolivia, Morocco, or Nepal); in others there is no limit to its use (European countries, USA, and many others). In between these extremes are countries like Bahrain or Qatar which tolerate that their citizens use Bitcoin abroad, but not within the country (Global Legal Research Center 2018). In addition to restrictions of use, treatment of gains for tax purposes also varies greatly. In general, Bitcoin transactions are free from VAT, but gains are subject to tax. Table 1 provides an overview of selected countries which are related to the exchanges in our study. It is interesting to note that even the definitions vary across countries and have changed over the years, e.g., in the USA (see Mandjee 2015, for an overview of regulation and its implications in the USA).
Recently, regulation of cryptocurrencies has been again in the focus of law-makers and central banks following the proposal of Facebook, Inc. to establish its own virtual currency called Libra. Mersch (2019) and Adachi et al. (2020) point out that a stablecoin such as Libra could fall outside the European Central Bank’s existing regulations as the nature of a currency-backed coin could be regarded as an investment fund, but it remains unclear whether Libra holders do have a 1:1 claim on the fiat currencies in its basket. They conclude that a stablecoin of global importance might endanger financial stability in case of malfunctions. Similar concerns are expressed by the US Federal Reserve (Brainard 2019). In contrast, Baughman and Flemming (2020) conclude that the demand for a global stable coin would be so low that there is no risk for the global financial system. However, it is not easy to predict the demand for such products. Consider again Fig. 1: Initially, Bitcoin was a negligible niche “product” which was associated with tech nerds. However, starting from 2013, and thus four years after the introduction, the global demand started to rise and Bitcoin became recognized as the first and biggest global cryptocurrency.
While traditional security issues associated with money like bank robberies and counterfeiting of physical currency notes are no concern for cryptocurrencies, they face similar problems such as cyberattacks (Dion-Schwarz et al. 2019). For example, Kraken has been the target of multiple distributed denial of service (DDoS) attacks (e.g., from October 31, to November 4, 2015Footnote 3 or on November 9/10, 2019Footnote 4). In the absence of binding regulation, it is unclear whether the exchange should be held accountable in such a situation when trading is made impossible. Following an attack on July 10, 2015, the China-based OKCoin platform compensated traders for losses incurred due to the DDoS. As Vasek et al. (2014) show, the number of attacks has increased, and Böhme et al. (2015) argue that they are especially attractive as stolen Bitcoins can easily be converted into cash. Exposure to this kind of risk is potentially reflected in the volatility of Bitcoin prices. We analyze this issue in more detail in Sect. 4.1 below.
3 Data and descriptive analysis
In our analysis, we use historical price time series obtained from two different sources. The dataset of Bitcoin prices across different markets is obtained from investing.com. It covers daily open, high, low, and close prices for Bitcoin traded against the U.S. dollar on Bitfinex and Kraken, for Bitcoin traded in Euro on Kraken and BitStamp, and for Bitcoin traded against the Japanese Yen on BitFlyer and BTCBOX. The sample starts April 1, 2014 for the Kraken and Bitfinex data, as well as the euro and yen exchange rates against the US dollar. The shortest time series is available for BTCBOX which starts January 16, 2018. Bitcoin data are available on a daily basis, FX data from Monday to Friday. All time series are available until August 30, 2020.
As not all of these markets were operational during the entire period since the introduction of Bitcoin, we also source a long time series of Bitcoin prices from bitinfocharts.com. The data cover the period July 17, 2010 until August 30, 2020 and are sampled on a daily frequency. Market information (Bitcoin market capitalization and number of coins in circulation) is obtained from blockchain.com. These data start in March 2009 and also go till August 30, 2020.
As a nonparametric measure of volatility, we rely on the estimator of Garman and Klass (1980) which reads as follows:
where \(h_t\) (\(l_t\)) denotes the log of the highest (lowest) price on day t, and \(o_t\) and \(c_t\) are the first and the last recorded price on day t.Footnote 5 For the subsequent analysis, we use volatility \(\sigma _t\) obtained by taking the square root of \(\sigma _t^2\). Figure 2 presents time series plots of the so obtained volatility estimate. It is immediately apparent that Bitcoin volatility is much higher than the volatility of the FX rates. The plots also suggest that the volatility of volatility is higher in the Bitcoin case. This observation holds across all Bitcoin markets and all currencies against which Bitcoin is traded.
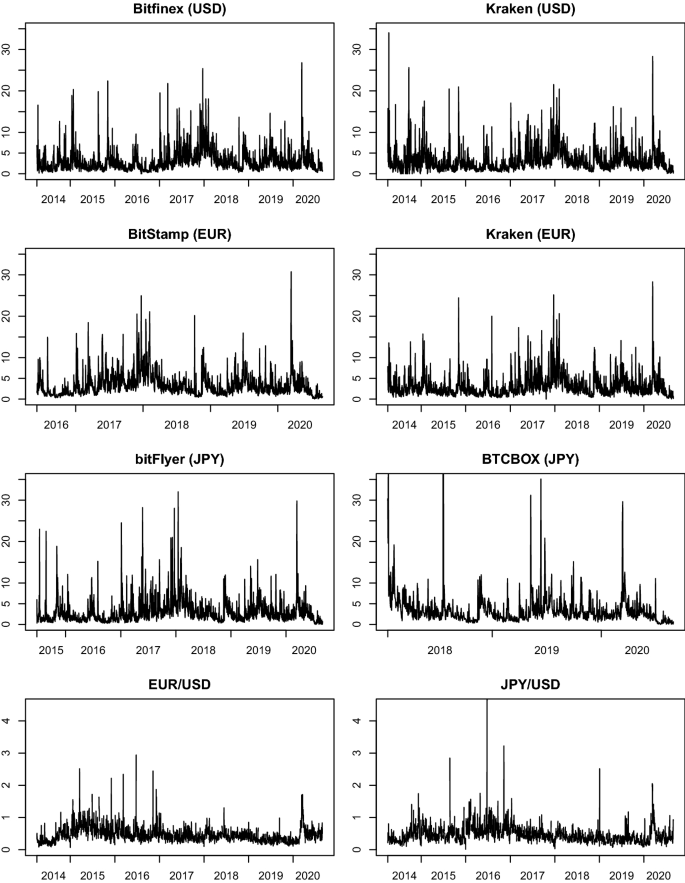
Volatility Time Series. The figure presents time series of daily volatility (in percent) from January 1, 2014 to January 25, 2017 for the six Bitcoin markets and the two foreign exchange markets
Table 2 presents descriptive statistics for returns and volatility. As can be seen, the average return of Bitcoin is similar across five out of the six markets. The slightly negative return observed on BTCBOX is due to the fact that the time series for this market only starts in January 2018, amidst the downturn period after the all-time high in December 2017. The minimum values, however, are similar across all markets, reflecting the sharp downturn in March 2020. As regards volatility, it is similar across all markets and suggests a daily average volatility of 3%. However, there are extremely volatile days with the maximum ranging in general around 30% where BTCBOX is again an extreme with more than 120% on a single day. In contrast, the FX rates are rather stable across the sample period with an average return close to zero and an average volatility estimate below 0.5%. Also, the volatility of volatility is much lower in case of the FX rates as can be seen from the standard deviation of volatility which is 10-20 times higher for Bitcoin than for the FX rates. High volatility in general in connection with the high volatility of volatility fosters extreme price fluctuations which are frequently observed in the Bitcoin market.
We also test for the existence of structural breaks in the time series of volatility using the approach in Chan et al. (2014). As our time series of volatility is marked by long memoryFootnote 6, we use the model of Corsi (2009) to account for this property when implementing the LASSO approach (using the package “glmnet” Friedman et al. (2010) in R). It turns out that none of the time series exhibits a structural break.
3.1 Trend in volatility
In order to assess the development of volatility over a long time period, we estimate an AR(1)-GARCH(1,1) model (Bollerslev 1986) with t-distributed innovations on our long daily price time series. The resulting time series of volatility is displayed in Figure 3. As can be seen, the volatility has been higher at the beginning of the sample period than toward the end. Ultimately, this would be good news for the potential of evolving as a stable currency. However, the initial downward trend does not persist across the entire sample period. Considering the whole period from 2010 to 2020, we observe a slight downward trend which, in a regression of volatility on time, even turns out statistically significant, albeit economically weak with 0.015 basis points per month. This trend stopped after the first hype of Bitcoin at the end of 2013. Considering volatility between 2014 and 2020, a similar trend regression leads to the conclusion that volatility is constant throughout these years, i.e., the trend is not significantly different from zero.

Trend in Volatility. The figure presents volatility of Bitcoin over time with two time trends: blue covers the entire period from July 2010 to August 2020 and brown starts January 2014 and ends August 2020
3.2 Market correlations
A final aspect which we want to highlight is the question how the markets covary. This is important as the price difference between platforms trading Bitcoin can be substantial. If the information dissemination between markets works well, the pairwise correlation between daily transaction returns on those exchanges should be high as they all trade the same good (Bitcoin). This is in general supported by our data. Figure 4 presents the daily conditional correlation of returns based on a DCC-GARCH(1,1) model (Engle 2002), using the pairs for which the longest time series are available. The correlations of Bitcoin returns are high in general (0.95 on average) and also increased over time. In addition, they are higher than the correlation of the FX returns which is on average 0.43. Still, the correlations only tend to converge to one at the end of the sample period, irrespective of whether Bitcoin is traded in the same currency (e.g., the U.S. dollar, top left graph) or in different currencies (top right and middle graphs). This observation also holds for the remaining (unreported) combinations. The bottom left graph in Fig. 4 presents the negligible correlation of Bitcoin returns and FX returns. On average, the correlation across time is 0.026.

Return Correlations. The graph presents the dynamic conditional correlation of the daily return time series in the named markets
The evolution of Bitcoin return correlations has important implications in terms of market efficiency. In an efficient market setup, one should be able to construct a roundtrip. The cost to implement this trading strategy should be equal to the bid-ask spread plus some cost that may be involved when changing the trading venue. Put differently, if there are arbitrage gains to be made by buying in one market and selling in another market, prices should adjust to the fundamental value. In a fully electronic market, this should happen quickly and ultimately lead to high correlations of price changes. In the Bitcoin setup, there seem to be opportunities for arbitrage gains, in particular at the beginning of the sample period, when the correlation was sometimes very low. This finding is in line with Shynkevich (2020) who reports that arbitrage gains are more difficult to realize since 2018. This is the period when the correlation tends toward one in Fig. 4, indicating that the markets are more synchronized while they were more fragmented before.
4 Empirical analysis
This section analyzes the volatility of Bitcoin in crises, its role as a risk-diversifier in a portfolio, its similarity with major currencies, and its role as a medium of exchange and a store of value.
4.1 Bitcoin volatility during crisis periods
An important question concerning the volatility of Bitcoin is how it behaves during crises. There are two sorts of crises which we distinguish. First, we have crises related to the Bitcoin market itself. These are the named DDoS attacks or hacks of exchanges. On the other hand, Bitcoin could also be related to the real economy and volatility might therefore be linked to the stock market. Since the data covers the COVID-19 pandemic and thus the first financial crisis since the inception of Bitcoin in late 2008, the analysis can provide some unique insights. This is also related to the question whether Bitcoin is a safe haven which is impossible to test if there is no crisis as explained by Smales (2019).
To test whether the volatility behaves differently in any of the two circumstances, we implement a GARCH(1,1) model (Bollerslev 1986) using daily data from coinmarketcap.com and augment the variance equation with two dummy variables which allow the variance to shift on the day of an attackFootnote 7 or during the COVID-19 crisis. For precise crisis dates in the latter case, we use the end of February until the end of May 2020, inspired by the time when the stock market plummeted and rebounded.
The estimation results are presented in Table 3. As can be seen, the Bitcoin-related events (“attacks”) have a weak effect on the volatility. However, the order of magnitude is non-negligible as the unconditional variance is more than 10 times higher under attacks than usual. In contrast, the COVID-19 pandemic does not have an impact on the volatility. While the parameter estimate suggests an increase, it is not statistically significant.
It appears that the high volatility period caused by the COVID-19 pandemic is normal in a Bitcoin context as the volatility did not significantly increase in that period despite the 50% drop in prices in March 2020 and the subsequent rise of more than 100%. To check the robustness of this finding, we also use March 31, 2020, as the end of the COVID-19 crisis, and the results are qualitatively identical; the parameter for the COVID-19 crisis never turns out statistically significant.
4.2 Bitcoin as a portfolio diversifier
It has often been reported that Bitcoin price changes are uncorrelated with other assets’ price changes making Bitcoin a good diversifier of risk in asset portfolios. We use daily, monthly and quarterly returns of the S&P500 and Bitcoin for the period August 2011 to August 2020 to test this feature of Bitcoin.
We perform a portfolio analysis for all three return frequencies and find surprising results regarding Bitcoin’s role as a diversifier in an equity-Bitcoin portfolio. The correlations are positive and thus different compared with previous findings. The correlations increase from 0.09 for daily returns to 0.21 for monthly returns and to 0.34 for quarterly returns.
We calculated optimal portfolio weights for the S&P500 and Bitcoin based on two criteria: minimum variance and optimal Sharpe ratios. The optimal minimum variance weights of Bitcoin are 2.5% for daily data and 0% for monthly and quarterly data. The higher correlation estimates for monthly and quarterly returns increase the variance by too much for weights to be larger than zero. The optimal Sharpe ratio weights of Bitcoin are 55%, 50% and 100% for daily, monthly and quarterly returns, respectively. The non-monotonicity of the weights is due to a deteriorating risk-return ratio of Bitcoin from daily to monthly return frequencies.
The differences between the two optimization criteria are intuitive as the minimum variance portfolio is exclusively based on variances and covariances and thus ignores the estimated expected returns, whereas the optimal Sharpe ratio portfolio includes the latter and the high returns appear to dominate the variance resulting in much higher weights of Bitcoin compared with the minimum variance portfolios.
Given the evolution of Bitcoin and its youth, it is well possible that specific characteristics will change in the future. Hence, we briefly analyze the sensitivity of the estimates with regards to the portfolio weights. For example, if the volatility decreased by 50%, it would increase the minimum variance weights from close to 0% to 13% and the Sharpe ratio weights from 55% to 65% for daily data. If the expected returns decreased, e.g., by 50%, the minimum variance weights would be unaffected (remain at 0%) and the optimal Sharpe ratio weights would decrease from 55% to 30%.
We conclude that Bitcoin’s excess expected returns and volatility (relative to the S&P500) do not unambiguously make it a good portfolio diversifier or hedge. Its excess volatility implies very low or zero weights in a minimum variance portfolio. In contrast, the weights are high, about 50% or higher, in portfolios based on optimal Sharpe ratios due to the high excess returns despite the positive correlations.
4.3 Bitcoin versus major currencies
For Bitcoin to serve as a currency, it must resemble established, major currencies such as the US dollar. We operationalize resemblance with two key features, namely integration in the global currency system and stability. This leads to the following hypotheses.
H1: Bitcoin volatility and FX volatility are highly correlated.
Under H1, Bitcoin is integrated into the global FX market. If the terms of trade deteriorate in a particular market, the country’s exchange rate with respect to all other currencies is affected. Hence, if Bitcoin is part of the global system of exchange rates, it would need to be affected at the same time and of a similar order of magnitude, resulting in a strong comovement of its volatility with the volatility of other FX rates.
H2: Bitcoin volatility and FX volatility are equal.
Under H2, Bitcoin is relatively stable. If the volatility of Bitcoin is not different from the volatility of major exchange rates, Bitcoin is a reliable currency, i.e., the magnitude of fluctuations are comparable with other major exchange rates.
To test H1, we compute a DCC model (Engle 2002) for all possible volatility pairs and extract the time series of conditional correlations. In a second step, we test whether the correlation of Bitcoin volatility and FX volatility is, on average, as high as the correlation of the two FX volatility time series. The latter serves as a benchmark for volatility correlation in the FX market and allows us to quantify the expected level of the correlation.
Figure 5 depicts a selection of all correlations calculated in the first step. The correlation between the two FX rates is on average 0.49, fluctuating between 0.29 and 0.87. The fact that Bitcoin volatility is different is already illustrated by the correlation between Bitfinex and Kraken volatility which is on average higher (0.81) and fluctuates much more (between 0.28 and 0.99). In order to test H1, we focus on the correlation between Bitfinex and the two FX rates. As can be seen from Fig. 5, the respective correlation is very low on average (0.036 and 0.054). It therefore comes as no surprise that a two-sample t test rejects H1 at any significance level for the pairs depicted in Fig. 5. For the remaining Bitcoin/ FX volatility pairs in our sample, the test results consistently reject the equality hypothesis. Hence, we reject the hypothesis that Bitcoin is well-integrated in the global FX market.

Volatility Correlations. The figure presents the dynamic conditional correlation of volatility in the named markets
H2 suggests that in order for Bitcoin to be a currency, its price fluctuations should not be greater than the fluctuation of major exchange rates involving the US dollar, the euro and the yen. We implement the test as a two-sided two-sample Wilcoxon test to account for the fact that the volatilities are not normally distributed. In particular, we test whether the means of the FX rates’ volatilities (reported in Table 2) are equal to the means of the Bitcoin volatilities. The alternative hypothesis is that the means are different. Table 4 presents the results and shows H2 is rejected for all pairs.
Hence, we conclude that Bitcoin volatility is different from the volatility of the three major currencies. Considering the results presented in Table 2 further shows that Bitcoin volatility is higher than FX volatility.
A further way to establish whether Bitcoin is integrated in the fiat currency system is to calculate the Bitcoin implied exchange rate. It is obtained as the ratio of Bitcoin prices traded against the currencies of interest. Figure 6 presents the evolution of the implied exchange rate along with the deviation from the official FX rate in our dataset. We find that the deviation from the EUR/USD exchange rate is on average \(-0.2\) euro cent for one dollar. Seen as a cost, this might be better than the large spread offered by banks. The problem, however, is that the deviations are not stable and vary between \(-20\) and \(+30\) cents. This is a particular problem during the early part of the sample.

Bitcoin implied exchange rates. The figure presents the exchange rate between the Euro and the U.S. dollar as well as the Yen and the U.S. dollar as implied by the Bitcoin prices trading in these currencies (left plots) along with the deviation from the true FX rate (right plots)
Similar observations hold true for the JPY/USD exchange rate. The difference between the implied and the official FX rate is on average \(-0.44\) yen per dollar. Again, the deviations can be substantial and vary between \(+15.63\) yen and \(-47.82\) yen. Here, in particular the period at the end of 2017 shows remarkable differences. Hence, it seems that there are periods in Bitcoin trading when the price rises substantially, potentially beyond any reasonable fundamental estimate, and the link between the markets gets weaker and the relation to the exchange rate is broken. However, for Bitcoin to be integrated into the foreign exchange markets, one would require a reliable, stable relationship so that exchanging money could go through any channel without the risk of significant losses.
4.4 Bitcoin as money
This section analyzes whether the three key properties of a currency, namely medium of exchange, unit of account, and store of value, also hold for the cryptocurrency Bitcoin.
4.4.1 Bitcoin as a medium of exchange
Currently, if a transaction is supposed to be carried out in Bitcoin, the buyer would have to buy Bitcoin first before using it for payment. Subsequently, it is most likely that the seller converts Bitcoin back to the local currency in order to pay his creditors. Such a transaction, however, bears exchange rate risk which increases with the level of volatility in the Bitcoin exchange market. For example, Fig. 2 shows that the daily volatility is regularly about 10% and on some days even reaches values above 30%. This means that the purchase of a good that is valued at US$ 1,000 may cost 10% (or US$ 100) more or less depending on the time of the purchase abstracting from transaction costs.

A few days of Bitcoin prices. The figure presents the Bitcoin price (in USD) from March 11 to March 20, 2020 in transaction time (using every fourth observation in the plot to reduce size)
To give a more precise example, consider the period 11 to March 13, 2020 which is depicted in Fig. 7. The graph presents the time series of high frequency trading prices of Bitcoin on Kraken for these days. Now imagine that a coffee shop sells a cup of coffee for 625,000 SatoshiFootnote 8 which, on March 10 and 11, 2020 at 7.30 am, would have been roughly 5 USD. On the morning of March 12, your daily morning coffee got a bit cheaper and is now 4.63 USD which is good for the customer but bad for the owner of the coffee shop (if both use US dollars as their benchmark). Even worse, at lunchtime, the same coffee sells for 3.75 USD and for 2.56 USD during the night of March 13. For the coffee shop owner, that is an unsustainable situation as she would have to incur huge losses if prices stay that low. The only way out is to continuously updating the price in Bitcoin/ Satoshi which makes a comparison of prices for the customer very cumbersome. To still earn 5 USD, the coffee shop owner would have had to increase the price to 1,250,000 Satoshi on March 13, doubling the price.
This example also highlights the inconsistent news regarding the acceptance of Bitcoin by small and large corporations. Economic reasoning and intuition helps to understand that it would be very costly for any corporation, be it Apple, Dell, Microsoft, or Paypal, to accept Bitcoin as a means of payment. What some firms may offer as a payment option is the conversion of Bitcoin through a linked Bitcoin exchange. This is similar to making a payment in foreign currency which is converted into local currency at the time of the transaction. Consequently, the conversion is generally costly and thus much more expensive than an actual and direct payment in Bitcoin would be.
The only way to entirely remove this risk would be for a country to adopt Bitcoin as a currency and restrict the exchange of Bitcoin into other currencies. But there are no reasons for a developed country to adopt Bitcoin as its currency since it would give up all control over its money supply. That is why the central banks of several countries, instead of adopting Bitcoin, consider creating their own digital currencies.Footnote 9
4.4.2 Bitcoin as a unit of account
White (1984) argues that the unit of account and the medium of exchange feature cannot be separated. In the current state where Bitcoin is not accepted widely by buyers or sellers as a means of payment, trading partners suffer additional costs (direct costs from exchanging currencies and indirect costs due to the high fluctuation of Bitcoin) when using Bitcoin as a unit of account. As Bitcoin is currently not accepted as a medium of exchange, it cannot have the unit of account feature.
Furthermore, due to its extreme volatility it is difficult or impossible to derive the true value of a specific good measured in Bitcoin. It is therefore not useful as a unit of account. Yermack (2015) states that the only way to solve this issue is for a country to adopt Bitcoin as principal currency. However, this is an unlikely scenario (at least for a large country) as discussed in Sect. 4.4.1.
4.5 Bitcoin as a store of value
Our analysis so far has identified excess volatility of Bitcoin which appears to reject its use as a store of value. However, since the long-term price trend is clearly positive as shown in Fig. 8 for different moving-average prices, it can be argued that the price did not fall over sufficiently long periods and that Bitcoin shows store of value properties. This argument is supported by Bitcoin’s fixed supply and thus “deflationary design” compared with fiat currencies. In other words, since Bitcoin cannot be inflated beyond a fixed cap, unlike gold whose supply is not fixed, it is possible that demand growth will persistently exceed supply growth in the future.

Long-term price trends. The figure presents the evolution of the price of Bitcoin (solid line) and long-term trends based on 1-year, 2-year, and 3-year moving averages (MA)
The following equation describes the relation of demand and supply of a currency (cp. Sachs and Larrain 1993, ch. 8) and explains the “deflationary design”:
where M is money supply, V is the velocity of money, P the price level, and Y national output. If V is constant and M grows at a lower rate than Y, P must fall implying deflation. The value of one unit of currency M would be inversely related to the price level P, i.e., a decreasing price level P implies an increasing price of M.Footnote 10 In this deflationary scenario, currency holders have an incentive to hoard money and delay spending. This scenario is consistent with the long-run positive price trend of Bitcoin and with Bitcoin being a store of value.
Interestingly, major fiat currencies and gold are considered stores of values despite their price fluctuations and differing price trends. The price of gold appreciated relative to major currencies over the last 40 years due to inflation of consumer prices in fiat currencies. Consequently, fiat currencies depreciated against gold and many other real assets over the last 40 years. These examples emphasize that the price of a store of value in many cases is not and need not be stable.
The long-term store of value property can also be illustrated differently, based on the holding period returns of Bitcoin. We calculate the log-returns of holding Bitcoin on a monthly basis for various buy and sell time periods between April 2013 and July 2020. The result is presented in Fig. 9 and highlights that early investment (e.g., in 2014) generally leads to significant returns over sufficiently long time spans. Indeed, only an investment during the high value period in December 2017 leads to a negative holding period return over all horizons.

Investment triangle. The figure presents the holding returns of Bitcoin over time when investing on the first of the month and selling at the end of the month named on the y-axis and x-axis, respectively
5 Conclusion
Bitcoin is a cryptocurrency but does not work as a currency due to its excess volatility. The high volatility makes it prohibitively costly to use as a medium of exchange and a unit of account. This conclusion holds for very short time horizons, e.g., minutes but also over longer periods, e.g., days, weeks, or months. In contrast, over very long horizons, Bitcoin can be considered a store of value despite its excess volatility. This empirical finding is supported theoretically based on Bitcoin’s design, specifically its “deflationary” fixed supply. The high volatility does not only adversely affect Bitcoin’s role as a currency but also as an investment. We demonstrate that Bitcoin’s excess volatility does not make it a good risk-diversifier in portfolios.
There are many historical examples of hyperinflation and currency crises with extreme changes in currencies similar to changes in the value of Bitcoin. In these cases, the currencies were often replaced by barter or alternative (foreign) currency. While such fiat currencies often continued to serve as official money despite the extraordinary high volatility, there is a fundamental difference between traditional fiat currencies and Bitcoin. The former are backed by a state and require tax payments in the state-issued currency creating a direct demand for this currency (see Goodhart 1998). Without this requirement, a highly volatile currency, such as Bitcoin, is unlikely to be used as a means of payment. Since Bitcoin is independent of any government which may require payments in Bitcoin, people have a choice which translates into the freedom to not use it as a medium of exchange.
Despite its high historical volatility compared to major currencies, Bitcoin may evolve as a store of value and an alternative to other stores of value such as gold. Both the deflationary design and the decentralized and global nature enhance the store of value property and in turn make it unlikely that any country will adopt it as an official currency and thus lose control over the money supply and its monetary policy. Excess volatility appears to be inconsistent with a store of value but if the store of value is volatile only in the short run but relatively stable (or rising) in the long run, volatility may not be the major issue for Bitcoin as a store of value. After all, safe assets are also volatile and risky until maturity. And fiat currencies are not safe or risk-free either. Due to inflation, most fiat currencies have depreciated against real assets such as gold or housing and thus did not work as a store of value in the long run but only in the short run. This is in contrast to Bitcoin which does not work as a store of value in the short run but potentially in the long run.
The evolution of digital currencies such as Bitcoin highlights the potential role of decentralized and denationalized private money (Hayek 1990) and “choice of currency” (see Endres 2009). It remains to be seen if unregulated and internationally “distributed” digital currencies, including the more recent stablecoins, can compete with national fiat currencies and established stores of value such as gold.
Notes
The creation of new Bitcoin, called mining, resembles the mining of gold. Gold, similar to Bitcoin, is not a generally accepted unit of account and medium of exchange. An obvious and key difference of gold and Bitcoin is that the former is a tangible, physically mined commodity, whereas the latter only exists digitally.
Source: https://cointelegraph.com/news/kraken-ddos-attack-leaves-traders-unable-to-sell-at-500-peak [Accessed September 29, 2020].
Source: https://status.kraken.io/history [Accessed September 29, 2020]
There are two instances where the estimator becomes negative, probably due to wrong recordings of the data. In this instance, we only use half the square of the h and l range as a proxy for the daily variance following Martens and van Dijk (2007).
To check the persistence of the volatility time series, we estimate the fractional integration parameter d using the methodologies proposed by Geweke and Porter-Hudak (1983) and Shimotsu and Phillips (2005). We find in all cases that \({\hat{d}}\) is significantly different from zero and varies between 0.17 (BTCBOX) and 0.48 (Bitfinex)
We use the events listed in Twomey and Mann (2020) where we were able to identify the exact dates.
1 Bitcoin equals 100,000,000 Satoshi.
Governments and central banks could create digital currency and then peg the digital currency to the existing fiat currency (Eichengreen 2019; Mersch 2020). In this case, a regulated exchange would be required to use the pegged exchange rate to convert fiat currency into digital currency or vice versa.
An alternative, more general, formulation is \(S \cdot p = D\) where S is the supply of Bitcoin, p is the price of Bitcoin, and D is the demand for Bitcoin.
References
Adachi M, Cominetta M, Kaufmann C, van der Kraaij A (2020) A regulatory and financial stability perspective on global stablecoins. Macroprudential Bull 10:546
Antonopoulos AM (2014) Mastering Bitcoin. O’Reilly Media, Unlocking Digital Crypto-Currencies, Sebastopol, USA
Ardia D, Bluteau K, Rüede M (2019) Regime changes in Bitcoin GARCH volatility dynamics. Finance Res Lett 29:266–271
Baughman G, Flemming J (2020) Global Demand for Basket-Backed Stablecoins. In: Finance and economics discussion series 2020–048. Board of Governorsof the Federal Reserve System, Washington. https://doi.org/10.17016/FEDS.2020.048
Baur DG, Lee AD, Hong K (2018) Bitcoin: medium of exchange or speculative assets? J Int Financial Mark Inst Money 54:177–189
Bedi P, Nashier T (2020) On the investment credentials of Bitcoin: a cross-currency perspective. Res Int Bus Finance 51:21
Blau BM (2018) Price dynamics and speculative trading in Bitcoin. Res Int Bus Finance 43:15–21
Böhme R, Christin N, Edelman B, Moore T (2015) Bitcoin: economics, technology, and governance. J Econ Perspect 29:213–238
Bollerslev T (1986) Generalized autoregressive conditional heteroskedasticity. J Econ 31:307–327
Bouoiyour J, Selmi R (2016) Bitcoin: a beginning of a new phase? Econ Bull 36:1–11
Bouri E, Azzi G, Dyhrberg AH (2017) On the return-volatility relationship in the Bitcoin market around the price crash of 2013. Open Access Open Assess E J Econ 3:11
Brainard L (2019) Update on Digital Currencies, Stablecoins, and the Challenges Ahead. Technical Report, Board of Governors of the Federal Reserve System
Brière M, Oosterlinck K, Szafarz A (2015) Virtual currency, tangible return: Portfolio diversification with bitcoin. J Asset Manag 16:365–373
Brito J, Castillo A (2013) Bitcoin: a primer for policymakers. Mercatus Center George Mason University, Arlington
CFTC (2018) An Introduction to Virtual Currency. Technical report, Commodity futures and trade commission. https://www.cftc.gov/Bitcoin/index.htm. Accessed Aug 19, 2020
Chan NH, Yau CY, Zhang R-M (2014) Group LASSO for structural break time series. J Am Stat Assoc 109:590–599
Cheah E-T, Fry J (2015) Speculative bubbles in Bitcoin markets? an empirical investigation into the fundamental value of Bitcoin. Econ Lett 130:32–36
Corsi F (2009) A simple approximate long-memory model of realized volatility. J Financial Econ 7:174–196
Dion-Schwarz C, Manheim D, Johnston PB (2019) Terrorist use of cryptocurrencies-technical and organizational barriers and future threats. RAND Corporation, Research Reports, Santa Monica, CA
Dwyer GP (2015) The economics of Bitcoin and similar private digital currencies. J Financ Stab 17:81–91
Eichengreen B (2019) From Commodity to Fiat and Now to Crypto: What Does History Tell Us? In: NBER Working Papers 25426, National Bureau of Economic Research, Inc
Endres AM (2009) Currency competition: a hayekian perspective on international monetary integration. J Money Credit Bank 41:1251–1263
Engle R (2002) Dynamic conditional correlation: a simple class of multivariate generalized autoregressive conditional heteroskedasticity models. J Busin Econ Stat 20:339–350
FinCEN (2013) Statement of Jennifer Shasky Calvery, Director, Financial Crimes Enforcement Network, United States Department of the Treasury. Technical report, Financial Crimes Enforcement Network, United States Department of the Treasury. https://www.fincen.gov/news/testimony/statement-jennifer-shasky-calvery-director-financial-crimes-enforcement-network. Accessed Aug 19, 2020
Friedman J, Hastie T, Tibshirani R (2010) Regularization paths for generalized linear models via coordinate descent. J Stat Softw 33:1–22
Garman MB, Klass MJ (1980) On the estimation of security price volatilities from historical data. J Bus 53:67–78
Geweke J, Porter-Hudak S (1983) The estimation and application of long memory time series models. J Time Ser Anal 4:221–238
Glaser F, Zimmermann K, Haferkorn M, Weber MC, Siering M (2014) Bitcoin-asset or currency? Revealing Users’ Hidden Intentions. https://ssrn.com/abstract=2425247
Global Legal Research Center (2018) Regulation of Cryptocurrency Around the World, Technical report, The Law Library of Congress. https://www.loc.gov/law/help/cryptocurrency/world-survey. Accessed Aug 19, 2020
Goodhart CA (1998) The two concepts of money: implications for the analysis of optimal currency areas. Eur J Polit Econ 14:407–432
Griffin JM, Shams A (2020) Is bitcoin really untethered? J Finance 75:1913–1964
Guesmi K, Saadi S, Abid I, Ftiti Z (2019) Portfolio diversification with virtual currency: evidence from bitcoin. Int Rev Financial Anal 63:431–437
Hayek FA (1990) Denationalisation of money: the argument refined, vol 3. The Institute of Economic Affairs, London
Hussain Shahzad SJ, Bouri E, Roubaud D, Kristoufek L (2020) Safe haven, hedge and diversification for G7 stock markets: gold versus bitcoin. Econ Model 87:212–224
Katsiampa P (2017) Volatility estimation for bitcoin: a comparison of GARCH models. Econ Lett 158:3–6
Libra Association (2020) Libra White Paper. https://libra.org
Lyons RK, Viswanath-Natraj G (2020) What keeps Stablecoins stable? NBER Working Paper No. 27136. https://www.nber.org/papers/w27136
Mandjee T (2015) Bitcoin, its legal classification and its regulatory framework. J Bus Secur Law 15:157–218
Martens M, van Dijk D (2007) Measuring volatility with the realized range. J Econ 138:181–207
Mersch Y (2019) Money and private currencies: reflections on Libra. ECB Legal Conference speech. https://www.ecb.europa.eu/press/key/date/2019/html/ecb.sp190902~aedded9219.en.html. Accessed Aug 19, 2020
Mersch Y (2020) An ECB digital currency–a flight of fancy? Consensus 2020 virtual conference speech. https://www.ecb.europa.eu/press/key/date/2020/html/ecb.sp200511~01209cb324.en.html. Accessed Aug 19, 2020
Nakamoto S (2008) Bitcoin: a peer-to-peer electronic cash system. https://bitcoin.org/bitcoin.pdf
Sachs JD, Larrain FB (1993) Macroeconomics in the global economy. Prentice-Hall, New York
Shimotsu K, Phillips PCB (2005) Exact local whittle estimation of fractional integration. Ann Stat 33:1890–1933
Shynkevich A (2020) Bitcoin arbitrage. Finance Res Lett 101698:6839
Smales L (2019) Bitcoin as a safe haven: is it even worth considering? Finance Res Lett 2:59
Tether Operations Ltd (2016) Tether: fiat currencies on the bitcoin blockchain. https://tether.to/
Twomey D, Mann A (2020) Fraud and manipulation within cryptocurrency markets. In: Alexander C, Cumming D (eds) Corruption and fraud in financial markets: malpractice, misconduct and manipulation. Wiley, New York, pp 205–250
Vasek M, Thornton M, Moore T (2014) Empirical analysis of denial-of-service attacks in the bitcoin ecosystem. In: Böhme R, Brenner M, Moore T, Smith M (eds) Financial cryptography and data security, vol 8438. Lecture Notes in Computer Science. Springer, Berlin, pp 57–71
White LH (1984) Competitive payments systems and the unit of account. Am Econ Rev 74:699–712
Yermack D (2015) Is bitcoin a real currency? An economic appraisal. In: Chuen DLK, Diego S (eds) Handbook of digital currency. Academic Press, New York, pp 31–43
Funding
No funding has been received for this project.
Author information
Authors and Affiliations
Corresponding author
Ethics declarations
Conflict of interest
Dirk Baur declares that he has no conflict of interest. Thomas Dimpfl declares that he has no conflict of interest.
Human and animals rights
This article does not contain any studies with human participants or animals performed by any of the authors.
Additional information
Publisher's Note
Springer Nature remains neutral with regard to jurisdictional claims in published maps and institutional affiliations.
Rights and permissions
About this article

Cite this article
Baur, D.G., Dimpfl, T. The volatility of Bitcoin and its role as a medium of exchange and a store of value. Empir Econ 61, 2663–2683 (2021). https://doi.org/10.1007/s00181-020-01990-5
Received:
Accepted:
Published:
Issue Date:
DOI: https://doi.org/10.1007/s00181-020-01990-5