
Using Artificial Intelligence to Estimate the Probability of Forest Fires in Heilongjiang, Northeast China

Key Laboratory of Sustainable Forest Ecosystem Management-Ministry of Education, School of Forestry, Northeast Forestry University, Harbin 150040, China
*
Author to whom correspondence should be addressed.
Remote Sens. 2021, 13(9), 1813; https://doi.org/10.3390/rs13091813
Submission received: 1 April 2021
/
Revised: 18 April 2021
/
Accepted: 1 May 2021
/
Published: 6 May 2021
(This article belongs to the Section Forest Remote Sensing)
Abstract
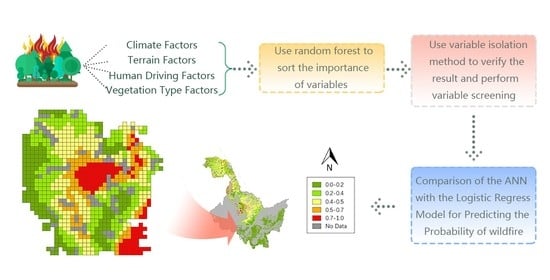
:Although low-intensity forest fires are a necessary part of healthy echo system, high-intensity forest fires continue to affect the diversity of forest ecosystems and species. Therefore, it is necessary to study the driving factors of forest fires and explore their possible locations and probabilities in complex forest terrain. In this article, we determined the relative influences of different types of factors on the occurrence of forest fires in Heilongjiang forest areas and compared the performance of artificial neural networks and logistic regression for wildfire prediction. By analyzing Heilongjiang forest fire data from 2002 to 2015 and constructing a model, we found that climate factors, topographical factors, and vegetation type factors play a crucial role in Heilongjiang’s wildfires. During the fire prevention period, temperature and wind speed have a more significant influence than other factors. According to the variable screening that we conducted, the model built by the variables that we used can predict 84% of forest fires in Heilongjiang Province. For recent wildfires (2019–2020) in most areas, we can use artificial neural networks for relatively accurate verification (85.2%). Therefore, artificial neural networks are very suitable for the prediction of forest fires in Heilongjiang Province. Through the prediction results, we also created a probability distribution map of fire occurrence in the study area. On this basis, we also analyzed the changes in the probability of natural fires under the weather changing trend, which can effectively aid in fire prevention and extinguishment.
1. Introduction
Forests, representing the world’s largest terrestrial ecosystem, are an essential component of the global ecosystem. They play a very effective role in maintaining soil and water and adjusting the climate. As the most important part of the global ecosystem, forests play a vital role in the gene pool, carbon storage, water storage, and even the entire planet’s ecological balance. Studies have shown that forest fires are a key factor disrupting the ecological balance of forests, disturbing the natural landscape, and destroying the ecological functions of forests [1,2,3,4]. When a severe forest fire occurs, the vegetation structure and ecological species in the forest may change due to the destruction of the forest ecological environment. Research shows that forest fires pose great hidden dangers to human health, the social economy, and public safety [5,6,7,8]. There are approximately 200,000 forest fires every year, which destroy 1.3% of the world’s forests. More than 10,000 forest fires occur every year in China, and the burned forest area reaches millions of hectares, accounting for 5% to 8% of the national forest area. With the continuous development of forestry in China and the emphasis on forestry in Northeast China, during the past 30 years the forest coverage of Heilongjiang has increased from 12% to more than 20% [9]. Multiple factors that cause forest fires (such as climate factors, terrain factors, and human driving factors) have led to increases in burned forest area. Therefore, forest fire prediction and management have always been difficult to solve [10]. It is crucial to understand where wildfires are more likely to occur as well as their drivers in complex landscapes such as the Heilongjiang forest area. Therefore, there is an urgent need for a forest fire prevention mechanism to effectively integrate forest management and fire suppression methods. It is necessary to understand the factors inducing forest fires and the location and probability of forest fires.
To achieve these goals, scientists have carried out much research to find the key driving forces of forest fires [11,12,13,14]. Previous studies have shown that forest fires are the result of the interaction of many factors [15,16]. The occurrence of forest fires is related to climate factors [17,18,19,20], terrain factors [21,22], human driving factors [23], and vegetation type factors [24]. However, some studies have found that the driving factors of fire differ among forest ecosystems. This result will lead to inconsistencies in fire predictions among regions [25,26]. Combining the factors that induce forest fires and predicting the probability of forest fires in different regions has become a popular research topic. Many researchers use logistic regression to predict forest fires [27,28,29]. In addition, studies have shown that fire driving factors have a nonlinear relationship with forest fires, so nonparametric models are more suitable than parametric models for forest fire prediction and variable analysis [30]. To date, many scholars have used artificial neural networks (ANNs) to classify fire hazard levels [31] and to assess ecological restoration after a fire [32,33], and some scholars have also used this method to study the area of fire spread. However, the combination of multiple forest fire factors and the use of ANNs to predict forest fires in China has not yet been supported by mature research.
Based on the above considerations, we developed an ANN model to predict the probability of fire in forest areas in Heilongjiang Province. The primary objectives of this research were to (1) analyze the main driving factors of forest fires in Heilongjiang Province, (2) predict the probability of wildfires in forest areas in Heilongjiang Province, and (3) assess traditional logistic regression and ANN performance in terms of forest fire probability in the study area to obtain a relatively reliable model. Such research can facilitate and deepen the understanding of forest fire management and optimize the allocation of fire and firefighting resources, as well as support other fire-related research.
2. Materials and Methods
2.1. Study Area
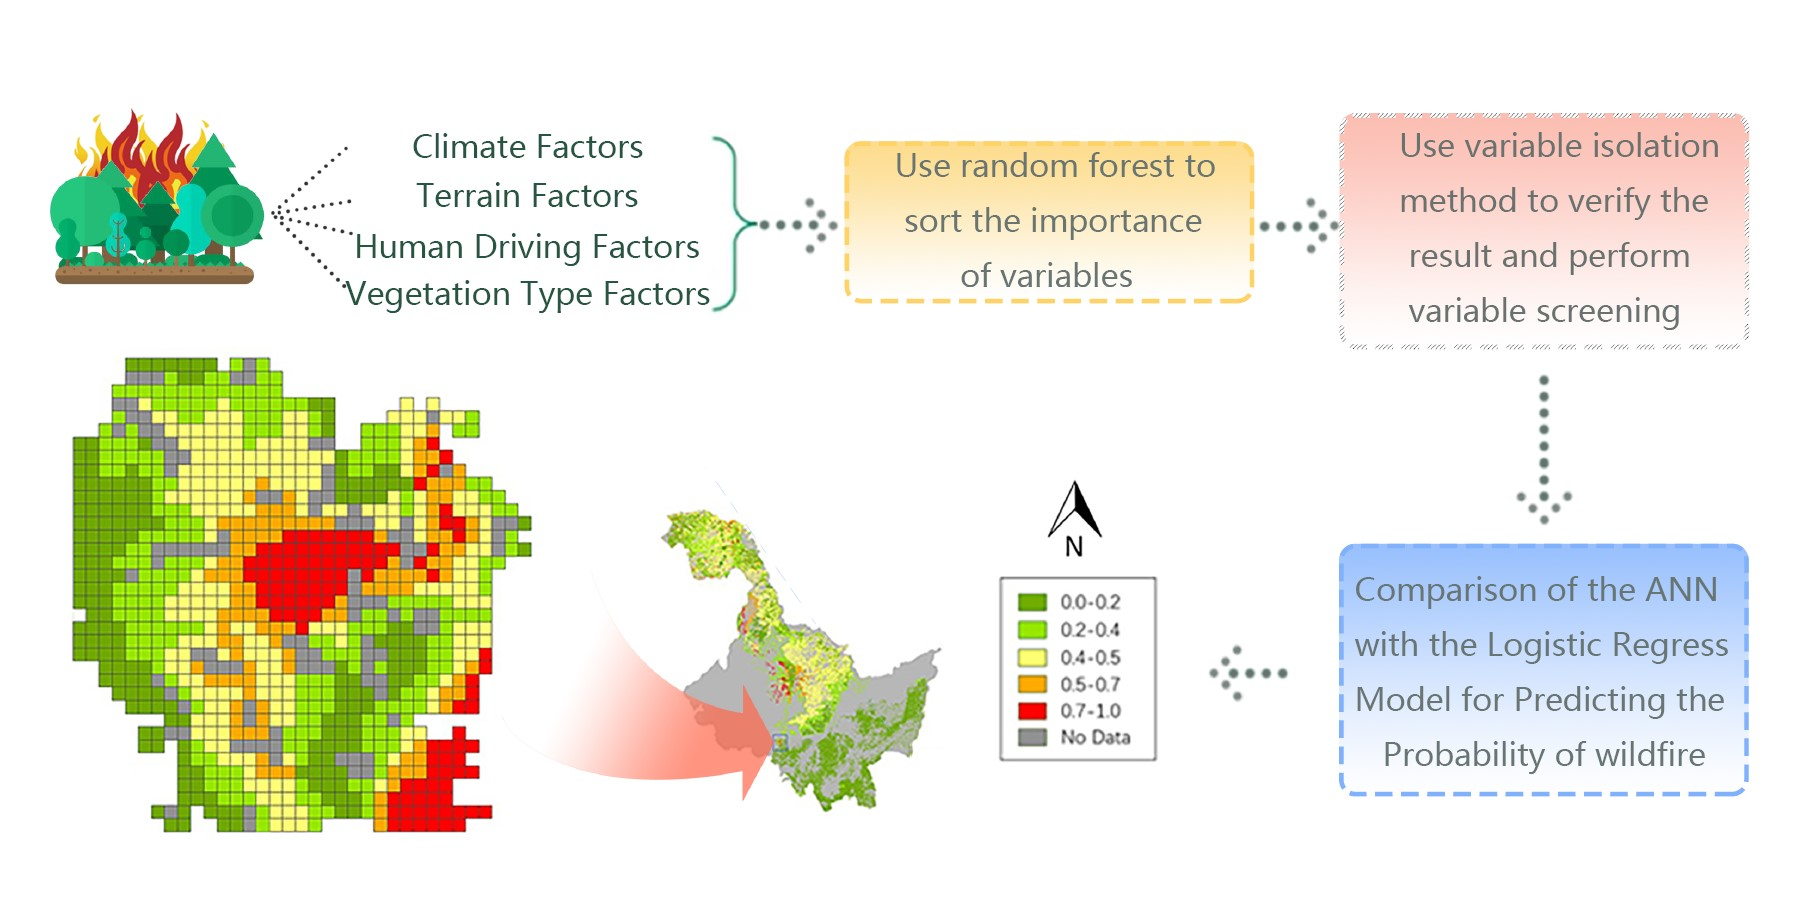
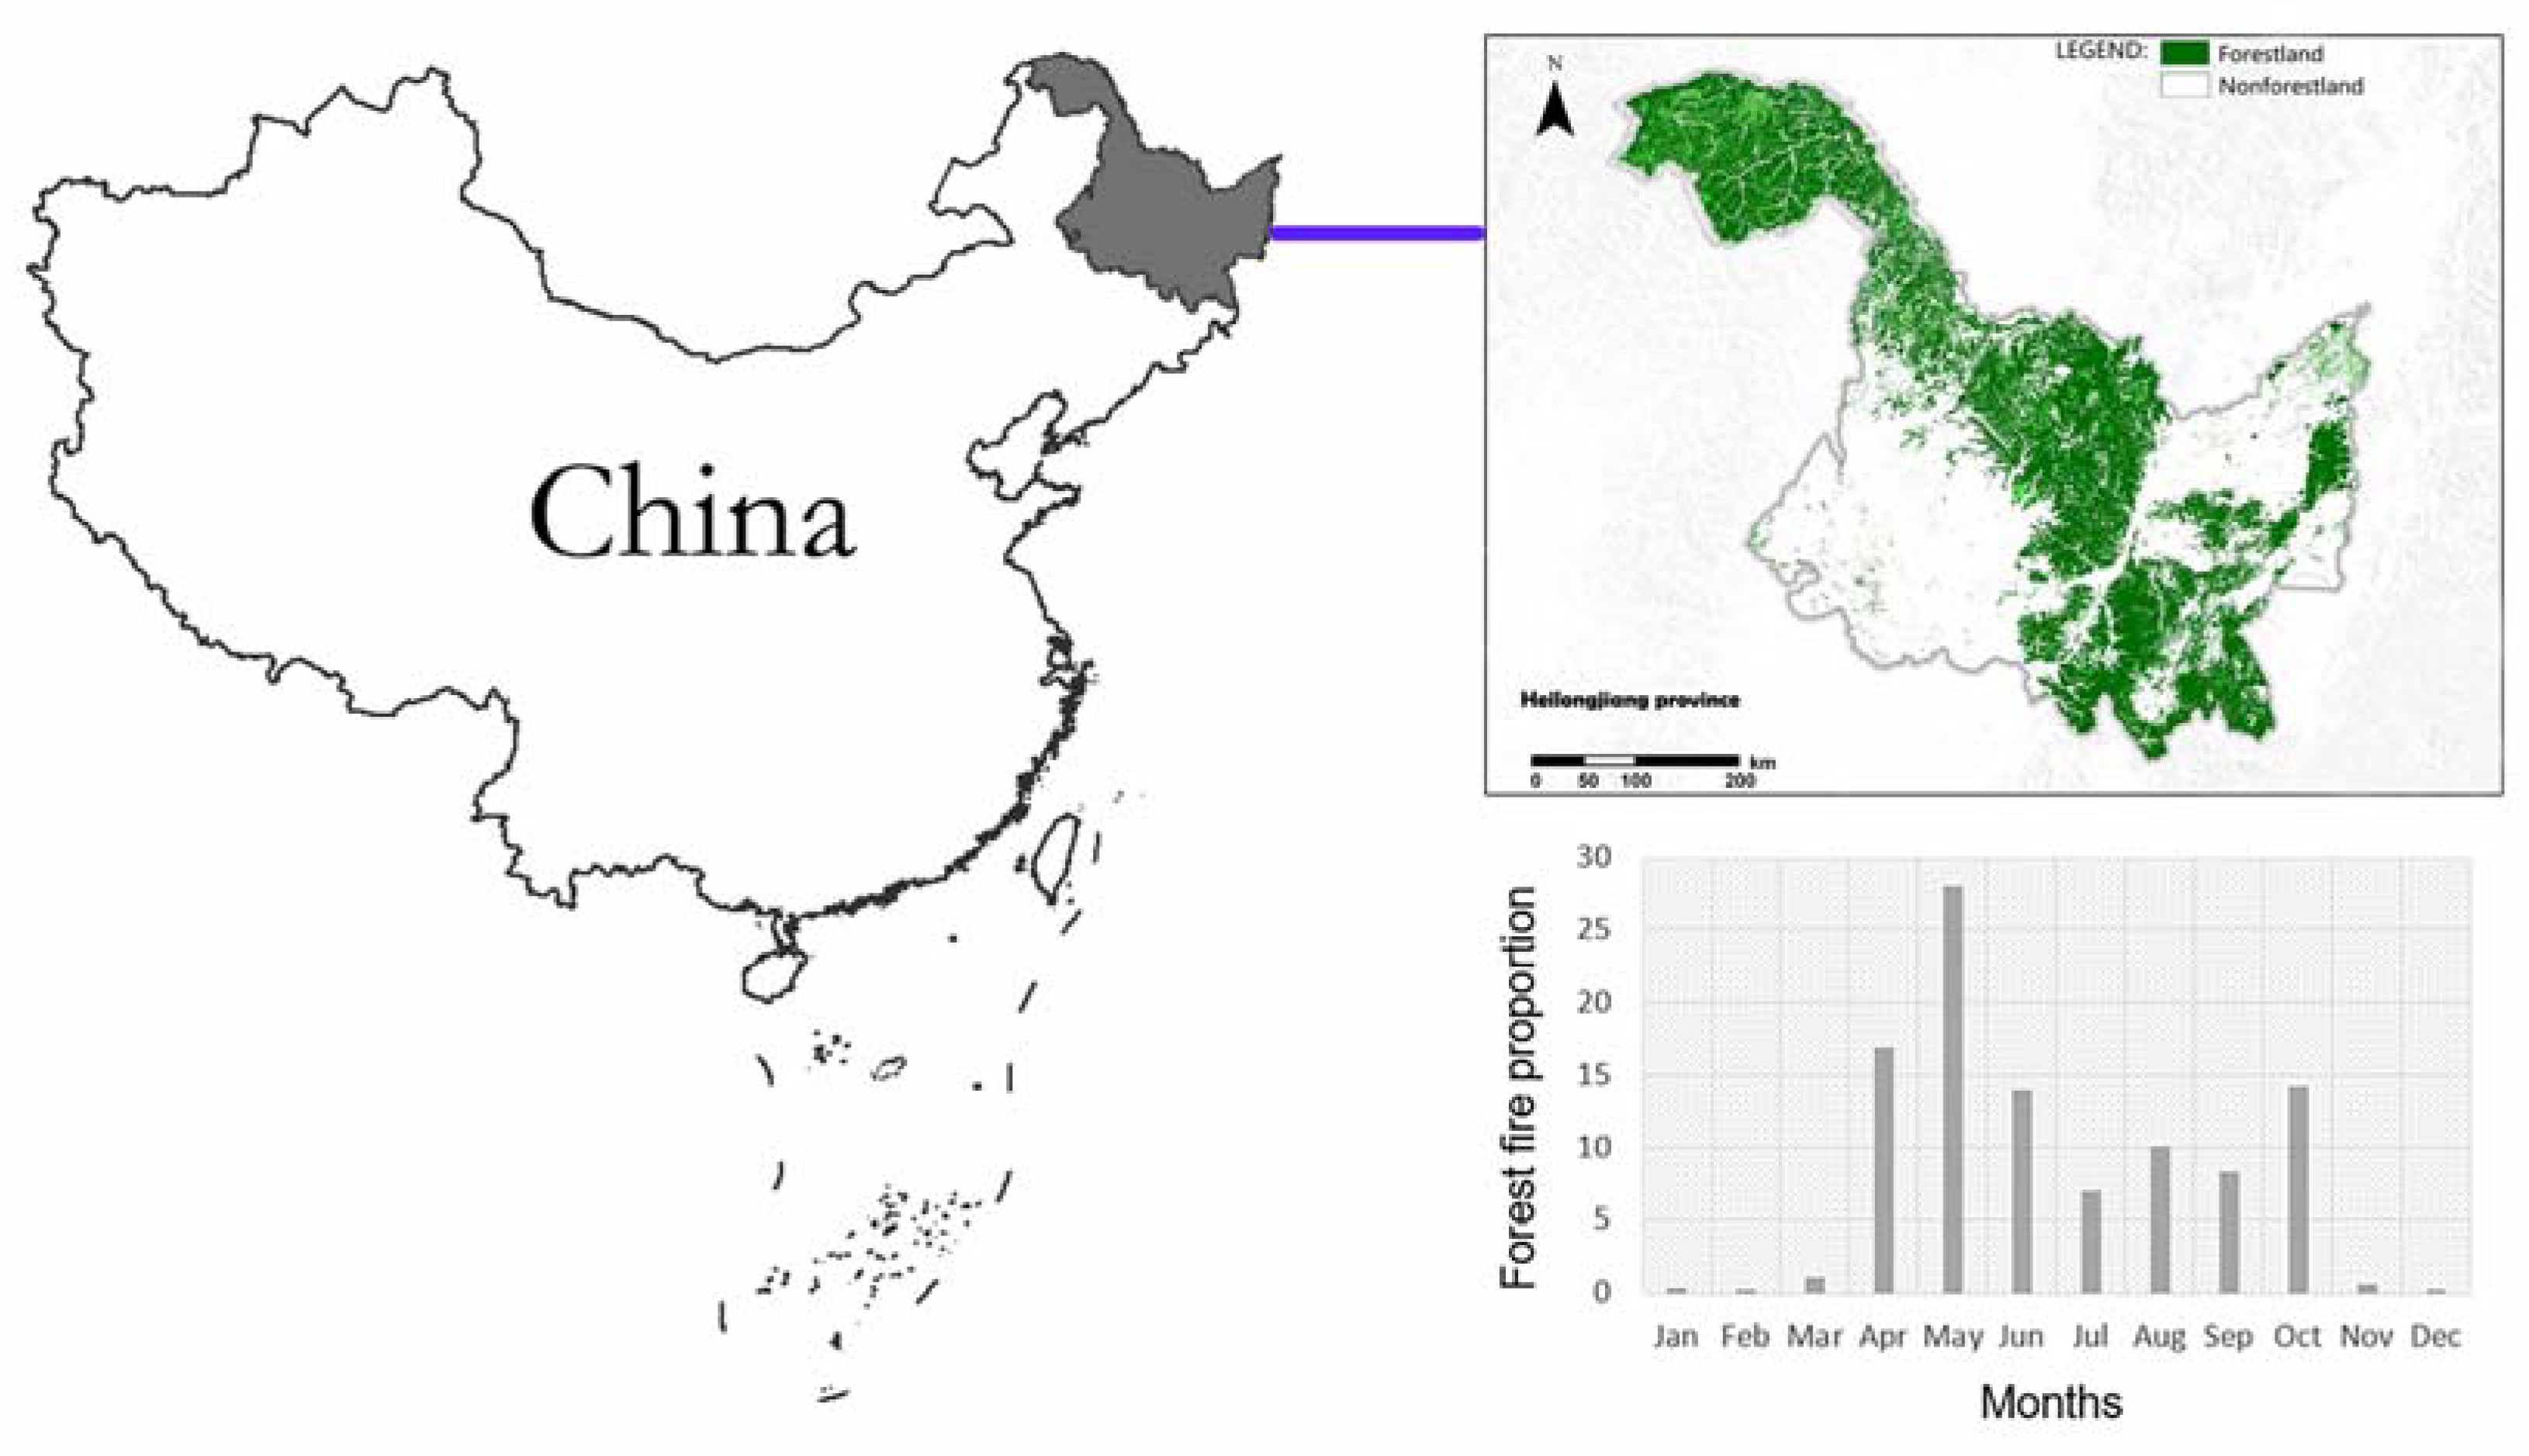
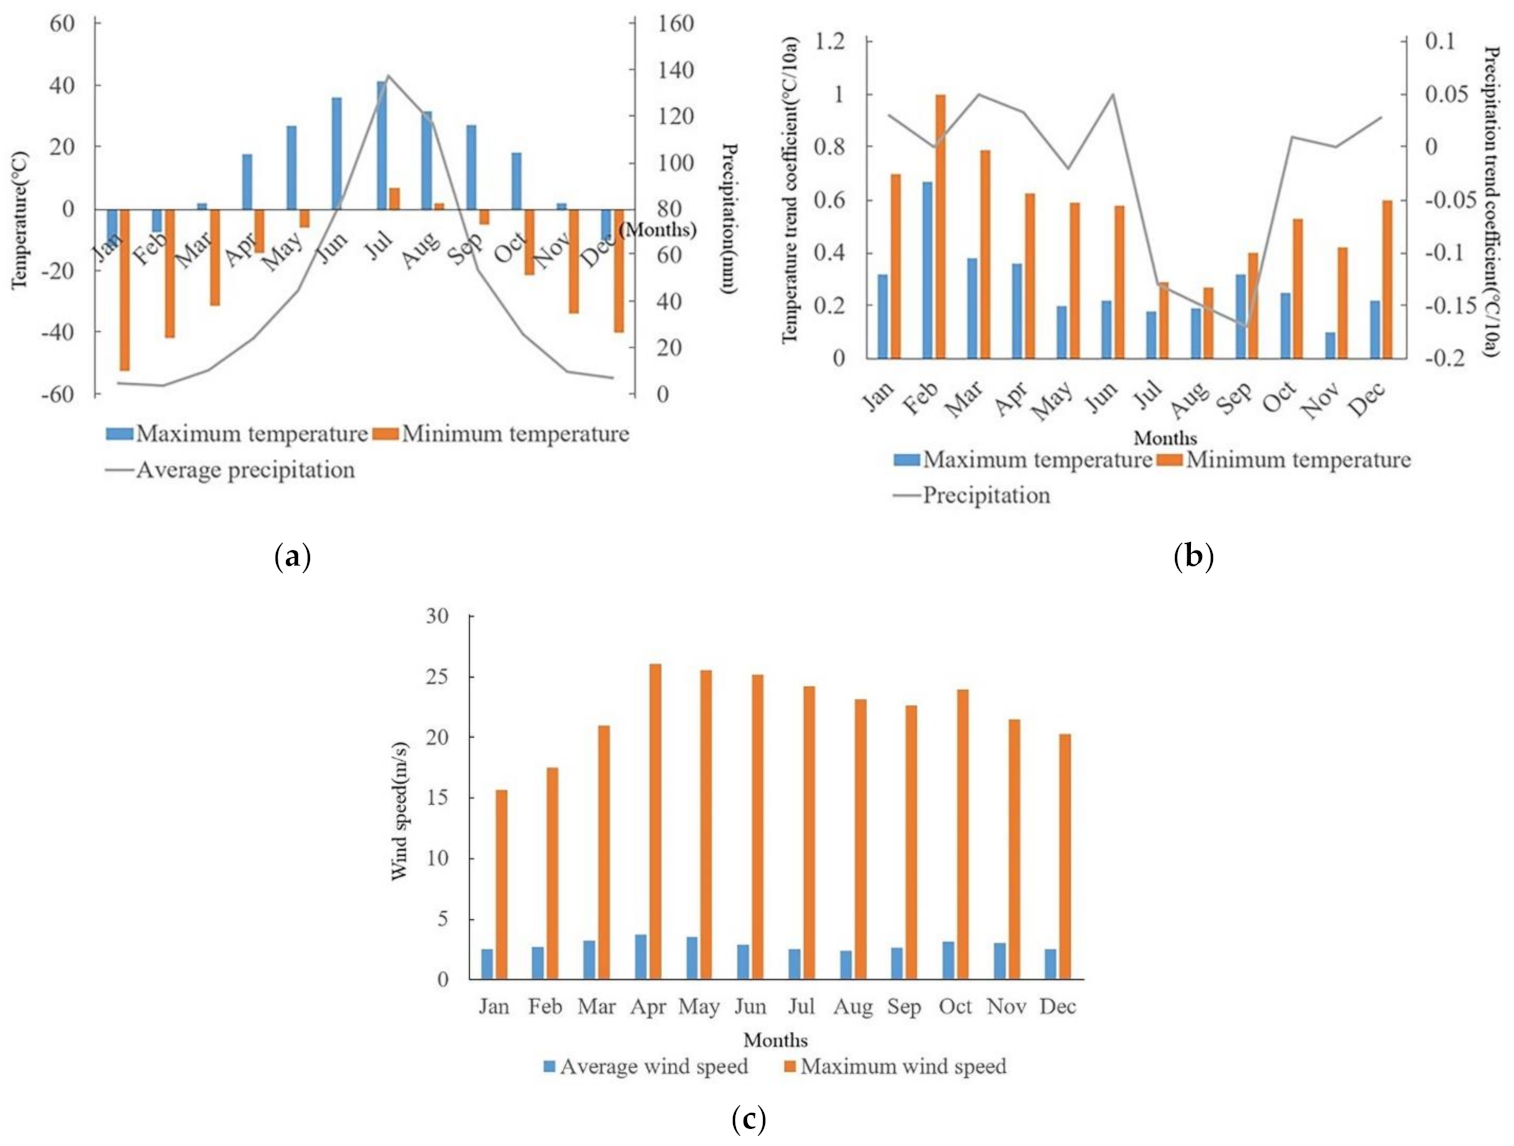
The research area (Figure 1) that we chose is Heilongjiang Province in Northeast China, which is between 121°11′ and 135°05′ east longitude and 43°26′ and 53°33′ north latitude, with a total area of 473,000 square kilometers. Heilongjiang Province has a monsoon climate typical of medium latitudes. We got the data provided by the China Meteorological Administration that the annual average temperature of forestland in the province is 4 °C, the extreme maximum temperature can reach 41.6 °C, the historical extreme minimum temperature reached −52.3 °C, and the annual precipitation is 500–600 mm (Figure 2). The forestland used for research in Heilongjiang has an area of 8.46 million hectares, accounting for 11.7% of the national state-owned forest area. The forest area is mainly divided into three parts: Daxinganling, Xiaoxinganling, and Changbai Mountain. According to a China Emergency Command report, the three northeastern provinces of China, especially Heilongjiang Province, are among the provinces with the most frequent forest fires. According to statistics on fire data from 2002 to 2015, forest fires in Heilongjiang Province mainly occur from March to October, with most occurring from April to June. The number of forest fires peaks in May each year (Figure 1). It can be seen from Figure 2 that the climate in Heilongjiang became very dry in May, the wind intensity increased (Figure 2c), and precipitation was approximately 72% lower than usual. Dry winds and low precipitation rates can cause fuel moisture loss in forests, which increases the likelihood of fire ignition and spread. At the same time, in Figure 2b, we found that the precipitation in October changed greatly, and the decrease in precipitation caused the number of forest fires to increase again. This is because the climate becomes drier, and the vegetation condenses over the course of a month. At this time, the dead combustible matter in the forest increases, making fires likely.
2.2. Response Variables
To explore the probability of forest fires and their possible locations, we divided the forestland in Heilongjiang Province into multiple grids of 1×1 km to explore the occurrence of forest fires within the grid. If a forest fire or part of a forest fire occurred in the grid, we considered the grid as burned (1). If there was no forest fire in the grid, we considered the study area grid as unburned (0). Annual forest fire disturbance data for Heilongjiang from 2002 to 2015 were collected to analyze the probability of forest fires, and the same data from 2019 to 2020 were used for independent verification to test the predictive ability of the model under new conditions.
The fire disturbance data from 2002 to 2015 were collected from the Heilongjiang Provincial Forestry Department and included the geographic coordinates of the fire points, the time of fire discovery, the time when the fire was extinguished, the burned area, the cause of the fire, and other information. Forest fire information from 2019 to 2020 was collected from the National Polar-orbiting Partnership (NPP) satellite, and a full set of information, such as the location of the fire, the time of fire discovery, and the burned area, was collected.
We download the corresponding Landsat satellite products according to the fire record. The resolution of the downloaded product is 30×30 m. The interference of forest fires will cause a large number of deaths of the surface vegetation of the forest ecosystem. In remote sensing images, the reflectivity of the near infrared (NIR) band is reduced, and the reflectivity of the mid-near infrared (SWIR) band is increased [34,35]. Therefore, we use the Normalized Burning Index (NBR) in satellite remote sensing products to extract the burned area and outline of the forest fire. NBR was first proposed by Lopez-Garcai and Case-lles [36]. The theoretical value of the NBR index ranges from 1 to −1, which is negatively correlated with forest fire intensity.
NBR = (NIR − SWIR)/(NIR + SWIR)
2.3. Choice of Explanatory Variables
When using ANNs to study fire occurrence in the study area, the most critical step is finding a suitable combination of explanatory variables and using the data set to predict and analyze fire occurrence. According to previous studies, there are many factors that cause wildfires [26,37,38,39]. A forest fire results from a combination of many factors. Therefore, detecting potential relationships between the factors influencing forest fires in Heilongjiang is very important for exploring the probability of forest fires in the research area.
We mainly considered four different types of variables (Table 1). First, we obtained climate factor variables from the China Meteorological Data Network. In forests, the moisture content of combustibles is closely related to climate factors [16,40]. The moisture content of combustibles affects the speed at which the combustibles reach the ignition point and how much heat the combustibles release, which directly affects the occurrence, spread, and intensity of forest fires. Therefore, we collected data on average daily surface temperature, average daily wind speed, average daily air temperature, average daily relative humidity, minimum daily surface temperature, minimum daily air temperature, maximum daily surface temperature, maximum daily air temperature, maximum daily wind speed, minimum daily relative humidity, daily precipitation, and daily average vapor-pressure. Second, we downloaded digital elevation model (DEM) data for the study area with a resolution of 30×30 m from the Geosaptial Data Cloud and collected terrain factor variables from the data set. For forests, topographic differences will lead to differences in wind, water balance, and heat transfer among locations. Slopes differ in their water retention times after rainfall. The greater the pitch, the shorter amount of time the water is retained. Moisture is easy to lose, and fires easily occur. The greater the slope is, the faster the fire spreads [41,42]. Slope direction affects the amount of solar radiation received. Southern slopes have the highest temperature, and the combustible materials on such slopes are dry and flammable [43,44]. According to previous studies, forests at higher altitudes are less prone to fires [45]. Therefore, we collected data for three variables: altitude, slope, and aspect. For human drivers, we referred to previous studies [46,47,48]. We downloaded a basic geographic database of the research area from the National Catalogue Service for Geographic Information and collected and analyzed whether there were railways, roads, residential points, and inhabited places in the grid area. The use of humanmade fires, under unfavorable weather conditions, can lead to runaway, flying, and splashing fires that then trigger forest fires. Human influence may also lead to changes in the geographic location of fires and affect the frequency and intensity of fires in forests [11,49,50,51,52]. Finally, we analyzed and collected the vegetation coverage type variables in the study area in the “Vegetation Map of the People’s Republic of China” obtained from the Institute of Botany, Chinese Academy of Sciences. Vegetation type influenced the effects of time-since-fire and fire frequency on fire severity, suggesting that differential fire feedbacks [24]. We divide the vegetation of the study area into nine categories: coniferous forest, broad-leaved forest, mixed coniferous and broad-leaved forest, cultivated vegetation, meadow, shrub, grassland, swamp, and alpine vegetation.
2.4. Preprocessing and Model Selection
For the study area of forestland in Heilongjiang Province, we need to use ANNs to build models in order to predict the probability of forest fires. To reduce implicit transformations in the model and eliminate outliers in raw data to improve accuracy, data preprocessing is the first crucial step in machine learning. The preprocessing of the data includes the normalization of the full data set and data set segmentation. We homogenized the entire data set and standardized the data to the interval 0 to 1. Before putting the data set into the model for fitting, we randomly divided it into two parts. One set (70% of the data) was used for model training. The other set (30%) was used for model verification. Since the number of grids without forest fires was much greater than the amount of data with forest fires, the data were seriously unbalanced. Therefore, we randomly reduced the forest fire data categorized as (0) until the amount of data was consistent with that for forest fire data categorized as (1). This prevented under-sampling. Finally, the training set was used to train the model algorithm, and the test set was used for its verification. In the selection of the model, we first chose to use the random forest package in the R environment to calculate the importance of each feature variable. This package can calculate the importance of each feature, sort the features, and select the important features. We also isolated variables to verify the ranking results of the random forest.
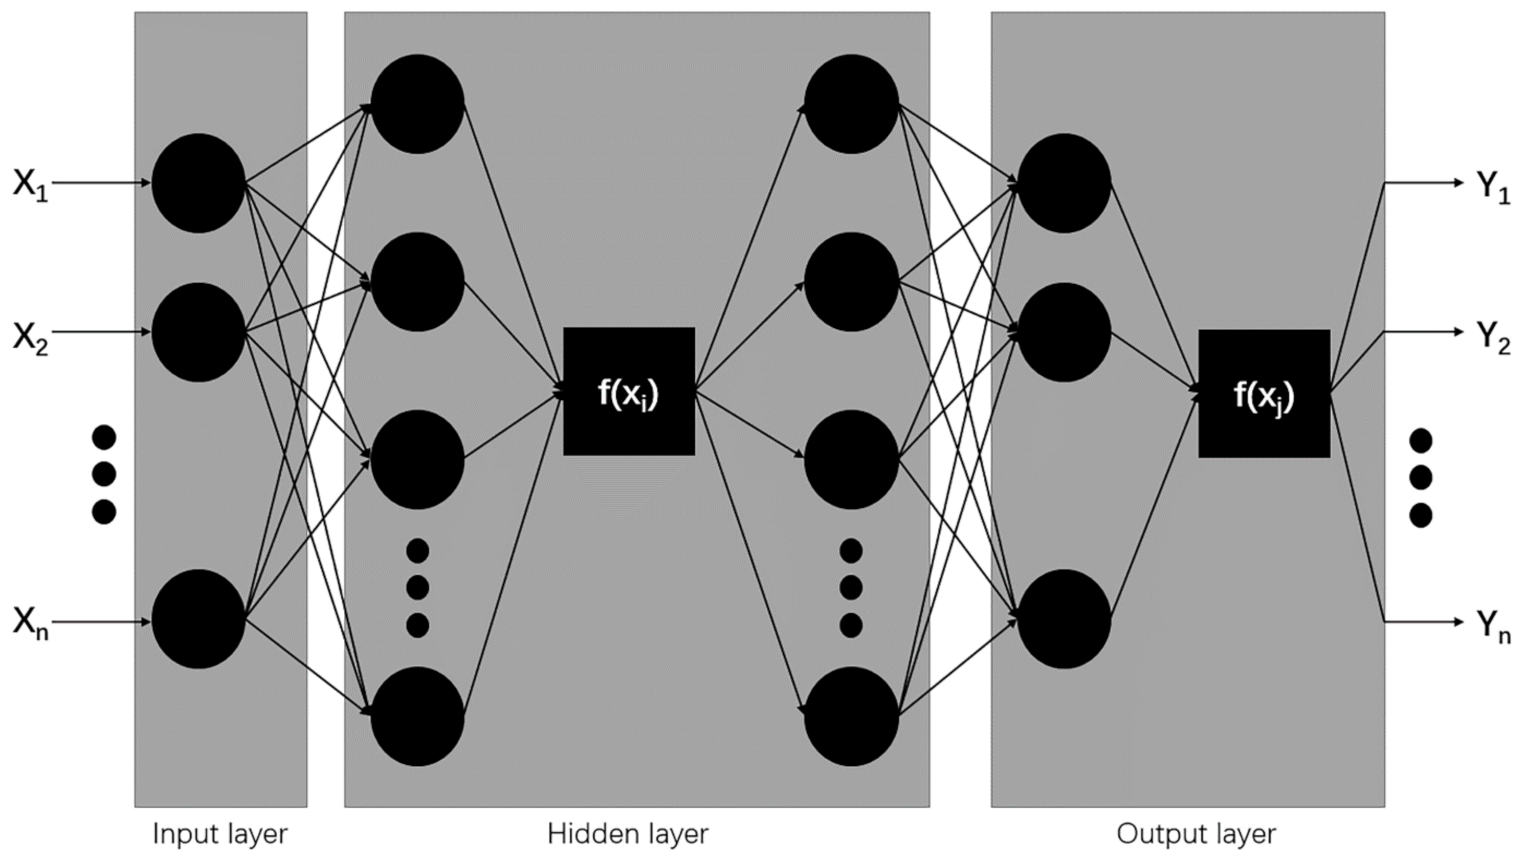
To predict the probability of forest fires in the study area, we used ANNs to train the model. ANNs are inspired by the human brain [53]. These networks can calculate the importance of different input data through built-in algorithms. ANN model training is the process of selecting the optimal weight value for the input data. In order to simplify the complexity of the artificial neural network model, reduce the training time of the neural network, and avoid over-fitting. We use a neural network with two hidden layers to train the model (Figure 3) while relying on increasing the number of hidden layer nodes to obtain a lower error. The input layer of this multilayer perceptron assigns the input data to each neuron in the hidden layer. Each neuron’s value in the hidden layer is multiplied by a weight, and then these weights are added together to produce a combined value. The weighted and combined values are passed to a fixed function that outputs a value, which will be assigned to the output layer. Each neuron’s value in the output layer is multiplied by the weight, and these weights are then added together to obtain a new combined value. This combined value is passed to a new transfer function to generate a new value, which is the output result of the neural network.
We also created a logistic regression model. The performances of the ANN and logistic regression for wildfire prediction were compared.
For forest areas in Heilongjiang Province, we used the “keras” package in Python to build a multilayer artificial neural network model. The “relu” function was used for the hidden layer in the middle. The “relu” function is also called the modified linear unit, which is a commonly used activation function in artificial neural networks and has the characteristics of fast convergence. The “sigmoid” function was used for the output layer. The “sigmoid” function can be used to output the interval from 0 to 1. We used an ANN similar to the one shown in the figure above to predict fires in Heilongjiang Province (Figure 3).
2.5. Model Performance
To evaluate model performance, we chose to use the fire disturbance data test set from 2002 to 2015 (accounting for 30% of the data set) for verification and the forest fire data of Heilongjiang Province from 2019 to 2020 to independently verify the model, and the predictive ability of the model was tested under the new time point. The results were compared and verified as a function of their accuracy. The ANN model was verified by cross-validation. Model calibration was performed 10 times on random subsamples of the training and test sets, and the metric was estimated for each subsample.
Finally, we developed a logistic regression model using all data sets from 2002 to 2015. We compared the prediction accuracy of the logistic regression model in the study area with that of the ANN model, and we also use the logistic regression model to predict forest fire probability from the new data set from 2019 to 2020. We developed a probability map of forest fires based on the prediction results of the ANN model.
3. Results
3.1. Variable Importance Analysis
We use random forest to observe and analyze the importance of different variables. The method of calculating the importance of feature variables in random forests is as follows: first, for each decision tree in the random number forest, use the corresponding OOB (out of bag data) data to calculate the out of bag data error (errOOB1). Then, noise interference is randomly added to all the sample characteristics of the out-of-bag data OOB, and the new out-of-bag error (errOOB2) is calculated. If there are N trees in the random forest, the importance equation of this feature is as follows.
Importance = ∑(errOOB2 − errOOB1)/N
This is because after random noise is added to the feature, the accuracy rate outside the bag will be greatly reduced, indicating that the importance of the feature is higher. To achieve this goal, we divide the research data into two parts. Part of the data (70%) was used to train the model; the other part (30%) was used for model testing and verification.
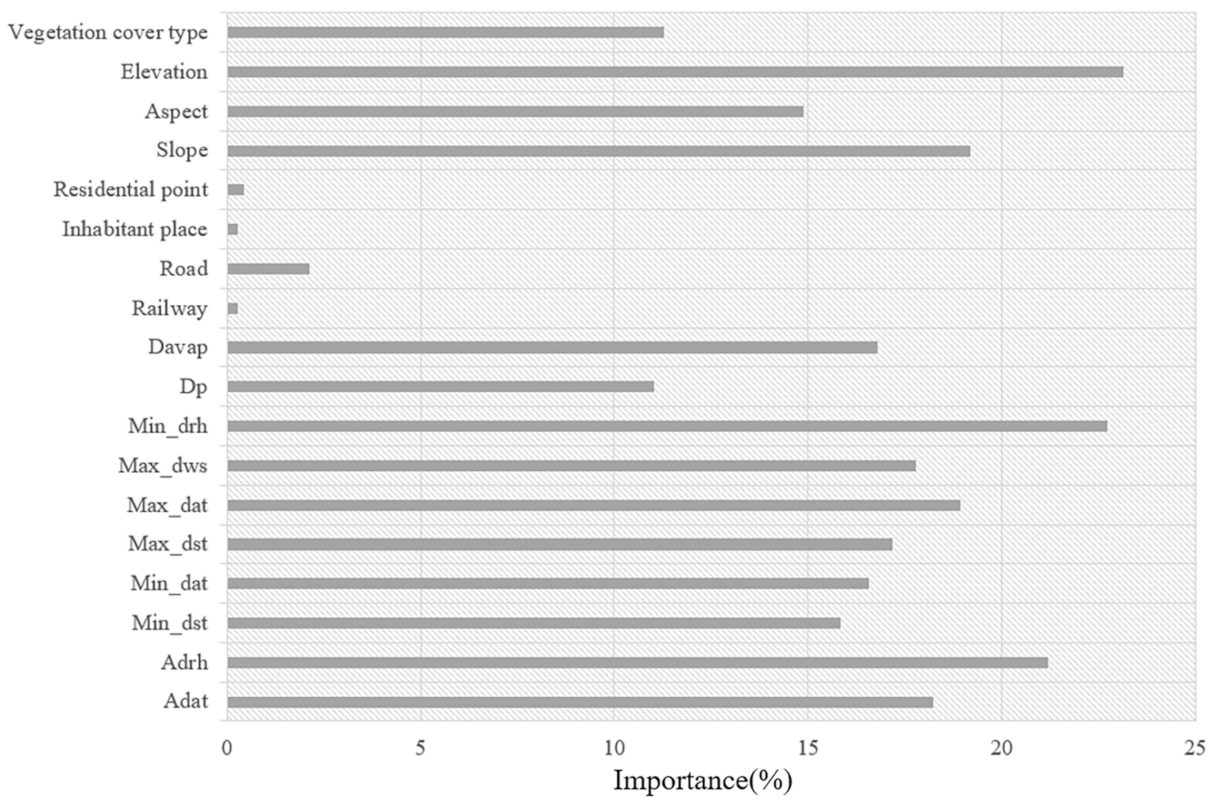
The figure shows that the daily average relative humidity and vegetation cover type are important variables for fires in the Heilongjiang forest area (Figure 4). However, its influence on ignition in the study area is much lower than that of the terrain factor altitude. Compared with these factors, residential areas, inhabited places, and railways, all of which are human driving factors, are less important. After we removed these three variables, the model’s prediction accuracy increased from 82.5% to 84.4%. We also used variable isolation methods to verify the results and perform variable screening.
3.2. Comparison of the Effects of Different Climatic Factors on the Occurrence of Wildfires in the Study Area
We used the selected meteorological factors in the model for model fitting. We chose to use the method of isolating variables to evaluate the importance of each variable. To achieve this goal, we created 12 intermediate models for the study area. Based on complete samples and complete data sets, the neural network’s accuracy in predicting the probability of wildfires in the study area was 82.5%. Through model isolation, we found that average daily relative humidity was the most important weather variable in Heilongjiang Province (Table 2).
3.3. Comparison of the Influences of Terrain Factors on Forest Fires in Heilongjiang Province
We also isolated variables to observe the importance of different topographic variables in the study area. Through the model, we found that all three variables were significant for forest fires in Heilongjiang Province (Table 3).
3.4. Comparison of the Influences of Human Factors on Fire Occurrence in the Study Area
Through the isolation model, we found that the human driving factors had little influence on forest fires in the study area. However, based on the prediction accuracy (82.5%) of the complete data set, we removed the three variables that were not highly correlated (i.e., the presence of railways, the presence of residential points and inhabited place), leaving the relatively important variable of whether there were roads (Table 4).
3.5. Comparison of the Effects of Vegetation Cover Types on Forest Fires in Heilongjiang Province
Through the isolation model, we found that the vegetation cover type variable has an important effect on causing forest fires in Heilongjiang forest areas (Table 5). Excluding this variable will lead to a decrease in the accuracy of the model.
3.6. Prediction of Wildfire Occurrence Probability by ANNs
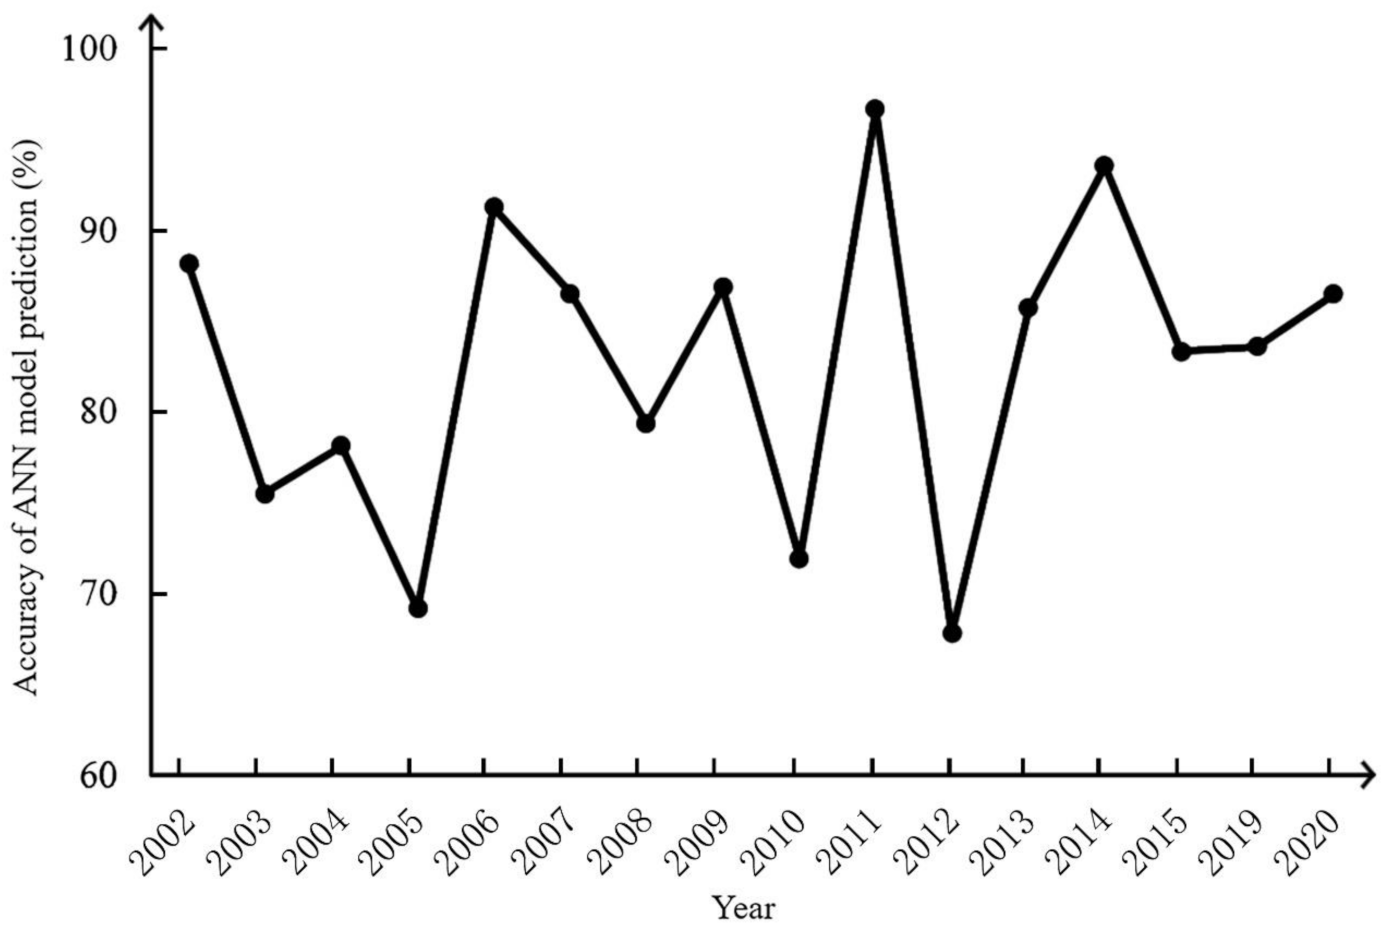
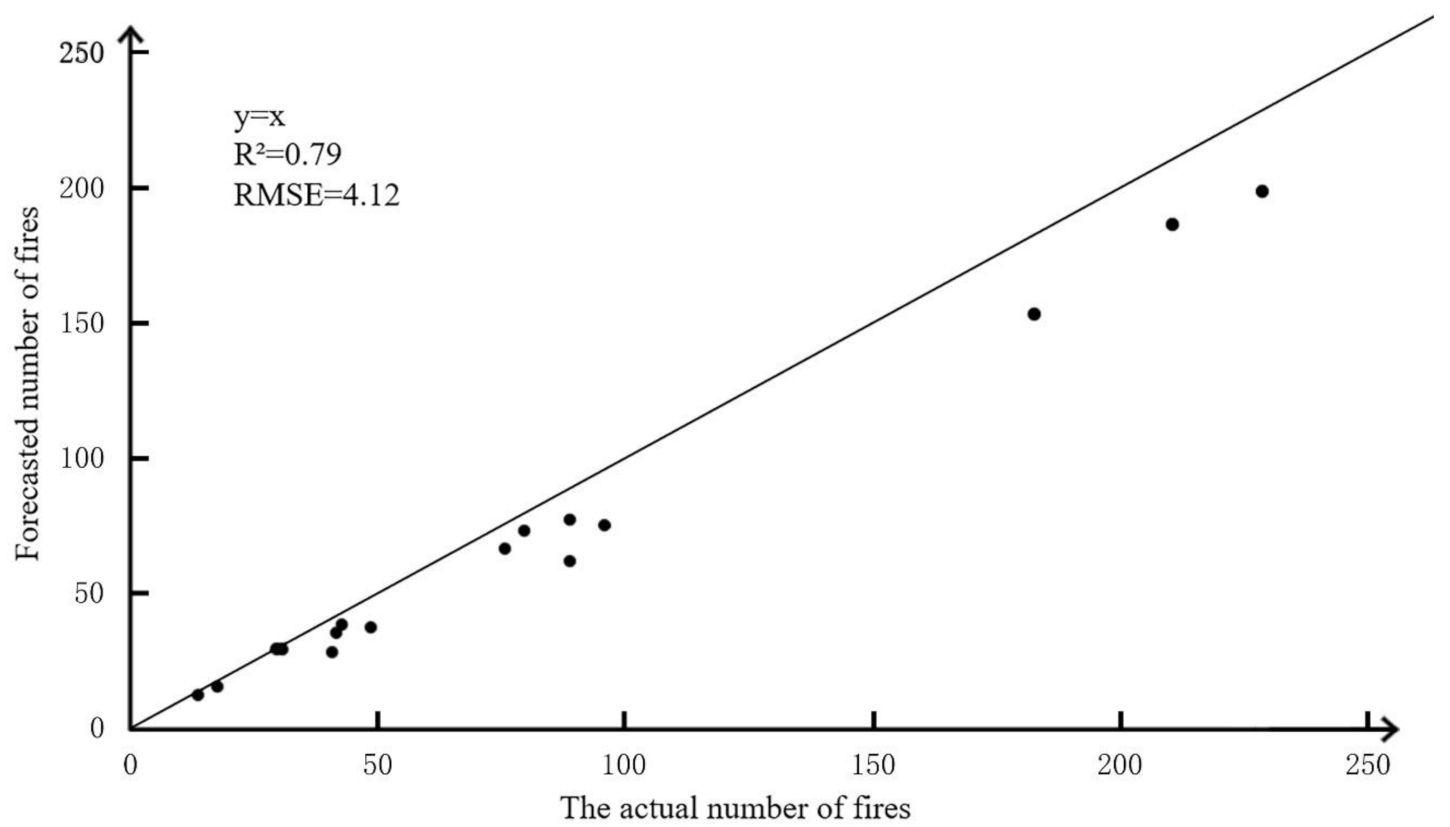
We use ANNs to predict the probability and location of wildfires in Heilongjiang forest areas. The model predicted wildfire probability in the research area with high precision and excellent, stable performance. As shown in Figure 5, the ANN predicted forest fires from 2002 to 2015 and from 2019 to 2020. As shown in Figure 5, the prediction accuracy for 2005 and 2012 is relatively low. Figure 6 shows the comparison between the number of fires predicted by the ANN and the number of real fires.
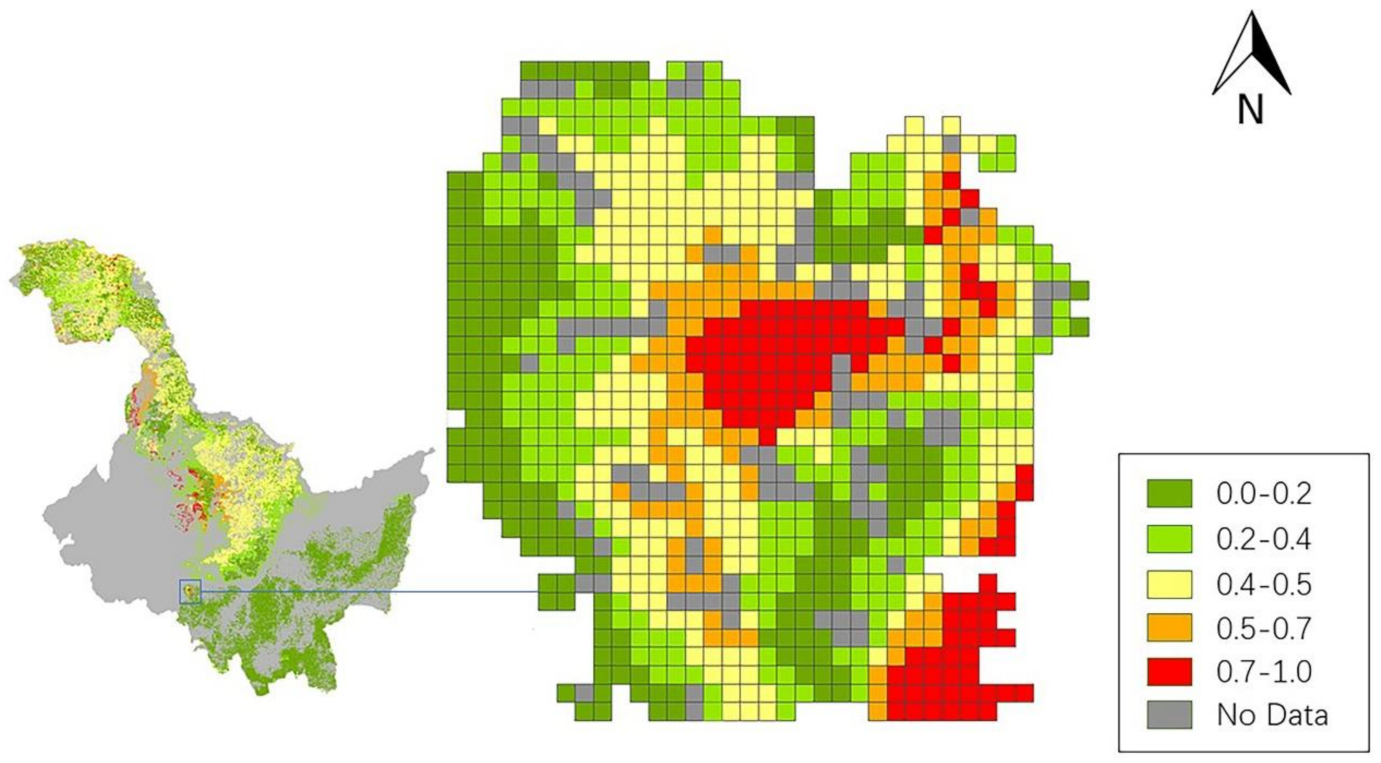
Based on the prediction results, we also created a fire map. The map shows the fire probability in each cell in the forest of Heilongjiang Province on 18 April 2020, and the fire probability in each cell of the Binxi Forestry Bureau of Heilongjiang forest farm (Figure 7). Interestingly, the prediction results show that the probability of wildfires increases from the center of the Heilongjiang forest area to the surrounding area of the forest. In particular, the probability of forest fires in the Xiaoxinganling forest area is significantly greater than that in the Changbai Mountain and Daxinganling areas. Summer weather conditions cause the temperature, dryness, and wind speed to rise sharply, leading to a high probability of wildfires in the study area. The lowest probability of forest fires occurs in the Changbai Mountain area. This is because the surrounding area is low in altitude. Moreover, our ANN model also accurately predicted isolated hotspots. For example, the model successfully predicted the forest fires in Dongning city, which is in the southeastern part of Heilongjiang Province, on 18 October 2019; eastern Russia; and the forest fire in Heihe City Environmental and Ecology Bureau on 9 April 2020.
3.7. Comparison of the ANN Model with the Logistic Regression Model for Predicting the Probability of Wildfire
We developed a logistic regression model and compared its performance with that of our ANN model. As shown in Table 6, whether from 2002 to 2015 or from 2019 to 2020, the prediction accuracy of the ANN was higher than that of the logistic regression model.
According to real data, the prediction accuracy of the entire region’s neural network model is higher than that of the logistic regression model. The neural network model better predicted the probability of fire occurrence in each unit.
3.8. Analyze the Probability of Natural Fires under Weather Changes
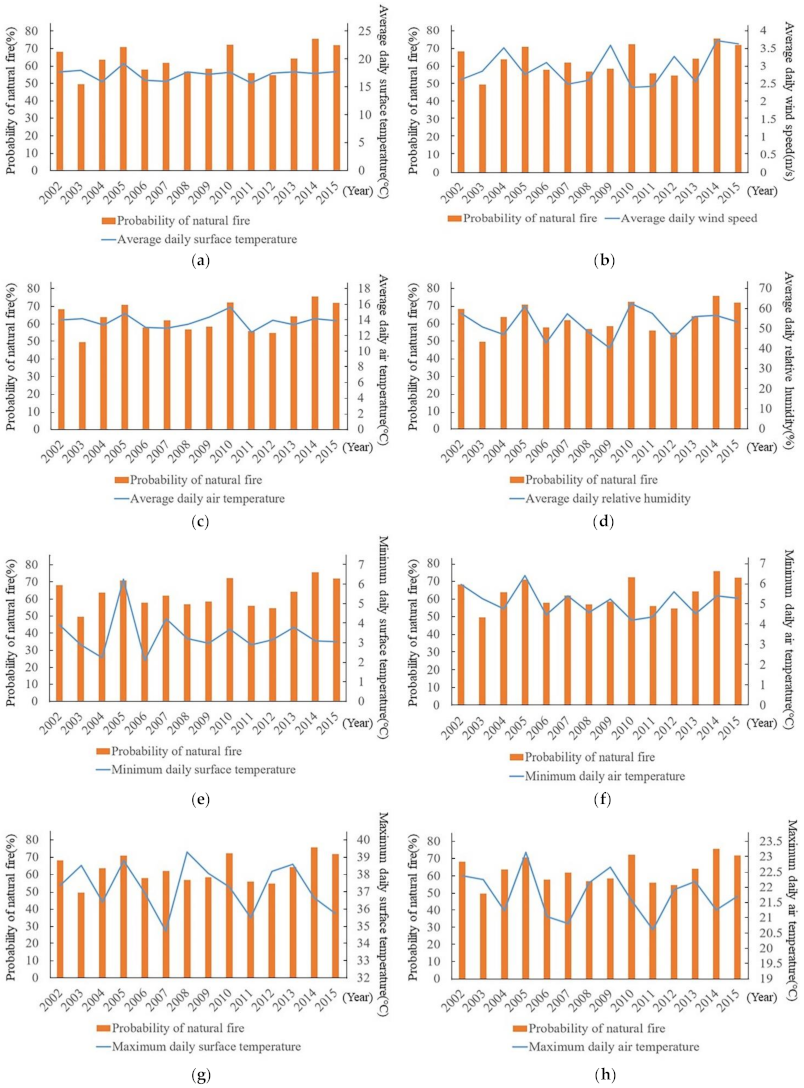
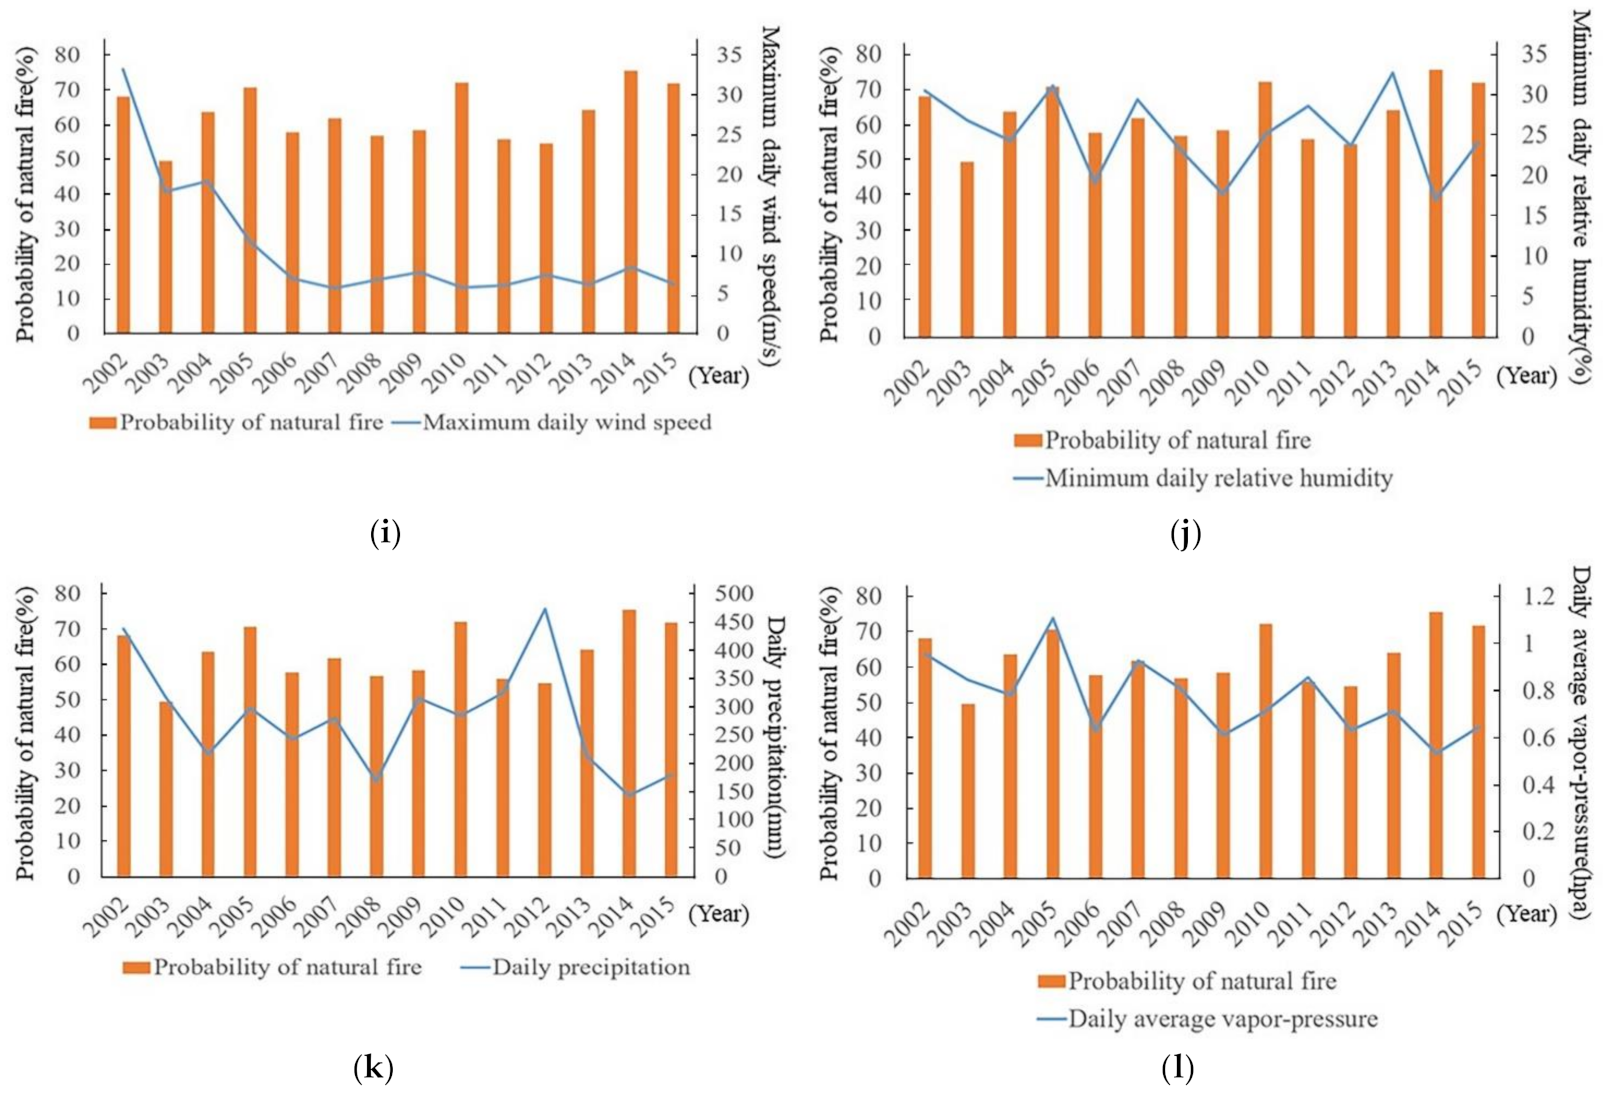
We also analyzed the changes in the probability of natural fires caused by 12 climatic factors that change over the years (2002–2015). As shown in Figure 8, we separately counted the average values of different climatic factors each year (average daily surface temperature, average daily wind speed, average daily air temperature, average daily relative humidity, minimum daily surface temperature, minimum daily air temperature, maximum daily surface temperature, maximum daily air temperature, maximum daily wind speed, minimum daily relative humidity, daily precipitation, and daily average vapor-pressure) and compared with the trend of the probability of natural fire.
4. Discussion
In the context of frequent forest fires, it is crucial to use combination of multiple forest fire factors and artificial neural networks methods to understand the causes of forest fires and predict them [32,54]. In this study, the main objectives were to use ANNs to understand the probability of fire in Heilongjiang Province forest areas and identify the factors that cause fires. Our ANN model shows that Heilongjiang woodland fires are affected by biophysical and human driving factors. Among the biophysical driving factors, three topographic factors, namely, slope, aspect, and altitude, all significantly affect the probability of forest fires. This may be because in Heilongjiang woodland, there are few wild plains where vegetation is flammable. Most places are mountainous or steep slopes. However, human driving factors were not individually important for predicting the probability of forest fires. Our results are consistent with those of previous studies [38,55]. Perhaps this is mainly because the study area is far from cities. However, compared with other human driving factors, roads are more important in Heilongjiang forest areas.
In the past, most scholars used the least squares method to predict forest fire probability [56]. The results of our research are similar to other research results [16,57]. Previous researchers used Ripley’s K (d) function to analyze the spatial pattern of fires that occurred in two different ecosystems in Daxinganling and Fujian [30]. A logistic regression model was used to analyze the related factors affecting fire occurrence in these two research areas. The authors found that the driving factors had nonlinear relationships with forest fires and proposed that nonparametric models may be more suitable than parametric models for explaining the response variables.
For forest fires in Heilongjiang Province, ANNs have strong predictive capabilities. For the fire data from 2002 to 2015, the prediction accuracy of the ANN was 84.4%. For the fire disturbance data from 2019 to 2020, the prediction accuracy of the ANN was 85.2%. However, we found that the prediction accuracy in 2005 and 2012 was poor. This is because the number of forest fires caused by lightning strikes in 2005 accounted for 47.57% of the annual number of forest fires. Because the randomness of lightning-driven fires is too strong and detection is difficult, the prediction of lightning-driven fires has become difficult. In 2012, forest fires caused by farmers burning wasteland accounted for 38.29% of the annual forest fires. We also found that the number of forest fires in the study area in 2002 and 2005 increased significantly. Through our analysis, we found that abnormally high temperatures occurred in 2002 and 2005. The precipitation in these two years was lower than that in others. In 2005, the average relative humidity reached the lowest level in history (Figure 8e,f). In the figure, we can find that the daily average vapor-pressure decreased year by year (2011–2015), and the probability of natural fires also increases (Figure 8l). Because of the reduction in the area of forest land in the central and northwestern parts of Heilongjiang Province from 2002 to 2010, part of the forest land has been converted into cultivated land, grassland, and unused land. Human disturbance has led to a small increase in the frequency of forest fires in some areas.
Based on the prediction results, we also created a forest fire probability map (see Figure 5) for Heilongjiang Province. The forecast map and forecast results intuitively show that the probability of forest fires in Xiaoxinganling is significantly higher than that in the other two forest areas. In addition, the probability of fire in the forest area of Changbai Mountain is very low. This is because the elevation of the Xiaoxing’an Mountains is low, and the temperature and surface temperature are relatively high [58]. The Changbai Mountain area is high in altitude and has sufficient rainfall, and the local nature protection management center manages it properly [59].
Compared with the high prediction accuracy of ANNs for forest fires, the prediction accuracy of logistic regression (see Table 5) was only 64.3% (2002–2015) and 66.2% (2019–2020). Thus, logistic regression analysis has poor performance in predicting forest fires in Heilongjiang Province. This is consistent with the results of previous studies. For example, studies have shown that in Spain, compared with ANNs (prediction accuracy of 76%), logistic regression is less accurate (prediction accuracy of 66%) [28]. In Italy, researchers divided the study area into two parts: mountains and islands. The prediction accuracy of the ANN (82% and 76%) was higher than that of logistic regression (78% and 65%) [60]. When predicting the probability of fire, researchers in Iran found that compared with that of an ANN (92.3%), the accuracy of logistic regression was low (only 50.84%) [61].
The ANN accurately predicted the forest fire that occurred in the Hegang Shilihe Forest Farm in the northeastern part of Heilongjiang Province on 11 October 2011. The burned area of this forest fire reached 96 hectares. However, the forest fire that occurred next to the 212 Farm in Jixian County, Shuangyashan city, on 12 August 2020, was not accurately predicted. This may be because the forest area is too small and too close to a residential area. However, few human driving variables were input into the ANN model, which may have led to deviations in the predictions.
One limitation of this study is the random spatial variability of forest fire phenomena [25,26]. For the forest areas in Heilongjiang Province, the main causes of forest fires are weather factors and topographic factors. However, in other research areas, the main factors causing fires are entirely different. For example, previous studies have revealed that the primary forces driving forest fires in the Baihe Forestry Bureau in Jilin Province, China, are topographical factors and human factors [62]. This is consistent with previous research conclusions [25]. Therefore, different strategies for predicting and eliminating forest fires must be formulated for different forest ecosystems to achieve modern forest management.
A set of models cannot be used to predict the probability of forest fires in different forest ecological environments. For different regions, it is necessary to combine practical experience and new theoretical analysis to analyze the importance of different variables and make predictions. For this study area, we obtained prediction results by inputting variables into the artificial intelligence model that we created and created a fire probability map of forestland in Heilongjiang Province. Forest managers can use such forecast results and maps to conduct forest management and fire intervention to avoid human and economic losses. Such results are key for guiding modern forest management.
5. Conclusions
In this study, we input four types of variables, namely, climate factors, terrain factors, human driving factors, and vegetation cover type, into the ANN that we created to predict fires in Heilongjiang forestland. The research results showed the high accuracy of ANN prediction. At the same time, we created a logistic regression model and compared its performance with that of the ANN. Experimental results showed that the prediction accuracy of the ANN in the study area was significantly higher than that of the logistic regression model. They also showed the reliability and high performance of the ANN for Heilongjiang forest fire prediction. We found that topographical factors and climate factors were the main factors that caused forest fires in the study area. These results can help the forest management department find and extinguish fires.
Due to the continuous development of the social economy, the impact of human factors on forest fires will continue to increase in the future. Therefore, as a next step, we will further explore the relationships between explanatory variables and fires in the study area. On the basis of expanding the time span and the research area scale, new forest fire factors, such as population density, will be added. We will continue to use ANNs to predict the possibility of forest fires and provide assistance in modern forest management.
Author Contributions
Conceptualization, M.L. and B.W.; methodology, B.W.; software, Z.W.; validation, M.L. and B.W.; formal analysis, J.L.; investigation, B.W.; resources, M.L.; data curation, M.L. and B.W.; writing—original draft preparation, Z.W.; writing—review and editing, B.W.; visualization, Y.Q.; supervision, Y.Q.; project administration, B.W.; funding acquisition, M.L. All authors have read and agreed to the published version of the manuscript.
Funding
This research was funded by University of Science and Technology of China, grant number 2020YFC1511603.
Institutional Review Board Statement
Not applicable.
Informed Consent Statement
Not applicable.
Data Availability Statement
Due to the nature of this research, participants of this study did not agree for their data to be shared publicly, so supporting data is not available.
Conflicts of Interest
The authors declare no conflict of interest.
References
- Sileshi, G.; Mafongoya, P.L. The short-term impact of forest fire on soil invertebrates in the miombo. Biodivers. Conserv. 2006, 15, 3153–3160. [Google Scholar] [CrossRef]
- Wotton, B.M.; Nock, C.A.; Flannigan, M.D. Forest fire occurrence and climate change in Canada. Int. J. Wildland Fire 2010, 19, 253–271. [Google Scholar] [CrossRef]
- Molina, J.R.; Herrera, M.A.; Silva, F.R. Wildfire-induced reduction in the carbon storage of Mediterranean ecosystems: An application to brush and forest fires impacts assessment. Environ. Impact Assess. Rev. 2019, 76, 88–97. [Google Scholar] [CrossRef]
- Johnstone, J.F.; Allen, C.D.; Franklin, J.F.; Frelich, L.E.; Harvey, B.J.; Higuera, P.E.; Mack, M.C.; Meentemeyer, R.K.; Metz, M.R.; Perry, G.L.W. Changing disturbance regimes, ecological memory, and forest resilience. Front. Ecol. Environ. 2016, 14, 369–378. [Google Scholar] [CrossRef]
- Slezakova, K.; Morais, S.; do Carmo Pereira, M. Forest fires in Northern region of Portugal: Impact on PM levels. Atmos. Res. 2013, 127, 148–153. [Google Scholar] [CrossRef] [Green Version]
- Valendik, E.N.; Kosov, I.V. Effect of thermal radiation of forest fire on the environment. Contemp. Probl. Ecol. 2008, 1, 399. [Google Scholar] [CrossRef]
- Purnomo, H.; Shantiko, B.; Sitorus, S.; Gunawan, H.; Achdiawan, R.; Kartodihardjo, H.; Dewayani, A.A. Fire economy and actor network of forest and land fires in Indonesia. For. Policy Econ. 2017, 78, 21–31. [Google Scholar] [CrossRef]
- Chandra, K.K.; Bhardwaj, A.K. Incidence of forest fire in India and its effect on terrestrial ecosystem dynamics, nutrient and microbial status of soil. Int. J. Agric. For. 2015, 5, 69–78. [Google Scholar]
- He, F.; Ge, Q.; Dai, J.; Rao, Y. Forest change of China in recent 300 years. J. Geogr. Sci. 2008, 18, 59–72. [Google Scholar] [CrossRef]
- Sokolova, G.V.; Makogonov, S.V. Development of the forest fire forecast method (a case study for the far east). Russ. Meteorol. Hydrol. 2013, 38, 222–226. [Google Scholar] [CrossRef]
- Guo, F.; Innes, J.L.; Wang, G.; Ma, X.; Sun, L.; Hu, H.; Su, Z. Historic distribution and driving factors of human-caused fires in the Chinese boreal forest between 1972 and 2005. J. Plant. Ecol. 2015, 8, 480–490. [Google Scholar] [CrossRef] [Green Version]
- Avila-Flores, D.; Pompa-Garcia, M.; Antonio-Nemiga, X.; Rodriguez-Trejo, D.A.; Vargas-Perez, E.; Santillan-Perez, J. Driving factors for forest fire occurrence in Durango State of Mexico: A geospatial perspective. Chin. Geogr. Sci. 2010, 20, 491–497. [Google Scholar] [CrossRef]
- Oliveira, S.; Oehler, F.; San-Miguel-Ayanz, J.; Camia, A.; Pereira, J.M.C. Modeling spatial patterns of fire occurrence in Mediterranean Europe using Multiple Regression and Random Forest. For. Ecol. Manag. 2012, 275, 117–129. [Google Scholar] [CrossRef]
- Miranda, B.R.; Sturtevant, B.R.; Stewart, S.I.; Hammer, R.B. Spatial and temporal drivers of wildfire occurrence in the context of rural development in northern Wisconsin, USA. Int. J. Wildland Fire 2012, 21, 141–154. [Google Scholar] [CrossRef]
- Guo, F.; Wang, G.; Su, Z.; Liang, H.; Wang, W.; Lin, F.; Liu, A. What drives forest fire in Fujian, China? Evidence from logistic regression and Random Forests. Int. J. Wildland Fire 2016, 25, 505–519. [Google Scholar] [CrossRef]
- Ganteaume, A.; Camia, A.; Jappiot, M.; San-Miguel-Ayanz, J.; Long-Fournel, M.; Lampin, C. A review of the main driving factors of forest fire ignition over Europe. Environ. Manag. 2013, 51, 651–662. [Google Scholar] [CrossRef] [PubMed] [Green Version]
- Chas-Amil, M.L.; Prestemon, J.P.; McClean, C.J.; Touza, J. Human-ignited wildfire patterns and responses to policy shifts. Appl. Geogr. 2015, 56, 164–176. [Google Scholar] [CrossRef]
- Flannigan, M.; Stocks, B.; Turetsky, M.; Wotton, M. Impacts of climate change on fire activity and fire management in the circumboreal forest. Glob. Chang. Biol. 2009, 15, 549–560. [Google Scholar] [CrossRef]
- Rogers, B.M.; Soja, A.J.; Goulden, M.L.; Randerson, J.T. Influence of tree species on continental differences in boreal fires and climate feedbacks. Nat. Geosci. 2015, 8, 228–234. [Google Scholar] [CrossRef]
- Abatzoglou, J.T.; Kolden, C.A. Relationships between climate and macroscale area burned in the western United States. Int. J. Wildland Fire 2013, 22, 1003–1020. [Google Scholar] [CrossRef]
- Han, J.; Shen, Z.; Ying, L.; Li, G.; Chen, A. Early post-fire regeneration of a fire-prone subtropical mixed Yunnan pine forest in Southwest China: Effects of pre-fire vegetation, fire severity and topographic factors. For. Ecol. Manag. 2015, 356, 31–40. [Google Scholar] [CrossRef]
- Kim, D.-W.; Chung, W.; Lee, B. Exploring tree crown spacing and slope interaction effects on fire behavior with a physics-based fire model. For. Sci. Technol. 2016, 12, 167–175. [Google Scholar] [CrossRef] [Green Version]
- Ager, A.A.; Barros, A.M.G.; Day, M.A.; Preisler, H.K.; Spies, T.A.; Bolte, J. Analyzing fine-scale spatiotemporal drivers of wildfire in a forest landscape model. Ecol. Model. 2018, 384, 87–102. [Google Scholar] [CrossRef]
- Clarke, P.J.; Knox, K.J.E.; Bradstock, R.A.; Munoz-Robles, C.; Kumar, L. Vegetation, terrain and fire history shape the impact of extreme weather on fire severity and ecosystem response. J. Veg. Sci. 2014, 25, 1033–1044. [Google Scholar] [CrossRef]
- Collins, K.M.; Price, O.F.; Penman, T.D. Spatial patterns of wildfire ignitions in south-eastern Australia. Int. J. Wildland Fire 2015, 24, 1098–1108. [Google Scholar] [CrossRef]
- Parisien, M.-A.; Snetsinger, S.; Greenberg, J.A.; Nelson, C.R.; Schoennagel, T.; Dobrowski, S.Z.; Moritz, M.A. Spatial variability in wildfire probability across the western United States. Int. J. Wildland Fire 2012, 21, 313–327. [Google Scholar] [CrossRef]
- Chang, Y.; Zhu, Z.; Bu, R.; Chen, H.; Feng, Y.; Li, Y.; Hu, Y.; Wang, Z. Predicting fire occurrence patterns with logistic regression in Heilongjiang Province, China. Landsc. Ecol. 2013, 28, 1989–2004. [Google Scholar] [CrossRef]
- Bisquert, M.; Caselles, E.; Sánchez, J.M.; Caselles, V. Application of artificial neural networks and logistic regression to the prediction of forest fire danger in Galicia using MODIS data. Int. J. Wildland Fire 2012, 21, 1025–1029. [Google Scholar] [CrossRef]
- Chuvieco, E.; González, I.; Verdú, F.; Aguado, I.; Yebra, M. Prediction of fire occurrence from live fuel moisture content measurements in a Mediterranean ecosystem. Int. J. Wildland Fire 2009, 18, 430–441. [Google Scholar] [CrossRef]
- Guo, F.; Su, Z.; Wang, G.; Sun, L.; Tigabu, M.; Yang, X.; Hu, H. Understanding fire drivers and relative impacts in different Chinese forest ecosystems. Sci. Total Environ. 2017, 605, 411–425. [Google Scholar] [CrossRef]
- Alonso-Betanzos, A.; Fontenla-Romero, O.; Guijarro-Berdiñas, B.; Hernández-Pereira, E.; Andrade, M.I.P.; Jiménez, E.; Soto, J.L.L.; Carballas, T. An intelligent system for forest fire risk prediction and fire fighting management in Galicia. Expert Syst. Appl. 2003, 25, 545–554. [Google Scholar] [CrossRef]
- Polinova, M.; Wittenberg, L.; Kutiel, H.; Brook, A. Reconstructing pre-fire vegetation condition in the Wildland Urban Interface (WUI) using artificial neural network. J. Environ. Manag. 2019, 238, 224–234. [Google Scholar] [CrossRef]
- Debouk, H.; Riera-Tatché, R.; Vega-García, C. Assessing post-fire regeneration in a Mediterranean mixed forest using LiDAR data and artificial neural networks. Photogramm. Eng. Remote Sens. 2013, 79, 1121–1130. [Google Scholar] [CrossRef]
- Wimberly, M.C.; Reilly, M.J. Assessment of fire severity and species diversity in the southern Appalachians using Landsat TM and ETM+ imagery. Remote Sens. Environ. 2007, 108, 189–197. [Google Scholar] [CrossRef] [Green Version]
- Verbyla, D.L.; Kasischke, E.S.; Hoy, E.E. Seasonal and topographic effects on estimating fire severity from Landsat TM/ETM+ data. Int. J. Wildland Fire 2008, 17, 527–534. [Google Scholar] [CrossRef]
- García, M.L.; Caselles, V. Mapping burns and natural reforestation using Thematic Mapper data. Geocarto Int. 1991, 6, 31–37. [Google Scholar] [CrossRef]
- Brosofske, K.D.; Cleland, D.T.; Saunders, S.C. Factors influencing modern wildfire occurrence in the Mark Twain National Forest, Missouri. South. J. Appl. For. 2007, 31, 73–84. [Google Scholar] [CrossRef] [Green Version]
- Gralewicz, N.J.; Nelson, T.A.; Wulder, M.A. Factors influencing national scale wildfire susceptibility in Canada. For. Ecol. Manag. 2012, 265, 20–29. [Google Scholar] [CrossRef]
- Kalabokidis, K.D.; Koutsias, N.; Konstantinidis, P.; Vasilakos, C. Multivariate analysis of landscape wildfire dynamics in a Mediterranean ecosystem of Greece. Area 2007, 39, 392–402. [Google Scholar] [CrossRef]
- Seager, R.; Hooks, A.; Williams, A.P.; Cook, B.; Nakamura, J.; Henderson, N. Climatology, variability, and trends in the US vapor pressure deficit, an important fire-related meteorological quantity. J. Appl. Meteorol. Climatol. 2015, 54, 1121–1141. [Google Scholar] [CrossRef]
- Pimont, F.; Dupuy, J.-L.; Linn, R.R. Coupled slope and wind effects on fire spread with influences of fire size: A numerical study using FIRETEC. Int. J. Wildland Fire 2012, 21, 828–842. [Google Scholar] [CrossRef]
- Viegas, D.X. On the existence of a steady state regime for slope and wind driven fires. Int. J. Wildland Fire 2004, 13, 101–117. [Google Scholar] [CrossRef]
- Sharples, J.J. An overview of mountain meteorological effects relevant to fire behaviour and bushfire risk. Int. J. Wildland Fire 2009, 18, 737–754. [Google Scholar] [CrossRef]
- Rollins, M.G.; Morgan, P.; Swetnam, T. Landscape-scale controls over 20th century fire occurrence in two large Rocky Mountain (USA) wilderness areas. Landsc. Ecol. 2002, 17, 539–557. [Google Scholar] [CrossRef]
- West, J.B. Safe upper limits for oxygen enrichment of room air at high altitude. High. Alt. Med. Biol. 2001, 2, 47–51. [Google Scholar] [CrossRef]
- Ricotta, C.; Di Vito, S. Modeling the landscape drivers of fire recurrence in Sardinia (Italy). Environ. Manag. 2014, 53, 1077–1084. [Google Scholar] [CrossRef] [PubMed]
- Maingi, J.K.; Henry, M.C. Factors influencing wildfire occurrence and distribution in eastern Kentucky, USA. Int. J. Wildland Fire 2007, 16, 23–33. [Google Scholar] [CrossRef] [Green Version]
- Lein, J.K.; Stump, N.I. Assessing wildfire potential within the wildland–urban interface: A southeastern Ohio example. Appl. Geogr. 2009, 29, 21–34. [Google Scholar] [CrossRef]
- Hantson, S.; Lasslop, G.; Kloster, S.; Chuvieco, E. Anthropogenic effects on global mean fire size. Int. J. Wildland Fire 2015, 24, 589–596. [Google Scholar] [CrossRef]
- Penman, T.D.; Bradstock, R.A.; Price, O. Modelling the determinants of ignition in the Sydney Basin, Australia: Implications for future management. Int. J. Wildland Fire 2013, 22, 469–478. [Google Scholar] [CrossRef]
- Mundo, I.A.; Wiegand, T.; Kanagaraj, R.; Kitzberger, T. Environmental drivers and spatial dependency in wildfire ignition patterns of northwestern Patagonia. J. Environ. Manag. 2013, 123, 77–87. [Google Scholar] [CrossRef]
- Archibald, S.; Roy, D.P.; van Wilgen, B.W.; Scholes, R.J. What limits fire? An examination of drivers of burnt area in Southern Africa. Glob. Chang. Biol. 2009, 15, 613–630. [Google Scholar] [CrossRef] [Green Version]
- Gardner, M.W.; Dorling, S.R. Artificial neural networks (the multilayer perceptron)—A review of applications in the atmospheric sciences. Atmos. Environ. 1998, 32, 2627–2636. [Google Scholar] [CrossRef]
- Jaafari, A.; Termeh, S.V.R.; Bui, D.T. Genetic and firefly metaheuristic algorithms for an optimized neuro-fuzzy prediction modeling of wildfire probability. J. Environ. Manag. 2019, 243, 358–369. [Google Scholar] [CrossRef]
- Faivre, N.; Jin, Y.; Goulden, M.L.; Randerson, J.T. Controls on the spatial pattern of wildfire ignitions in Southern California. Int. J. Wildland Fire 2014, 23, 799–811. [Google Scholar] [CrossRef] [Green Version]
- Syphard, A.D.; Radeloff, V.C.; Keuler, N.S.; Taylor, R.S.; Hawbaker, T.J.; Stewart, S.I.; Clayton, M.K. Predicting spatial patterns of fire on a southern California landscape. Int. J. Wildland Fire 2008, 17, 602–613. [Google Scholar] [CrossRef]
- Ma, W.; Feng, Z.; Cheng, Z.; Chen, S.; Wang, F. Identifying forest fire driving factors and related impacts in China using random forest algorithm. Forests 2020, 11, 507. [Google Scholar] [CrossRef]
- Huiling, L.; Futao, G.; Wenhui, W.; Zhangwen, S.; Jiayang, Z.; Yurui, L. Driving factors and their effect power on forest fire occurrence of Yichun, Xiaoxing’an Mountains. J. Northeast. For. Univ. 2015, 12. Available online: https://en.cnki.com.cn/Article_en/CJFDTotal-DBLY201512007.htm (accessed on 4 June 2020).
- Wang, Y.-W.; Xue, J.-G.; Zhou, H.-C.; Pan, C.-F. Characteristics of forest fire and fire management in northern slope of Changbai Mountain. Jilin For. Sci. Technol. 2009, 1. Available online: https://en.cnki.com.cn/Article_en/CJFDTotal-JLLK200901009.htm (accessed on 4 June 2020).
- Elia, M.; D’Este, M.; Ascoli, D.; Giannico, V.; Spano, G.; Ganga, A.; Colangelo, G.; Lafortezza, R.; Sanesi, G. Estimating the probability of wildfire occurrence in Mediterranean landscapes using Artificial Neural Networks. Environ. Impact Assess. Rev. 2020, 85, 106474. [Google Scholar] [CrossRef]
- Goldarag, Y.J.; Mohammadzadeh, A.; Ardakani, A.S. Fire risk assessment using neural network and logistic regression. J. Indian Soc. Remote Sens. 2016, 44, 885–894. [Google Scholar] [CrossRef]
- Xu, D.; Shao, G.; Dai, L.; Hao, Z.; Tang, L.; Wang, H. Mapping forest fire risk zones with spatial data and principal component analysis. Sci. China Ser. E Technol. Sci. 2006, 49, 140–149. [Google Scholar] [CrossRef]
Figure 1.
The location and a map of the forest research area in Heilongjiang Province, China. The histogram shows the proportion of forest fire incidents in the study area from 2002 to 2015.
Figure 1.
The location and a map of the forest research area in Heilongjiang Province, China. The histogram shows the proportion of forest fire incidents in the study area from 2002 to 2015.

Figure 2.
Monthly temperature and precipitation in the Heilongjiang forest area: (a) The highest temperature, lowest temperature, and average precipitation of each month in the past 20 years; (b) the change trend coefficient of the highest temperature, lowest temperature, and precipitation; (c) average wind speed and maximum wind speed for each month in the past 20 years.

Figure 3.
Schematic diagram of the perceptron network used in performance research.

Figure 4.
The random forest model analyzing the importance of variables; the variable names are defined in Table 1.
Figure 4.
The random forest model analyzing the importance of variables; the variable names are defined in Table 1.

Figure 5.
ANN predicting the accuracy of forest fires in 2002–2015 and 2019–2020.

Figure 6.
Comparison of the number of forest fires predicted by the ANN from 2002 to 2015 and from 2019 to 2020 and the actual number of occurrences.
Figure 6.
Comparison of the number of forest fires predicted by the ANN from 2002 to 2015 and from 2019 to 2020 and the actual number of occurrences.

Figure 7.
An example of a forest fire probability map for Binxi, Eastern Heilongjiang, on 18 April 2020, generated by the ANN model.
Figure 7.
An example of a forest fire probability map for Binxi, Eastern Heilongjiang, on 18 April 2020, generated by the ANN model.

Figure 8.
The relationship between 12 climatic factors and the probability of natural fire: (a) the trend of average daily surface temperature from 2002 to 2015 and its relationship with the probability of natural fires; (b) as the average daily wind speed changes, the probability of natural fires changes.; (c) analyse the relationship between the average daily air temperature change and the probability of natural fires in fourteen years; (d) the relationship between the probability of natural fire occurrence and average daily relative humidity; (e) analyse the relationship between the minimum daily surface temperature change and the probability of natural fires in fourteen years; (f) the trend of minimum daily air temperature from 2002 to 2015 and its relationship with the probability of natural fires; (g) the relationship between the probability of natural fire and the maximum daily surface temperature; (h) with the change of the average maximum daily air temperature, the probability of natural fires changes; (i) the trend of maximum daily wind speed from 2002 to 2015 and its relationship with the probability of natural fires; (j) as the average value of minimum daily relative humidity changes, the probability of natural fires changes; (k) analyse the relationship between the change of daily precipitation and the probability of natural fires in fourteen years; (l) the relationship between natural fire occurrence probability and daily average vapor-pressure.


Table 1.
The explanatory variables considered in model training in this study.
| Variable Type | Variable Name | Source | Code |
|---|---|---|---|
| Climate | Average daily surface temperature | China Meteorological Data Network http://data.cma.cn/, accessed on 4 June 2020 | Adst |
| Average daily wind speed | Adws | ||
| Average daily air temperature | Adat | ||
| Average daily relative humidity | Adrh | ||
| Minimum daily surface temperature | Min_dst | ||
| Minimum daily air temperature | Min_dat | ||
| Maximum daily surface temperature | Max_dst | ||
| Maximum daily air temperature | Max_dat | ||
| Maximum daily wind speed | Max_dws | ||
| Minimum daily relative humidity | Min_drh | ||
| Daily precipitation Daily average vapor-pressure | Dp | ||
| Davap | |||
| Topography | Altitude | Geospatial Data Cloud www.gscloud.cn/, accessed on 4 June 2020 | |
| Slope | |||
| Aspect | |||
| Anthropogenic | Railways | National Catalogue Service for Geographic Information https://www.webmap.cn/, accessed on 4 June 2020 | |
| Roads | |||
| Residential points | |||
| Inhabited places | |||
| Vegetation | Vegetation cover type | Institute of Botany, The Chinese Academy of Sciences http://www.ibcas.ac.cn/, accessed on 12 December 2018 |
Table 2.
The importance of climate factors determined by isolating variables.
| Isolated Variable | Data Set | Prediction Accuracy (%) |
|---|---|---|
| Adst | 2002–2015 | 78.65 |
| Adws | 2002–2015 | 79.61 |
| Adat | 2002–2015 | 80.84 |
| Adrh | 2002–2015 | 75.75 |
| Min_dst | 2002–2015 | 81.43 |
| Min_dat | 2002–2015 | 81.22 |
| Max_dst | 2002–2015 | 80.73 |
| Max_dat | 2002–2015 | 78.64 |
| Max_dws | 2002–2015 | 78.89 |
| Min_drh | 2002–2015 | 76.83 |
| Dp | 2002–2015 | 80.59 |
| Davap | 2002–2015 | 79.07 |
Table 3.
The importance of topographical factors determined by isolating variables.
| Isolated Variable | Data Set | Prediction Accuracy (%) |
|---|---|---|
| Slope | 2002–2015 | 77.11 |
| Aspect | 2002–2015 | 79.05 |
| Elevation | 2002–2015 | 76.26 |
Table 4.
The importance of human drivers determined by isolating variables.
| Isolated Variable | Data Set | Prediction Accuracy (%) |
|---|---|---|
| Railway | 2002–2015 | 83.16 |
| Road | 2002–2015 | 81.56 |
| Residential point | 2002–2015 | 83.64 |
| Inhabited place | 2002–2015 | 82.83 |
Table 5.
The importance of human drivers determined by isolating variables.
| Isolated Variable | Data Set | Prediction Accuracy (%) |
|---|---|---|
| Vegetation cover type | 2002–2015 | 80.79 |
Table 6.
Accuracy comparison between the logistic regression model and ANN model.
| Model | Prediction Accuracy (%) | |
|---|---|---|
| 2002–2015 | 2019–2020 | |
| ANN | 84.4 | 85.2 |
| Logit | 64.3 | 66.2 |
ANN = artificial neural network; Logit = logistic.
Publisher’s Note: MDPI stays neutral with regard to jurisdictional claims in published maps and institutional affiliations. |
© 2021 by the authors. Licensee MDPI, Basel, Switzerland. This article is an open access article distributed under the terms and conditions of the Creative Commons Attribution (CC BY) license (https://creativecommons.org/licenses/by/4.0/).
Share and Cite
MDPI and ACS Style
Wu, Z.; Li, M.; Wang, B.; Quan, Y.; Liu, J. Using Artificial Intelligence to Estimate the Probability of Forest Fires in Heilongjiang, Northeast China. Remote Sens. 2021, 13, 1813. https://doi.org/10.3390/rs13091813
AMA Style
Wu Z, Li M, Wang B, Quan Y, Liu J. Using Artificial Intelligence to Estimate the Probability of Forest Fires in Heilongjiang, Northeast China. Remote Sensing. 2021; 13(9):1813. https://doi.org/10.3390/rs13091813
Chicago/Turabian StyleWu, Zechuan, Mingze Li, Bin Wang, Ying Quan, and Jianyang Liu. 2021. "Using Artificial Intelligence to Estimate the Probability of Forest Fires in Heilongjiang, Northeast China" Remote Sensing 13, no. 9: 1813. https://doi.org/10.3390/rs13091813
Note that from the first issue of 2016, this journal uses article numbers instead of page numbers. See further details here.