The Biodiversity–Biomass Relationship of Aquatic Macrophytes Is Regulated by Water Depth: A Case Study of a Shallow Mesotrophic Lake in China
 Fei Ma
 Lei Yang
 Tian Lv
 Zhenjun Zuo
 Haocun Zhao
 Shufeng Fan
 Chunhua Liu
 Dan Yu
- The National Field Station of Freshwater Ecosystem of Liangzi Lake, College of Life Sciences, Wuhan University, Wuhan, China
The relationship between biodiversity and productivity (or biomass production) (BPR) has been a popular topic in macroecology and debated for decades. However, this relationship is poorly understood in macrophyte communities, and the mechanism of the BPR pattern of the aquatic macrophyte community is not clear. We investigated 78 aquatic macrophyte communities in a shallow mesotrophic freshwater lake in the middle and lower reaches of the Yangtze River in China. We analyzed the relationship between biodiversity (species richness, diversity, and evenness indices) and community biomass, and the effects of water environments and interspecific interactions on biodiversity–biomass patterns. Unimodal patterns between community biomass and diversity indices instead of evenness indices are shown, and these indicate the importance of both the number and abundance of species when studying biodiversity–biomass patterns under mesotrophic conditions. These patterns were moderated by species identity biologically and water depth environmentally. However, water depth determined the distribution and growth of species with different life-forms as well as species identities through environmental filtering. These results demonstrate that water depth regulates the biodiversity–biomass pattern of the aquatic macrophyte community as a result of its effect on species identity and species distribution. Our study may provide useful information for conservation and restoration of macrophyte vegetation in shallow lakes through matching water depth and species or life-form combinations properly to reach high ecosystem functions and services.
Introduction
The relationship between biodiversity and ecosystem function has been debated for decades in many ecosystems (Duffy et al., 2017). Productivity and biomass production are comprehensive reflections of the response of plants to the environment as a result of growth and reproduction and are often focused on as key features of ecosystem functions (Loreau et al., 2001; Chisholm et al., 2013). The reported shapes of relationships between biodiversity and productivity (or biomass) (BPR pattern) vary greatly from positive or negative patterns in which biodiversity increases or decreases linearly with productivity (Wardle et al., 1997; Liang et al., 2016; Luo et al., 2019) to unimodal patterns in which biodiversity peaks at intermediate productivity (Dodson et al., 2000; Leduc et al., 2012; Craven et al., 2016), and in some cases, there is no correlation between them (Vila et al., 2003). A possible reason for this divergence is that data are often collected at different ecosystems (Bai et al., 2007; Hillebrand and Cardinale, 2010; Brun et al., 2019). Brun et al. (2019) demonstrate that biodiversity typically increases with productivity in forests although a unimodal pattern is shown in grasslands. However, those studies focus on terrestrial and marine ecosystems, such as phytoplankton and algae (Chen et al., 2019; De Raedt et al., 2019). Only a few studies investigate the BPR pattern of the macrophyte community. For example, Dodson et al. (2000) explore how macrophyte productivity influences macrophyte species richness by investigating several lakes in North America and find that the species richness presented a unimodal pattern on the productivity gradient. The pond study of Chase and Leibold (2002) also indicates that richness increases at low productivity but decreases at high productivity as a result of interspecific interaction and species identity. Recently, increasing studies prove that species identity (Roscher et al., 2007; Cui et al., 2019) and interaction (Michalet et al., 2006; Xiao et al., 2009) would be the underlying biological mechanisms that determine BPR patterns due to their great contribution to the community structure. It is demonstrated that interspecific interaction and species compositional difference have important effects on diversity patterns and productivity (Chase and Leibold, 2002; Chase and Ryberg, 2004). However, many studies confound the effects of species identity and interaction on the BPR pattern and treat them as a whole to explain the biological mechanism of the BPR pattern (Chase and Leibold, 2002; Chase and Ryberg, 2004). Previous BPR experiments used an analysis of variance method to separate the effects of species composition and diversity on the community structure. However, the method did not provide information on contributions of different species to the ecosystem structure. It is necessary to distinguish the effects of specific species identity and interspecific interaction on the BPR pattern for a better understanding of biological mechanisms of the BPR pattern. Therefore, we applied the diversity-interaction (DI) model proposed by Kirwan et al. (2009) to separate the contribution of different species and interspecific interactions to the community structure.
Furthermore, many abiotic factors, such as temperature, nutrition level, and water availability, affect the BPR pattern (Ma et al., 2010; Gravel et al., 2011). In terrestrial ecosystems, Palpurina et al. (2018) suggest that the type of nutrient limitation alters the BPR pattern in grasslands, and Garcia et al. (2018) find that changes in temperature influence the BPR pattern of microbial communities. In aquatic ecosystems, connectivity of the watershed and heterogeneity in the environmental factors are demonstrated to be prominent factors that affect the BPR pattern of the macrophyte community at a large scale (Chase and Leibold, 2002; Chase and Ryberg, 2004). However, the underlying abiotic mechanism of the macrophyte BPR pattern on a local scale has not been explored yet. Although many environmental factors, such as light, temperature, nutrient content of water bodies, and substrate characteristics, affect the growth and distribution of aquatic vegetation (Barko and Smart, 1986; Jeppesen et al., 2000; Squires et al., 2002; Bornette and Puijalon, 2011), it is proved that water depth is the major factor influencing growth and community composition of macrophytes mainly due to the limitation of light availability in shallow lakes (Van Geest et al., 2003; Scheffer and van Nes, 2007; Dong et al., 2014; Fu et al., 2014). Spence (1967) and Hudon et al. (2000) find a distribution of species with different growth forms along the water depth gradient, which results in the zonation of the macrophyte community. To be specific, there is a sequence from emergent to floating-leaved and submerged vegetation with increasing water depth. Nevertheless, how environmental factors, especially water depth and its effect on macrophyte distribution, affect the BPR pattern of the macrophyte community is rarely studied.
In addition, most studies are based on species richness in the study of the BPR pattern (Whittaker, 1972). However, other biodiversity indices, such as diversity (e.g., Shannon–Wiener index and Simpson diversity) and evenness indices (e.g., Pielou evenness and Simpson evenness), are also important for the measurement of the BPR pattern. This is because these indices incorporate the proportional abundance of each species within the community (Lembrechts et al., 2018), which provides more adequate information on the contribution each species makes to the ecosystem function. Nonetheless, the ecological meanings these indices deliver are different. Species richness, the Shannon-Wiener index, and Shannon diversity are sensitive to the presence of rare categories in an ecological community (Bandeira et al., 2013; Maturo, 2018). Simpson diversity is primarily a measure of dominance concentration because it is a good indicator of the dominance of one or several species over other species (Whittaker, 1972). Evenness indices, the degree to which abundances are equitably divided among species, represents whether the abundance of a species in the community is regular. High evenness represents the uniform distribution of species in the community with similar abundance, and low evenness represents an uneven abundance of species in the community with the existence of dominant species (Schleuter et al., 2010). Chalcraft et al. (2008) demonstrate that different measures of biodiversity respond to productivity in different ways in grasslands. However, the aquatic ecosystem may perform dissimilar patterns from the terrestrial ecosystem due to the specific habitat (surrounded by a water column).
Aquatic macrophytes provide numerous ecological and economic services, such as offering a habitat and food to aquatic animals and birds, supplying raw materials for social production (Costanza et al., 1997; Jeppesen et al., 2012). Investigation of the BPR pattern of the aquatic macrophyte community is critical to understand the aquatic ecosystem function. Therefore, we conducted an investigation of Liangzi lake, which is located in the middle and lower reaches of the Yangtze River in China, suffers medium human disturbance, and conserves many rare and endangered species (Fang et al., 2006), to explore the biodiversity–biomass pattern of the macrophyte community and its mechanisms under mesotrophic conditions. We hypothesized that (1) there are unimodal relationships between multiple measures of biodiversity and biomass; (2) both species identity and interspecific interaction shape the biodiversity–biomass pattern biomechanically; and (3) environmental factors, especially water depth, affects the community structure and biodiversity–biomass pattern.
Materials and Methods
Study Area
The study was performed in Liangzi Lake (30°05′-30°18′N, 114°21′-114°39′E), Hubei Province, China (Figure 1). Liangzi Lake is the largest freshwater lake with the largest water storage capacity (14 × 108 tons) and water area (304.3 km2) in Hubei Province (Wang et al., 2019; Meng et al., 2020). It is under the mesotrophic level with average total nitrogen of 0.554 mg/L and average total phosphorus of 0.024 mg/L. Liangzi Lake features a subtropical monsoon climate with an annual average temperature of 17°C, an average annual precipitation of 1330 mm and a mean freezing period of 15 days. It is a typical macrophyte-dominated shallow lake (i.e., macrophyte is the main primary producer) in the middle reaches of the Yangtze River Basin with high macrophyte biodiversity, about 90 species during the last decade (Fang et al., 2006; Xie et al., 2015). The dominant submerged species are Myriophyllum spicatum, Vallisneria natans, Ceratophyllum demersum, Potamogeton malaianus, Hydrilla verticillata, etc., and there are many rare and endangered species in Liangzi Lake, such as Ottelia alismoides and Ceratopteris thalictroides. However, Liangzi Lake was seriously flooded in 2016 (Xu et al., 2018), which led to the degradation of submerged macrophytes in the central lake as well as being caused by flood in 2010 (Wang et al., 2019), only vegetation in the shore area has been restored after flood due to relative low water depth until 2018. Therefore, macrophytes were surveyed in the shore area of Liangzi Lake as shown in Figure 1.
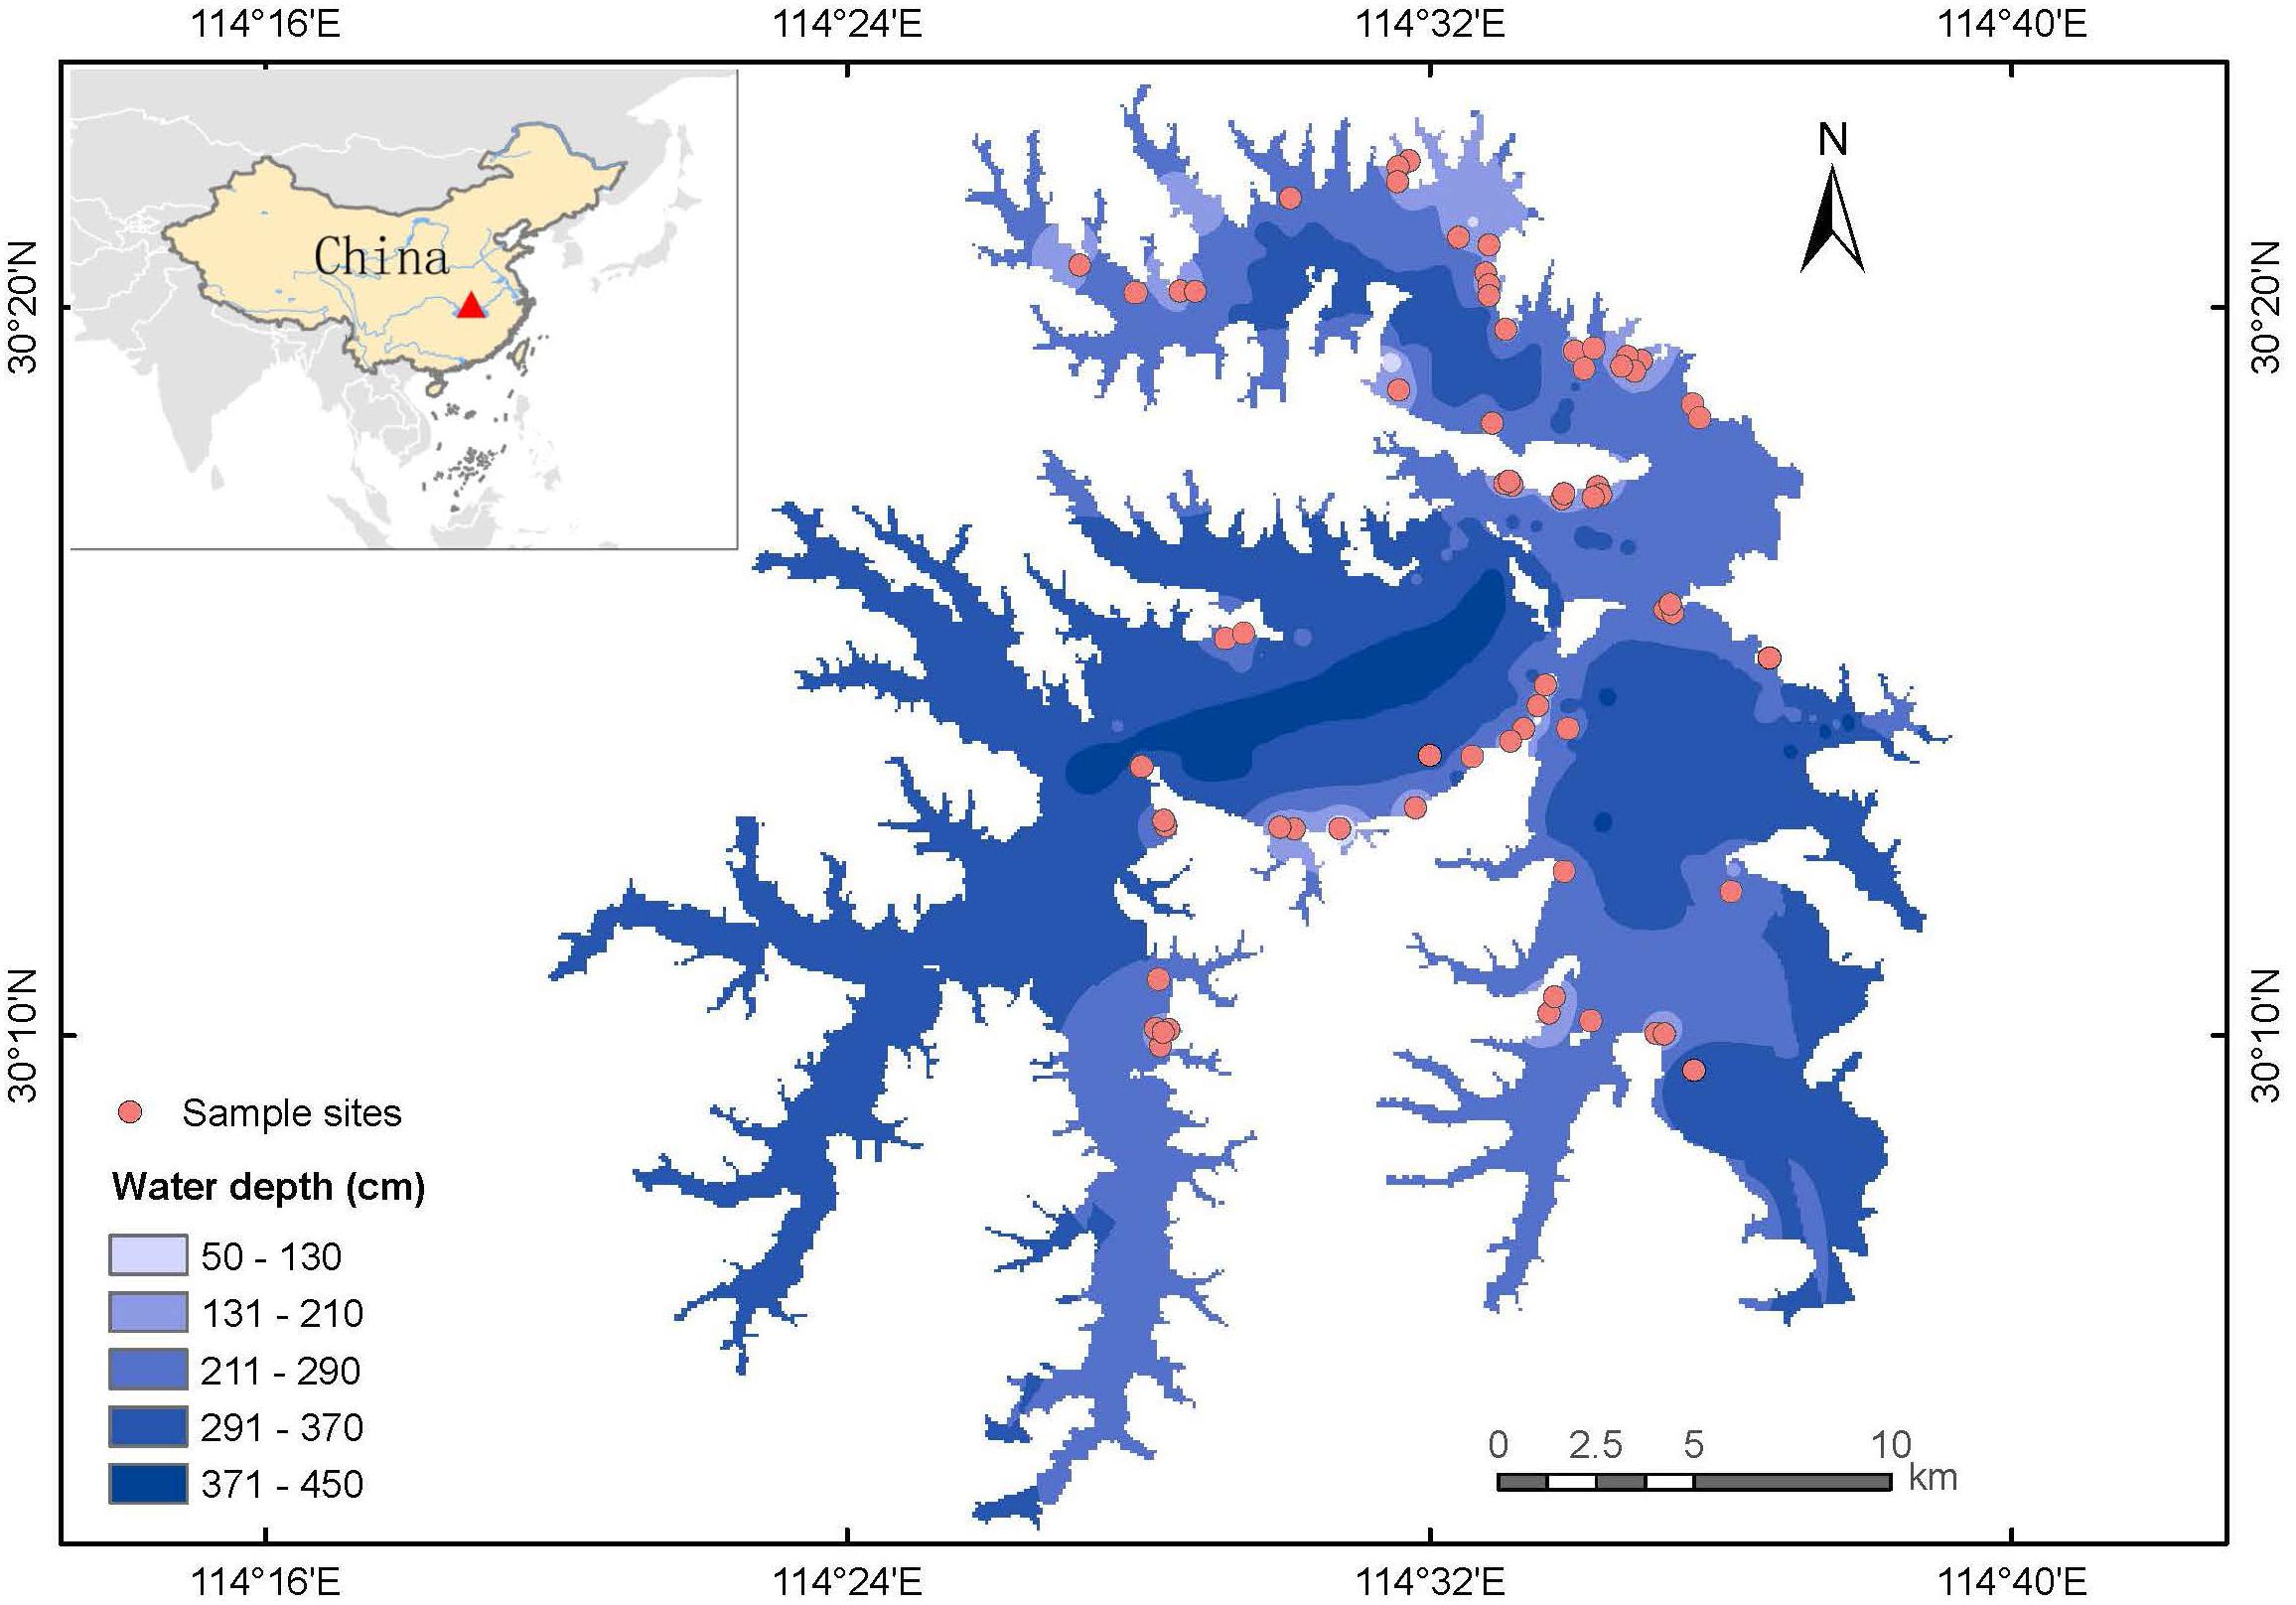
Figure 1. Map of Liangzi Lake. The red dots represent the locations of sampling sites.
Plant Samples
From July 19 to August 7, 2018 (i.e., the growing season when macrophytes have maximal production), 78 aquatic macrophyte plots (1 m × 1 m) (Müllerová et al., 2020) were surveyed according to a typical sampling method on the shores of Liangzi Lake, where aquatic plants are widely distributed. To be specific, one or two plots were placed in small communities, and three to four plots were placed in communities with high species richness and complicated community structure. The species in each plot were recorded, and the coverage of each species was determined by visual estimation on a 22° scales (0.5, 1, 5, 10, 15, 20, …, 100%). Whole plants containing shoots and roots were collected and washed to remove sediment and surface residues. The plant samples were immediately brought to the National Field Station of Freshwater Ecosystem at Liangzi Lake (hereafter referred to as the Liangzi Lake National Station) for further measurement. The plant materials collected from each site were classified based on species and life-form (i.e., submerged, floating-leaved, free-floating, and emergent plants) then oven-dried at 80°C for 72 h to obtain the biomass. Community biomass refers to the total biomass of all species in each plot in our study.
Water Environment
First, water depth was measured in each plot. Then, incident photosynthetically available irradiance (400–700 nm) was measured three times at the air–water surface and different underwater depths using a fiber optic sensor (LI-250A, LI-COR, Inc.). Light attenuation for photosynthetically active radiation was valued as the light attenuation coefficient, Kd (m–1). Finally, physical and chemical parameters were measured at each site at 1 m underwater. Water temperature (T), dissolved oxygen (DO), conductivity (Cond), total dissolved solids (TDS), salinity (SAL) and pH of water samples were measured using a portable water quality monitor (PROPLUS, YSI, United States). Turbidity (Turb) and total suspended solids (SS) were measured using a turbidity meter (2100Q, HACH, United States) and a portable spectrophotometer (DR900, HACH, United States). Water samples were collected in 500-ml clean bottles, stored in a portable refrigerator and transported to Liangzi Lake National Station immediately for analyses of total nitrogen (TN) and total phosphorus (TP). TN and TP were analyzed in a flow injection analyzer (QC8500, LACHAT, United States).
Biodiversity Indices
Seven biodiversity indices, including four diversity indices and three evenness indices, were computed as follows:
| Richness | R = S, |
| Shannon–Wiener index | SW = , (Shannon and Weaver, 1949) |
| Shannon diversity | SD = , (Maturo, 2018) |
| Simpson diversity | SiD = , (Simpson, 1949; Pielou, 1969) |
| Pielou evenness | PE = , (Pielou, 1969) |
| Shannon evenness | SE = , (Sheldon, 1969) |
| Simpson evenness | SiE = , (Morris et al., 2014) |
where S is the species number of a plot, Ci is the coverage of species i, and C is the sum coverage of all species in a plot.
DI Models
The DI model, improving diversity effects models proposed by Loreau and Hector (2001), separates the contribution of different species and interspecific interactions to ecosystem function (Kirwan et al., 2009). In our study, the DI model was employed to test how individual species and interaction between species pairs affect the biodiversity–biomass pattern by comparing hierarchical linear DI models (Kuebbing et al., 2015).
The general formulation of the linear model is y = ID + DE + ε, in which y is a community-level ecosystem function (here, biomass), ID is species identity effects, and DE is diversity effects. Four hierarchical linear DI models (Table 1) were used to test alternative hypotheses about the effect of species identities and interspecific interactions on the biomass in aquatic macrophyte communities (Kirwan et al., 2009; Kuebbing et al., 2015). By comparing the fit and analyzing the variance of these models, we can evaluate how species and interactions between pairwise species explain the BPR pattern (Kirwan et al., 2009).
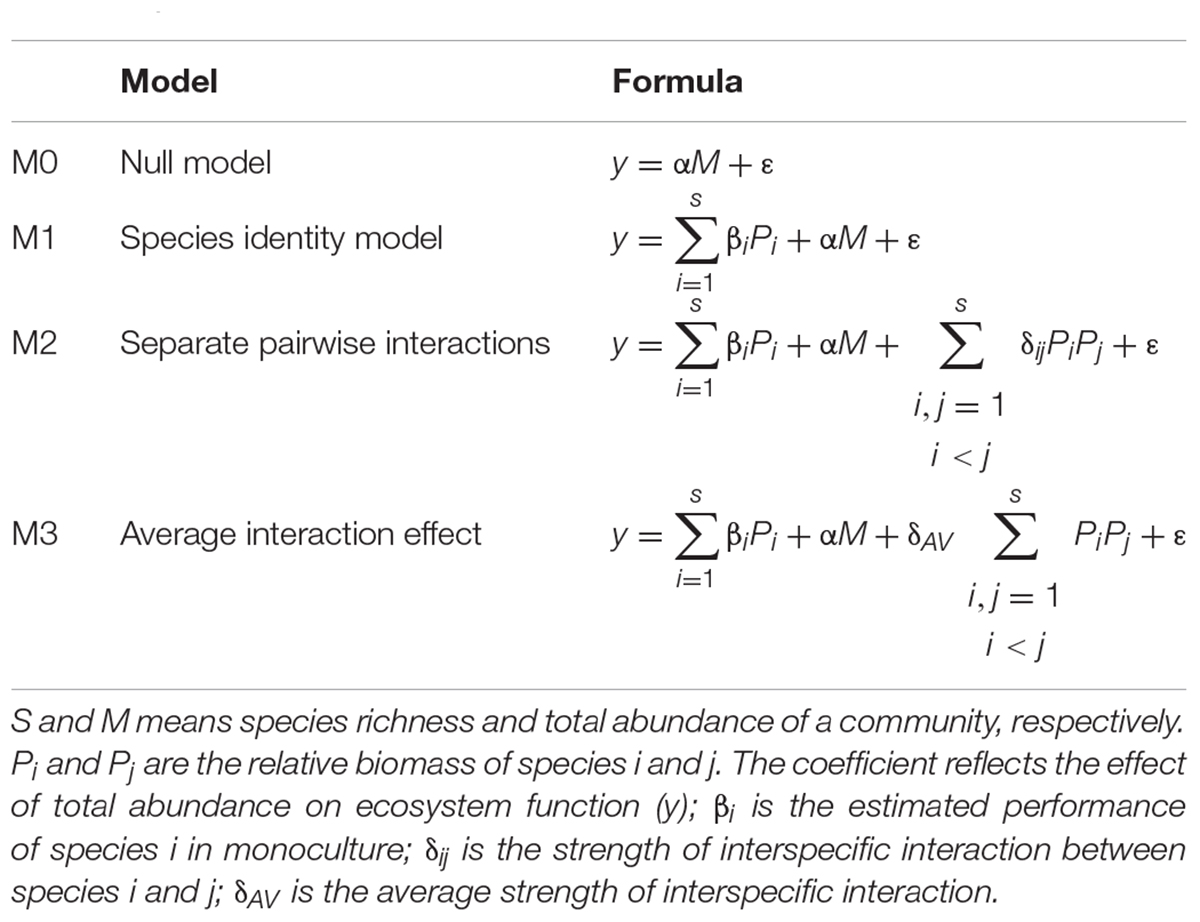
Table 1. Hierarchical linear DI models.
The null model (M0) assumes that ecosystem function does not change with diversity but with a function of total abundance (M) of the community. M1 adds an overall species identity term βiPi, a function of the production of each species in monoculture (βi) weighted by its proportion (P_i) in the community on the basis of the null model. M1 tests the effects of each species individually on the biomass in the absence of species interactions (DE=0). M2 includes a pairwise interactions term δijPiPj, where δij is the strength of interspecific interaction between species i and j, and M2 turns to M3 when all pairwise species combinations have the same strengths of interspecific interaction (δAV). The above models constitute a hierarchy of complexity describing species identity and interaction effects. By comparing the fit of models in this hierarchy, we can test biological hypotheses about how species identity and interspecific interaction effects contribute to ecosystem function (Kirwan et al., 2009). The significant difference between M1 and M0 demonstrates that species differ in their individual monoculture performances, between M3 and M1 demonstrates that there is a diversity effect on average, and between M3 and M2 demonstrates that separate pairwise interactions differ (Kirwan et al., 2009).
Data Analyses
To examine the influence of the biomass of the macrophyte community on diversity indices (i.e., richness, Shannon–Wiener index, Shannon diversity, Simpson diversity, Pielou evenness, Shannon evenness, and Simpson evenness), we first fitted linear relationships using least-squares linear regressions in which the dependent variables are the biodiversity indices. We then performed least-squares quadratic regressions. We deem the relationship curvilinear if the quadratic term is significantly different from zero and the overall model is significant. We compared two statistical models to select the most appropriate fit to the data. The Akaike information criterion (AIC) was calculated to help select the best model for each of the biodiversity indices. The least-squares quadratic regressions were chosen finally due to the lower AIC value. DI models were fitted by ordinary multiple regression, and comparisons between hierarchical models were made using the differences in AIC (Connolly et al., 2013) with variance analysis testing its significance using the ANOVA function. Differences in communities with different dominant species in biomass and biodiversity were compared using one-way ANOVA by post hoc Bonferroni tests for multiple comparisons, respectively, with the R packages agricolae (Mendiburu, 2009).
Redundancy analysis (RDA) was used to rank the aquatic macrophytes of four life-forms and species on all environmental gradients by the R package vegan (Oksanen et al., 2007). Stepwise regression was performed to eliminate the collinearity of environmental factors and screen out the major factors that influence the BPR pattern. We used the natural log-response ratio, ln (biomass/biodiversity), as the effect size metric for the relationship between biodiversity and biomass.
The least-squares linear regressions were performed to examine the effects of water depth on biomass (i.e., total biomass and the biomass of emergent, floating-leaved, and submerged plants) and diversity indices (i.e., richness, Shannon–Wiener index, Shannon diversity, Simpson diversity, Pielou evenness, Shannon evenness, and Simpson evenness) after comparison of models’ AIC value with least-squares quadratic regressions. Notably, free-floating species were not included in this analysis due to their extremely low frequency (2 of 78 plots). The above analyses were performed using R version 3.5.1 (R Development Core Team, 2011).
Results
The present survey recorded 33 aquatic plant species, including 12 submerged species, seven floating-leaved species, two free-floating species, and 12 emergent species (Supplementary Table 1). The total biomass of all plots ranged from 48 to 1581 g m–2. The water depth was between 40 and 350 cm. The basic physical and chemical properties and nutritional conditions of the water body are given in Supplementary Table 2.
The Biodiversity–Biomass Pattern and the Effect of Biological and Environmental Factors
Unimodal patterns were shown between community biomass and richness, the Shannon–Wiener index, Shannon diversity, and Simpson diversity (P < 0.1 for all four indices, Figures 2A–D), and evenness indices (i.e., Pielou, Shannon, and Simpson evenness) had no significant relationship with biomass (P > 0.1, Figures 2E–G).
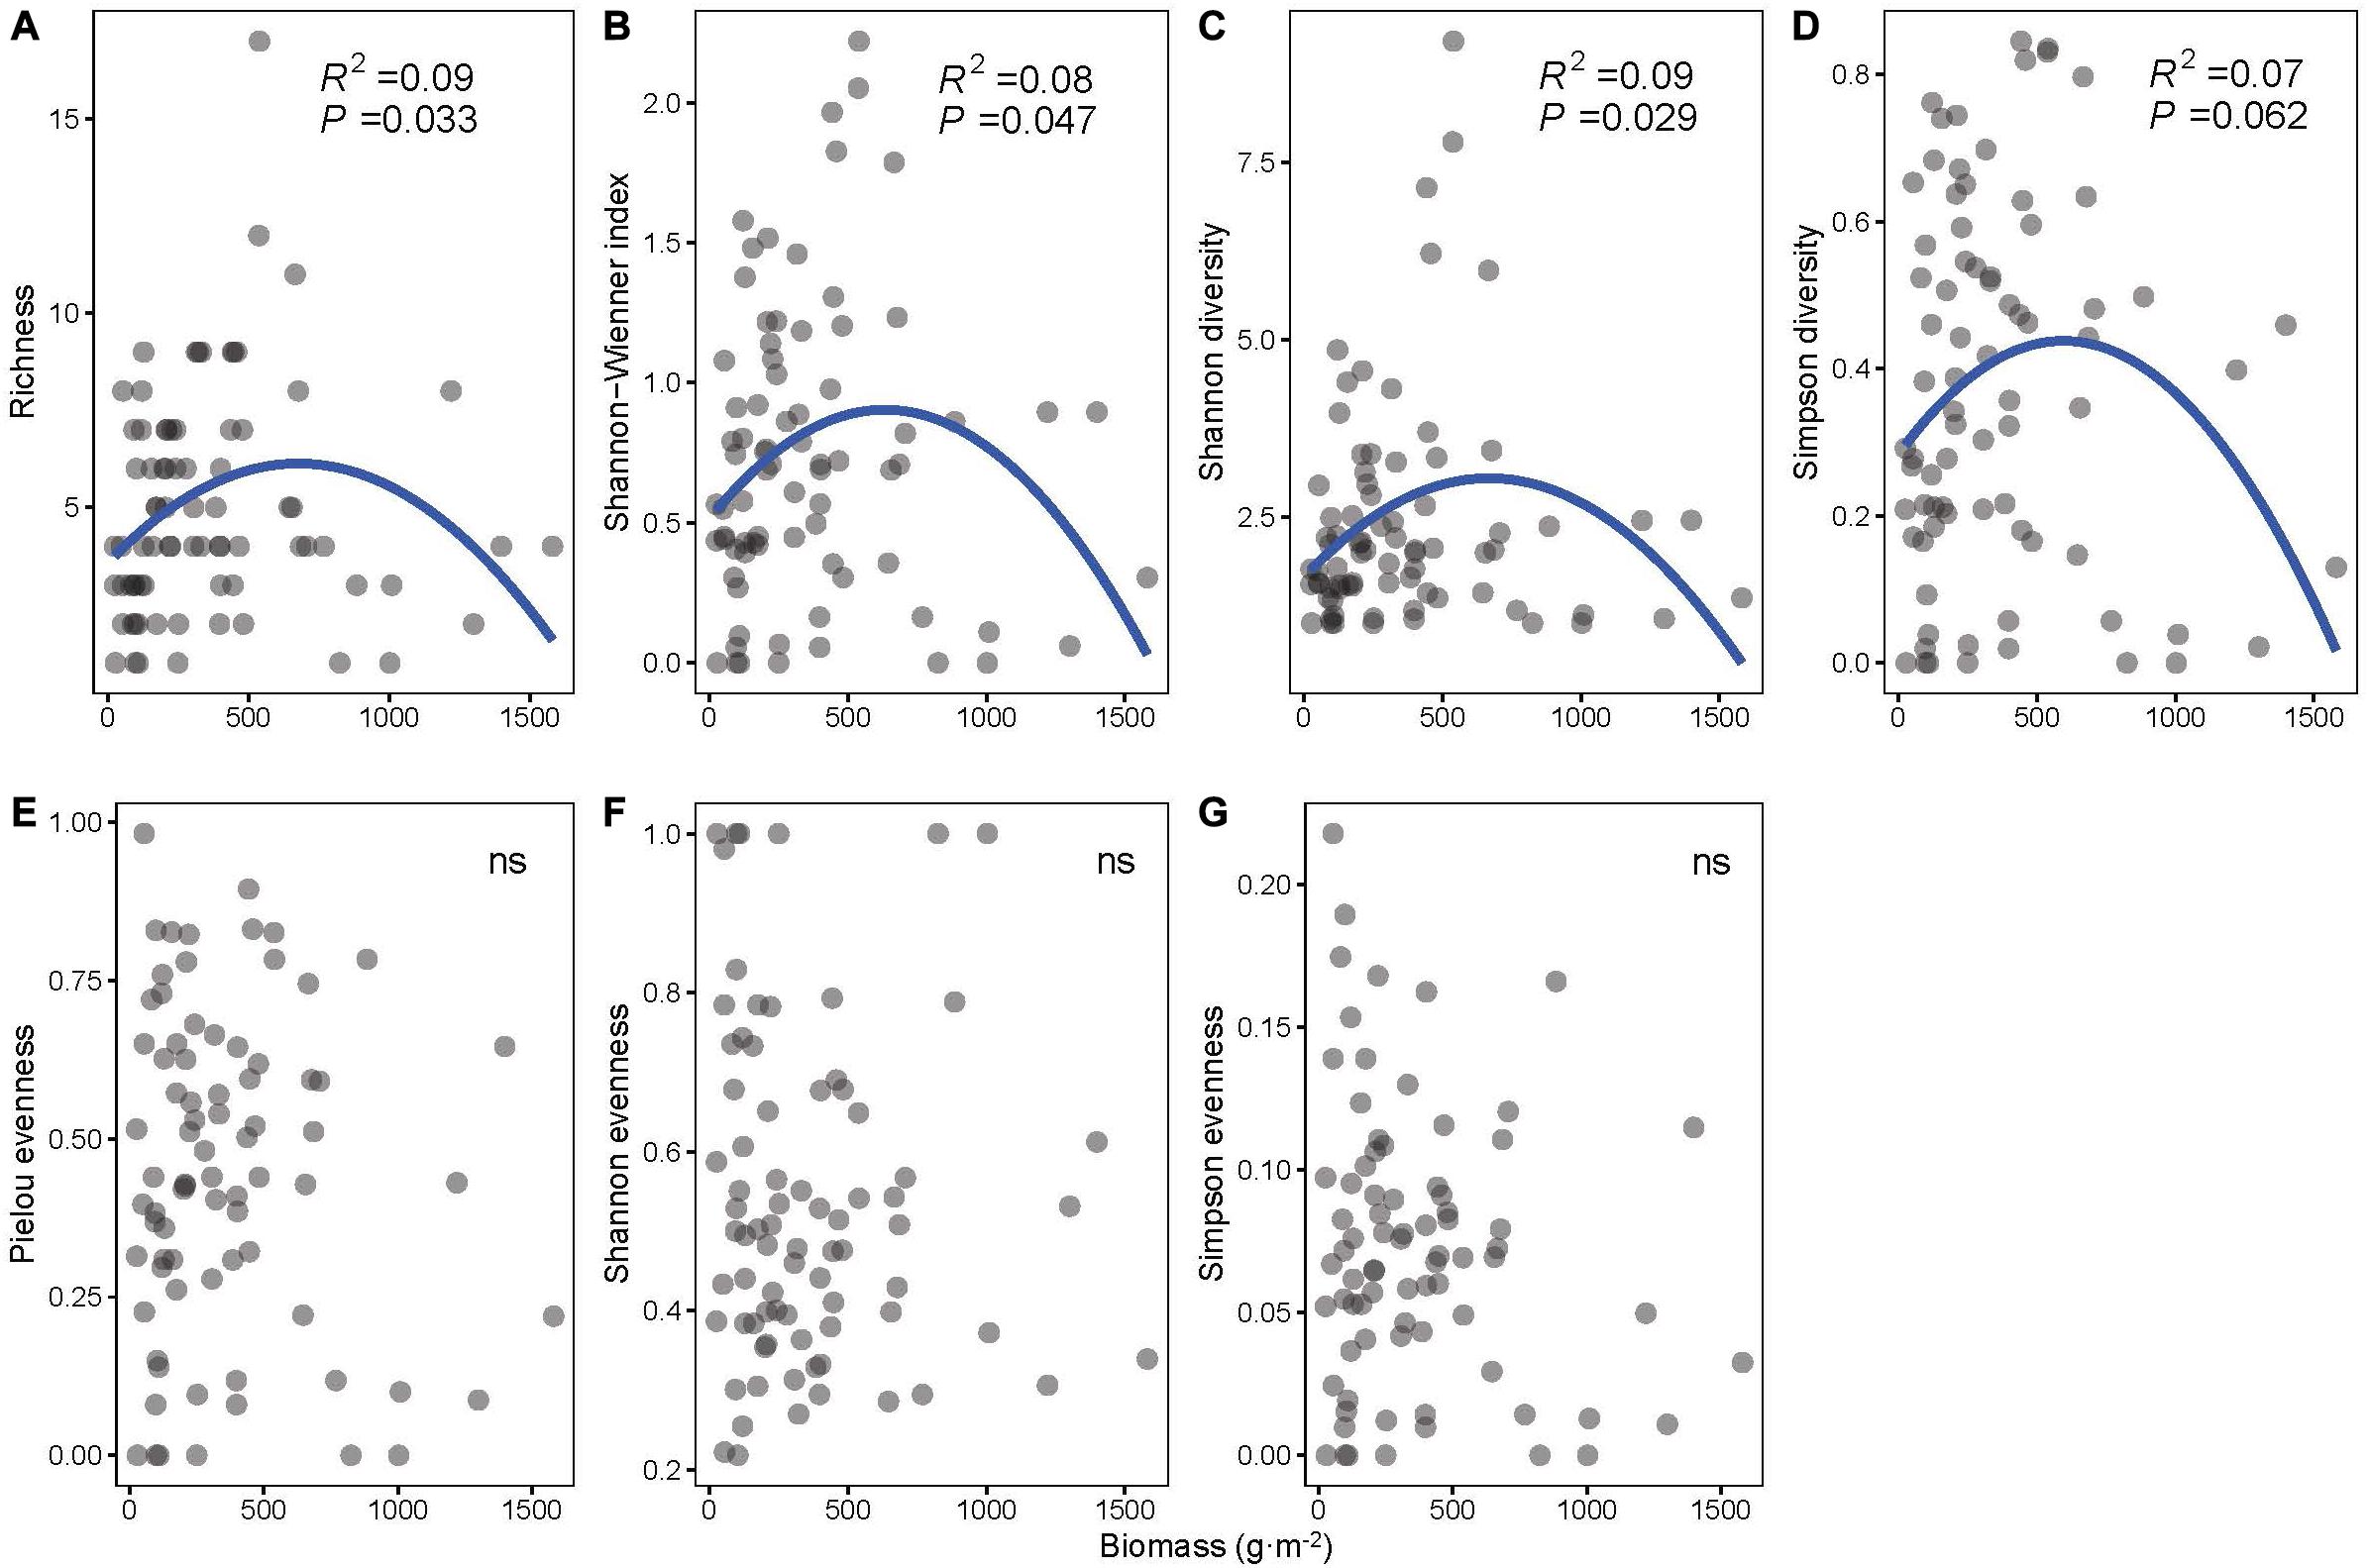
Figure 2. The least-squares quadratic regressions between biomass and biodiversity indices: (A) richness, (B) Shannon–Wiener index, (C) Shannon diversity, (D) Simpson diversity, (E) Pielou evenness, (F) Shannon evenness, and (G) Simpson evenness (n = 78).
According to the comparison between hierarchical linear DI models, we found that species identity played an important role in the biodiversity–biomass pattern of the aquatic macrophyte community, which is proved by the significant difference between M1 and M0 (Table 2). However, we found no indication that pairwise interactions existed, on average or separately, by comparing M3 and M1, M3 and M2 (Table 2, full model results can be found in Supplementary Method). Moreover, the results of the one-way ANOVA show that the communities with different dominant species tended to have a disparate community structure (Figure 3). Emergent species-dominated communities had high diversity and biomass, and communities dominated by submerged species C. demersum had high biomass but low diversity (Figure 3).
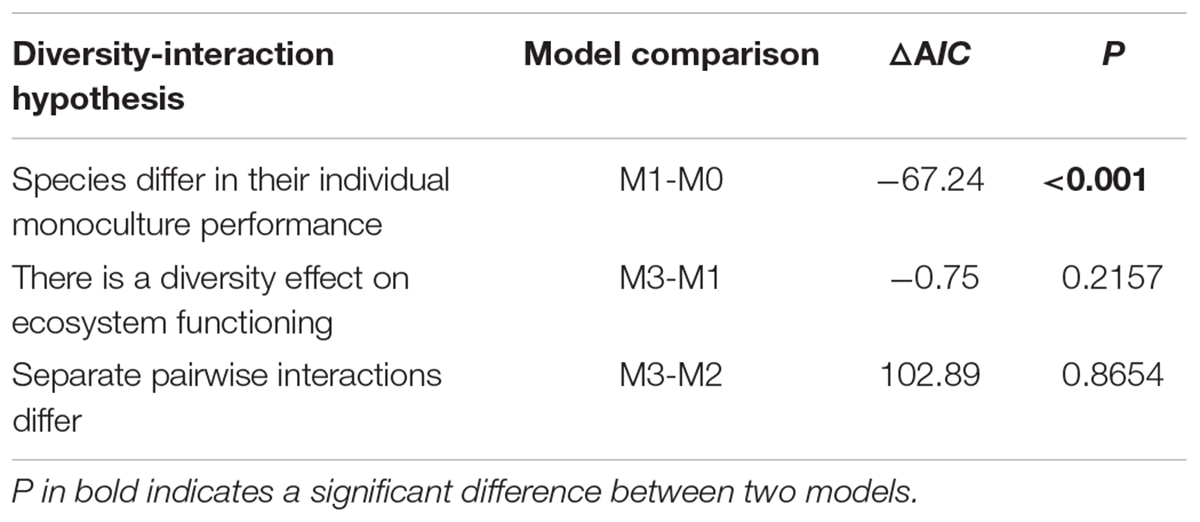
Table 2. Comparisons between hierarchical DI models testing biological hypotheses about the contribution of species identity and interspecific interactions to productivity.
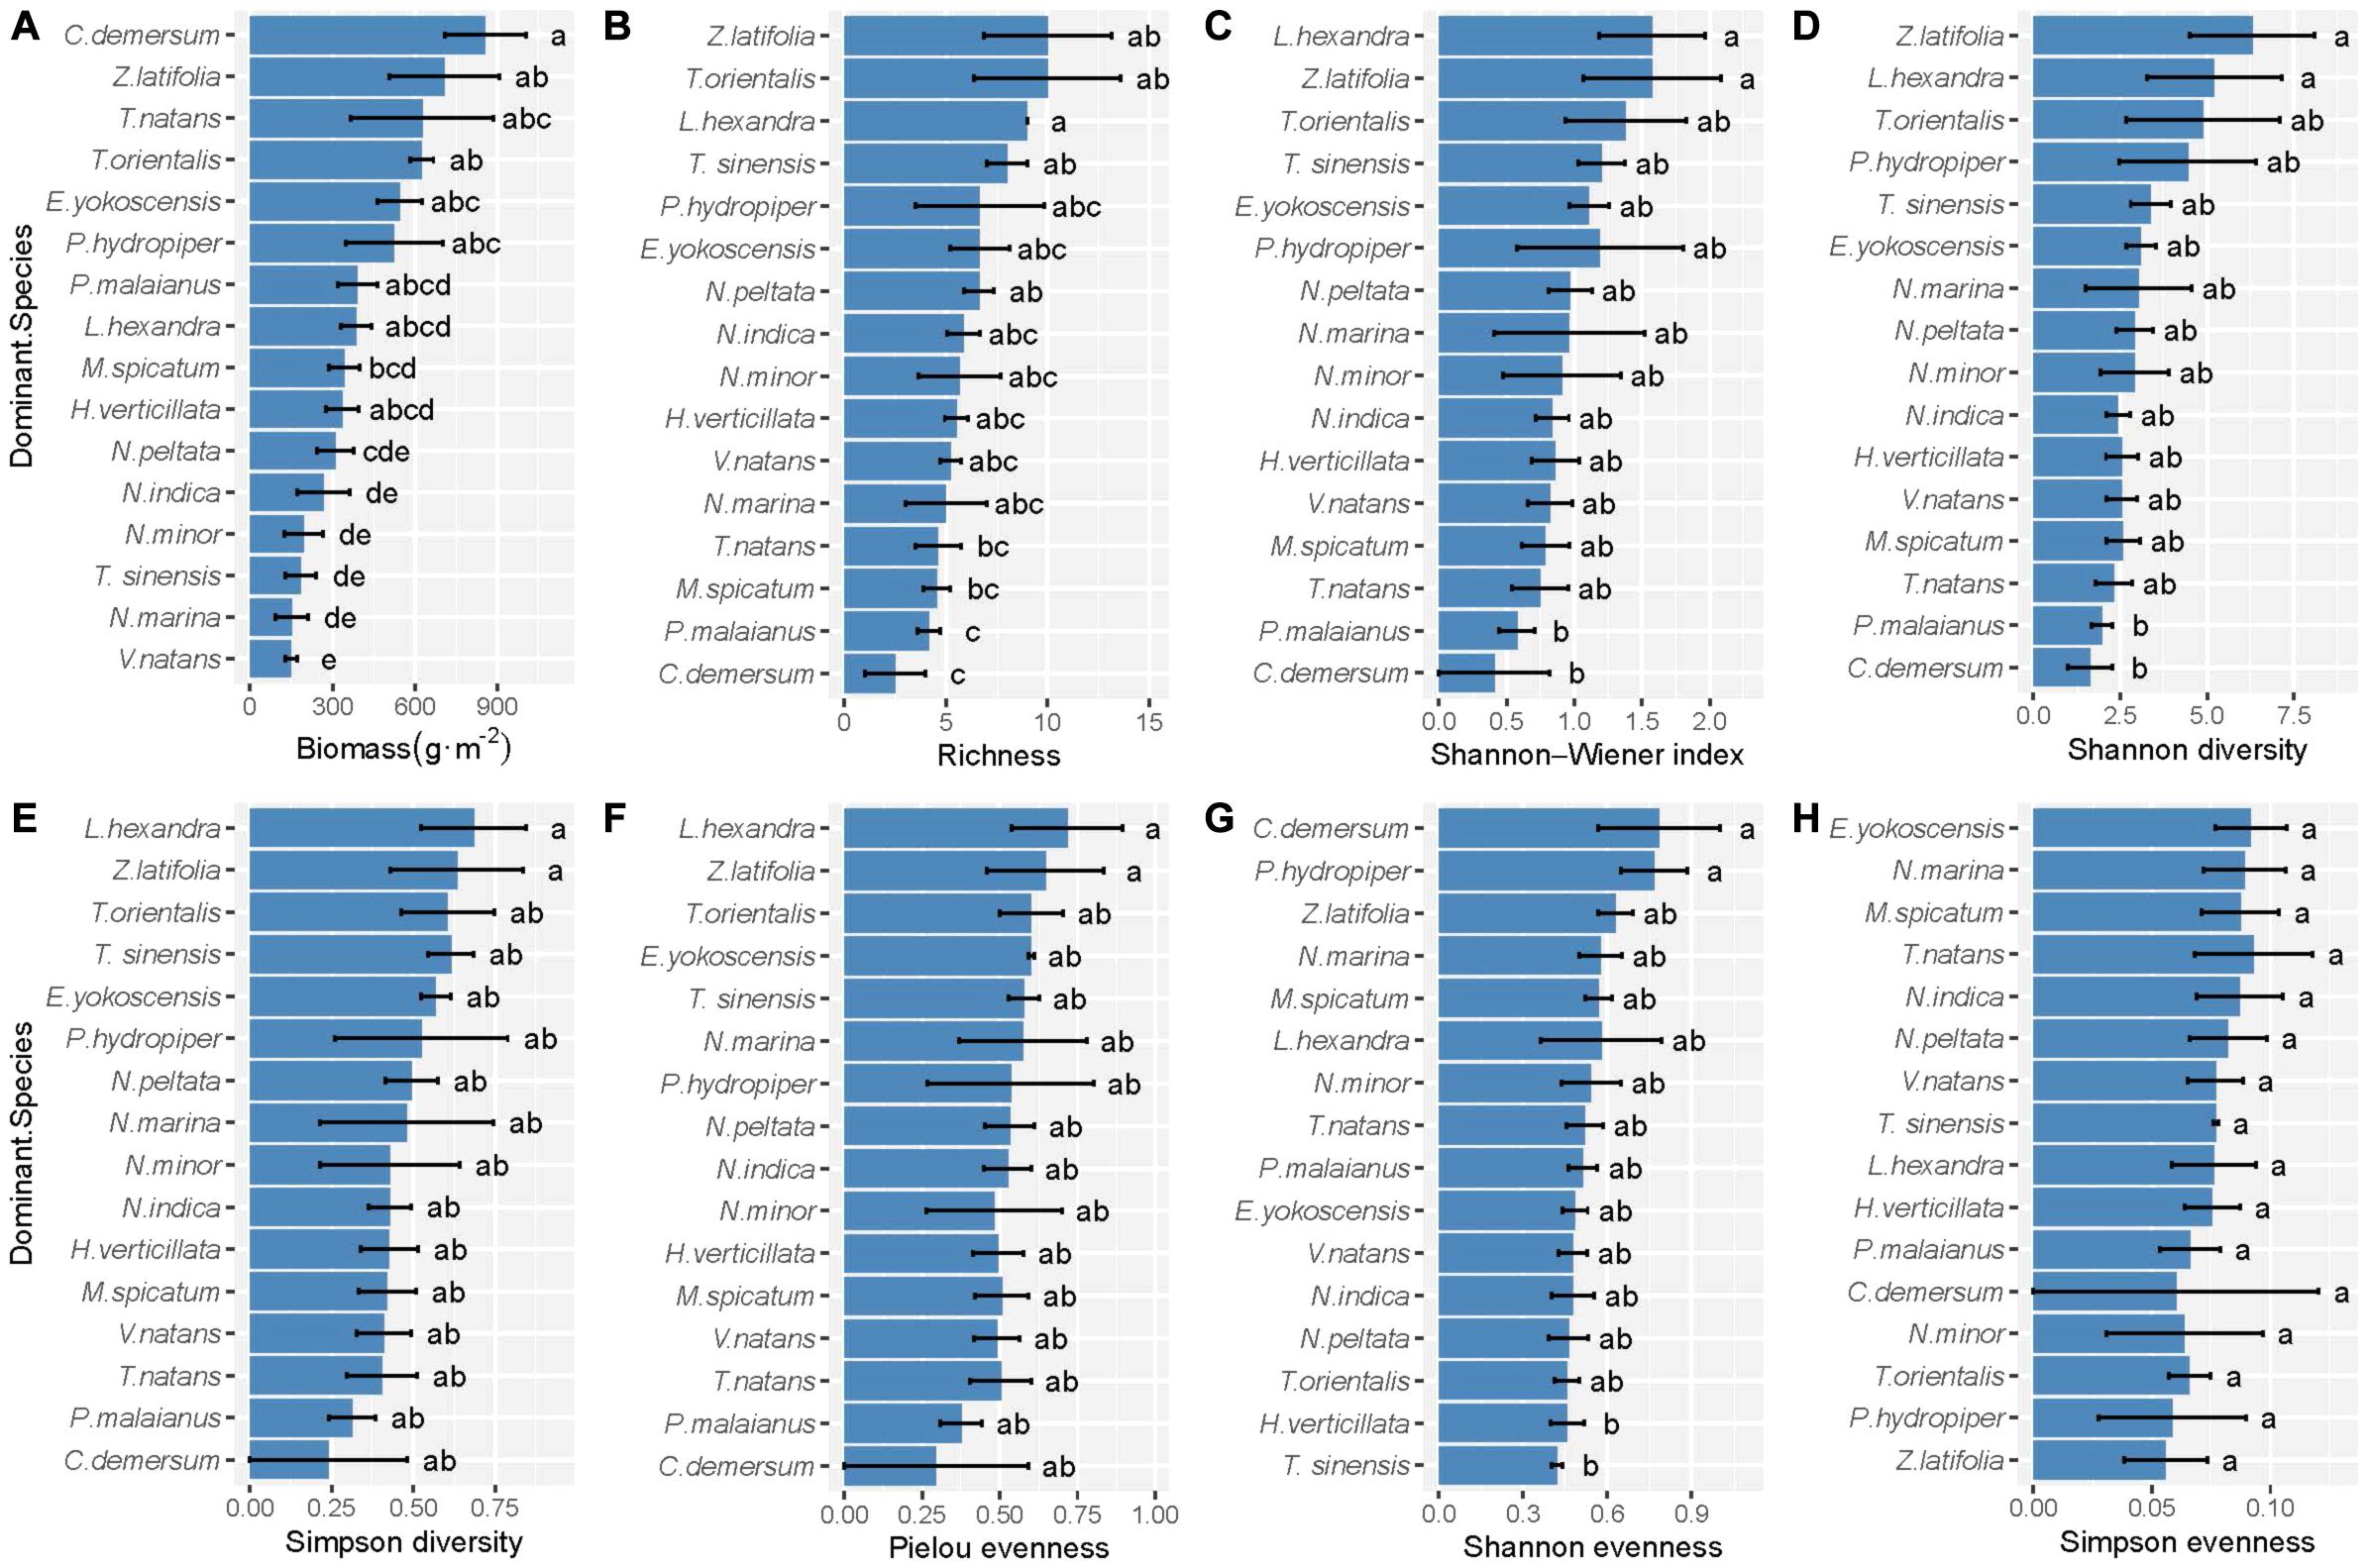
Figure 3. The difference of (A) productivity, (B) richness, (C) Shannon–Wiener index, (D) Shannon diversity, (E) Simpson diversity, (F) Pielou evenness, (G) Shannon evenness, and (H) Simpson evenness of the community with different dominant species. Error bars indicate standard error. Within each panel, bars labeled with different letters are significantly different according to Tukey tests (P < 0.05).
Total nitrogen, water depth, and SS cumulatively accounted for 14.03 and 16.92% of the changes in coverage and biomass, respectively, of all macrophytes in the two axes of RDA (Supplementary Figure 1). TN positively affected the coverage (P < 0.001) and biomass (P < 0.001) of floating-leaved macrophytes but negatively influenced the coverage (P < 0.001) and biomass (P < 0.001) of submerged plants (Supplementary Figure 1). The biomass and coverage of emergent plants exhibited a negative relation with water depth (P < 0.001) (Supplementary Figure 1). SS is positively correlated with the growth of submerged plants (P < 0.001) but negatively correlated with the growth of floating-leaved plants (P = 0.005) (Supplementary Figure 1). After stepwise regression analysis, we found that water depth explained the most variation in many log-response ratio of biomass and diversity indices (i.e., richness, Shannon-Wiener index, Shannon diversity, Simpson diversity, and Pielou evenness, P < 0.05, Figures 4A–E) and significantly affected ln (biomass/Simpson evenness) (Figure 4G). Water depth affected ln (biomass/richness) most out of all biodiversity–biomass relationships (Figure 4).
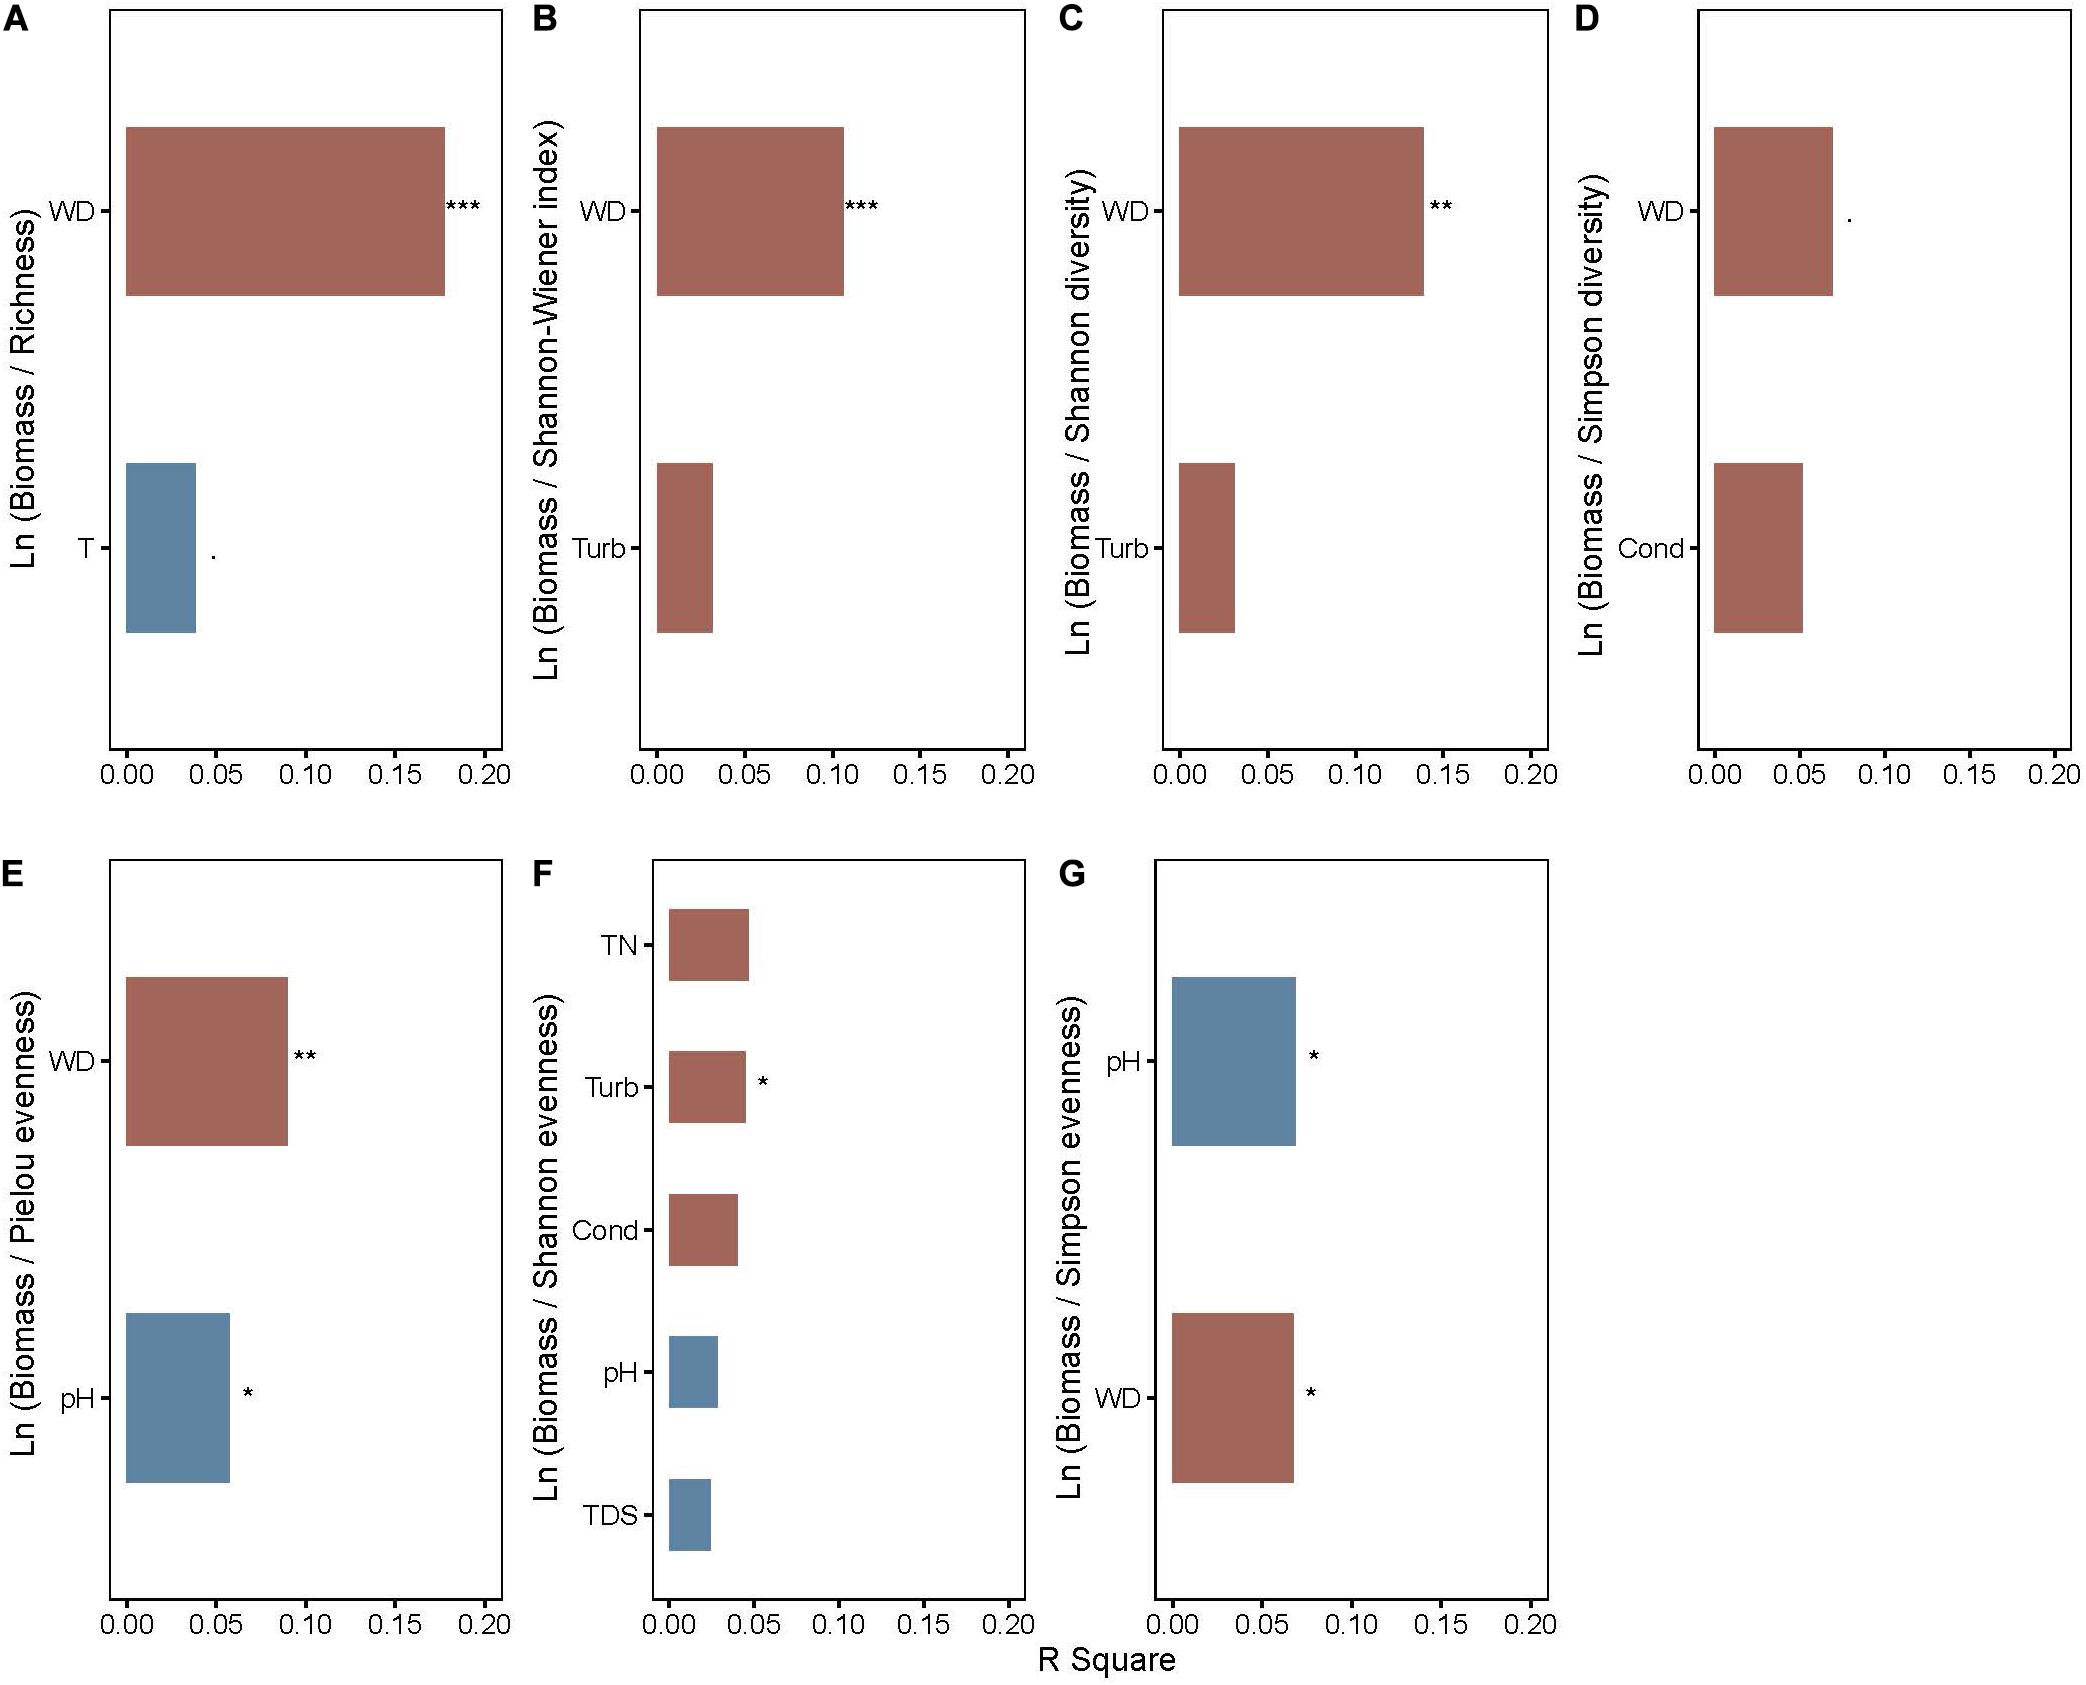
Figure 4. The rank of explanation power of environmental factors on (A) ln (biomass/richness), (B) ln (biomass/Shannon–Wiener index), (C) ln (biomass/Shannon diversity), (D) ln (biomass/Simpson diversity), (E) ln (biomass/Pielou evenness), (F) ln (biomass/Shannon evenness), and (G) ln (biomass/Simpson evenness) of aquatic macrophytes. WD, water depth. Red and blue bars represent positive and negative effects, respectively. Significance levels are indicated by asterisks: ***P < 0.001, **P < 0.01, *P < 0.05, P < 0.1.
The Influence of Water Depth on Biomass and Biodiversity
The community biomass as well as the biomass of floating-leaved and submerged plants increased along the water depth gradient (P < 0.05, Figures 5A,C,D), and the biomass of emergent plants showed a decreasing trend with water depth (P = 0.097, Figure 5B). Meanwhile, water depth significantly reduced most of diversity indices (i.e., richness, Shannon–Wiener index, Shannon diversity, Simpson diversity, and Pielou evenness; P < 0.05) except two evenness indices (i.e., Shannon and Simpson evenness; P > 0.1) (Figure 6).
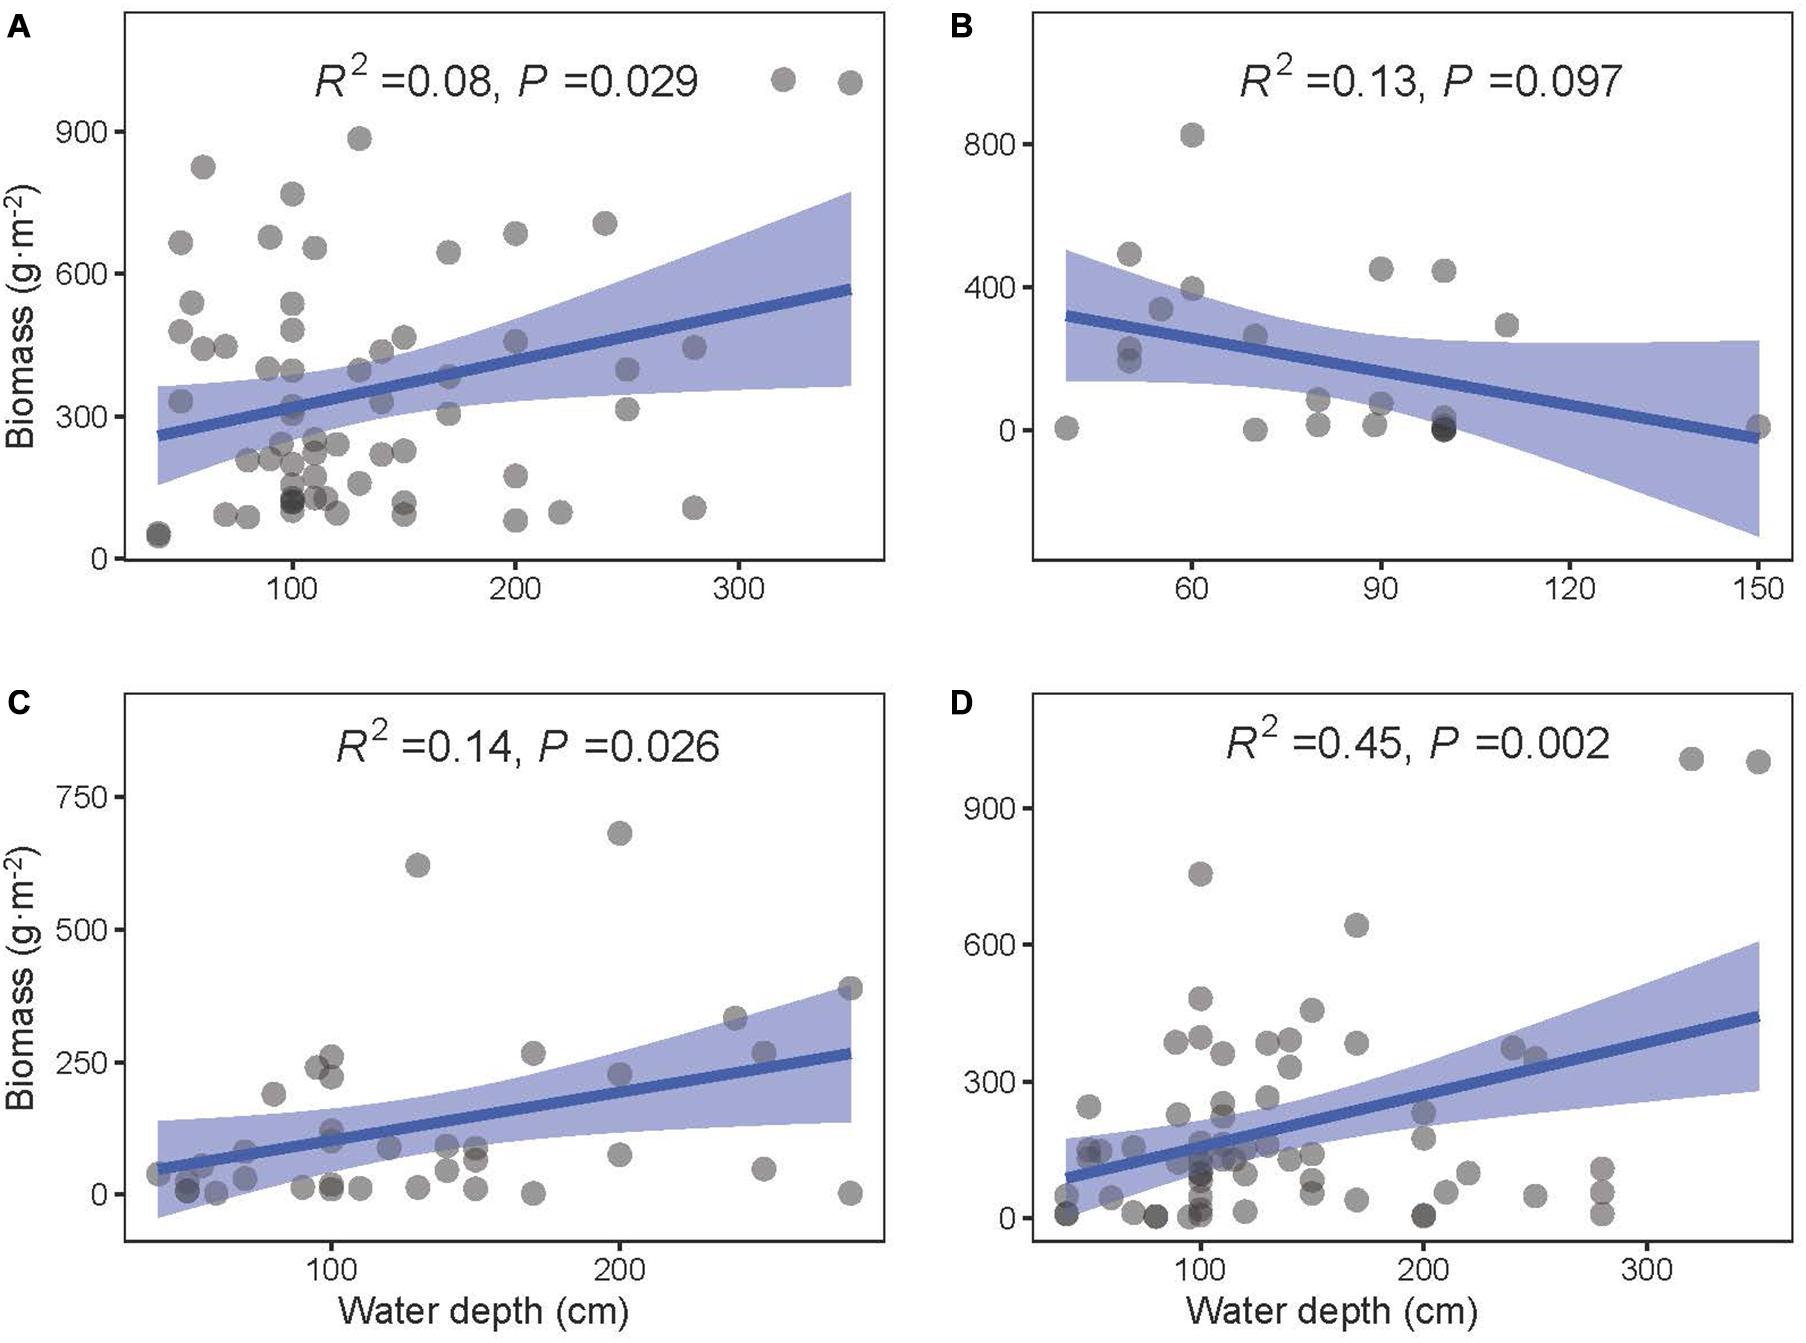
Figure 5. The least-squares linear regressions between water depth and biomass of (A) total, (B) emergent, (C) floating-leaved, and (D) submerged plants. The regression coefficients squared and P-values are given for the regression. The blue area shows the approximate 95% confidence intervals on the fitted function (n = 78).
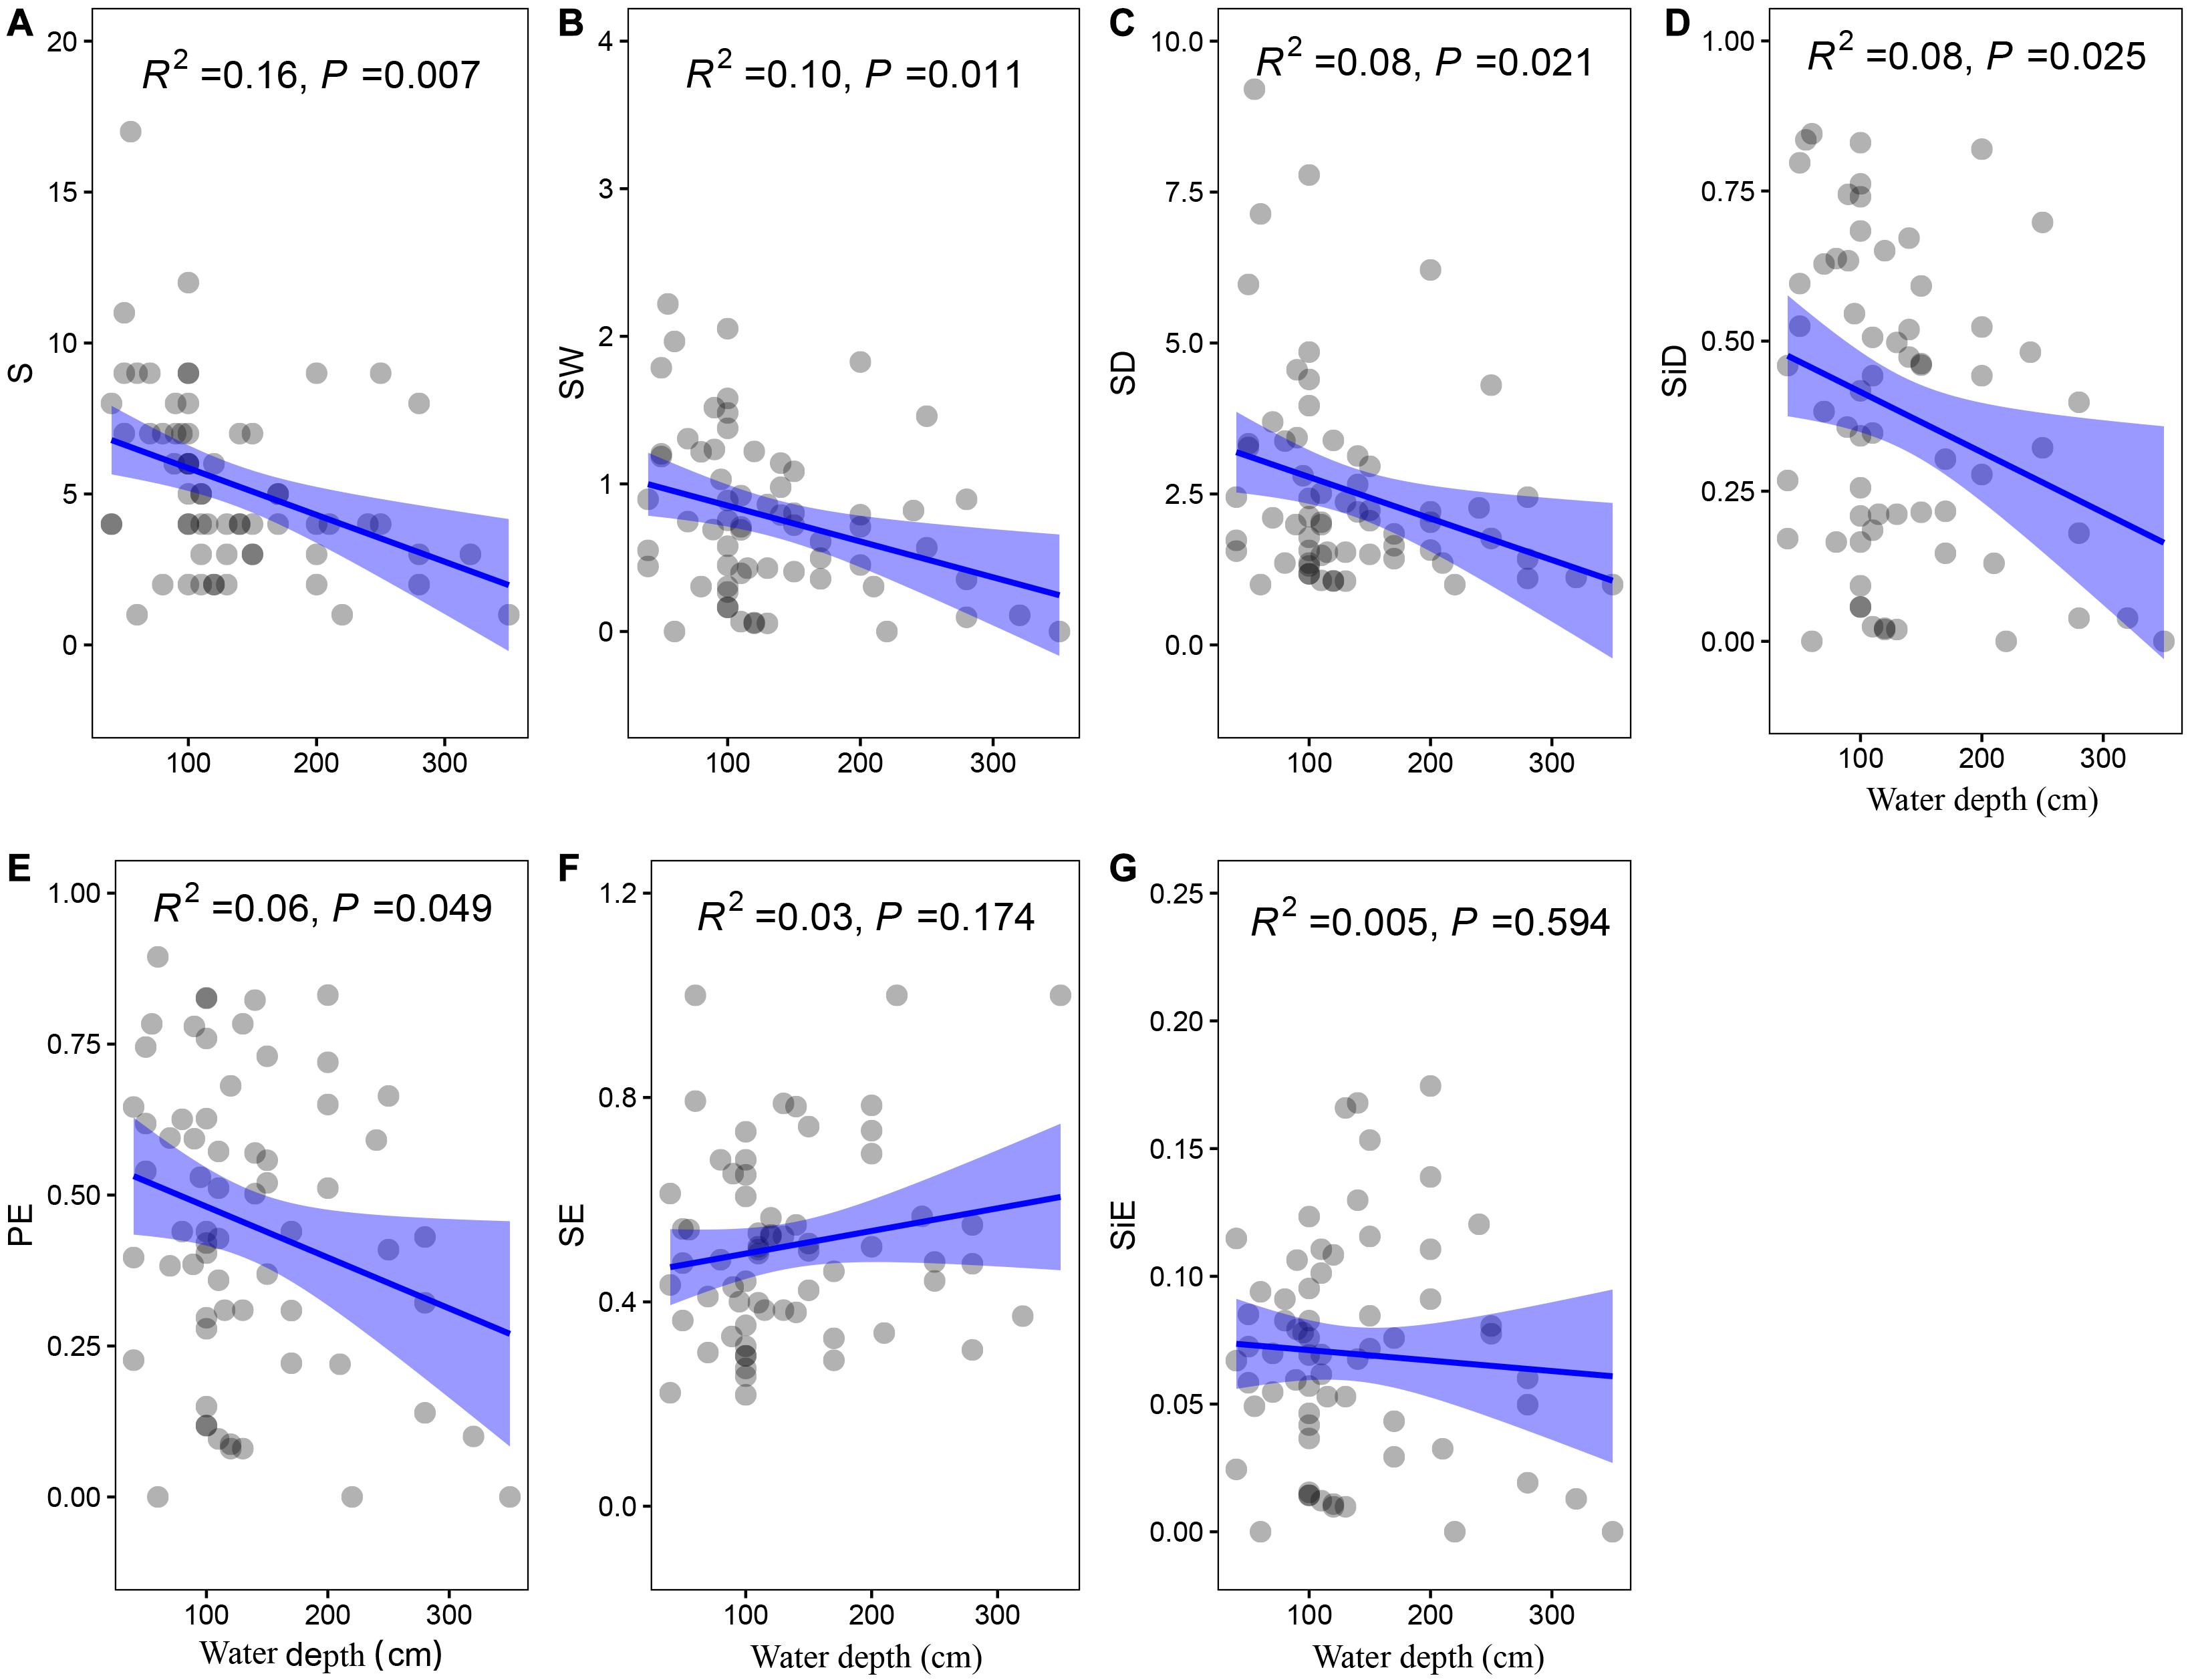
Figure 6. The least-squares linear regressions between water depth and (A) richness, (B) Shannon–Wiener index, (C) Shannon diversity, (D) Simpson diversity, (E) Pielou evenness, (F) Shannon evenness, and (G) Simpson evenness. The regression coefficients squared and P-values are given for the regression. The blue area shows the approximate 95% confidence intervals on the fitted function (n = 78).
Overall, emergent plants distributed in shallow water (30–120 cm) and floating-leaved plants occupied a wider range of water depth (30–300 cm), and submerged plants distributed in all water depth (30–360 cm) (Figure 7A). The yields of emergent, floating-leaved, and submerged plants peaked at 30–60, 180–240, and 300–360 cm, respectively (Figure 7B).
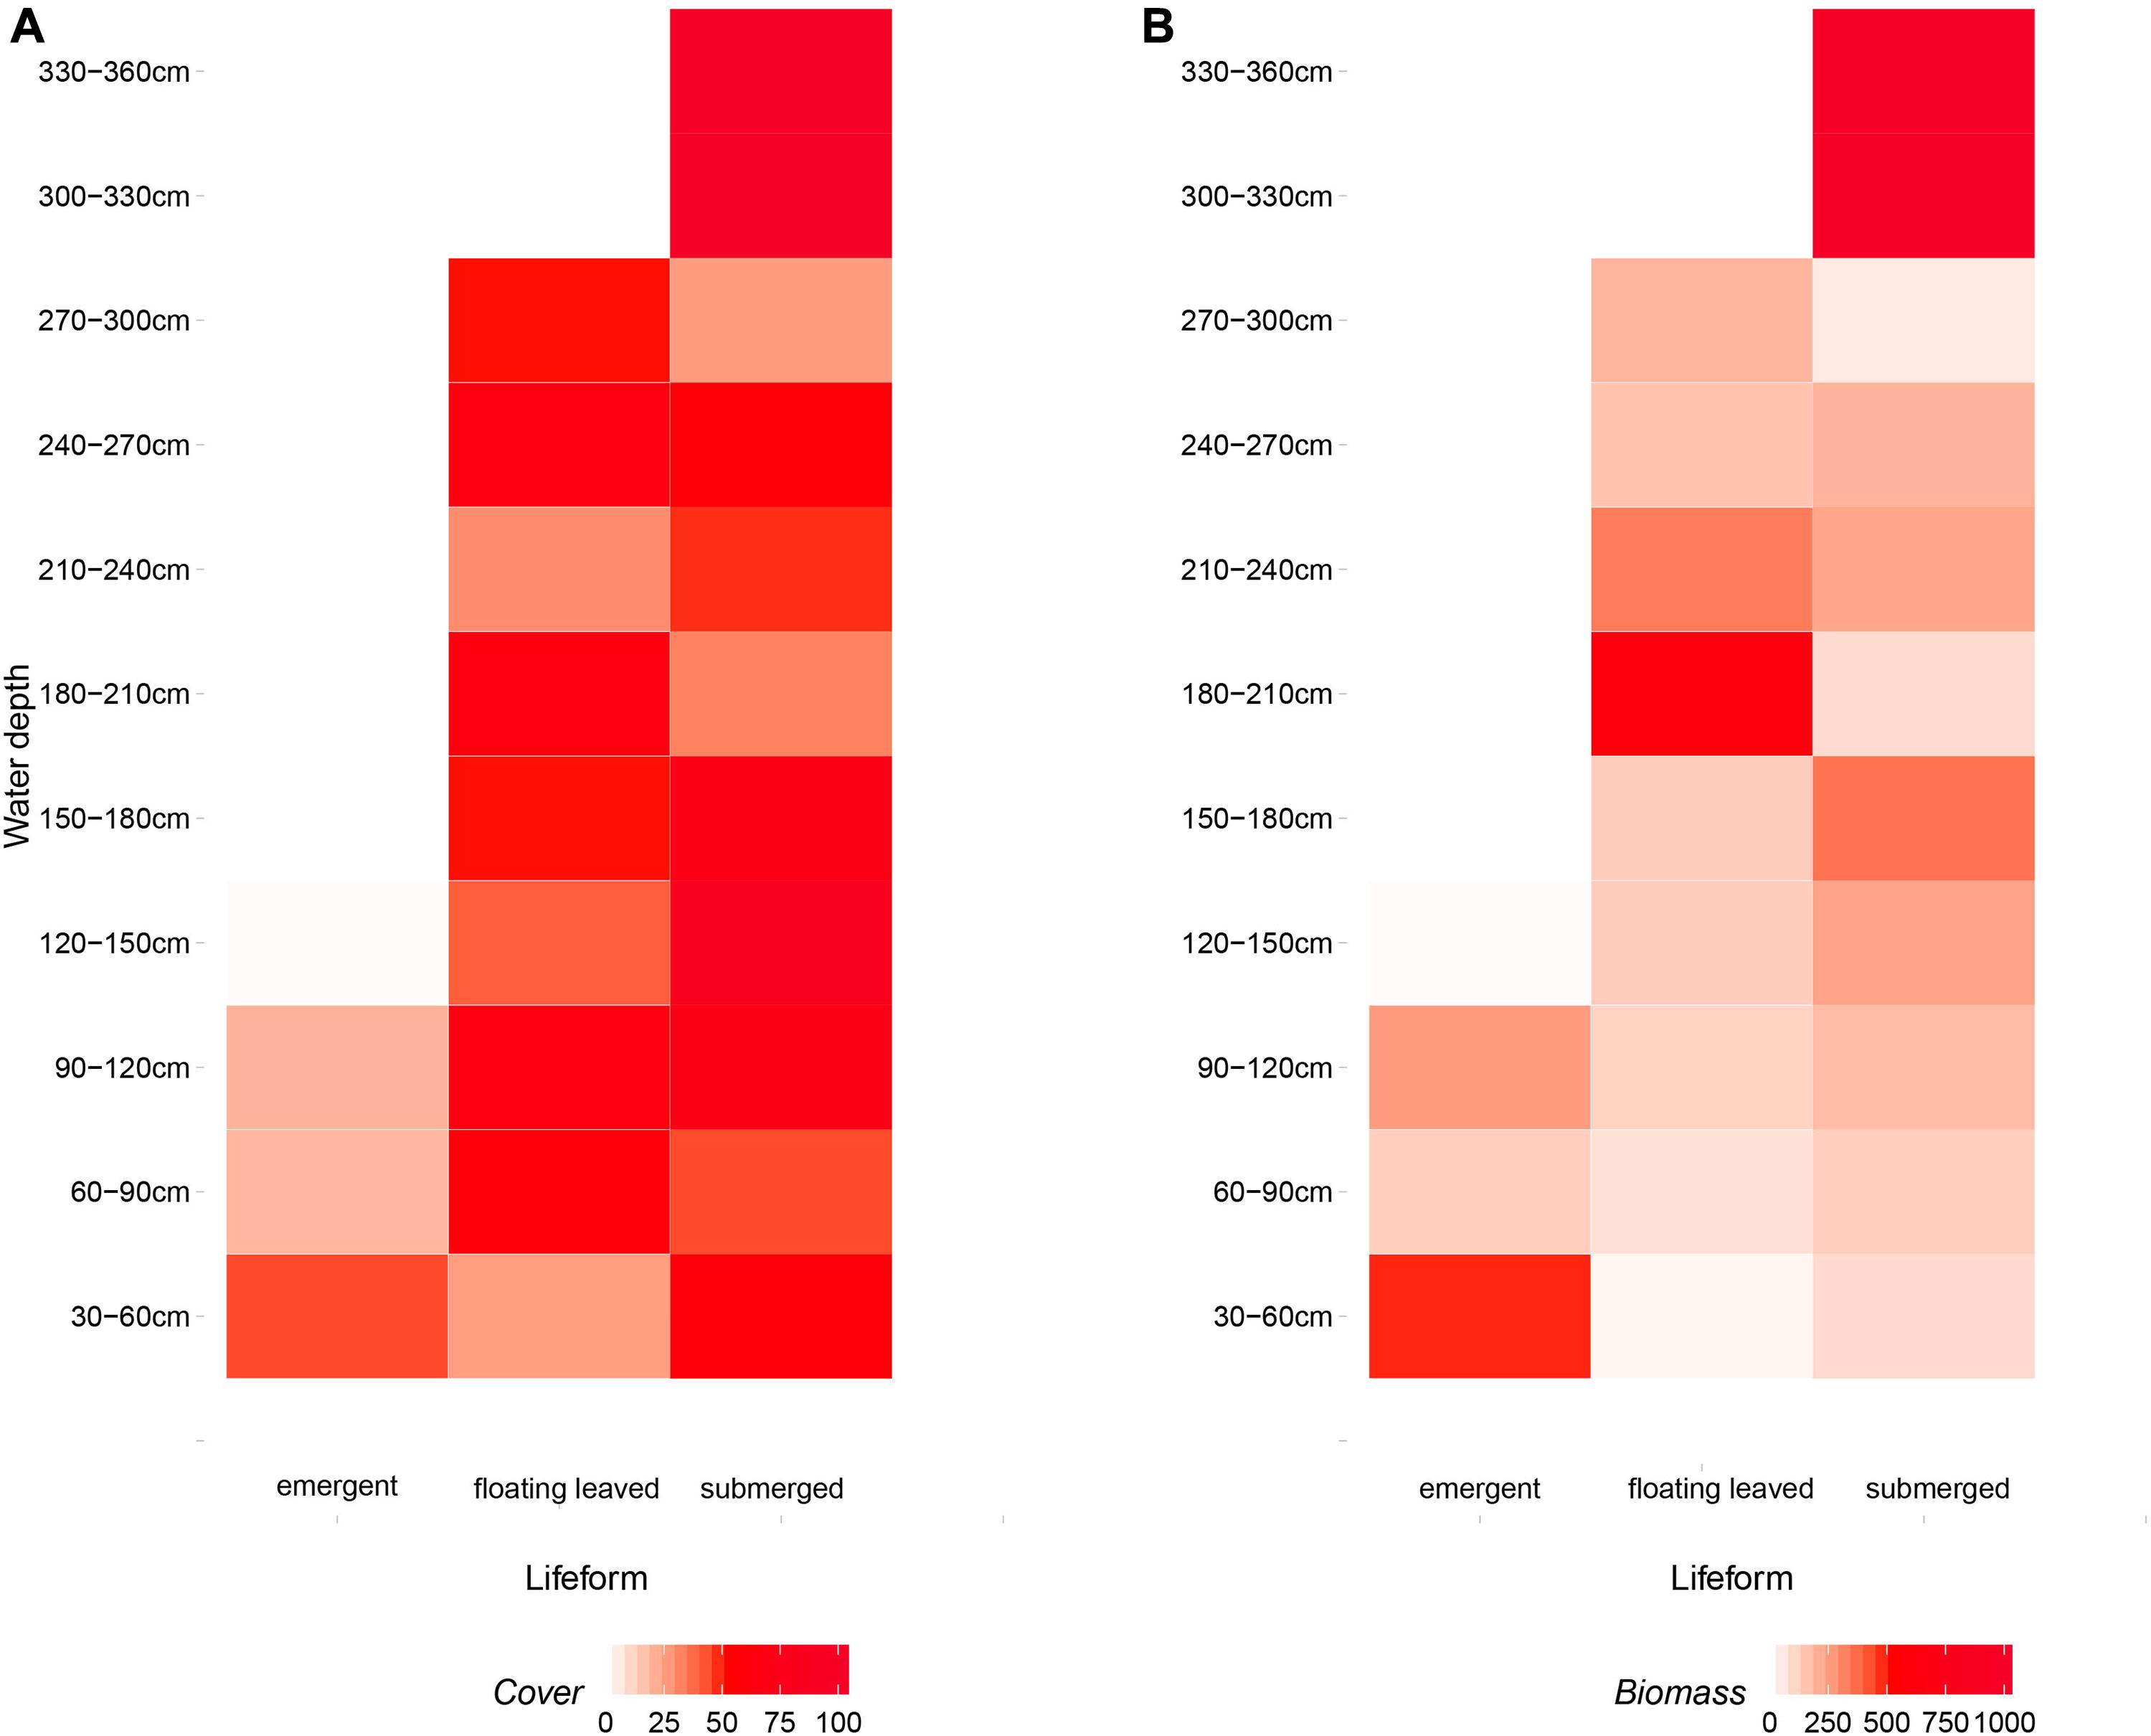
Figure 7. The distribution of (A) coverage and (B) biomass of three life-form macrophytes (emergent, floating-leaved, and submerged plants) on the gradients of water depth. Free-floating plants were excluded because they drifted randomly.
Discussion
The Biodiversity–Biomass Pattern and the Biotic and Abiotic Mechanisms
Our results demonstrate unimodal relationships between biomass and some biodiversity indices, such as richness, Shannon-Wiener index, Shannon diversity, and Simpson diversity (Figure 2). Although this result supports our hypothesis of a unimodal biodiversity–biomass pattern in the macrophyte community, the unimodal pattern in our study is relatively weaker compared with other studies that found an apparent unimodal BPR pattern (Dodson et al., 2000; Leduc et al., 2012; Fei et al., 2018). A previous study about the biomass richness relationship of six taxa (i.e., phytoplankton, rotifers, cladocerans, copepods, macrophytes, and fish) in lakes from Dodson et al. (2000) states that the increasing richness at low biomass is caused by more available energy supporting additional species and trophic levels, and the decreasing richness at high biomass is due to competition between species. In addition, Chase and Leibold (2002) point out that interspecific interactions might have a prominent effect on the BPR pattern at the local scale. However, our results from the DI models indicate that species identity plays a decisive role in the biodiversity–biomass pattern of the macrophyte community rather than interspecific interaction, which contributes barely to the biodiversity–biomass pattern. Different species often have dissimilar impacts on community biomass (Slade et al., 2017), which is proved by the varying direction and magnitude of the estimates each species loads in our study (Supplementary Method). Submerged species V. natans and Najas minor, which have significant negative estimates, contribute little to community biomass. On the contrary, emergent species (e.g., Typha orientalis, Zizania latifolia, and Polygonum sp.), floating-leaved species (e.g., Nelumbo sp.), and free-floating species (e.g., Eichhornia crassipes) have great contribution indicated by significant positive estimates. Besides this, community structure largely depends on the dominant species according to our results (Figure 3). Communities dominated by emergent species, such as Polygonum sp., Z. latifolia, and T. orientalis tend to be at a high level of diversity and biomass, and communities with dominant species, such as C. demersum are prone to have low diversity and high biomass. This further illustrates the importance of species identity in regulating the biodiversity–biomass pattern of the macrophyte community. The large difference of species composition among communities might dilute the correlation between community biomass and biodiversity, which is proved by the weak unimodal patterns in our study. Therefore, considering specific species within community is of great importance when studying the BPR pattern (Slade et al., 2017).
However, both species identity and distribution, which decorates community composition (Nsor et al., 2019) are affected by the environmental condition (Fu et al., 2014). Moreover, species of different life-forms are affected by dissimilar environmental factors (Garcia-Giron et al., 2019). Our results show that the growth of emergent plants is inhibited significantly by water depth (Supplementary Figure 1), which is widely proved by previous studies (Spence, 1967; Hudon et al., 2000; Seabloom et al., 2001; Middleton et al., 2015). Floating-leaved plants in our study are mainly promoted by the TN of the water and have a negative correlation with SS (Supplementary Figure 1) due to reduced wind exposure through leaves covering the water (Bornette and Puijalon, 2011). Generally, submerged plants are negatively related to SS (Nurminen and Horppila, 2009; Pan et al., 2017). Surprisingly, our results present a positive relationship between SS and the growth of submerged plants (Supplementary Figure 1), which might be caused by species identity. To be specific, communities dominated by C. demersum have a high biomass level; however, C. demersum has strong growth ability and tends to be more tolerant of slightly turbid waters (Vanausdall and Dinsmore, 2019). On the contrary, low-biomass species, such as V. natans and N. minor, have higher water quality requirements (Su et al., 2019). The effect of the environment on the growth of macrophyte species emphasizes the critical role of environmental filtering, which points out that few species in the local pool can adapt to extreme conditions, such as insufficient light in deep water (Dodson et al., 2000). In addition, environmental filtering also depends on the trophic state of lakes, which can regulate turbidity and thus macrophyte distribution patterns (Azzella et al., 2014, 2016). In summary, environmental condition may be the crucial factor that profiles the BPR pattern through the effect of species identity and distribution.
The importance of the various biodiversity indices should be addressed in the test of relationships with biomass. In our study, species richness, Shannon diversity, Shannon–Wiener index, and Simpson diversity have significant correlations with biomass (Figure 2). However, evenness indices have no significant correlations with biomass in our study (Figure 2). This is consistent with some previous studies that found no relationship between community evenness and biomass (Wilsey and Polley, 2004; Morris et al., 2014). Wilsey and Polley (2004) state that evenness itself does not alter the BPR pattern. Similarly, Morris et al. (2014) also prove that diversity indices composed of species richness and abundance are more reliable when evaluating the community process compared with evenness indices. Our results reveal that not all diversity indices have a connection with community biomass and emphasize the limited value of community evenness per se in the prediction of BPR pattern and the importance of considering both the species richness and the abundance of each species when exploring the underlying mechanism of the community BPR pattern. Our results also demonstrate that considering multiple diversity indices can provide deeper insight into the community process (Morris et al., 2014).
The Mechanism of Water Depth Driving the Biodiversity–Biomass Pattern
The most explanatory power of water depth proves that the relationship between biodiversity and biomass is depth-dependent. Our study shows that water depth affects the macrophyte BPR pattern mainly through shaping community structure (both biomass and biodiversity) (Figures 5, 6). Submerged and emergent plants occupy aquatic communities together, which results in high diversity in a shallow water area. However, the number of submerged species almost remains constant with the gradual increase in water depth, but emergent plants gradually drop out from the community due to limitations in gas exchange (Sorrell et al., 2012), and this causes the reduction of diversity. This is because water depth primarily correlates with light availability (Su et al., 2019) and impedes gas exchange (Armstrong et al., 1994), and few species can adapt to the low light availability in deep water (Li et al., 2017). The community biomass increases gradually along the water depth gradient as a result of superimposed effects of decreasing biomass of emergent plants and increasing biomass of floating-leaved and submerged plants (Figure 5). The differentiation in distribution and maximum yields of emergent, floating-leaved, and submerged plants along the water depth gradient is due to the dissimilarity of species identity. Recent studies report that emergent plants had a physiological flooding tolerance to water depth (Middleton et al., 2015), and internal oxygen concentrations in deeper water limit the growth of emergent plants (Sorrell et al., 2012). For submerged macrophytes, the positive correlation between water depth and biomass indicates that the positive effect of water depth on the biomass of submerged plants is primarily due to the larger growth space (Hudon et al., 2000) and beneficial adaptation to water depth of some submerged species (e.g., C. demersum), which also can be proved by the largest biomass of communities dominated by C. demersum in our study. With regard to floating-leaved plants, biomass allocation patterns in the different plant organs and stem density contribute to the changes in biomass of floating-leaved plants in varying water depth (Nohara and Kimura, 1997; Paillisson and Marion, 2006). As a whole, water depth is the crucial factor adjusting the BPR pattern of the aquatic macrophyte ecosystem as a result of the effect on species identity and distribution. In other words, the BPR pattern is the reflection of performance of species with different life-forms and identities distributing along the water depth gradient on the axis of biomass and diversity.
Our study is carried out in a macrophyte-dominated shallow lake with a mesotrophic level and may only represent the mesotrophic or oligotrophic shallow lakes in the middle and lower reaches of the Yangtze River because these lakes have a similar macrophyte community structure with Liangzi Lake (Su et al., 2019). Eutrophic lakes may perform different community structures (Penning et al., 2008; Brothers et al., 2013), and investigation of the macrophyte BPR pattern in eutrophic lakes could provide a more general underlying mechanism for how biomass and biodiversity interact with each other generally. Moreover, macrophyte degradation in a deep water area caused by flood in 2016 resulted in the lack of vegetation data in the deep water area, which might also have a non-negligible influence on the generalization of our work. In addition, many studies demonstrate that spatial scale dictates the BPR pattern (Chase and Leibold, 2002; Chase and Ryberg, 2004), and it is of great importance to explore the BPR pattern of the macrophyte community at different scales. Our work may be useful for exploring the biodiversity–biomass pattern and its underlying mechanism at a larger scale. Our study may reveal the BPR to some extent in the macrophyte community due to the close correlation between productivity and biomass production (Carr et al., 1997; Hillebrand and Cardinale, 2010).
Conclusion
Overall, we show weak unimodal patterns between biomass and diversity indices, such as Shannon–Wiener index, Shannon diversity, Simpson diversity, and species richness, and evenness indices have no significant correlation with the community biomass. This reveals that not all biodiversity indices have a connection with the community biomass. Our results illustrate the limited value of community evenness per se in the prediction of biodiversity–biomass patterns and the importance of considering both the species richness and the abundance of each species when exploring the underlying mechanism of community BPR pattern. Species identity rather than interspecific interaction plays a decisive role in the biodiversity–biomass pattern of the macrophyte community. However, species identity within the community is mainly regulated by water depth, which shapes the BPR pattern of the macrophyte community ultimately as a result of effects on species identity and species distribution of the macrophyte community. These results suggest that it may be possible to improve aquatic ecosystem function by adjusting the water level of shallow lakes.
Data Availability Statement
The original contributions presented in the study are included in the article/Supplementary Material, further inquiries can be directed to the corresponding author/s.
Author Contributions
FM collected and analyzed the data and wrote the manuscript. LY, ZZ, and HZ collected the data and contributed to the manuscript. TL calibrated this manuscript and improved the figures. DY, CL, and SF designed the experiment, revised this manuscript, and provided fund support. All authors contributed to the article and approved the submitted version.
Funding
This work was supported by the Major Science and Technology Program for Water Pollution Control and Treatment (2015ZX07503-005), the National Natural Science Foundation of China (31900281), and the China Postdoctoral Science Foundation (2019M650634).
Conflict of Interest
The authors declare that the research was conducted in the absence of any commercial or financial relationships that could be construed as a potential conflict of interest.
Acknowledgments
We would like to thank Hongwei Yu, Yang Li, and Tong Wang for helpful comments on the structure of this manuscript. We also thank Jiangshan Lai for helpful guidance on the methods of model comparison.
Supplementary Material
The Supplementary Material for this article can be found online at: https://www.frontiersin.org/articles/10.3389/fevo.2021.650001/full#supplementary-material
References
Armstrong, W., Brandle, R., and Jackson, M. B. (1994). Mechanisms of flood tolerance in plants. Plant Biol. 43, 307–358. doi: 10.1111/j.1438-8677.1994.tb00756.x
Azzella, M. M., Bolpagni, R., and Oggioni, A. (2014). A preliminary evaluation of lake morphometric traits influence on the maximum colonization depth of aquatic plants. J. Limnol. 73:2. doi: 10.4081/jlimnol.2014.932
Azzella, M. M., Bresciani, M., Nizzoli, D., and Bolpagni, R. (2016). Aquatic vegetation in deep lakes: Macrophyte co-occurrence patterns and environmental determinants. J. Limnol. 76, 97–108. doi: 10.4081/jlimnol.2017.1687
Bai, Y., Wu, J., Pan, Q., Huang, J., Wang, Q., Li, F., et al. (2007). Positive linear relationship between productivity and diversity: evidence from the Eurasian Steppe. J. Appl. Ecol. 44, 1023–1034. doi: 10.1111/j.1365-2664.2007.01351.x
Bandeira, B., Jamet, J.-L., Jamet, D., and Ginoux, J.-M. (2013). Mathematical convergences of biodiversity indices. Ecol. Indic. 29, 522–528. doi: 10.1016/j.ecolind.2013.01.028
Barko, J. W., and Smart, R. M. (1986). Sediment−related mechanisms of growth limitation in submersed macrophytes. Ecology 67, 1328–1340. doi: 10.2307/1938689
Bornette, G., and Puijalon, S. (2011). Response of aquatic plants to abiotic factors: a review. Aquat. Sci. 73, 1–14. doi: 10.1007/s00027-010-0162-7
Brothers, S. M., Hilt, S., Meyer, S., and Kohler, J. (2013). Plant community structure determines primary productivity in shallow, eutrophic lakes. Freshwat. Biol. 58, 2264–2276. doi: 10.1111/fwb.12207
Brun, P., Zimmermann, N. E., Graham, C. H., Lavergne, S., Pellissier, L., Munkemuller, T., et al. (2019). The productivity-biodiversity relationship varies across diversity dimensions. Nat. Commun. 10, 1–11. doi: 10.1038/s41467-019-13678-1
Carr, G. M., Duthie, H. C., and Taylor, W. D. (1997). Models of aquatic plant productivity: a review of the factors that influence growth. Aquat. Bot. 59, 195–215. doi: 10.1016/s0304-3770(97)00071-5
Chalcraft, D. R., Wilsey, B. J., Bowles, C., and Willig, M. R. (2008). The relationship between productivity and multiple aspects of biodiversity in six grassland communities. Biodivers. Conserv. 18, 91–104. doi: 10.1007/s10531-008-9457-6
Chase, J. M., and Leibold, M. A. (2002). Spatial scale dictates the productivity-biodiversity relationship. Nature 416, 427–430. doi: 10.1038/416427a
Chase, J. M., and Ryberg, W. A. (2004). Connectivity, scale-dependence, and the productivity-diversity relationship. Ecol. Lett. 7, 676–683. doi: 10.1111/j.1461-0248.2004.00622.x
Chen, B., Smith, S. L., and Wirtz, K. W. (2019). Effect of phytoplankton size diversity on primary productivity in the North Pacific: trait distributions under environmental variability. Ecol. Lett. 22, 56–66. doi: 10.1111/ele.13167
Chisholm, R. A., Muller-Landau, H. C., Abdul Rahman, K., Bebber, D. P., Bin, Y., Bohlman, S. A., et al. (2013). Scale-dependent relationships between tree species richness and ecosystem function in forests. J. Ecol. 101, 1214–1224. doi: 10.1111/1365-2745.12132
Connolly, J., Bell, T., Bolger, T., Brophy, C., Carnus, T., Finn, J. A., et al. (2013). An improved model to predict the effects of changing biodiversity levels on ecosystem function. J. Ecol. 101, 344–355. doi: 10.1111/1365-2745.12052
Costanza, R., D’arge, R., De Groot, R., Farber, S., Grasso, M., Hannon, B., et al. (1997). The value of the world’s ecosystem services and natural capital. Nature 387, 253–260. doi: 10.1038/387253a0
Craven, D., Isbell, F., Manning, P., Connolly, J., Bruelheide, H., Ebeling, A., et al. (2016). Plant diversity effects on grassland productivity are robust to both nutrient enrichment and drought. Philos. Trans. R. Soc. Lond. B Biol. Sci. 371, 20150277. doi: 10.1098/rstb.2015.0277
Cui, E., Huang, K., Arain, M. A., Fisher, J. B., Huntzinger, D. N., Ito, A., et al. (2019). Vegetation functional properties determine uncertainty of simulated ecosystem productivity: a traceability analysis in the East Asian monsoon region. Glob. Biogeochem. Cycle 33, 668–689. doi: 10.1029/2018GB005909
De Raedt, J., Baert, J. M., Janssen, C. R., and De Laender, F. (2019). Stressor fluxes alter the relationship between beta−diversity and regional productivity. Oikos 128, 1015–1026. doi: 10.1111/oik.05191
Dodson, S. I., Arnott, S. E., and Cottingham, K. L. (2000). The relationship in lake communities between primary productivity and species richness. Ecology 81, 2662–2679.
Dong, B., Qin, B., Gao, G., and Cai, X. (2014). Submerged macrophyte communities and the controlling factors in large, shallow lake Taihu (China): sediment distribution and water depth. J. Great Lakes Res. 40, 646–655. doi: 10.1016/j.jglr.2014.04.007
Duffy, J. E., Godwin, C. M., and Cardinale, B. J. (2017). Biodiversity effects in the wild are common and as strong as key drivers of productivity. Nature 549, 261–264. doi: 10.1038/nature23886
Fang, J., Wang, Z., Zhao, S., Li, Y., Tang, Z., Yu, D., et al. (2006). Biodiversity changes in the lakes of the Central Yangtze. Front. Ecol. Environ 4:369–377. doi: 10.1890/1540-92952006004[0369:BCITLO]2.0.CO;2
Fei, S., Jo, I., Guo, Q., Wardle, D. A., Fang, J., Chen, A., et al. (2018). Impacts of climate on the biodiversity-productivity relationship in natural forests. Nat. Commun. 9, 1–7. doi: 10.1038/s41467-018-07880-w
Fu, H., Zhong, J., Yuan, G., Xie, P., Guo, L., Zhang, X., et al. (2014). Trait-based community assembly of aquatic macrophytes along a water depth gradient in a freshwater lake. Freshwat. Biol. 59, 2462–2471. doi: 10.1111/fwb.12443
Garcia, F. C., Bestion, E., Warfield, R., and Yvon-Durocher, G. (2018). Changes in temperature alter the relationship between biodiversity and ecosystem functioning. Proc. Natl. Acad. Sci. U.S A. 115, 10989–10994. doi: 10.1073/pnas.1805518115
Garcia-Giron, J., Fernandez-Alaez, C., Fernandez-Alaez, M., and Alahuhta, J. (2019). Untangling the assembly of macrophyte metacommunities by means of taxonomic, functional and phylogenetic beta diversity patterns. Sci. Total Environ. 693, 133616. doi: 10.1016/j.scitotenv.2019.133616
Gravel, D., Bell, T., Barbera, C., Bouvier, T., Pommier, T., Venail, P., et al. (2011). Experimental niche evolution alters the strength of the diversity-productivity relationship. Nature 469, 89–92. doi: 10.1038/nature09592
Hillebrand, H., and Cardinale, B. J. (2010). A critique for meta−analyses and the productivity–diversity relationship. Ecology 91, 2545–2549. doi: 10.1890/09-0070.1
Hudon, C., Lalonde, S., and Gagnon, P. (2000). Ranking the effects of site exposure, plant growth form, water depth, and transparency on aquatic plant biomass. Can. J. Fish. Aquat. Sci. 57, 31–42. doi: 10.1139/f99-232
Jeppesen, E., Jensen, J. P., Sondergaard, M., Lauridsen, T. L., and Landkildehus, F. (2000). Trophic structure, species richness and biodiversity in Danish lakes: changes along a phosphorus gradient. Freshwat. Biol. 45, 201–218. doi: 10.1046/j.1365-2427.2000.00675.x
Jeppesen, E., Søndergaard, M., Søndergaard, M., and Christoffersen, K. (2012). The Structuring Role of Submerged Macrophytes in Lakes. New York, NY: Springer Science & Business Media.
Kirwan, L., Connolly, J., Finn, J. A., Brophy, C., Lüscher, A., Nyfeler, D., et al. (2009). Diversity–interaction modeling: estimating contributions of species identities and interactions to ecosystem function. Ecology 90, 2032–2038. doi: 10.1890/08-1684.1
Kuebbing, S. E., Classen, A. T., Sanders, N. J., and Simberloff, D. (2015). Above- and below-ground effects of plant diversity depend on species origin: an experimental test with multiple invaders. New Phytol. 208, 727–735. doi: 10.1111/nph.13488
Leduc, D., Rowden, A. A., Bowden, D. A., Probert, P. K., Pilditch, C. A., and Nodder, S. D. (2012). Unimodal relationship between biomass and species richness of deep-sea nematodes: implications for the link between productivity and diversity. Mar. Ecol. Prog. Ser. 454, 53–64. doi: 10.3354/meps09609
Lembrechts, J. J., De Boeck, H. J., Liao, J., Milbau, A., and Nijs, I. (2018). Effects of species evenness can be derived from species richness – ecosystem functioning relationships. Oikos 127, 337–344. doi: 10.1111/oik.04786
Li, L., Bonser, S. P., Lan, Z., Xu, L., Chen, J., and Song, Z. (2017). Water depth affects reproductive allocation and reproductive allometry in the submerged macrophyte Vallisneria natans. Sci. Rep. 7, 1–9. doi: 10.1038/s41598-017-16719-1
Liang, J., Crowther, T. W., Picard, N., Wiser, S., Zhou, M., Alberti, G., et al. (2016). Positive biodiversity-productivity relationship predominant in global forests. Science 354:6309. doi: 10.1126/science.aaf8957
Loreau, M., and Hector, A. (2001). Partitioning selection and complementarity in biodiversity experiments. Nature 412, 72–76. doi: 10.1038/35083573
Loreau, M., Naeem, S., Inchausti, P., Bengtsson, J., Grime, J. P., Hector, A., et al. (2001). Biodiversity and ecosystem functioning: current knowledge and future challenges. Science 294, 804–808. doi: 10.1126/science.1064088
Luo, W., Liang, J., Cazzolla Gatti, R., Zhao, X., Zhang, C., and Jucker, T. (2019). Parameterization of biodiversity–productivity relationship and its scale dependency using georeferenced tree−level data. J. Ecol. 107, 1106–1119. doi: 10.1111/1365-2745.13129
Ma, W., He, J.-S., Yang, Y., Wang, X., Liang, C., Anwar, M., et al. (2010). Environmental factors covary with plant diversity-productivity relationships among Chinese grassland sites. Glob. Ecol. Biogeogr. 19, 233–243. doi: 10.1111/j.1466-8238.2009.00508.x
Maturo, F. (2018). Unsupervised classification of ecological communities ranked according to their biodiversity patterns via a functional principal component decomposition of Hill’s numbers integral functions. Ecol. Indic. 90, 305–315. doi: 10.1016/j.ecolind.2018.03.013
Mendiburu, F. D. (2009). Agricolae-Package: Statistical Procedures for Agricultural Research. Available online at: http://CRAN.R-project.org/package=agricolae (accessed June 7, 2020).
Meng, X., Zhang, W., and Shan, B. (2020). Distribution of nitrogen and phosphorus and estimation of nutrient fluxes in the water and sediments of Liangzi Lake, China. Environ. Sci. Pollut. Res. Int. 27, 7096–7104. doi: 10.1007/s11356-019-07398-8
Michalet, R., Brooker, R. W., Cavieres, L. A., Kikvidze, Z., Lortie, C. J., Pugnaire, F. I., et al. (2006). Do biotic interactions shape both sides of the humped-back model of species richness in plant communities? Ecol. Lett. 9, 767–773. doi: 10.1111/j.1461-0248.2006.00935.x
Middleton, B. A., Van Der Valk, A. G., and Davis, C. B. (2015). Responses to water depth and clipping of twenty-three plant species in an Indian monsoonal wetland. Aquat. Bot. 126, 38–47. doi: 10.1016/j.aquabot.2015.06.004
Morris, E. K., Caruso, T., Buscot, F., Fischer, M., Hancock, C., Maier, T. S., et al. (2014). Choosing and using diversity indices: insights for ecological applications from the German biodiversity exploratories. Ecol. Evol. 4, 3514–3524. doi: 10.1002/ece3.1155
Müllerová, A., Øehounková, K., and Prach, K. (2020). What is a reasonable plot size for sampling aquatic vegetation? Aquat. Sci. 82, 1–10. doi: 10.1007/s00027-020-00743-x
Nohara, S., and Kimura, M. (1997). Growth characteristics of Nelumbo nucifera Gaertn. in response to water depth and flooding. Ecol. Res. 12, 11–20. doi: 10.1007/bf02523605
Nsor, C. A., Antobre, O. O., Mohammed, A. S., and Mensah, F. (2019). Modelling the effect of environmental disturbance on community structure and diversity of wetland vegetation in Northern Region of Ghana. Aquat. Ecol. 53, 119–136. doi: 10.1007/s10452-019-09677-5
Nurminen, L., and Horppila, J. (2009). Life form dependent impacts of macrophyte vegetation on the ratio of resuspended nutrients. Water Res. 43, 3217–3226. doi: 10.1016/j.watres.2009.04.041
Oksanen, J., Kindt, R., Legendre, P., O’hara, B., Stevens, M. H. H., Oksanen, M. J., et al. (2007). The vegan package. Commun. Ecol. Pack. 10, 631–637.
Paillisson, J.-M., and Marion, L. (2006). Can small water level fluctuations affect the biomass of Nymphaea alba in large lakes? Aquat. Bot. 84, 259–266. doi: 10.1016/j.aquabot.2005.10.004
Palpurina, S., Chytrı, M., Hölzel, N., Tichı, L., Wagner, V., Horsák, M., et al. (2018). The type of nutrient limitation affects the plant species richness–productivity relationship: evidence from dry grasslands across Eurasia. J. Ecol. 107, 1038–1050. doi: 10.1111/1365-2745.13084
Pan, Y., Zhang, X., Song, K., and Da, L. (2017). Applying trait-based method to investigate the relationship between macrophyte communities and environmental conditions in a eutrophic freshwater lake China. Aquat. Bot. 142, 16–24. doi: 10.1016/j.aquabot.2017.06.002
Penning, W. E., Mjelde, M., Dudley, B., Hellsten, S., Hanganu, J., Kolada, A., et al. (2008). Classifying aquatic macrophytes as indicators of eutrophication in European lakes. Aquat. Ecol. 42, 237–251. doi: 10.1007/s10452-008-9182-y
R Development Core Team (2019). R: A Language and Environment for Statistical Computing. Vienna: R Foundation for Statistical Computing. Available online at: http://www.R-project.org/
Roscher, C., Schumacher, J., Weisser, W. W., Schmid, B., and Schulze, E.-D. (2007). Detecting the role of individual species for overyielding in experimental grassland communities composed of potentially dominant species. Oecologia 154, 535–549. doi: 10.1007/s00442-007-0846-4
Scheffer, M., and van Nes, E. H. (2007). “Shallow lakes theory revisited: various alternative regimes driven by climate, nutrients, depth and lake size,” in Shallow lakes in a changing world R.D. Gulati, E. Lammens, N. De Pauw, and E. Van Donk (Dordrecht: Springer). 455–466.
Schleuter, D., Daufresne, M., Massol, F., and Argillier, C. (2010). A user’s guide to functional diversity indices. Ecol. Monogr. 80, 469–484. doi: 10.2307/20787442
Seabloom, E. W., Moloney, K. A., and Van Der Valk, A. G. (2001). Constraints on the establishment of plants along a fluctuating water-depth gradient. Ecology 82, 2216–2232.
Shannon, C. E., and Weaver, W. (1949). A Mathematical Model of Communication. Urbana, IL: University of Illinois Press. 11.
Sheldon, A. L. (1969). Equitability indices: dependence on the species count. Ecology 50, 466–467. doi: 10.2307/1933900
Slade, E. M., Kirwan, L., Bell, T., Philipson, C. D., Lewis, O. T., and Roslin, T. (2017). The importance of species identity and interactions for multifunctionality depends on how ecosystem functions are valued. Ecology 98, 2626–2639. doi: 10.1002/ecy.1954
Sorrell, B. K., Tanner, C. C., and Brix, H. (2012). Regression analysis of growth responses to water depth in three wetland plant species. AoB Plants 2012:ls043. doi: 10.1093/aobpla/pls043
Spence, D. H. N. (1967). Factors controlling the distribution of freshwater macrophytes with particular reference to the Lochs of Scotland. J. Ecol. 55, 147–170. doi: 10.2307/2257723
Squires, M. M., Lesack, L. F. W., and Huebert, D. (2002). The influence of water transparency on the distribution and abundance of macrophytes among lakes of the Mackenzie Delta, Western Canadian Arctic. Freshwat. Biol. 47, 2123–2135. doi: 10.1046/j.1365-2427.2002.00959.x
Su, H., Chen, J., Wu, Y., Chen, J., Guo, X., Yan, Z., et al. (2019). Morphological traits of submerged macrophytes reveal specific positive feedbacks to water clarity in freshwater ecosystems. Sci. Total Environ. 684, 578–586. doi: 10.1016/j.scitotenv.2019.05.267
Van Geest, G. J., Roozen, F. C. J. M., Coops, H., Roijackers, R. M. M., Buijse, A. D., Peeters, E. T. H. M., et al. (2003). Vegetation abundance in lowland flood plan lakes determined by surface area, age and connectivity. Freshwat. Biol. 48, 440–454. doi: 10.1046/j.1365-2427.2003.01022.x
Vanausdall, R. A., and Dinsmore, S. J. (2019). Impacts of shallow lake restoration on vegetation and breeding birds in Iowa. Wetlands 39, 865–877. doi: 10.1007/s13157-018-1120-8
Vila, M., Vayreda, J., Gracia, C., and Ibanez, J. J. (2003). Does tree diversity increase wood production in pine forests. Oecologia 135, 299–303. doi: 10.1007/s00442-003-1182-y
Wang, L., Han, Y., Yu, H., Fan, S., and Liu, C. (2019). Submerged vegetation and water quality degeneration from serious flooding in Liangzi Lake, China. Front. Plant. Sci. 10:1504. doi: 10.3389/fpls.2019.01504
Wardle, D. A., Zackrisson, O., Hornberg, G., and Gallet, C. (1997). The influence of island area on ecosystem properties. Science 277, 1296–1299. doi: 10.1126/science.277.5330.1296
Whittaker, R. H. (1972). Evolution and measurement of species diversity. Taxon 21, 213–251. doi: 10.2307/1218190
Wilsey, B. J., and Polley, H. W. (2004). Realistically low species evenness does not alter grassland species-richness–productivity relationships. Ecology 85, 2693–2700. doi: 10.1890/04-0245
Xiao, S., Michalet, R., Wang, G., and Chen, S.-Y. (2009). The interplay between species’ positive and negative interactions shapes the community biomass-species richness relationship. Oikos 118, 1343–1348. doi: 10.1111/j.1600-0706.2009.17588.x
Xie, D., Zhou, H., Zhu, H., Ji, H., Li, N., and An, S. (2015). Differences in the regeneration traits of Potamogeton crispus turions from macrophyte- and phytoplankton-dominated lakes. Sci. Rep. 5, 1–11. doi: 10.1038/srep12907
Keywords: biodiversity indices, biomass, water depth, macrophyte, freshwater ecosystem, life-form
Citation: Ma F, Yang L, Lv T, Zuo Z, Zhao H, Fan S, Liu C and Yu D (2021) The Biodiversity–Biomass Relationship of Aquatic Macrophytes Is Regulated by Water Depth: A Case Study of a Shallow Mesotrophic Lake in China. Front. Ecol. Evol. 9:650001. doi: 10.3389/fevo.2021.650001
Received: 02 February 2021; Accepted: 05 May 2021;
Published: 07 June 2021.
Edited by:
Mauro Fois, University of Cagliari, ItalyReviewed by:
Rossano Bolpagni, University of Parma, ItalyJorge Salgado Bonnet, University of Nottingham, United Kingdom
Marcus Beck, Tampa Bay Estuary Program, United States
Copyright © 2021 Ma, Yang, Lv, Zuo, Zhao, Fan, Liu and Yu. This is an open-access article distributed under the terms of the Creative Commons Attribution License (CC BY). The use, distribution or reproduction in other forums is permitted, provided the original author(s) and the copyright owner(s) are credited and that the original publication in this journal is cited, in accordance with accepted academic practice. No use, distribution or reproduction is permitted which does not comply with these terms.
*Correspondence: Shufeng Fan, fanran911@163.com; Chunhua Liu, liuchh@163.com