
Characterization of Pollutant Emissions from Typical Material Handling Equipment Using a Portable Emission Measurement System


College of Architecture and Environment, Sichuan University, Chengdu 610065, China
*
Author to whom correspondence should be addressed.
Atmosphere 2021, 12(5), 598; https://doi.org/10.3390/atmos12050598
Submission received: 30 March 2021
/
Revised: 21 April 2021
/
Accepted: 26 April 2021
/
Published: 5 May 2021
(This article belongs to the Special Issue Engine Emissions and Air Quality)
Abstract
:Non-road equipment has been an important source of pollutants that negatively affect air quality in China. An accurate emission inventory for non-road equipment is therefore required to improve air quality. The objective of this paper was to characterize emissions from typical diesel-fueled material handling equipment (loaders and cranes) using a portable emission measurement system. Instantaneous, modal, and composite emissions were quantified in this study. Three duty modes (idling, moving, and working) were used. Composite emission factors were estimated using modal emissions and time-fractions for typical duty cycles. Results showed that emissions from loaders and cranes were higher and more variable for the moving and working modes than the idling mode. The estimated fuel-based CO, HC, NO, and PM2.5 composite emission factors were 21.7, 2.7, 38.2, and 3.6 g/(kg-fuel), respectively, for loaders, and 8.7, 2.4, 28.3, and 0.3 g/(kg-fuel), respectively, for cranes. NO emissions were highest and should be the main focus for emission controls. CO, HC, NO, and PM2.5 emissions measured were different from emission factors in the US Environmental Protection Agency NONROAD model and the Chinese National Guideline for Emission Inventory Development for Non-Road Equipment. This indicates that improving emission inventory accuracy for non-road equipment requires more real-world emission measurements.
1. Introduction
Mobile sources have become important causes of air pollution in major cities around the world [1,2], which make important contributions of particulate matter (PM) and photochemical precursors to the atmosphere [3,4]. Improvements in on-road vehicle emission standards have caused emissions from such vehicles to decrease each year for the past decade [5,6]. The contributions of pollutants from non-road equipment are therefore being paid more attention. It has been found that NOx, PM, CO, and HC emissions from non-road equipment account for 18–29% of emissions from mobile sources of pollutants around the world [7].
Material handling equipment (e.g., loaders, cranes, and forklifts) is an important type of non-road equipment with a large population. These equipment are mainly diesel powered and emit larger amounts of NOx and PM than gasoline-powered vehicles. Thus, emissions from material handling equipment need to be quantified before measures and policies for decreasing pollutant emissions can be developed.
The estimation of emission inventory is an effective way of quantifying pollution caused by non-road equipment. An emission inventory would allow policies to be developed to improve air quality by decreasing emissions from non-road equipment. However, it is more challenging to develop an emission inventory for non-road equipment than on-road vehicles because of a lack of relevant data for non-road equipment. Emissions data used for the development of an emission inventory for non-road equipment have mainly been taken from the NONROAD model [8], the OFFROAD model [9], the EMEP/CRINIR database [10], and a small number of engine dynamometer tests that have been performed in the laboratory but for which the test cycles may not have represented real-world conditions [11,12]. It has been found that emission rates determined under real-world conditions and laboratory conditions may be an order of magnitude different [13,14]. It is therefore essential to characterize real-world pollutant emissions from non-road equipment to improve the accuracy of the non-road equipment emission inventory.
Portable emission measurement systems (PEMSs) are effective instruments for acquiring real-world emission data. A series of PEMSs such as OEM-2100 Montana System (CATI Inc., Leeds, UK), SEMTECH-DS/ECOSTAR (Sensors Inc., Saline, MI, USA), AVL 483/MSS plus Micro-Soot Sensor (AVL Inc., Graz, Austria), and OBS-2000/ONE-GS12 (Horiba Inc., Kyoto, Japan) have been used to measure emissions from non-road equipment during use. A team at North Carolina State University used an OEM-2100 to study the real-time emissions and activity levels of non-road equipment [15,16,17]. It was found that emissions from non-road equipment had large variability under real-world operating conditions. Similar results have been found in studies of non-road equipment emissions using SEMTECH and AVL series PEMSs [18,19,20]. Furthermore, the same types of non-road equipment were found to give different emissions in different studies. This was probably caused by the studies being performed in different locations, testing different equipment, and other factors. Even in single studies, markedly different NOx and PM emissions were found for different types of non-road equipment [17,18,19]. Therefore, more real-world emission data for non-road equipment of different types and uses and with different powers are required to develop an emission inventory for non-road equipment that is more accurate.
There was 4.8 × 10⁶ material handling equipment in use in China in 2017 [21], accounting for 67.3% of the total population of construction equipment. Emissions from material handling equipment may strongly affect regional air quality. It is therefore important to accurately estimate emissions from material handling equipment to allow policies aimed at decreasing emissions to be developed. However, few measurements of real-world emissions from material handling equipment have been made in China, and there is a distinct lack of data for emissions from material handling equipment during use. Emission factors from the NONROAD model and the Chinese National Guideline for Emission Inventory Development for Non-Road Equipment [22] (later called the National Guideline) have been used to develop an inventory of emissions from material handling equipment in China but may not be representative of emissions under real-world conditions. Few studies have been performed involving real-world measurements of emissions from loaders [20], forklifts [23], and cranes. In these studies, it was found that emissions from material handling equipment during use are very variable because of variability in engine attributes, tasks, working conditions, and driver operating habits. Emissions from material handling equipment under real-world conditions in China need to be characterized to improve the understanding of variability in these factors and improve the accuracy of the inventory of emissions from material handling equipment. The aim of this study was to characterize real-world emissions from material handling equipment to provide data for improving equipment management protocols, air quality management plans, and policies. This study is part of a larger project in which real-world emissions from non-road equipment are being quantified. Part of the project is aimed at quantifying emissions from forklifts [23]. The study described here was mainly focused on quantifying emissions from loaders and cranes.
2. Materials and Methods
The method used in this study had three parts: (1) Experimental design for emission measurement; (2) Real-world emission measurements; (3) Data quality control and analysis. These parts are described in detail below:
2.1. Experimental Design for Emission Measurement
The experimental design was in order to measure the gaseous pollutant and PM2.5 emissions from loaders and cranes using a PEMS. This section includes: (1) selection of PEMS; (2) selection of the material handling equipment to be tested; (3) testing duty modes.
2.1.1. Description of the PEMS Used in This Study
The PEMS that was used has been used in previous studies of real-world emissions from other types of construction equipment, including rollers and pavers [24] and excavators [25], and has been shown to give relatively accurate results [23,24,25]. As shown in Figure 1, the system contained five units: a gaseous pollutant emission measurement unit, a PM2.5 sampling unit, an engine parameter measurement unit, a power supply unit, and a data collection unit.
The gaseous pollutant emission measurement unit measured CO, CO2, and HC emissions using non-dispersive infrared sensors. These sensors work on the principle that each compound of interest absorbs infrared light at a particular wavelength that allows the concentration of the compound to be selectively determined in the presence of other compounds. NO and O2 emissions were measured using electrochemical sensors. A change in electrical current caused by a redox reaction of NO on an electrode surface allowed the NO and O2 concentrations to be determined.
A gravimetric method [26] was used to measure PM2.5 emissions. The PM2.5 sampling unit contained a sampling pipe, a dilution system, a gas supply system, an air extraction system, and a sampling system. The sampling pump extracted exhaust gases from the exhaust pipe of the equipment at a constant flow rate. The gases entered the dilution system through the sampling pipe. The dilution system diluted the gases at a dilution ratio of between 15 and 20. The valve was used to adjust the flow rate of the gases passing through the PM2.5 cutting head to 10 L/min. PM2.5 was collected on a polytetrafluoroethylene membrane with a known mass.
The engine parameter measurement unit contained a temperature sensor, a pressure sensor, an engine revolution sensor, and an exhaust temperature sensor, which measured the intake air temperature (IAT), manifold absolute pressure (MAP), engine revolutions per minute (RPM), and exhaust temperature (ET), respectively.
A battery powered the whole system. Data were transmitted using a wireless system (maximum transmission distance: 200 m).
Second-by-second time-based and fuel-based emission rates (for gases) were determined using the PEMS using a mass-balance approach and the ideal gas law, as described in previous publications [27,28]. The PM2.5 emission rate is given as the mean mass emission rate determined from the changes of filter membrane weight.
The PEMS precision was 3 ppm for NO, 0.01% for CO and CO2, and 1 ppm for HC. The instrument was calibrated before and after each measurement using standard gases, one containing high concentrations of the analytes (8.02% CO, 20.06% CO2, 1603 ppm C3H8, and 2950 ppm NO) and the other containing low concentrations of the analytes (0.50% CO, 5.87% CO2, 200.8 ppm C3H8, and 312.5 ppm NO). Furthermore, the data reported by the PEMS were compared with data reported by a HORIBA OBS-2000 system for an engine dynamometer, and the correlation coefficients R2 for the relationships between the time-based emission rates for all of the pollutants of interest were >0.98.
2.1.2. Selection of the Equipment for Testing
It is difficult to obtain real-world measurements of emissions from non-road equipment, unlike light-duty gasoline vehicles. After assessing the implications for safety at the construction sites and the experiment permit, four loaders and five cranes at three construction sites in Chengdu City in Sichuan Province, China, were selected for emission measurements to be made. Information on the loaders and cranes is shown in Table 1. The selected equipment complied with either stage I or II Chinese emission standards and had power ratings between 86 and 170 kW.
2.1.3. Testing Duty Modes
Emissions from non-road equipment will be different at different operating conditions. Thus, different duty modes were designed for loaders and cranes in this study.
In the idling mode, the equipment was not moving or working, and the engine was operating at a low number of revolutions per minute (after the warming up period). PM2.5 emitted by each piece of equipment in the idling mode was sampled for 20–30 min. In the moving mode, the engine was operating, and the equipment was moving forward or backward without performing work. For example, the equipment may have been moving from one location to another without performing a work task. PM2.5 emitted by each piece of equipment in the moving mode was sampled for 10–20 min. In the working mode, a loader or crane was working under normal conditions. PM2.5 emitted by each piece of equipment in the working mode was sampled for 10–20 min.
2.2. Real-World Emission Measurements
At least two hours were required to install and commission the PEMS on the tested equipment before measurements were made. The personnel performing the experiment needed to arrive at an agreed time to install the instrument before the equipment to be tested was used under normal operating conditions. The PEMS was generally placed flat on top of the equipment being tested. A rubber pad was placed underneath the PEMS to prevent vibrations in the equipment from affecting data collection.
The RPM sensor used in this study was determined using an infrared pulse system, which identified each time a reflective strip stuck to the engine spindle passed the sensor. The RPM sensor was installed in a position that allowed the infrared ray emitted by the sensor to hit the reflective strip without any obstruction. The MAP and IAT sensors were installed between the intercooler and the engine cylinder. The ET sensor and gas and PM2.5 sampling pipes were inserted into the exhaust pipe of the equipment and anchored using iron wire. Examples of the PEMS installed on the equipment are shown in Figure 2.
Blank and used filters were equilibrated in a temperature- and humidity-controlled chamber for 24 h and then weighed using an electronic balance. The instrument specifications are shown in Table 2.
Each PM2.5 measurement was made by performing one test, so a fresh filter was installed after a test was completed. Measurements were made more than three times for each duty mode, and each measurement process lasted at least three hours.
2.3. Data Quality Control and Analysis
Data quality control checks were performed to ensure that the collected data were correct and suitable for further analysis. The main steps involved in processing the emission and engine parameter data collected using the PEMS were (1) data synchronization, (2) processing missing and stagnant data, and (3) eliminating abnormal data. The processes have been described in detail in previous publications [22,23]. After the quality control processes had been performed, the data were analyzed further.
2.3.1. Instantaneous Emissions Analysis
Instantaneous emissions mean second-by-second emissions of gaseous pollutants (e.g., NO, HC, CO, and CO2). Instantaneous emission rates for gaseous pollutants and fuel consumption were determined for 100 s in the idling, moving, and working modes.
2.3.2. Modal Emissions Analysis
The effects of the equipment duty mode on emissions were assessed. The duty modes (idling, moving, and working) were defined above. The mean pollutant emission values and 95% confidence intervals for the different duty modes were used in the analyses. Furthermore, in order to determine the influence of power on emissions under different duty modes, the engine power was divided into two ranges (75 kW ≤ P < 130 kW and 130 kW ≤ P < 225 kW).
2.3.3. Composite Emissions Estimation
Composite emission factors for each piece of equipment were calculated using emissions data acquired using the equipment in the idling, moving, and working modes and time-weighted ratios for operation of the equipment determined from video recordings of the equipment during use. The composite emission factors were calculated using Equation (1):
where is the composite emission factor (g/(kg-fuel)) for pollutant i (CO, HC, NO, or PM2.5), j is the duty mode (idling, moving, or working), is the mean emission factor for pollutant i in mode j, and is the proportion of the time the equipment was operated in mode j (determined in a preliminary survey).
3. Results
This section contains (1) a brief description of the emission data; (2) instantaneous emissions for the loaders and cranes; (3) modal emissions for the loaders and cranes; (4) composite emission factors for the loaders and cranes; (5) a comparison of emission data acquired in different studies.
3.1. Brief Description of Collected Emission Data
Second-by-second gaseous pollutant emission and engine parameter data were acquired for 2–3 h for each loader and crane. As shown in Table 3, the quality control processes indicated that 73.2–91.6% and 86.6–94.1% of the loader and crane emission data, respectively, were valid. Between 5 and 11 PM2.5 filter samples were obtained for each piece of equipment.
3.2. Instantaneous Emissions from the Loaders and Cranes
The instantaneous emissions for a typical diesel-fueled loader are shown in Figure 3. The real-time emission and fuel consumption rates for the loader in the idling, moving, and working modes were different. The real-time emission and fuel consumption rates were relatively stable in the idling mode but varied in the moving and working modes. The real-time CO, HC, and NO emission rates in the idling mode were 9.5–18.9, 0.3–0.8, and 3.2–7.0 mg/s, respectively. The CO, HC, and NO emission rates in the moving mode were 12.4–39.5, 0.8–2.1, and 13.1–37.5 mg/s, respectively. The CO, HC, and NO emission rates in the working mode were 10.8–102.4, 0.3–1.7, and 18.4–56.0 mg/s, respectively. The emission rates would have been stable in the idling mode because the engine revolution and fuel consumption rates would have been stable as the engine would not have been under a load. The loader was within the construction area traveling on a very bumpy road during the moving mode test. The driver needed to apply and release the accelerator passing through the construction area. The fuel consumption rate would therefore have varied, causing the gaseous pollutant emission rates to vary. The loader was used to dig, move, and dump during the working mode test. This would have meant that the engine load and fuel consumption rate kept changing dramatically, meaning pollutant emissions would have varied widely. The HC emission rate was higher in the moving mode than in the other modes. This may have been because the loader was traveling over an uneven road during the moving mode test. Combustion would have been unstable because of frequent changes in road conditions, causing incomplete fuel combustion and increased HC emissions.
Instantaneous emissions from a typical crane are shown in Figure 4. Like for the loader, the instantaneous gaseous pollutant emission rates for the crane in the idling, moving, and working modes were different. The real-time CO, HC, and NO emission rates and fuel consumption rates were more stable in the idling mode than in the moving and working modes. The real-time CO, HC, and NO emission rates were 7.2–9.9, 0.4–0.9, and 14.4–19.4 mg/s, respectively, in the idling mode, 7.4–29.3, 2.1–12.6, and 13.4–265.7 mg/s, respectively, in the moving mode, and 9.1–16.4, 2.4–5.0, and 29.7–107.2 mg/s, respectively, in the working mode. The gaseous pollutant emission rates varied more in the moving mode than the other modes. This would have been because there were many traffic lights on the road the crane traveled along from the parking area to the construction area during the test. The driver needed to apply and release the accelerator to speed up and slow down during the journey. The variations in fuel consumption rate caused by this would have caused gaseous pollutant emissions to vary.
3.3. Modal Emissions for Loaders and Cranes
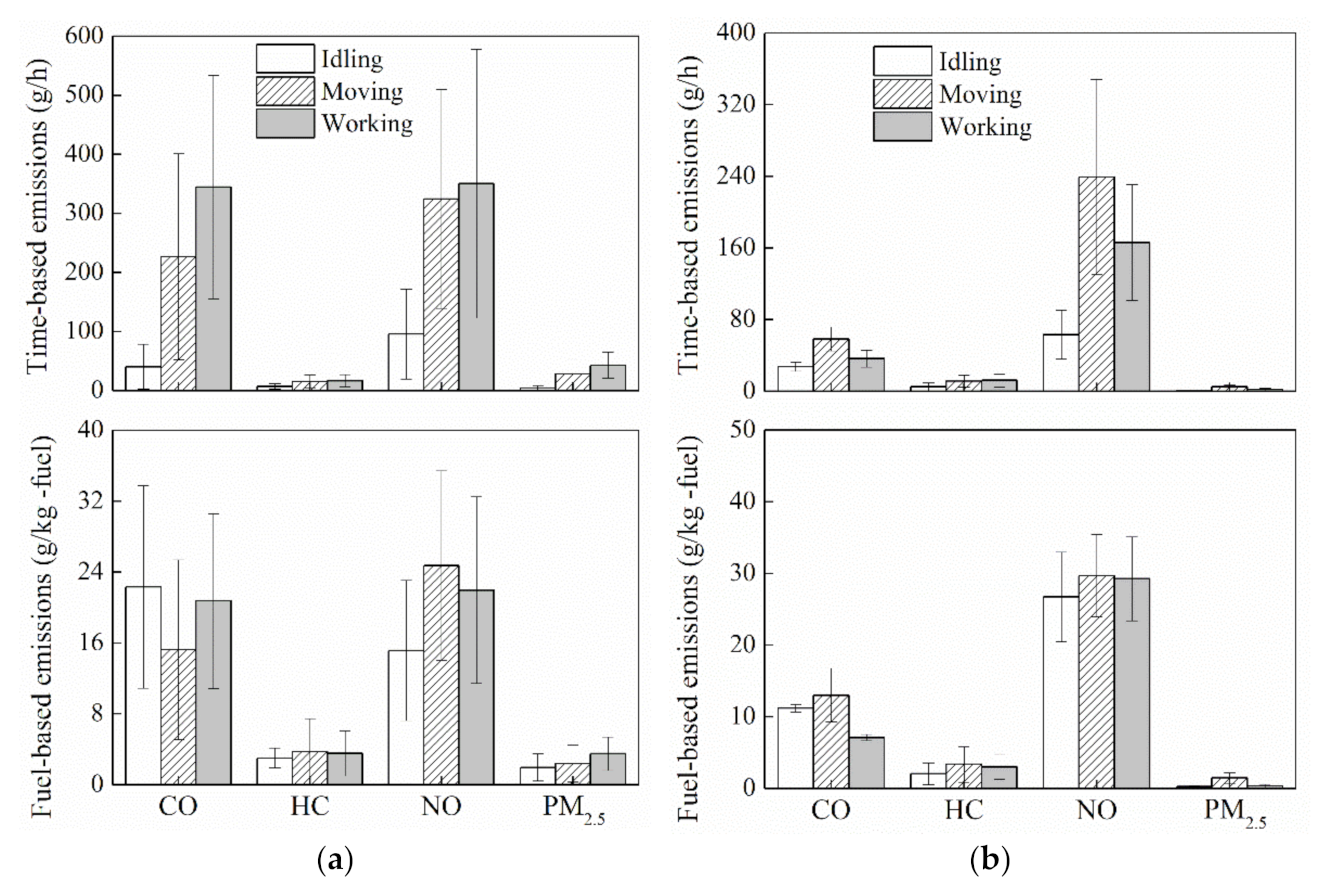
The time-based and fuel-based emission factors for the loaders and cranes in the idling, moving, and working modes are shown in Figure 5. The time-based CO, HC, NO, and PM2.5 emission rates for the loaders were 5.6, 2.1, 3.4, and 6.2 times higher, respectively, in the moving mode than in the idling mode and 8.5, 2.3, 3.7, and 9.5 times higher, respectively, in the working mode than in the idling mode. The time-based CO, HC, NO, and PM2.5 emission rates for the cranes were 2.1, 2.2, 3.8, and 7.0 times higher, respectively, in the moving mode than in the idling mode and 1.3, 2.3, 2.6, and 3.0 times higher, respectively, in the working mode than in the idling mode. The emission rates were, on average, higher in the moving and working modes than in the idling mode.
The time-based emission factors for the different modes were more variable than the fuel-consumption-based emission factors. For example, the maximum to minimum time-based NO emission rate ratios for the loaders in the idling, moving, and working modes were 8.7, 3.7, and 4.7, respectively, and the maximum to minimum fuel-based NO emission rate ratios in the idling, moving, and working modes were 3.2, 2.5, and 2.8, respectively. The maximum to minimum time-based NO emission rate ratios for the cranes in the idling, moving, and working modes were 2.5, 2.6, and 2.3, respectively, and the maximum to minimum fuel-based NO emission rate ratios in the idling, moving, and working modes were 1.6, 1.5, and 1.5, respectively. Similar results have been found in previous studies [17,24]. Furthermore, there were no significant differences between fuel-based emissions in the idling and working modes. For example, the estimated fuel-based CO emission factors for loaders were 10.9–33.8 g/(kg-fuel) in the idling mode and 10.9–30.6 g/(kg-fuel) in the working mode. This indicated that more accurate emission inventories may be constructed using fuel-consumption-based data than time-based data.
The time-based emission rates were higher when the loaders were used in the working mode than in the moving mode. The time-based emission rates were higher when the cranes were used in the moving mode than in the working mode, which would have been caused by the cranes moving relatively quickly from one job to another during the tests. These results indicated that equipment such as cranes and forklifts that can move quickly along a road may give higher emission rates in the moving mode than when loading and unloading.
The time-based and fuel-based emissions for the tested equipment were analyzed using the unified power division method to assess differences in the emission rates of loader and crane engines at different powers. The CO, HC, NO, and PM2.5 emissions for the loaders and cranes with different engine powers in the different duty modes are shown in Table 4. It can be seen that the time-based CO, HC, NO, and PM2.5 emissions for the loaders in the three duty modes increased as the engine power increased.
The time-based CO, HC, NO, and PM2.5 emission rates for loaders in the power range 130 kW ≤ P < 225 kW in the idling mode were 1.7, 1.6, 1.3, and 3.3 times higher, respectively, than the emission rates for loaders in the power range 75 kW ≤ P < 130 kW. The time-based CO, HC, NO, and PM2.5 emission rates for loaders in the power range 130 kW ≤ P < 225 kW in the moving mode were 3.0, 1.6, 2.3, and 1.8 times higher, respectively, than the emission rates for loaders in the power range 75 kW ≤ P < 130 kW. The CO, HC, NO, and PM2.5 rates for loaders in the power range 130 kW ≤ P < 225 kW in the working mode were 2.6, 1,2, 1.9, and 1.1 times higher, respectively, than the emission rates for loaders in the power range 75 kW ≤ P < 130 kW. An engine needs more air and fuel for combustion, and therefore the time-based emission rate increases as the engine power increases and the load increases.
For all pollutants, fuel-based emissions do not exhibit a clear trend among different engine powers and different duty modes. This may be because emissions based on fuel consumption depend on both emission rate and fuel consumption rate. Both emissions and fuel consumption will increase with the increase of engine power and load.
3.4. Composite Emission Factors for Loaders and Cranes
Activity information was estimated from video footage of eight loaders and seven cranes. The idling, moving, and working modes contributed 34.8%, 35.1%, and 30.1%, respectively, of total time for the loaders and 35.6%, 5.0%, and 59.4%, respectively, of total time for the cranes. A crane is not moved to the parking area from the working area until the required work is complete, so, in normal working practice, a crane will have only two duty modes, idling and working.
Composite emission factors based on fuel consumption were calculated for the four loaders and five cranes that were used in this study using Equation (1), and the 95% confidence intervals were also calculated. As shown in Table 5, the emission factors for each pollutant were different for the different types of equipment. The NO emission factor was higher than the emissions factors for the other pollutants; thus, NO emissions from material handling equipment should be the primary target for control. The maximum to minimum fuel consumption ratio for the loaders was 8.1, and the maximum to minimum fuel-based CO, HC, NO, and PM2.5 emission factor ratios were 3.1, 5.7, 14.3, and 2.6, respectively. The maximum to minimum fuel consumption ratio for the cranes was 2.2, and the maximum to minimum fuel-based CO, HC, NO, and PM2.5 emission factor ratios for the cranes were 1.2, 17.2, 1.4, and 5.2, respectively. The differences may have been caused by the different operating modes and working conditions for the different equipment.
Differences between emissions from loaders and crane engines that comply with different emission standards were quantified, and the results are shown in Figure 6. Moving from stage I to stage II decreased NO and PM2.5 emissions by 51.4% and 24.1%, respectively. CO and HC emissions were not significantly affected by moving from stage I to stage II. Therefore, under real-world conditions, compliance with emission standards will be closely related to the equipment used, the operating conditions, and the job characteristics. This implies that current Chinese NO regulations are stringent enough, but CO and HC regulations need to be stricter.
3.5. Comparison of Emission Factors Found in Different Studies
Exhaust gases emitted by loaders and cranes are affected by various factors, such as the engine design, duty mode, and operating conditions. Different emission results have been found in different studies, as shown in Table 6. Fuel-based emissions for the same type or similar types of equipment can vary by factors of between 1.1 and 14.3 for different pollutants. For loaders, CO and PM2.5 emissions were high and HC and NO emissions were moderate in this study relative to previous studies. For cranes, CO, HC, and PM2.5 emissions were lower and NO emissions were moderate in this study compared with previous studies. Few studies of pollutant emissions from non-road equipment in China have been performed, so well-established emission factor models such as NONROAD (developed by the US Environmental Protection Agency) and the Chinese National Guideline Emission Inventory Development for Non-Road Equipment have been used to construct emission inventories for non-road equipment. CO, HC, NO, and PM2.5 emission factors estimated in this study were different from those used in the NONROAD model and the Chinese National Guideline. A more accurate emission inventory for non-road equipment requires local real-world emissions measurements to be made.
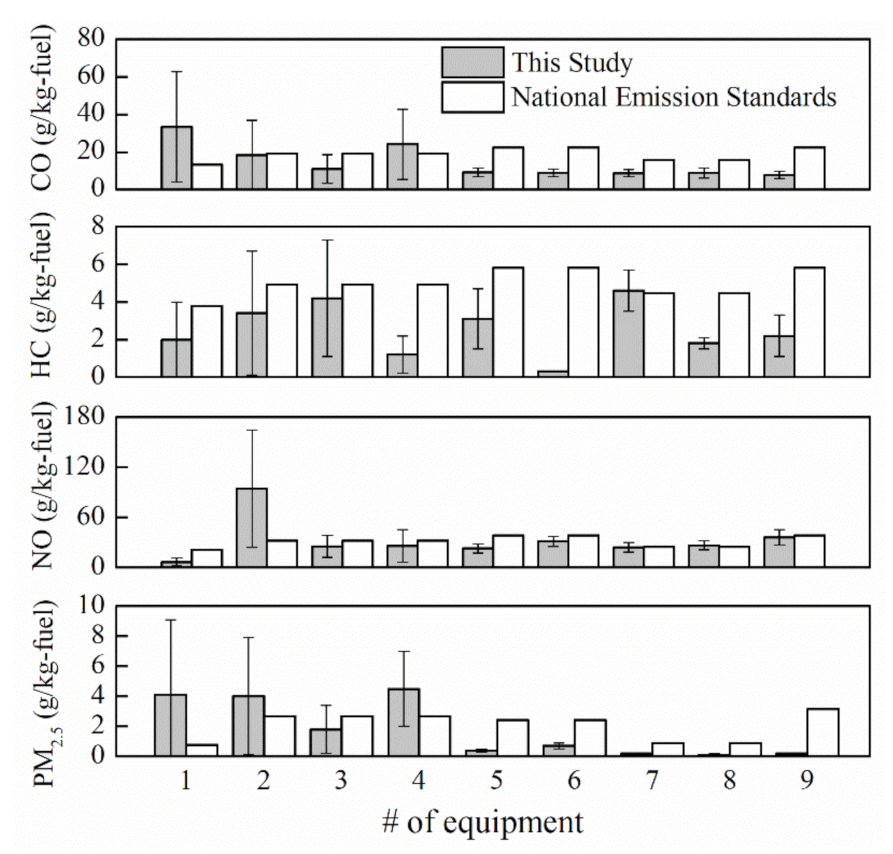
Composite emissions for each type of equipment measured in this study were compared with relevant national emission standards. As shown in Figure 7, emissions from in-use cranes tested in this study met the relevant emission standards. For loaders, real-world CO, NO, and PM2.5 emissions (particularly CO and PM2.5 emissions) might be higher than the relevant national emission standards. Thus, it is particularly important to improve emission measurements for in-use non-road equipment to manage high emission equipment.
Emissions of four pollutants (CO, HC, NO, and PM2.5) from loaders and cranes were measured and estimated. It has previously been found that large fractions of particles (e.g., PM10) are emitted by diesel-fueled engines [29]. Pollutant emissions from diesel-fueled engines should therefore be quantified using real-world PM10 emission measurements and component analysis of PM should be performed in future work.
4. Summary and Conclusions
Emissions from four loaders and five cranes were determined using a PEMS that was capable of making real-world measurements of emissions from non-road equipment (e.g., cranes, excavators, forklifts, loaders, and pavers). The PEMS allows real-world emission data for non-road equipment in China to be collected.
Large intra- and inter-equipment variabilities in pollutant emissions were found. Intra-equipment emission variability was mainly caused by changes in the duty mode pattern. Duty modes should therefore be taken into account when developing representative emission factors for non-road equipment. Inter-equipment emission variability was mainly caused by differences in engine power, model, age, emission standard compliance, and other factors. The CO, HC, NO, and PM2.5 emission rates increased markedly as the engine power increased. The power classification of the engine in a piece of equipment is therefore useful for determining the emission rate.
The fuel-based emission rates were less variable than the time-based emission rates. Fuel-based emission factors may therefore provide relatively stable and accurate estimates for developing emission inventories.
The real-world emissions from diesel-fueled loaders and cranes were markedly different from emissions found in previously published studies. Few studies of emissions from non-road equipment have been performed in China, so standardizing and unifying the instruments and methods used to perform real-world measurements and making more measurements of real-world emissions from non-road equipment are required to improve the accuracy of emission factors. Non-road equipment activities need to be studied further to provide detailed information for developing emission models and inventories, which are necessary to establish appropriate air pollution control policies for China.
NO and PM2.5 emissions from diesel engines were significantly lower for stage II than stage I, but CO and HC emissions were not significantly different for stage II and stage I. This implies that current Chinese emission standards for NO and PM2.5 are stringent enough but current emission standards for CO and HC need to be stricter. Furthermore, even if a non-road equipment engine meets the relevant emission standards when it leaves the factory, emissions during use may exceed the emission standards because of engine aging. Emission inspections for in-use non-road equipment will therefore help effectively control emissions from non-road equipment.
Author Contributions
Conceptualization, K.P. and X.M.; data curation, K.P., X.M., S.M. and Z.Y.; formal analysis, K.P. and S.M.; investigation, K.P. and S.M.; methodology, K.P. and X.M.; software, X.M.; supervision, X.M., and S.M.; validation, K.P.; writing—original draft preparation, K.P.; writing—review and editing, K.P., X.M., S.M., and Z.Y. All authors have read and agreed to the published version of the manuscript.
Funding
This work was supported by the Research Project of the Bureau of Science and Technology of Sichuan (No. 2019YFS0498). Any opinions, findings, and conclusions or recommendations expressed in this material are those of the authors and do not necessarily reflect the views of the sponsor and the university.
Data Availability Statement
Not applicable.
Acknowledgments
We are grateful for financial support from the Research Project of the Bureau of Science and Technology of Sichuan (No. 2019YFS0498). The authors thank all the members of the Atmospheric Modeling and Environmental Data Analysis research group at Sichuan University for their help in real-world emission measurements in this study. We would also like to show deep thankfulness to the reviewers and editors who have contributed valuable comments to improve the quality of the paper.
Conflicts of Interest
The authors declare no conflict of interest.
References
- Ohara, T.; Akimoto, H.; Kurokawa, J.; Horii, N.; Yamaji, K.; Yan, X.; Hayasaka, T. An Asian emission inventory of anthropogenic emission sources for the period 1980–2020. Atmos. Chem. Phys. 2007, 7, 4419–4444. [Google Scholar] [CrossRef] [Green Version]
- Zhang, Q.; Streets, D.G.; Carmichael, G.R.; He, K.B.; Huo, H.; Kannari, A.; Klimont, Z.; Park, I.S.; Reddy, S.; Fu, J.S.; et al. Asian emissions in 2006 for the NASA INTEX-B mission. Atmos. Chem. Phys. 2009, 14, 5131–5153. [Google Scholar] [CrossRef] [Green Version]
- Jathar, S.H.; Woody, M.; Pye, H.O.; Baker, K.R.; Robinson, A.L. Chemical transport model simulations of organic aerosol in southern California: Model evaluation and gasoline and diesel source contributions. Atmos. Chem. Phys. 2017, 17, 4305–4318. [Google Scholar] [CrossRef] [PubMed] [Green Version]
- Blanchard, C.L.; Tanenbaum, S.; Hidy, G.M. Source contributions to atmospheric gases and particulate matter in the southeastern United States. Environ. Sci. Technol. 2012, 46, 5479–5488. [Google Scholar] [CrossRef]
- Dallmann, T.R.; Harley, R.A. Evaluation of mobile source emission trends in the United States. J. Geophys. Res.-Atmos. 2010, 115. [Google Scholar] [CrossRef]
- Xing, J.; Pleim, J.; Mathur, R.; Pouliot, G.; Hogrefe, C.; Gan, C.M.; Wei, C. Historical gaseous and primary aerosol emissions in the United States from 1990 to 2010. Atmos. Chem. Phys. 2013, 13, 7531–7549. [Google Scholar] [CrossRef] [Green Version]
- Yan, F.; Winijkul, E.; Streets, D.G.; Lu, Z.; Bond, T.C.; Zhang, Y. Global emission projections for the transportation sector using dynamic technology modeling. Atmos. Chem. Phys. 2014, 14, 5709–5733. [Google Scholar] [CrossRef] [Green Version]
- United States Environmental Protection Agency (US EPA). User’s Guide for the Final NONROAD2005 Model; USEPA: Washington, DC, USA, 2005. [Google Scholar]
- CARB (California Air Resources Board). User’s Guide for OFFROAD2007; CARB: Sacramento, CA, USA, 2007. [Google Scholar]
- EMEP/EEA. EMEP/EEA Air Pollutant Emission Inventory Guidebook; European Environment Agency: Copenhagen, Denmark, 2016; Available online: https://www.eea.europa.eu/publications/emep-eea-guidebook-2016 (accessed on 27 September 2016).
- Fan, C.Y.; Song, C.L.; Lv, G.; Wang, G.Y.; Zhou, H.; Jing, X.J. Evaluation of carbonyl compound emissions from a non-road equipment diesel engine fueled with a methanol/diesel blend. Appl. Therm. Eng. 2018, 129, 1382–1391. [Google Scholar] [CrossRef]
- Lindgren, M.; Larsson, G.; Hansson, P.A. Evaluation of factors influencing emissions from tractors and construction equipment during realistic work operations using diesel fuel and bio-fuels as substitute. Biosyst. Eng. 2010, 107, 123–130. [Google Scholar] [CrossRef]
- Heidari, B.; Marr, L.C. Real-time emissions from construction equipment compared with model predictions. J. Air Waste Manag. Assoc. 2015, 65, 115–125. [Google Scholar] [CrossRef] [PubMed] [Green Version]
- Pirjola, L.T.; Rönkkö, T.; Saukko, E.; Parviainen, H.; Malinen, A.; Alanen, J.; Saveljeff, H. Exhaust emissions of non-road mobile equipment: Real-world and laboratory studies with diesel and HVO fuels. Fuel 2017, 202, 154–164. [Google Scholar] [CrossRef] [Green Version]
- Abolhasani, S.; Frey, H.C.; Kim, K.; Rasdorf, W.; Lewis, P.; Pang, S.H. Real-world in-use activity, fuel use, and emissions for nonroad construction vehicles: A case study for excavators. J. Air Waste Manag. Assoc. 2008, 58, 1033–1046. [Google Scholar] [CrossRef] [Green Version]
- Pang, S.H.; Frey, H.C.; Rasdorf, W.J. Life cycle inventory energy consumption and emissions for biodiesel versus petroleum diesel fueled construction vehicles. Environ. Sci. Technol. 2009, 43, 6398–6405. [Google Scholar] [CrossRef]
- Frey, H.C.; Rasdorf, W.; Lewis, P. Comprehensive field study of fuel use and emissions of nonroad diesel construction equipment. Transp. Res. Record 2010, 2158, 69–76. [Google Scholar] [CrossRef]
- Cao, T.; Durbin, T.D.; Russell, R.L.; Cocker, D.R.; Scora, G.; Maldonado, H.; Johnson, K.C. Evaluations of in-use emission factors from off-road construction equipment. Atmos. Environ. 2016, 147, 234–245. [Google Scholar] [CrossRef] [Green Version]
- Zavala, M.; Huertas, J.I.; Prato, D.; Jazcilevich, A.; Aguilar, A.; Balam, M.; Misra, C.; Molina, L.T. Real-world emissions of in-use off-road vehicles in Mexico. J. Air Waste Manag. Assoc. 2017, 67, 958–972. [Google Scholar] [CrossRef] [Green Version]
- Fu, M.L.; Ge, Y.S.; Tan, J.W.; Zeng, T.; Liang, B. Characterizations of typical non-road equipment emissions in China by using portable emission measurement system. Sci. Total Environ. 2012, 437, 255–261. [Google Scholar] [CrossRef] [PubMed]
- China Construction Machinery Association (CCMA). China Construction Machinery Industry Yearbook; Mechanical Industry Press: Beijing, China, 2018. [Google Scholar]
- Ministry of Ecology and Environment of the People’s Republic of China (MEE PCR). Chinese National Guideline for Emission Inventory Development for Non-Road Equipment; Ministry of Ecology and Environment: Beijing, China, 2014.
- Pang, K.L.; Zhang, K.S.; Ma, S. Tailpipe emission characterizations of diesel-fueled forklifts under real-world operations using a portable emission measurement system. J. Environ. Sci. 2021, 100, 34–42. [Google Scholar] [CrossRef] [PubMed]
- Li, Z.; Zhang, K.S.; Pang, K.L.; Di, B.F. A fuel-based approach for emission factor development for highway paving construction equipment in China. J. Air Waste Manag. Assoc. 2016, 66, 1214–1223. [Google Scholar] [CrossRef] [PubMed] [Green Version]
- Ma, S.; Zhang, K.S.; Wang, F.; Pang, K.L.; Zhu, Y.; Li, Z.; Mao, H.; Hu, B.; Yang, J.; Wang, B. Characterization of tailpipe emissions from in-use excavators. Environ. Sci. 2019, 40, 1670–1679. [Google Scholar]
- Ministry of Ecology and Environment of the People’s Republic of China (MEE PCR). Determination of Atmospheric Articles PM10 and PM2.5 in Ambient Air by Gravimetric Method; MEE PCR: Beijing, China, 2011. [Google Scholar]
- Vojtisek-Lom, M.; Allsop, J.E. Development of heavy-duty diesel portable, on-board mass exhaust emissions monitoring system with NOx, CO2, and qualitative capabilities. J. Socof Automot. Eng. 2001, 5, 636–642. [Google Scholar]
- Frey, H.C.; Rouphail, N.M.; Unal, A.; Colyar, J. Measurement of on-road tailpipe emissions using a portable instrument. J. Air Waste Manag. Assoc. 2003, 53, 992–1002. [Google Scholar] [CrossRef] [Green Version]
- Chernyshev, V.V.; Zakharenko, A.M.; Ugay, S.M.; Hien, T.T.; Hai, L.H.; Olesik, S.M.; Kholodov, A.S.; Zubko, E.; Kokkinakis, M.; Burykina, T.I.; et al. Morphological and chemical composition of particulate matter in buses exhaust. Toxicol. Rep. 2019, 6, 120–125. [Google Scholar] [CrossRef]
Figure 1.
Schematic of the portable emission measurement system (PEMS) used in the study.

Figure 2.
Installation of the PEMS to the selected equipment for emission measurements.

Figure 3.
Typical emission time series for a diesel-fueled loader in the three duty modes (* FC = fuel consumption).
Figure 3.
Typical emission time series for a diesel-fueled loader in the three duty modes (* FC = fuel consumption).

Figure 4.
Typical emission time series for a diesel-fueled crane in the three duty modes (* FC = fuel consumption).
Figure 4.
Typical emission time series for a diesel-fueled crane in the three duty modes (* FC = fuel consumption).

Figure 5.
Emission rates for (a) loaders and (b) cranes in the three duty modes.

Figure 6.
Emissions from loaders and crane engines that comply with different emission standards.

Figure 7.
Comparison of emissions measured in this study with national emission standards. The fuel-based emission factors from the National Emission Standards were converted from g/(kW·h) using the mean BSFC for a given power range from the NONROAD model, i.e., when P ≥ 75 kW, BSFC = 263.19 g/(kW·h) for loaders or 223.07 g/(kW·h) for cranes.


Table 1.
Complete details about the equipment tested during in-use operation.
| Test Count | Equipment Type | Equipment Model | Engine Model | MY 1 | EP 2 (kW) | ESC 3 (Stage) |
|---|---|---|---|---|---|---|
| 1 | Loader | CG 4 ZL50E-3 | WD10G22CE23 | 2013 | 162 | II |
| 2 | CG 4 ZL30B-2 | 6110/125G-18 | 2007 | 86 | I | |
| 3 | CG 4 ZL30B | 6110/125G-18 | 2008 | 86 | Ⅰ | |
| 4 | CG 4 ZL30B | 6110/125G-18 | 2008 | 86 | Ⅰ | |
| 5 | Crane | XG 5 XZJ5160JQZ12 | D6114ZQ33A | 2003 | 152 | Ⅰ |
| 6 | XG 5 XAJ5164JQZ12 | SC8DK230Q3 | 2009 | 170 | Ⅰ | |
| 7 | XG 5 XZJ5164JQZ12 | SC8DK230Q3 | 2010 | 170 | Ⅱ | |
| 8 | XG 5 XZJ5164JQZ12 | SC8DK230Q3 | 2011 | 170 | Ⅱ | |
| 9 | CJ 6 QZC5102JQZQY8F | YC4E140-30 | 2008 | 105 | Ⅰ |
1 Manufacture year; 2 engine power; 3 emission standards compliance; 4 Chengdu Chenggong Construction Equipment Co., Ltd.; 5 Xuzhou Construction Equipment Co., Ltd.; 6 Sichuan Changjiang Crane Co., Ltd.
Table 2.
Specification and precision of filter treatment instrument.
| Instrument | Model | Specification | Precision |
|---|---|---|---|
| Temperature- and humidity-controlled chamber | YiHeng LHS-80HC-I, China | −5–80 °C; 40–85%RH | High temperature: ±0.5 °C; Low temperature: ±1 °C; Humidity: ±3%RH |
| Electronic balance | Sartorius Quintix 35–1CN, Germany | 0–30 g | 0.01 mg |
Table 3.
Data collection and quality control results of emissions.
| Test Count | Equipment Type | Equipment Model | Date Amount (s) | Data Validity (%) | PM2.5 Samples Number |
|---|---|---|---|---|---|
| 1 | Loader | CG ZL50E-3 | 6349 | 73.2 | 6 |
| 2 | CG ZL30B-2 | 8249 | 88.3 | 7 | |
| 3 | CG ZL30B | 12,032 | 91.6 | 11 | |
| 4 | CG ZL30B | 9150 | 88.4 | 8 | |
| 5 | Crane | XG XZJ5160JQZ12 | 10,993 | 94.1 | 11 |
| 6 | XG XAJ5164JQZ12 | 7660 | 86.6 | 8 | |
| 7 | XG XZJ5164JQZ12 | 9085 | 93.9 | 6 | |
| 8 | XG XZJ5164JQZ12 | 9957 | 89.8 | 5 | |
| 9 | CJ QZC5102JQZQY8F | 9295 | 90.9 | 7 |
Table 4.
Emissions of different loader and crane engines in the different duty modes.
| Duty Mode | Engine Power | Time-Based Emissions (g/h) | Fuel-Based Emissions (g/kg-fuel) | ||||||
|---|---|---|---|---|---|---|---|---|---|
| CO | HC | NO | PM2.5 | CO | HC | NO | PM2.5 | ||
| Idling | 75 ≤ P < 130 | 19.1 ± 11.3 | 3.4 ± 1.8 | 38.2 ± 30.3 | 0.8 ± 1.1 | 13.9 ± 9.3 | 2.6 ± 1.9 | 25.0 ± 12.3 | 0.6 ± 0.9 |
| 130 ≤ P < 225 | 33.4 ± 7.7 | 5.3 ± 4.5 | 50.3 ± 23.9 | 2.6 ± 3.2 | 17.9 ± 12.6 | 2.4 ± 1.6 | 19.9 ± 8.8 | 2.0 ± 3.3 | |
| Moving | 75 ≤ P < 130 | 53.9 ± 26.1 | 7.9 ± 2.8 | 110.3 ± 14.6 | 8.2 ± 8.8 | 13.4 ± 7.1 | 2.9 ± 1.6 | 27.8 ± 3.0 | 2.5 ± 2.8 |
| 130 ≤ P < 225 | 164.2 ± 211.9 | 12.9 ± 6.9 | 253.4 ± 96.5 | 14.9 ± 21.0 | 17.4 ± 8.1 | 3.2 ± 2.6 | 26.5 ± 10.0 | 1.9 ± 1.5 | |
| Working | 75 ≤ P < 130 | 82.0 ± 55.9 | 10.7 ± 9.4 | 108.1 ± 61.1 | 14.3 ± 12.9 | 16.8 ± 9.2 | 3.5 ± 2.3 | 25.8 ± 12.2 | 4.0 ± 2.9 |
| 130 ≤ P < 225 | 212.7 ± 340.3 | 12.9 ± 7.3 | 200.0 ± 88.1 | 16.2 ± 27.0 | 10.5 ± 6.2 | 2.2 ± 1.7 | 23.7 ± 9.2 | 0.7 ± 0.6 | |
Table 5.
Fuel-based emission factors of the tested equipment in this study.
| Test Count | Equipment Type | Fuel Consumption (g/s) | Composite Emissions (g/kg-fuel) | ||||||||
|---|---|---|---|---|---|---|---|---|---|---|---|
| CO | HC | NO | PM2.5 | ||||||||
| Ave | 95%CI * | Ave | 95%CI * | Ave | 95%CI * | Ave | 95%CI * | Ave | 95%CI * | ||
| 1 | loader | 7.2 | (2.5, 11.9) | 33.4 | (11.0, 62.7) | 2.0 | (0.5, 4.0) | 6.6 | (2.8, 11.5) | 4.1 | (0.8, 9.1) |
| 2 | 2.4 | (1.5, 3.3) | 18.4 | (6.0, 36.9) | 3.4 | (1.1, 6.7) | 94.5 | (39.6, 164.9) | 4.0 | (1.3, 7.9) | |
| 3 | 0.9 | (0.6, 1.2) | 11.0 | (4.6, 18.7) | 4.2 | (1.7, 7.3) | 25.4 | (12.6, 38.7) | 1.8 | (0.7, 3.4) | |
| 4 | 1.1 | (0.7, 1.5) | 24.1 | (9.3, 42.7) | 1.2 | (0.5, 2.2) | 26.1 | (11.8, 45.5) | 4.5 | (2.2, 7.0) | |
| 5 | Crane | 1.0 | (0.8, 1.2) | 9.1 | (7.0, 11.4) | 3.1 | (1.8, 4.7) | 22.8 | (17.8, 28.1) | 0.4 | (0.3, 0.5) |
| 6 | 2.2 | (1.4, 2.9) | 9.0 | (6.9, 11.1) | 0.3 | (0.2, 0.3) | 31.4 | (25.6, 37.3) | 0.7 | (0.5, 0.9) | |
| 7 | 1.9 | (1.1, 2.7) | 8.8 | (6.8, 10.8) | 4.6 | (3.6, 5.7) | 24.2 | (19.0, 29.8) | 0.2 | (0.1, 0.2) | |
| 8 | 1.9 | (1.1, 2.8) | 8.9 | (6.4, 11.6) | 1.8 | (1.4, 2.1) | 26.7 | (21.4, 32.1) | 0.1 | (0.1, 0.2) | |
| 9 | 1.4 | (0.8, 1.9) | 7.8 | (6.1, 9.6) | 2.2 | (1.3, 3.3) | 36.3 | (27.7, 45.5) | 0.2 | (0.1, 0.2) | |
* 95% confidence interval.
Table 6.
Comparisons of emissions factors by different studies.
| Emission Factors (g/kg-Fuel) | Equipment Type | Sources | |||
|---|---|---|---|---|---|
| CO | HC | NO | PM2.5 | ||
| 21.73 | 2.70 | 38.18 | 3.59 | Loader | This study |
| 14.28 | 2.37 | 24.42 | 2.01 | Loader | NONROAD [8] |
| 17.47 | 7.61 | 83.38 | 1.48 | Loader | Fu et al. [20] |
| 11.03 | 5.99 | 42.56 | 0.25 | Loader | Frey et al. [17] |
| 8.70 | 2.39 | 28.29 | 0.30 | Crane | This study |
| 9.91 | 2.43 | 25.48 | 1.70 | Crane | NONROAD [8] |
| 10.72 | 3.39 | 32.79 | 2.09 | Construction equipment | National Guideline [22] |
Publisher’s Note: MDPI stays neutral with regard to jurisdictional claims in published maps and institutional affiliations. |
© 2021 by the authors. Licensee MDPI, Basel, Switzerland. This article is an open access article distributed under the terms and conditions of the Creative Commons Attribution (CC BY) license (https://creativecommons.org/licenses/by/4.0/).
Share and Cite
MDPI and ACS Style
Pang, K.; Meng, X.; Ma, S.; Yin, Z. Characterization of Pollutant Emissions from Typical Material Handling Equipment Using a Portable Emission Measurement System. Atmosphere 2021, 12, 598. https://doi.org/10.3390/atmos12050598
AMA Style
Pang K, Meng X, Ma S, Yin Z. Characterization of Pollutant Emissions from Typical Material Handling Equipment Using a Portable Emission Measurement System. Atmosphere. 2021; 12(5):598. https://doi.org/10.3390/atmos12050598
Chicago/Turabian StylePang, Kaili, Xiangrui Meng, Shuai Ma, and Ziyuan Yin. 2021. "Characterization of Pollutant Emissions from Typical Material Handling Equipment Using a Portable Emission Measurement System" Atmosphere 12, no. 5: 598. https://doi.org/10.3390/atmos12050598
Note that from the first issue of 2016, this journal uses article numbers instead of page numbers. See further details here.