Temporal and Spatial Variations of Soil Moisture Over Xinjiang Based on Multiple GLDAS Datasets
 Zengyun Hu1,2,3
  Xi Chen
 Qiming Zhou
- 1State Key Laboratory of Desert and Oasis Ecology, Xinjiang Institute of Ecology and Geography, Chinese Academy of Sciences, Beijing, China
- 2Research Center for Ecology and Environment of Central Asia, Chinese Academy of Sciences, Ürümqi, Xinjiang, China
- 3College of Resources and Environment, University of Chinese Academy of Sciences, Beijing, China
- 4Department of Geography, Hong Kong Baptist University, Kowloon, China
- 5College of Resource and Envrionment Sciences, Xinjiang University, Urumqi, Xinjiang, China
Under the global warming, as the typical arid region of Central Asia, the Xinjiang Uygur Autonomous Region (Xinjiang) has been experienced the remarkable warming and increased precipitation based on large previous studies. The arid and semiarid ecosystem of Xinjiang is very sensitive and vulnerable to climate change and water resource variations. However, the sparse and highly unevenly distributed in-situ stations in this region provide limited data for understanding of the soil moisture variations. In this study, the spatial and temporal changes and variations of soil moisture were explored at annual and seasonal time scales during the period of 2000–2017. The soil moisture data are from the Global Land Data Assimilation System (GLDAS) models, including four GLDAS 1 models: CLM, Mosaic, VIC and Noah 2.7 and one GLDAS 2.1 model: Noah 3.3. Major results show that 1) Noah 3.3 and VIC have the significant positive trends of annual soil moisture with the values of 2.64°mm/a and 0.98°mm/a. The trend of CLM is significant negative. The other two models Mosaic and Noah 2.7 have the weak positive trends. The temporal variations of seasonal soil moisutre are similar the annual soil moisture for each of the model. 2) For the spatial characteristics of the soil mositure variations, CLM displays the negative trends over large part of Xinjiang. Mosaic and VIC have the similar spatial characteristics of the linear trends. Noah 3.3 has the significant positive trends over almost Xinjiang which is different with Noah 2.7. All the five models have the positive trends over KLM. Our results have a better understanding of the soil moisture variations across Xinjiang, and they also enhance the reconginzing of the complex hydrological circulation in the arid regions.
Introduction
As one of the key hydrological variables, soil moisture plays a fundamental role in the complex physical processes, such as infiltration, rainfall-evapotranspiration-runoff circulation, photosynthesis, and groundwater recharge (Ford et al., 2015; Amani et al., 2017; Orth and Seneviratne, 2017; Dari et al., 2019; Gu et al., 2019a). It is known that soil moisture has remarkable impacts on the exchanges of water, energy and carbon fluxes between land surface, vegetation, and atmosphere (Western et al., 2004; Fischer et al., 2007; Trenberth et al., 2007; Qiu et al., 2016; Gu et al., 2019a; Hu et al., 2021). Moreover, it is used to quantify the irrigation water consumption (Jalilvand et al., 2019) and to monitor the drounght variation (Dai et al., 2004; Li et al., 2017; Hu et al., 2019a; Xu et al., 2020). Therefore, the accurate representation and estimation of soil moisture in hydrological models will control the performances of simulations and predications of the hydrological cycle, such as the estimation of groundwater (Scanlon et al., 2018). It is very important to understand the soil moisture changes and variations which is essential to improve the scientific recognizing of regional and global hydrological processes, especially over the arid and semiarid regions.
Because of the importance of soil moisture on the mass and energy balance between the land surface and the atmosphere, lots of techniques have been developed to measure and to monitor its changes and variations. The in-situ measurement stations can describe the true changes of soil moisture in the successive years with high temporal resolution (e.g. in second or minute time scale), although some system errors and measurement errors are resulted from the instruments and the surrounding environments (Holgate et al., 2016). But it is difficult to install the instruments in high-density observation net-works for the poor regions over the world, such as Africa and northwest of China, because of the expensive measurements (Gu et al., 2019a). Satellite soil moisture products and model-based soil moisture products are sourced as the soil moisture data which are widely used to detect the temporal variaitons and spatial patterns of the soil moisture (Fan and Dool, 2004; Yao et al., 2004; Zhou et al., 2010; Beck et al., 2020). Compared with the in-situ measurements, model output of soil moisture has the advantages with the high spatial and temporal resolutions which have been widely employed in regional and global researches to explore different climate and hydrological processes, such as analyzing the historical and future variations of moisture (Cheng et al., 2015; Chen et al., 2016), monitoring the dry and wet changes (Robinson et al., 2016; Hu et al., 2019a), improving the hydrological model simulations (He et al., 2017), and explaining the dynamics of land-atmosphere interactions (Gerken et al., 2015; May et al., 2015).
Several types of soil moisture datasets as the model output are used in previous studies (Qin et al., 2009; Chen et al., 2016), such as Global Land Data Assimilation System (GLDAS; Rodell et al., 2004), Coupled Model Intercomparison Project phase 5 (CMIP5; Berg et al., 2017; Feng et al., 2017), and various reanalysis data sets (e.g. ERA-Interim and MERRA V2) (Modanesi et al., 2020; Spennemann et al., 2020; Zhou et al., 2020). In GLDAS, Land Surface Models (LSMs) and hydrological models were driven by meteorological forcing to simulate soil moisture of multilayers with different depths (Bi et al., 2016; Yuan and Quiring, 2017). Recent study (Gu et al., 2019b) pointed that the soil moisture data of GLDAS 2.1 is better than CMIP 5 when are compared with the satellite datasets.
Xinjiang is the typical arid and semiarid regions over Central Asia. The soil mositure plays a key role for the complex hydrological process, especially in the desert regions. However, there are only few in-situ measurements and they are very difficult employed. Therefore, four GLDAS 1 models: CLM, Mosaic, VIC and Noah 2.7 and one GLDAS 2.1: Noah 3.3 are employed to explore the soil moisture variations. In this study, we aim to 1) detect the temporal changes of soil moisture at different time scales since the 21st century: during the period of 2000–2017; 2) to analyze the spatial patterns of the soil moisture varaitions. The paper is organized as follows. In Study Area, Dataset and Methodology, the study area, dataset and methodology are introduced. In Result and Discussion, the major results and discussion are displayed. In the last section, a conclusion is provided.
Study Area, Dataset and Methodology
Study Area
The study area is located in Northwest China covering more than 1.6 million km2 of 73°40´∼96°23′E and 34°25´∼49°10′N (Figure 1). Its complex topography characterizes with mountainous, plain and basin areas. There are three mountain ranges in Xinjiang, namely, the Altai Mountains (ATM) in the north, Tianshan Mountains (TSM; the “Water Tower” of Central Asia) in the middle, and the Kunlun Mountains (KLM) in the south. The Junggar Basin (JGB) and Tarim Basin (TRB) are situated between the three mountain ranges from north to south. Most of the irrigated areas are distributed in the piedmont plains and the edges of basins (Figure 1).
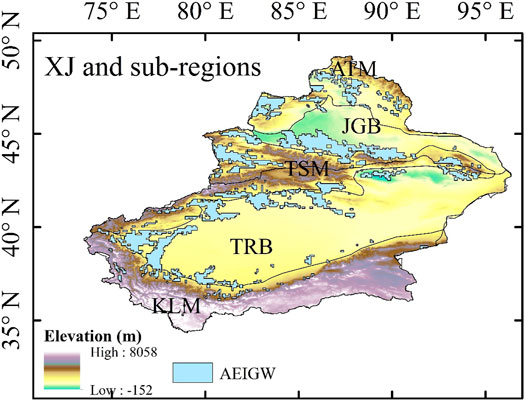
FIGURE 1. Study area: Xinjiang (XJ) and the locations of the five sub-regions, i.e. Altain Mountainous (ATM), Junggar Basin (JGB), Tianshan Mountainous (TSM), Tarim Basin (TRB) and Kunlun Mountainous (KLM). The black line denotes the boundary of the sub-regions. The blue represents the area of irrigation from groundwater which are extracted from the Global Map of Irrigation Areas (GMIA) V5.0 of the Food and Agriculture Organization of the United Nations, AEIGW: area equipped for irrigation with groundwater.
Xinjiang is dominated by an arid and semi-arid climate with very low precipitation and strong evaporation. The average of annual precipitation is 157 mm which only accounts for 24.2% of averaged precipitation (i.e. 650 mm) across China (Chen et al., 2012). In addition, precipitation in this region varies with high spatial difference and large inner-annual variation (e.g. more precipitation in mountainous areas than in plain areas; more precipitation in spring and summer than in autumn and winter) (Hu et al., 2016a; Chen et al., 2018). In the past three decades, Xinjiang experienced a significant warm-wet trend (Hu et al., 2014; Hu et al., 2017; Hu et al., 2018). Although the Xinjiang’s climate transited from warm-dry to a warm-wet in the 1980s (Shi, et al., 2007; Hu et al., 2016b), water resources are still limited and hardly meet the increasing water demand for economy development and population growth in Xinjiang. As an important and irreplaceable water source for Xinjiang, groundwater plays a key role for domestic water supplies and agricultural irrigation in oasis (Hu et al., 2019b).
Dataset and Methodology
Global Land Data Assimilation System (GLDAS) aims to consolidate satellite- and ground based observational data products to generate optimal fields of land surface states and fluxes by using advanced land surface modeling and data assimilation techniques (Rodell et al., 2004). At present, GLDAS consists of simulations of four Land Surface Models (LSMs): Noah, Catchment, the Community Land Model (CLM), and the Variable Infiltration Capacity (VIC). At present, GLDAS drives six land surface models (LSMs): Noah, Catchment, Mosaic, the Common Land Model (CLM), the Community Land Surface Model (CLSM), and the Variable Infiltration Capacity (VIC). The GLDAS datasets [GLDAS Version 1 (GLDAA-1), GLDAS Version 2.0 (GLDAS-2.0) and GLDAS Version 2.1 (GLDAA-2.1)] have the five temporal resolutions from 1 h to 1 month and the eight spatial resolutions from 0.1 ×0.1 –1.25 ×1.25 (https://disc.sci.gsfc.nasa.gov/datasets?keywords=GLDAS). GLDAS-1 forcing datasets include: bias-corrected European Center for Medium-Range Weather Forecasts (ECMWF) Reanalysis data for 1979–1993, bias-corrected National Center for Atmospheric Research (NCAR) Reanalysis data for 1994–1999 (Berg et al., 2003); National Oceanic and Atmospheric Administration (NOAA)/Global Data Assimilation System (GDAS) atmospheric analysis fields for 2000 (Derber et al., 1991), and a combination of NOAA/GDAS atmospheric analysis fields, spatially and temporally disaggregated NOAA Climate Prediction Center Merged Analysis of Precipitation (CMAP) (Xie and Arkin, 1996) fields, and observation-based downward shortwave and longwave radiation fields from the Air Force Weather Agency (AFWA) for 2001-present. GLDAS-2.1 forcing datasets (2001-present) include a combination of NOAA/GDAS atmospheric analysis fields (Derber et al., 1991), temporally disaggregated Global Precipitation Climatology Project (GPCP) precipitation fields (Adler et al., 2003), and the Air Force Weather Agency’s Agricultural Meteorological modeling system (AGRMET) radiation fields (March 2001 onwards) (https://disc.gsfc.nasa.gov/information/documents/5a70903bca6d24bac24118eb/gldas-lsm-description).
Because GLDAS datasets provide high spatiotemporal resolutions variables which makes it is an effective resource to study the water cycle based on these datasets, they have been widely used in many previous studies (Scanlon, et al., 2012; Mukheriee and Ramachandran, 2018; Kong et al., 2019; Chen and Yuan, 2020; Hoffmann et al., 2020; Niu, et al., 2020; Solander et al., 2020; Hu et al., 2021). To match the temporal (monthly) and spatial resolution (1.0 × 1.0) of the GRACE datasets, the GLDAS LSMs datasets examined in this study are those included in GLDAS V1 VIC and Mosaic with the period of 1979-present, and GLDAS V2.1 Noah V3.3 with the period of 2000-present.
The soil moisture from the GLDAS V1 (i.e. CLM, Mosaic, VIC and Noah 2.7) with the period of 1979-present and the spatial resolution of 1.0 × 1.0 and the GLDAS V2.1 (Noah 3.3) with the period of 2000-present and the spatial resolution of 1.0 × 1.0 are used in this study to estimate the changes in soil moisture. The soil moisture in this study is the summation of all the layers for each model, such as three layers for VIC, and four layers for Noah and Mosaic.
VIC was originally developed by Liang et al. (1994), Liang et al. (1996) at the University of Washington in early 90’s. The model focuses on runoff processes that are represented by the variable infiltration curve, a parameterization of sub-grid variability in soil moisture holding capacity, and nonlinear baseflow. VIC is a stand-alone, 1-D column model that is run uncoupled. Various simulation models are available including water balance, energy balance, frozen soil, and other special cases. As a macroscale hydrological model, VIC models sub-grid variability in the soil moisture storage capacity and bas flow as a nonlinear recession. In GLDAS-1, VIC model includes three soil layers (0–10, 10–160, and 160–190 cm) and was simulated in water balance mode with computing energy fluxes (Cherkauer and Lettenmaier, 2003). Therefore, the VIC data includes water budget components and forcing fields but without energy budget components.
Noah is a National Centers for Environmental Prediction/Oregon State University/Air Force/Hydrologic Research Lab (Noah) Model. The community Noah LSM was developed in 1993 through a collaboration of investigators from public and private institutions, spearheaded by the National Centers for Environmental Prediction. Current development efforts are consistent with the land surface scheme in Weather Research Forecast (WRF) system, under the Unified Noah LSM (Chen et al., 1996; Chen et al., 1997; Koren et al., 1999; Chen and Dudhia, 2001; Ek et al., 2003). Noah is a stand-alone, 1-D column model which can be executed in either coupled or uncoupled mode. The model applies finite-difference spatial discretization methods and a Crank-Nicholson time-integration scheme to numerically integrate the governing equations of the physical processes of the soil-vegetation-snowpack medium. It includes four soil layers (0–10, 10–40, 40–100, and 100–200 cm), single layer snowpack, and frozen soil physics. Canopy, snow, and soil moisture storage are included in Noah.
Mosaic (Koster and Suarez, 1996) is a well-established and theoretically sound LSM, as demonstrated by its performance in the Project for Intercomparison of Land-surface Parameterization Schemes (PILPS) and Global Soil Wetness Project (GSWP) experiments. Mosaic’s physics and surface flux calculations are similar to the SiB (simple biosphere model) LSM (Sellers et al., 1986). It is a stand-alone, 1-D column model that can be run both uncoupled and coupled to the atmospheric column. Mosaic divides each model grid cell into a Mosaic of tiles based on the distribution of vegetation types within the cell. It has four soil layers: 0–2, 2–150, and 150–350 cm.
Because GLDAS datasets provide hydrological variables in high spatial and temporal resolutions, they have been widely used in many previous studies in the field of hydrology (Kong et al., 2019; Chen and Yuan, 2020; Hoffmann et al., 2020; Niu, et al., 2020; Solander et al., 2020). The soil moisture from the GLDAS V1 (i.e. CLM, Mosaic, VIC and Noah 2.7) and the latest GLDAS dataset (Noah 3.3) with the spatial resolution of 1.0 × 1.0 are used in this study to estimate the changes in soil moisture. The soil moisture in this study is the summation of the different layers for each model.
The soil moisture analysis is carried out at multiple time scales from monthly, seasonal to annual. The four seasons are spring [March-May (MAM)], summer [June-August (JJA)], autumn [September–November (SON)] and winter [December-February (DJF)]. The changes of the soil moisture is quantified by the linear trend which is computed by the linear least square method, and the significant of the linear trend is detected by the Student’s test at the 95% or 99% confidence level (p < 0.05 or p < 0.01).
Result and Discussion
Temporal Variations of Soil Moisture During 2000–2017
The temporal variations and changes of soil moisture of the five GLDAS models: CLM, Mosaic, VIC, Noah 2.7 and Noah 3.3 over Xinjiang are explored using the linear trends at annual and seasonal time scales (Table 1; Figures 2, 3). For annual soil moisture, CLM displays the significant negative linear trend with the rate of −0.42 mm/a at a 99% confidence level (p < 0.01) which indicates the decreasing soil moisture in Xinjiang (Table 1 and Figure 2). For the other four models, Noah 3.3 has the largest positive trend (2.64 mm/a), and followed by VIC with the rate of 0.98 mm/a. Moreover, the trends of Noah 3.3 and VIC are significant at 99% confidence level (p < 0.01). The positive trends of Mosaic and Noah 2.7 are not significant at 95% confidence level. Furthermore, all the five models show an obvious increasing during the period of 2000–2011 except CLM from Figure 2.
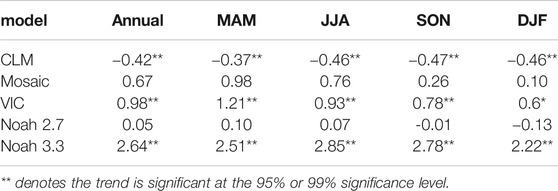
TABLE 1. Linear trends (mm/a) of the soil moisture of the five models at annual and seasonal scales during the period of 2000–2017.
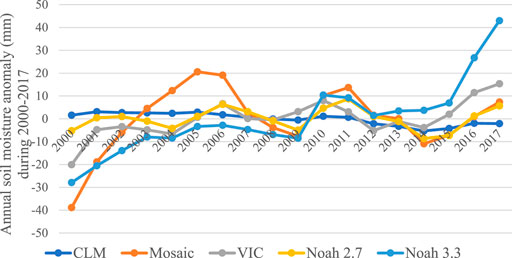
FIGURE 2. Anomaly of annual soil moisture of the five different models: CLM, Mosaic, VIC, Noah 2.7 and Noah 3.3 over Xinjiang during the period of 2000–2017.
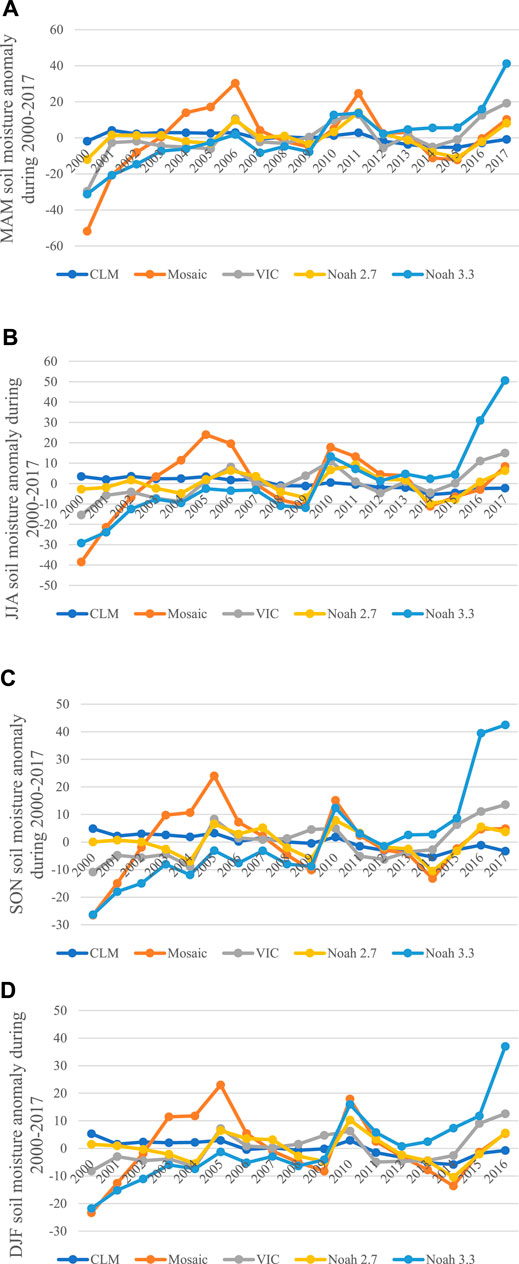
FIGURE 3. Anomaly of seasonal soil moisture of the five different models: CLM, Mosaic, VIC, Noah 2.7 and Noah 3.3 over Xinjiang during the period of 2000–2017, (A) MAM, (B) JJA, (C) SON and (D) DJF.
For the seasonal soil moisture, these models display the different variations. For the changes of the MAM soil moisture, CLM also has the negative trend with the value of −0.37 mm/a which is significant at the 99% confidence level (p < 0.01) (Table 1, Figure 3A). Noah 3.3 has the largest positive trend of MAM soil moisture among the five models with the value of 2.51 mm/a (p < 0.01) (Table 1) which displays the obvious variations in Figure 3A. VIC has the second largest positive trend (1.21 mm/a) which is also significant at the 99% confidence level (p < 0.01) (Table 1 and Figure 3A). The trends of MAM soil moisture of Mosaic and Noah 2.7 are 0.98 mm/a and 0.1 mm/a, respectively (Table 1).
For JJA, Noah 3.3, VIC, Mosaic and Noah 2.7 have the positive trends with the values of 2.85, 0.93, 0.76, and 0.07 mm/a, respectively (Table 1). The trends of Noah 3.3 and VIC are also significant at the 99% confidence level. The significant negative trend of soil moisture is still obtained in CLM with the value of −0.46 mm/a (p < 0.01) (Table 1, Figure 3B).
As the other seasons, CLM still has the significant negative trends in both SON and DJF with the values −0.47 and −0.46 mm/a (p < 0.01) (Table 1). The weak negative trends are obtained for SON and DJF soil moisture in Noah 2.7 which are different from annual, MAM and JJA. Significant positive trends of VIC and Noah 3.3 are observed for SON and DJF soil moisture with the values of 0.78 and 0.6 mm/a for VIC, and 2.78 and 2.22 mm/a for Noah 3.3 (p < 0.01) (Table 1, Figures 3C,D). The positive trends of Mosaic are 0.26 and 0.1 mm/a for SON and DJF over Xinjiang during the period of 2000–2017.
On the whole, CLM has the significant negative trends of soil moisture at annual and seasonal scales. Mosaic, VIC and Noah 3.3 have the positive trends for annual and seasonal soil moisture. The annual and seasonal soil moisture trends of Noah 2.7 are weak which indicate the weak variations of soil moisture. Moreover, Noah 3.3 has the largest positive trends among the five models.
Spatial Distributions of Linear Trends of Annual Soil Moisture
For the spatial distributions of linear trends of annual soil moisture, the five models display the different spatial patterns (Figure 4). Specifically, for CLM, 18% areas have the significant positive trends with the distribution over mountainous areas, such as TSM and KLM (Figures 4A, 5A). More than half areas have the significant negative trends mainly over JGB and TRB (63%, Figures 4A, 5B). For Mosaic, 27% areas have the significant positive trends over part of ATM, TSM, TRB and KLM (Figures 4B, 5A). For the areas with negative trends, they account for 34% over Xinjiang (Figures 4B, 5B). VIC has the similar spatial patterns as Mosaic with the 29% significant positive areas and 36% significant negative areas (Figures 4C, 5). The significant positive trends are distributed over 22% areas (e.g. eastern of KLM) and 51% areas have the significant negative trends for Noah 2.7 (Figures 4D, 5). For Noah 3.3, largely areas show the positive trends with the significant positive trends over more than 60% areas, and the significant negative trends only account for less than 8% areas (Figure 4E).
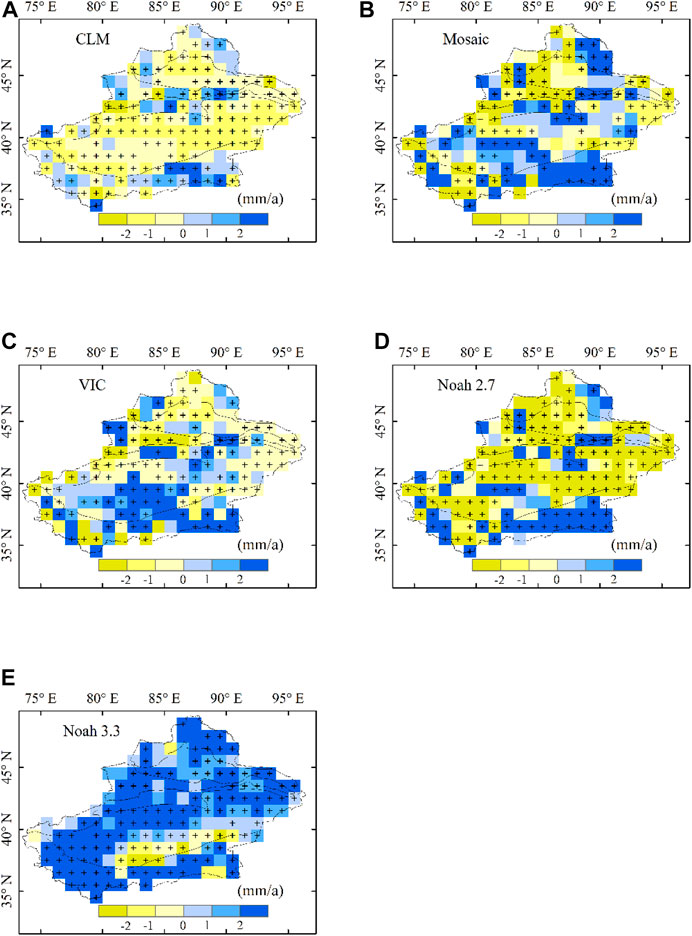
FIGURE 4. Spatial distributions of the linear trends (mm/month) of the annual soil moisture for five models during 2000–2017, (A) CLM, (B) Mosaic, (C) VIC, (D) Noah 2.7 and (E) Noah 3.3. The cross signs denote the trends are significant at the 95% significance level.
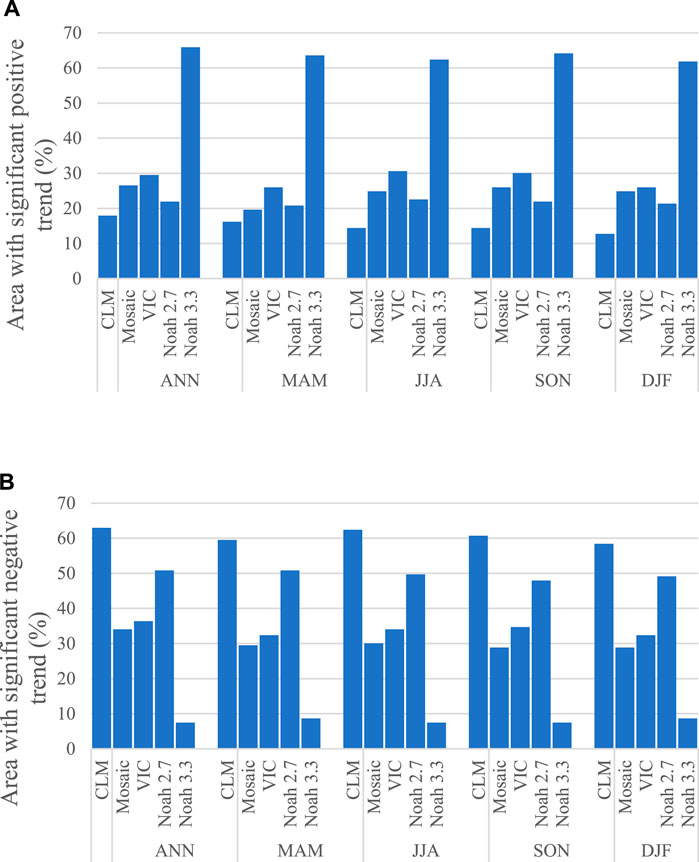
FIGURE 5. Percentage of areas with significant positive (A) and negative (B) trends of the five different models at annual and seasonal scales.
Overall, all the models show the positive trends over KLM. Mosaic and VIC has the similar distributions. Noah 2.7 and Noah 3.3 have the opposite linear trends. These differences among the five models may be caused by their different input datasets and different model structures.
Spatial Distributions of Linear Trends of MAM and JJA Soil Moisture
For the spring soil moisture (i.e. MAM soil moisture), the five models have the similar spatial distributions of the linear trends as the ANN soil moisture (Figure 6). In small areas (16%), CLM has the significant positive trends, and less than 60% areas have the significant negative trends (Figures 5, 6A). For Mosaic, the significant positive areas account for 20% and the 29% areas have the significant negative linear trends (Figure 5). Moreover, the center of the positive trend areas is mainly in KLM (Figure 6B). In terms of VIC model, the areas with significant positive trends and significant negative trends are 26% and 32%, respectively (Figure 5). The large positive trends are distributed over south of TRB and KLM (Figure 6C). For Noah 2.7 and Noah 3.3, the spatial patterns are similar as the annual soil mositure (Figures 6D,E). the areas with the significant negative trends of Noah 2.7 are 51% and the significant positive areas of Noah 3.3 are 63% (Figure 5).
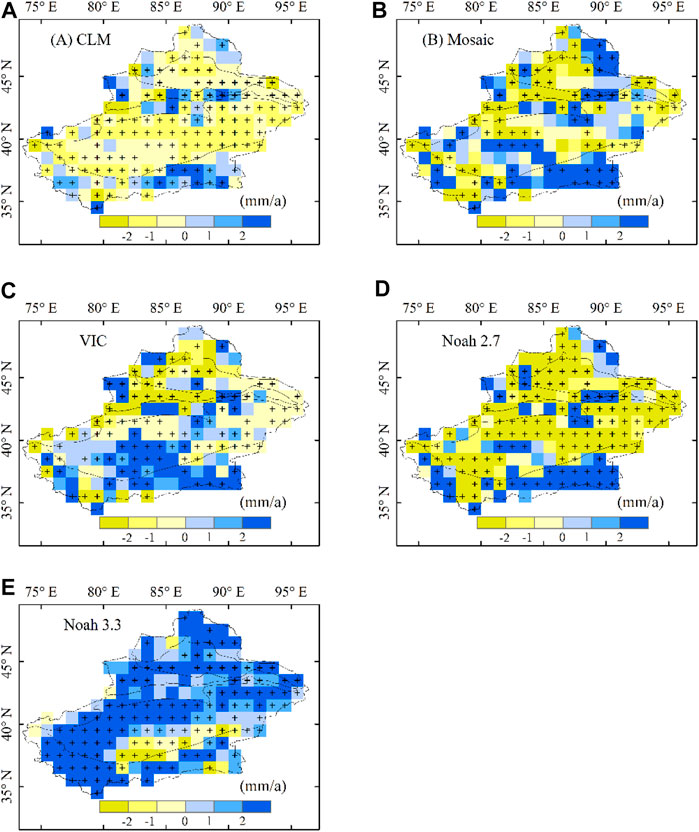
FIGURE 6. Same as Figure 4, but for MAM soil moisture.
For JJA soil moisture, each of the five models have the similar distributions as annual and MAM (Figure 7). The significant positive areas of CLM, Mosaic, VIC, Noah 2.7 and Noah 3.3 are 14, 25, 31, 23, and 62%, respectively (Figure 5A). For the significant positive trends, CLM still has the largest areas (62%) among the five models, and followed by Noah 2.7 and VIC (Figure 5B).
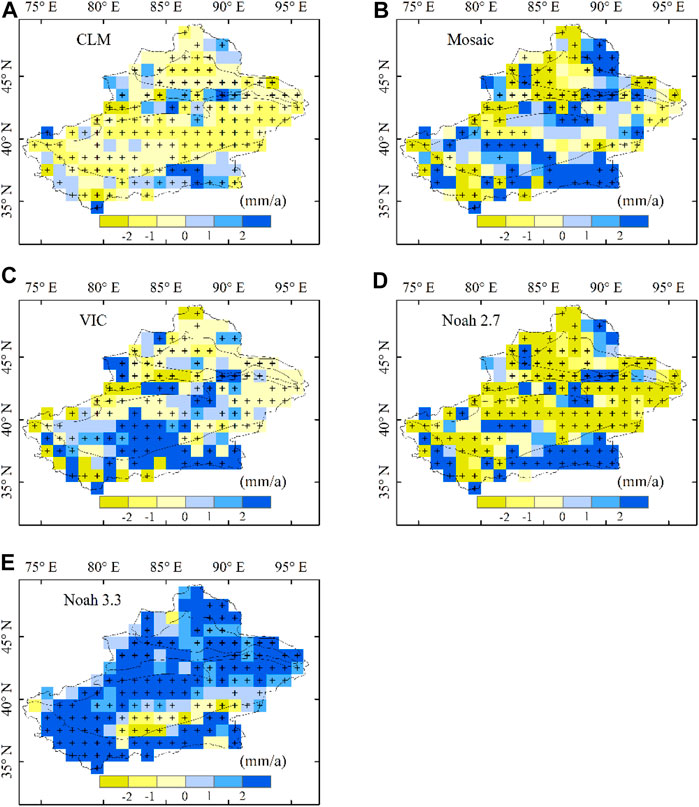
FIGURE 7. Same as Figure 4, but for JJA soil moisture.
Spatial Distributions of Linear Trends of SON and DJF Soil Moisture
For SON, CLM has the large significant negative trends over 61% areas, and 14% areas have the significant positive trends distributed over eastern KLM (Figures 5, 8A). For Mosaic, large parts of areas have the positive trends of annual with 26% areas significant at 95% confidence level, and these areas are distributed over part of ATM, most of TRB and KLM (Figures 5, 8B). The significant negative trends of soil moisture are fragmentally distributed over Xinjiang with the percentage of 29%. For VIC model, the significant negative trends account for 35% areas over Xinjiang, and are mainly distributed over ATM, JGB and part of TRB (Figures 5, 8C). The areas with significant positive trends of soil moisture account for 30% which are also distributed over most of TRB and KLM. For the model of Noah 2.7, most of the negative trends have the values smaller than −2 mm/a, and the areas with the significant negative trends account for 49% (Figures 5B, 8D). Almost all the positive trends have the values larger than 2 mm/a with the 21% significant areas. In terms of Noah 3.3, except the negative trends over the small parts of TRB, the other regions have the significant positive trends accounting for 62% areas over Xinjiang (Figure 8E).
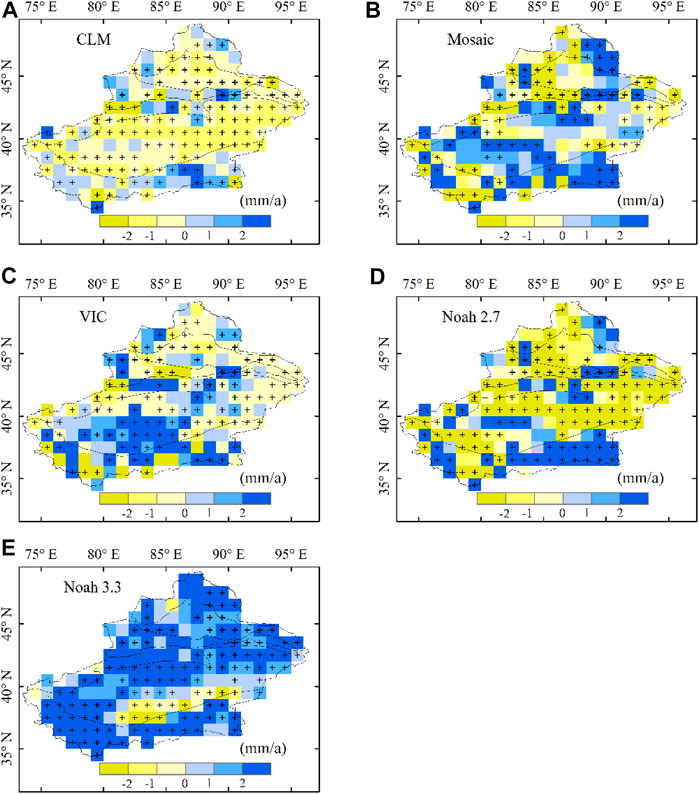
FIGURE 8. Same as Figure 4, but for SON soil moisture.
Figure 9 displays the spatial distributions of DJF soil moisture linear trends based on the five models. The distributions of the five models are similar as the annual soil moisture and the other three seasons. For CLM, the significant increase trends and significant decrease trends account for 13% and 58% areas, respectively (Figure 5). Mosaic and VIC also have the same spatial patterns of the DJF soil moisture linear trends, and the significant positive trends account for 25 and 26% areas, respectively (Figures 5A, 9B,C). For Noah 2.7 and Noah 3.3, the percentages of the positive areas are 21% and 62% (Figures 5, 9).

FIGURE 9. Same as Figure 4, but for DJF soil moisture.
Discussion
Due to the lake of the in-situ observations, the accuracy of soil moisture from the five GLDAS models is not evaluated in this study. We only explored the temporal and spatial variations of the soil moisture over Xinjiang using multiple GLDAS datasets. In recent study (Supplementary Figure S3 in Hu et al., 2019b), it was proved that Noah, VIC, Mosaic had the positive linear trends of soil moisture in Xinjiang except the CLM model which are similar with the result of this study. Moreover, Gu et al. (2019a) concluded that GLDAS Noah soil moisture is in agreement with the observation in China. Therefore, the positive linear trend results from Noah 3.3 and VIC are more credible than CLM in Xinjiang.
For the spatial distrubutions of the annual soil moisture, the five different datasets have the spatial heterogeneity. In particularly, Mosaic, VIC, and Noah 3.3 have the positive linear trends over the same regions (Figures 4B,C,E), except the most negative trends of CLM (Figure 4A), which are agreement with the Supplementary Figure S3 in Hu et al. (2019b). These spatial differences of the annual soil moisture trends are mainly caused by the spatial distributions of the precipitation linear trends (Hu et al., 2019b). The accuracy and difference between the different GLDAS models are mainly caused by their different input data and different model sturctures which are comprehensively discussed in the Supplementary Text S2 of Hu et al. (2019b). For the long-term period of 1950–2015, the positive linear trends of the soil moisture are observed over nearly the whole Xinjiang which is similar with the spatial patterns of the positive precipitation in Figures 6B,D in Hu et al. (2019a). Other climate factors, such as temperature and evapotranspiration also impact on the soil moisture variations. We will discuss it in our future study.
The soil moisture also can moinitor the drought variations (Wang et al., 2011; Li et al., 2017; Hu et al., 2019a). The 1997–2003 drought was also pervasive in terms of both severity and spatial extent. It was also found that soil moisture in north central and northeastern China had significant downward trends, whereas most of Xinjiang (Wang et al., 2011). For the spatial distributions, most of the mountainous areas are wet regions and the plain areas are drought region based on the MODIS soil moisture information in Xinjiang (Li et al., 2017). For Central Asia, the spatial distributions of the soil moisture linear trends are same as the distributions of the PDSI linear trends in 1950–2015 (Hu et al., 2019a). The climate transformation (from a warm-dry to a warm-wet) in Bayanbuluk grassland of Xinjiang appears in the 1980s (Hu et al., 2016b) which agreed with the warm-dry to warm-wet shift over the northwest of China (Shi et al., 2007). While a recent work (Yao et al., 2021) proposed that a wet-to-dry shift over Xinjiang was detected in 1997 based on the temperature and precipitation. Therefore, the warming and wetting signal in soil moisture changes should be explored in different time period by different climate factors.
Conclusion
In this study, the distrubutions and dynamics of the soil moisture over Xinjiang have been explored using four GLDAS 1 models: CLM, Mosaic, VIC and Noah 2.7 and one GLDAS 2.1 model: Noah 3.3 during the period of 2000–2017. The annual soil moisture and seasonal soil moisture (i.e. MAM, JJA, SON, and DJF) are analyzed from the linear trend perspective. The conclusions are obtained as follows:
1) Noah 3.3 and VIC have the significant positive trends of annual soil moisture with the values of 2.64 mm/a and 0.98 mm/a. The trend of CLM is significant negative. The other two models Mosaic and Noah 2.7 have the weak positive trends.
2) For the seasonal soil moisture changes, Noah 3.3 and VIC also have the significant positive trends which indicates that the seasonal soil moisture is increased over Xinjiang during the period of 2000–2017. The significant negative trends are observed based on the CLM dataset.
3) Annual and seasonal soil moisture have the similar spatial distributions of the linear trends for each of the five models. CLM displays the negative trends over large part of Xinjiang. Mosaic and VIC have the similar spatial characteristics of the linear trends. Noah 3.3 has the significant positive trends over almost Xinjiang which is different with Noah 2.7. All the five models have the positive trends over KLM.
More in situ measurements, satellite remote-sensing missions, and reanalysis datasets will be essential for the continued assessment of the variations of soil moisture. Relationships between climate factors (e.g. temperature, precipitation and potential evapotranspiration) and soil moisture can help us to have a better understanding of the complex hydrological process in the arid regions. The impacts of soil moisture on the ecological system, such as vegetation and argriculture will provide important information for reaching a balance between the SDG (sustainable development goal) water resource and environment and human society over Xinjiang.
Data Availability Statement
The original contributions presented in the study are included in the article/Supplementary Material, further inquiries can be directed to the corresponding author.
Author Contributions
Study design: ZH and XC Writing: ZH Review and editing: ZH, XC, YL, QZ, and GY.
Funding
This study was supported by the Strategic Priority Research Program of Chinese Academy of Sciences, Pan-Third Pole Environment Study for a Green Silk Road (Pan-TPEXDA20060303), the Western Scholars of the Chinese Academy of Sciences (2020-XBQNXZ-010), General Research Fund (HKBU 12301820), and the National Natural Science Foundation of China (Grant Nos. 41971386). CAS International partnership Project (902020E01010) and Regional Collaborative Innovation Project of Xinjiang Uygur Autonomous Regions (2020E01010).
Conflict of Interest
The authors declare that the research was conducted in the absence of any commercial or financial relationships that could be construed as a potential conflict of interest.
Acknowledgments
A special acknowledgment should be expressed to K.C.Wong Education Foundation and China-Pakistan Joint Research Center on Earth Sciences that supported the implementation of this study. Soil moisture data from the five Global Land Data Assimilation System (GLDAS) models is from the National Eronautics and Space Administration (NASA) (https://disc.sci.gsfc.nasa.gov/datasets?keywords=GLDAS).
References
Adler, R. F., Huffman, G. J., Chang, A., Ferraro, R., Xie, P.-P., Janowiak, J., et al. (2003). The Version-2 Global Precipitation Climatology Project (GPCP) Monthly Precipitation Analysis (1979-Present). J. Hydrometeor. 4, 1147–1167. doi:10.1175/1525-7541(2003)004<1147:tvgpcp>2.0.co;2
Amani, M., Salehi, B., Mahdavi, S., Masjedi, A., and Dehnavi, S. (2017). Temperature-Vegetation-soil Moisture Dryness Index (TVMDI). Remote Sensing Environ. 197, 1–14. doi:10.1016/j.rse.2017.05.026
Beck, H. E., Pan, M., Miralles, D. G., Reichle, R. H., Dorigo, W. A., Hahn, S., et al. (2020). Evaluation of 18 Satellite- and Model-Based Soil Moisture Products Using In Situ Measurements from 826 Sensors. Hydrol. Earth Syst. Sci. 25, 17–40. doi:10.5194/hess-2020-184
Berg, A. A., Famiglietti, J. S., Walker, J. P., and Houser, P. (2003). Impact of Bias Correction to Reanalysis Products on Simulations of North American Soil Moisture and Hydrological Fluxes. J. Geophys. Res. 108 (D16), 4490. doi:10.1029/2002jd003334
Berg, A., Sheffield, J., and Milly, P. C. D. (2017). Divergent Surface and Total Soil Moisture Projections under Global Warming. Geophys. Res. Lett. 44, 236–244. doi:10.1002/2016gl071921
Bi, H., Ma, J., Zheng, W., and Zeng, J. (2016). Comparison of Soil Moisture in GLDAS Model Simulations and In Situ Observations over the Tibetan Plateau. J. Geophys. Res. Atmos. 121, 2658–2678. doi:10.1002/2015jd024131
Chen, F., and Dudhia, J. (2001). Coupling an Advanced Land Surface-Hydrology Model with the Penn State-NCAR MM5 Modeling System. Part I: Model Implementation and Sensitivity. Mon. Wea. Rev. 129, 569–585. doi:10.1175/1520-0493(2001)129<0569:caalsh>2.0.co;2
Chen, F., Janjić, Z., and Mitchell, K. (1997). Impact of Atmospheric Surface-Layer Parameterizations in the New Land-Surface Scheme of the NCEP Mesoscale Eta Model. Boundary-Layer Meteorology 85, 391–421. doi:10.1023/a:1000531001463
Chen, F., Mitchell, K., Schaake, J., Xue, Y., Pan, H.-L., Koren, V., et al. (1996). Modeling of Land Surface Evaporation by Four Schemes and Comparison with FIFE Observations. J. Geophys. Res. 101 (D3), 7251–7268. doi:10.1029/95jd02165
Chen, X., Li, B., Li, Q., Li, J., and Abdulla, S. (2012). Spatio-temporal Pattern and Changes of Evapotranspiration in Arid Central Asia and Xinjiang of China. J. Arid Land 4, 105–113. doi:10.3724/sp.j.1227.2012.00105
Chen, X., Su, Y., Liao, J., Shang, J., Dong, T., Wang, C., et al. (2016). Detecting Significant Decreasing Trends of Land Surface Soil Moisture in Eastern China during the Past Three Decades (1979-2010). J. Geophys. Res. Atmos. 121, 5177–5192. doi:10.1002/2015jd024676
Chen, X., Wang, S., Hu, Z., Zhou, Q., and Hu, Q. (2018). Spatiotemporal Characteristics of Seasonal Precipitation and Their Relationships with ENSO in Central Asia during 1901-2013. J. Geogr. Sci. 28, 1341–1368. doi:10.1007/s11442-018-1529-2
Chen, Y., and Yuan, H. (2020). Evaluation of Nine Sub-daily Soil Moisture Model Products over China Using High-Resolution In Situ Observations. J. Hydrol. 588, 125054. doi:10.1016/j.jhydrol.2020.125054
Cheng, S., Guan, X., Huang, J., Ji, F., and Guo, R. (2015). Long‐term Trend and Variability of Soil Moisture over East Asia. J. Geophys. Res. Atmos. 120, 8658–8670. doi:10.1002/2015jd023206
Cherkauer, K., and Lettenmaier, D. (2003). Simulation of spatial variability in snow and frozen soil. J. Geophy. Res.‐Atmos. 108, 8858. doi:10.1029/2003JD003575
Dai, A., Trenberth, K. E., and Qian, T. (2004). A Global Dataset of Palmer Drought Severity Index for 1870-2002: Relationship with Soil Moisture and Effects of Surface Warming. J. Hydrometeorol. 5, 1117–1130. doi:10.1175/jhm-386.1
Dari, J., Morbidelli, R., Saltalippi, C., Massari, C., and Brocca, L. (2019). Spatial-temporal Variability of Soil Moisture: Addressing the Monitoring at the Catchment Scale. J. Hydrol. 570, 436–444. doi:10.1016/j.jhydrol.2019.01.014
Derber, J. C., Parrish, D. F., and Lord, S. J. (1991). The New Global Operational Analysis System at the National Meteorological Center. Wea. Forecast. 6, 538–547. doi:10.1175/1520-0434(1991)006<0538:tngoas>2.0.co;2
Ek, M. B., Mitchell, K. E., Lin, Y., Rogers, E., Grunmann, P., Koren, V., et al. (2003). Implementation of Noah Land Surface Model Advances in the National Centers for Environmental Prediction Operational Mesoscale Eta Model. J. Geophys. Res. 108 (D22), 8851. doi:10.1029/2002jd003296
Fan, Y., and Dool, H. (2004). Climate Prediction Center Global Monthly Soil Moisture Data Set at 0.5° Resolution for 1948 to Present. J. Geophys. Res. 109, D10102. doi:10.1029/2003jd004345
Feng, S., Trnka, M., Hayes, M., and Zhang, Y. (2017). Why Do Different Drought Indices Show Distinct Future Drought Risk Outcomes in the U.S. Great Plains?. J. Clim. 30, 265–278. doi:10.1175/jcli-d-15-0590.1
Fischer, E. M., Seneviratne, S. I., Vidale, P. L., Lüthi, D., and Schär, C. (2007). Soil Moisture-Atmosphere Interactions during the 2003 European Summer Heat Wave. J. Clim. 20, 5081–5099. doi:10.1175/jcli4288.1
Ford, T. W., Rapp, A. D., Quiring, S. M., and Blake, J. (2015). Soil Moisture-Precipitation Coupling: Observations from the Oklahoma Mesonet and Underlying Physical Mechanisms. Hydrol. Earth Syst. Sci. 19, 3617–3631. doi:10.5194/hess-19-3617-2015
Gerken, T., Babel, W., Herzog, M., Fuchs, K., Sun, F., Ma, Y., et al. (2015). High-resolution Modelling of Interactions between Soil Moisture and Convective Development in a Mountain Enclosed Tibetan Basin. Hydrol. Earth Syst. Sci. 19, 4023–4040. doi:10.5194/hess-19-4023-2015
Gu, X., Li, J., Chen, Y. D., Kong, D., and Liu, J. (2019a). Consistency and Discrepancy of Global Surface Soil Moisture Changes from Multiple Model-Based Data Sets against Satellite Observations. J. Geophys. Res. Atmos. 124, 1474–1495. doi:10.1029/2018jd029304
Gu, X., Zhang, Q., Li, J., Singh, V. P., Liu, J., Sun, P., et al. (2019b). Attribution of Global Soil Moisture Drying to Human Activities: A Quantitative Viewpoint. Geophys. Res. Lett. 46, 2573–2582. doi:10.1029/2018gl080768
He, B., Wang, H., Guo, L., and Liu, J. (2017). Global analysis of ecosystem evapotranspiration response to precipitation deficits. J.f Geophy. Res.-Atmos. 122, 13308–13318. doi:10.1002/2017JD027817
Hoffmann, D., Gallant, A., and Arblaster, J. (2020). Uncertainties in Drought from Index and Data Selection. J. Geophys. Res. Atmospheres 128, e2019JD031946. doi:10.1029/2019JD031946
Holgate, C. M., de Jeu, R. A. M., van Dijk, A. I. J. M., Liu, Y. Y., Renzullo, L. J., Vinod, K., et al. (2016). Comparison of Remotely Sensed and Modelled Soil Moisture Data Sets across Australia. Remote Sensing Environ. 186, 479–500. doi:10.1016/j.rse.2016.09.015
Hu, Z., Chen, X., Chen, D., Li, J., Wang, S., Zhou, Q., et al. (2019a). “Dry Gets Drier, Wet Gets Wetter”: A Case Study over the Arid Regions of Central Asia. Int. J. Climatol 39, 1072–1091. doi:10.1002/joc.5863
Hu, Z., Hu, Q., Zhang, C., Chen, X., and Li, Q. (2016a). Evaluation of Reanalysis, Spatially Interpolated and Satellite Remotely Sensed Precipitation Data Sets in Central Asia. J. Geophys. Res. Atmos. 121, 5648–5663. doi:10.1002/2016jd024781
Hu, Z., Li, Q., Chen, X., Teng, Z., Chen, C., Yin, G., et al. (2016b). Climate Changes in Temperature and Precipitation Extremes in an Alpine Grassland of Central Asia. Theor. Appl. Climatol. 126, 519–531. doi:10.1007/s00704-015-1568-x
Hu, Z., Zhang, C., Hu, Q., and Tian, H. (2014). Temperature Changes in Central Asia from 1979 to 2011 Based on Multiple Datasets. J. Clim. 27, 1143–1167. doi:10.1175/jcli-d-13-00064.1
Hu, Z., Zhang, Z., Sang, Y.-F., Qian, J., Feng, W., Chen, X., et al. (2021). Temporal and Spatial Variations in the Terrestrial Water Storage across Central Asia Based on Multiple Satellite Datasets and Global Hydrological Models. J. Hydrol. 596, 126013. doi:10.1016/j.jhydrol.2021.126013
Hu, Z., Zhou, Q., Chen, X., Chen, D., Li, J., Guo, M., et al. (2019b). Groundwater Depletion Estimated from GRACE: A Challenge of Sustainable Development in an Arid Region of Central Asia. Remote Sensing. 11, 1908. doi:10.3390/rs11161908
Hu, Z., Zhou, Q., Chen, X., Li, J., Li, Q., Chen, D., et al. (2018). Evaluation of Three Global Gridded Precipitation Data Sets in Central Asia Based on Rain Gauge Observations. Int. J. Climatol. 38, 3475–3493. doi:10.1002/joc.5510
Hu, Z., Zhou, Q., Chen, X., Qian, C., Wang, S., and Li, J. (2017). Variations and Changes of Annual Precipitation in Central Asia over the Last Century. Int. J. Climatol. 37, 157–170. doi:10.1002/joc.4988
Jalilvand, E., Tajrishy, M., Ghazi Zadeh Hashemi, S. A., and Brocca, L. (2019). Quantification of Irrigation Water Using Remote Sensing of Soil Moisture in a Semi-arid Region. Remote Sensing Environ. 231, 111226. doi:10.1016/j.rse.2019.111226
Kong, X., Guan, X., Cao, C., Zhang, T., Shen, L., Gan, Z., et al. (2019). Decadal Change in Soil Moisture over East Asia in Response to a Decade‐long Warming Hiatus. J. Geophys. Res. Atmospheres 124, 8619–8630. doi:10.1029/2019jd030294
Koren, V., Schaake, J., Mitchell, K., Duan, Q.-Y., Chen, F., and Baker, J. M. (1999). A Parameterization of Snowpack and Frozen Ground Intended for NCEP Weather and Climate Models. J. Geophys. Res. 104, 19569–19585. doi:10.1029/1999jd900232
Koster, R. D., and Suarez, M. (1996). Energy and Water Balance Calculations in the Mosaic LSM. Natl. Aeronautics Space Adm. Tech. Memorandum 9, 76. doi:10.1175/1520-0442(1996)009<2551:tiolsm>2.0.co;2
Li, H., Yang, J., Chen, Y., and Hao, X. (2017). Retrieval of Soil Moisture Information in Xinjiang Using MODIS (In Chinese). Acta Prataculturae Sinica 26, 16–27. doi:10.111686/cyxb2016331
Liang, X., Lettenmaier, D. P., Wood, E. F., and Burges, S. (1994). A Simple Hydrologically Based Model of Land Surface Water and Energy Fluxes for GSMs. J. Geophys. Res. 99 (14), 14415–14428. doi:10.1029/94jd00483
Liang, X., Lettenmaier, D. P., and Wood, E. (1996). One-dimensional Statistical Dynamic Representation of Subgrid Spatial Variability of Precipitation in the Two-Layer Variable Infiltration Capacity Model. J. Geophys. Res. 101 (D16), 403–421. doi:10.1029/96jd01448
May, W., Meier, A., Rummukainen, M., Berg, A., Chéruy, F., and Hagemann, S. (2015). Contributions of Soil Moisture Interactions to Climate Change in the Tropics in the GLACE-CMIP5 Experiment. Clim. Dyn. 45, 3275–3297. doi:10.1007/s00382-015-2538-9
Modanesi, S., Massari, C., Camici, S., Brocca, L., and Amarnath, G. (2020). Do Satellite Surface Soil Moisture Observations Better Retain Information about Crop‐Yield Variability in Drought Conditions? Water Resour. Res. 56, e2019WR025855. doi:10.1029/2019WR025855
Mukherjee, A., and Ramachandran, P. (2018). Prediction of GWL with the Help of GRACE TWS for Unevenly Spaced Time Series Data in India : Analysis of Comparative Performances of SVR, ANN and LRM. J. Hydrol. 558, 647–658. doi:10.1016/j.jhydrol.2018.02.005
Niu, Q., Liu, L., and Heng, J. (2020). A Multi-Index Evaluation of Drought Characteristics in the Yarlung Zangbo River Basin of Tibetan Plateau, Southwest China. Front. Earth Sci. 8, 213. doi:10.3389/feart.2020.00213
Orth, R., and Seneviratne, S. I. (2017). Variability of Soil Moisture and Sea Surface Temperatures Similarly Important for Warm-Season Land Climate in the Community Earth System Model. J. Clim. 30, 2141–2162. doi:10.1175/jcli-d-15-0567.1
Qin, J., Liang, S., Yang, K., Kaihotsu, I., Liu, R., and Koike, T. (2009). Simultaneous Estimation of Both Soil Moisture and Model Parameters Using Particle Filtering Method through the Assimilation of Microwave Signal. J. Geophys. Res. 114, D15103. doi:10.1029/2008jd011358
Qiu, J., Gao, Q., Wang, S., and Su, Z. (2016). Comparison of Temporal Trends from Multiple Soil Moisture Data Sets and Precipitation: The Implication of Irrigation on Regional Soil Moisture Trend. Int. J. Appl. Earth Observation Geoinformation 48, 17–27. doi:10.1016/j.jag.2015.11.012
Robinson, D. A., Jones, S. B., Lebron, I., Reinsch, S., Domínguez, M. T., Smith, A. R., et al. (2016). Experimental Evidence for Drought Induced Alternative Stable States of Soil Moisture. Scientific Rep. 6 (1), 20018. doi:10.1038/srep20018
Rodell, M., Houser, P. R., Jambor, U., Gottschalck, J., Mitchell, K., Meng, C.-J., et al. (2004). The Global Land Data Assimilation System. Bull. Amer. Meteorol. Soc. 85, 381–394. doi:10.1175/bams-85-3-381
Scanlon, B. R., Longuevergne, L., and Long, D. (2012). Ground Referencing GRACE Satellite Estimates of Groundwater Storage Changes in the California Central Valley, USA. Water Resour. Res. 48, W04520. doi:10.1029/2011wr011312
Scanlon, B., Zhang, Z., Save, H., Sun, A., Muller, S., van Beek, L., et al. (2018). “Global Models Underestimate Large Decadal Declining and Rising Water Storage Trends Relative to GRACE Satellite Data,” in Proceedings of the National Academy of the Sciences of the United States of America 115, E1080–E1089.
Sellers, P. J., Mintz, Y., Sud, Y. C., and Dalcher, A. (1986). A Simple Biosphere Model (SiB) for Use within General Circulation Models. J. Atmos. Sci. 43, 505–531. doi:10.1175/1520-0469(1986)043<0505:asbmfu>2.0.co;2
Shi, Y., Shen, Y., Kang, E., Li, D., Ding, Y., Zhang, G., et al. (2007). Recent and Future Climate Change in Northwest China. Climatic Change 80, 379–393. doi:10.1007/s10584-006-9121-7
Solander, K. C., Newman, B. D., Carioca de Araujo, A., Barnard, H. R., Berry, Z. C., Bonal, D., et al. (2020). The Pantropical Response of Soil Moisture to El Niño. Hydrol. Earth Syst. Sci. 24, 2303–2322. doi:10.5194/hess-24-2303-2020
Spennemann, P. C., Fernández-Long, M. E., Gattinoni, N. N., Cammalleri, C., and Naumann, G. (2020). Soil Moisture Evaluation over the Argentine Pampas Using Models, Satellite Estimations and In-Situ Measurements. J. Hydrol. Reg. Stud. 31, 100723. doi:10.1016/j.ejrh.2020.100723
Trenberth, K. E., Smith, L., Qian, T., Dai, A., and Fasullo, J. (2007). Estimates of the Global Water Budget and its Annual Cycle Using Observational and Model Data. J. Hydrometeorol. 8, 758–769. doi:10.1175/jhm600.1
Wang, A., Lettenmaier, D. P., and Sheffield, J. (2011). Soil Moisture Drought in China, 1950–2006. J. Clim. 24, 3257–3271. doi:10.1175/2011jcli3733.1
Western, A. W., Zhou, S.-L., Grayson, R. B., McMahon, T. A., Blöschl, G., and Wilson, D. J. (2004). Spatial Correlation of Soil Moisture in Small Catchments and its Relationship to Dominant Spatial Hydrological Processes. J. Hydrol. 286, 113–134. doi:10.1016/j.jhydrol.2003.09.014
Xie, P., and Arkin, P. A. (1996). Global Precipitation: a 17-year Monthly Analysis Based on Gauge Observations, Satellite Estimates, and Numerical Model Outputs. Bull. Am. Meteorol. Soc. 78, 2539–2558. doi:10.1175/1520-0477(1997)078<2539:GPAYMA>2.0.CO;2
Xu, L., Abbaszadeh, P., Moradkhani, H., Chen, N., and Zhang, X. (2020). Continental Drought Monitoring Using Satellite Soil Moisture, Data Assimilation and an Integrated Drought Index. Remote Sensing Environ. 250, 112028. doi:10.1016/j.rse.2020.112028
Yao, C., Zhang, Z., and Wang, X. (2004). Evaluating Soil Moisture Status in XinJiang Using the Temperature Vegetation Dryness Index (TVDI) (In Chinese). Remote sensing Technology Appl. 19, 473–478. doi:10.1016/j.csr.2003.12.006
Yao, J., Mao, W., Chen, J., and Dilinuer, T. (2021). Signal and Impact of Wet-To-Dry Shift over Xinjiang, China (In Chinese). Acta Geographica Sinica 76, 57–72. doi:10.11821/dlxb202101005
Yuan, S., and Quiring, S. M. (2017). Evaluation of Soil Moisture in CMIP5 Simulations over the Contiguous United States Using In Situ and Satellite Observations. Hydrol. Earth Syst. Sci. 21, 2203–2218. doi:10.5194/hess-21-2203-2017
Zhou, P., Ding, J., Wang, F., Guljmal, U., and Zhang, G. (2010). Retrieval Methods of Soil Water Content in Vegetation Covering Areas Based on Multi-Source Remote Sensing Data (In Chinese). J. Remote Sensing 14, 959–973.
Keywords: linear trend, soil moisture, spatial and temporal variation, GLDAS product, Xinjiang
Citation: Hu Z, Chen X, Li Y, Zhou Q and Yin G (2021) Temporal and Spatial Variations of Soil Moisture Over Xinjiang Based on Multiple GLDAS Datasets. Front. Earth Sci. 9:654848. doi: 10.3389/feart.2021.654848
Received: 17 January 2021; Accepted: 05 May 2021;
Published: 20 May 2021.
Edited by:
Qingxiang Li, Sun Yat-Sen University, ChinaReviewed by:
Xihui Gu, China University of Geosciences, ChinaMinyan Wang, China Meteorological Administration, China
Copyright © 2021 Hu, Chen, Li, Zhou and Yin. This is an open-access article distributed under the terms of the Creative Commons Attribution License (CC BY). The use, distribution or reproduction in other forums is permitted, provided the original author(s) and the copyright owner(s) are credited and that the original publication in this journal is cited, in accordance with accepted academic practice. No use, distribution or reproduction is permitted which does not comply with these terms.
*Correspondence: Xi Chen, chenxi@ms.xjb.ac.cn