Rupture Directivity in 3D Inferred From Acoustic Emissions Events in a Mine-Scale Hydraulic Fracturing Experiment
 José Ángel López-Comino
 Simone Cesca
 Peter Niemz3,4
 - 1Instituto Andaluz de Geofísica, Universidad de Granada, Granada, Spain
- 2Departamento de Física Teórica y del Cosmos, Universidad de Granada, Granada, Spain
- 3Institute of Geosciences, University of Potsdam, Potsdam, Germany
- 4GFZ German Research Centre for Geosciences, Potsdam, Germany
Rupture directivity, implying a predominant earthquake rupture propagation direction, is typically inferred upon the identification of 2D azimuthal patterns of seismic observations for weak to large earthquakes using surface-monitoring networks. However, the recent increase of 3D monitoring networks deployed in the shallow subsurface and underground laboratories toward the monitoring of microseismicity allows to extend the directivity analysis to 3D modeling, beyond the usual range of magnitudes. The high-quality full waveforms recorded for the largest, decimeter-scale acoustic emission (AE) events during a meter-scale hydraulic fracturing experiment in granites at ∼410 m depth allow us to resolve the apparent durations observed at each AE sensor to analyze 3D-directivity effects. Unilateral and (asymmetric) bilateral ruptures are then characterized by the introduction of a parameter κ, representing the angle between the directivity vector and the station vector. While the cloud of AE activity indicates the planes of the hydrofractures, the resolved directivity vectors show off-plane orientations, indicating that rupture planes of microfractures on a scale of centimeters have different geometries. Our results reveal a general alignment of the rupture directivity with the orientation of the minimum horizontal stress, implying that not only the slip direction but also the fracture growth produced by the fluid injections is controlled by the local stress conditions.
Introduction
Rupture directivity defines preferred earthquake rupture propagation directions through the identification of azimuthal patterns in the apparent seismic source features (e.g., apparent durations, scaled amplitudes), as recorded at a network of stations (Haskell, 1964). Earthquake ruptures can be classified in pure unilateral or pure bilateral (symmetric) ruptures, as well as asymmetric bilateral ruptures, describing an intermediate case between the two previous models. It is well know that a predominance of unilateral ruptures is observed for large earthquakes (McGuire et al., 2002); however, recent studies demonstrated that directivity might be also a common feature of small to moderate events (e.g., Kane et al., 2013; Kurzon et al., 2014; Calderoni et al., 2015; Meng et al., 2020; Ross et al., 2020). So far, rupture directivity has also been identified for a few cases of weak fluid-injection induced earthquakes (Folesky et al., 2016; López-Comino and Cesca, 2018; Király Proag et al., 2019; Wu et al., 2019) and fluid-induced microcracks or acoustic emission (AE) events in mine-scale hydraulic fracturing (HF) experiments (Dahm, 2001), suggesting that such properties could persist at smaller magnitudes. In fact, a recent work has been able to identify directivity effects even at laboratory scale (Kolár et al., 2020).
The most commonly used approach to estimate rupture directivity for small earthquakes is based on empirical Green's functions (EGFs) techniques, using the waveform recordings of fore- or aftershocks with 1–2 magnitude units less than the target event or mainshock (Hartzell, 1978). EGFs are used to account for the poorly know propagation and site effects, which similarly affect EGF and mainshock waveforms, by applying a time-domain or frequency-domain deconvolution process (e.g., Ammon et al., 2006; López-Comino et al., 2012; Abercrombie et al., 2017; Stich et al., 2020). As a result, apparent source time functions (ASTFs) are obtained for each receiver, showing different apparent durations, depending on their relative location to the source and the direction of rupture propagation. Directivity effects and source complexities are typically revealed by the azimuthal patterns of ASTFs in a 2D approach, simplifying the intrinsic 3D rupture propagation problem. Directivity effects in 3D can be also studied applying different approaches, for instance, through stretching techniques (e.g., Warren and Shearer, 2006; Abercrombie et al., 2017; Huang et al., 2017) or using the second order seismic moment (e.g., McGuire, 2004; McGuire, 2017; Fan and McGuire, 2018). The importance of directivity along the dip or vertical direction has been generally evidenced for the analysis of deep-focus earthquakes, by considering the differences among rupture propagation and take off vectors (Warren and Shearer, 2006; Park and Ishii, 2015), as well as for subduction earthquakes (Tilmann et al., 2016; An et al., 2017), using finite source modeling and back projection techniques. For these large scale applications, the directivity analysis is done using surface monitoring networks, i.e. well above the earthquake source, and thus with a poor 3D coverage of the foci. Nevertheless, 3D seismic monitoring configurations deployed recently in deep underground laboratories bear us new opportunities to extend the directivity analysis to microseismicity with moment magnitude (Mw) well below 0 in a 3D environment.
In the last years, decameter-scale in-situ hydraulic stimulation experiments have been carried out in deep underground laboratories with the purpose to improve our understanding about the nucleation and rupture growth processes linked with fluid-injection induced seismicity (Zang et al., 2017; Gischig et al., 2018; Kneafsey et al., 2018; Dresen et al., 2019; Schoenball et al., 2020; Villiger et al., 2020; Villiger et al., 2021). These experiments have been promoted in recent years by the development of enhanced geothermal systems and unconventional resources driven by HF operations (Schultz et al., 2020). Mine-scale in-situ experiments serve as a bridge between laboratory experiments and deep reservoir stimulations, offering improved control and more realistic boundary conditions. AE piezoelectric sensors are deployed at different borehole locations around the fluid-injection intervals providing complex 3D seismic monitoring networks. Microfractures generated during HF stimulations are then characterized by AE signals involving, for instance, Mw between −4.2 and −3.5 and rupture sizes of decimeter scale (Kwiatek et al., 2018).
In this framework, on June 2015 a mine-scale underground HF experiment at 410 m depth was carried out in the Äspö Hard Rock Laboratory (HRL), Sweden (Zang et al., 2017). Six HF stimulations with three different injection schemes were tested to assess the fatigue HF (FHF) concept in order to reduce the number and magnitude of fluid-injection induced seismicity. Each HF stimulation composed by the initial fracture phase (F) and up to five refracturing phases (RF) was performed at selected injection intervals free of pre-existing fractures along a subhorizontal 28 m-long borehole (Figure 1). This injection borehole was drilled in the orientation of the minimum horizontal stress magnitude (Sh) with a strike of ∼N210 W. The 3D AE monitoring network consists of 11 AE uniaxial side view sensors, recording in the frequency range of 1–100 kHz, oriented toward the stimulated volume of 30 × 30 × 30 m and deployed in different boreholes and along existing experimental tunnels of Äspö HRL. These AE sensors are entirely based on the piezoelectric effect, which means that the seismic wave is guided directly into the sensor where it generates an electric output signal proportional to stress changes introduced. The data acquisition system was improved to operate with 1 MHz sampling rate, obtaining high-quality full waveforms. The AE activity generated during each HF stage has been well-studied and characterized using both triggered mode (Zang et al., 2017; Kwiatek et al., 2018) and continuous recordings (López-Comino et al., 2017; Niemz et al., 2020). Figure 1 shows the largest AE events with magnitudes (relative magnitude, MAE) exceeding 2.8, according to the last updated catalog, which contains 4,302 events with MAE between ∼2.0 and ∼4.0 (Niemz et al., 2020). This enhanced catalogue incorporating weaker events allowed for the identification of planar seismogenic regions associated to each HF stimulation (Niemz et al., 2020). On the other hand, the Mw range has been estimated between −4.2 and −3.5 for the 196 AE events recorded in the triggered mode; furthermore, 21 moment tensor inversions were performed, identifying heterogeneous focal mechanisms and suggesting a complex microfracture network generated for the hydraulic stimulations (Kwiatek et al., 2018). Interestingly, for the large majority of the retrieved focal mechanisms, none of the potential fault planes matches the orientation of the larger scale planar seismogenic regions.
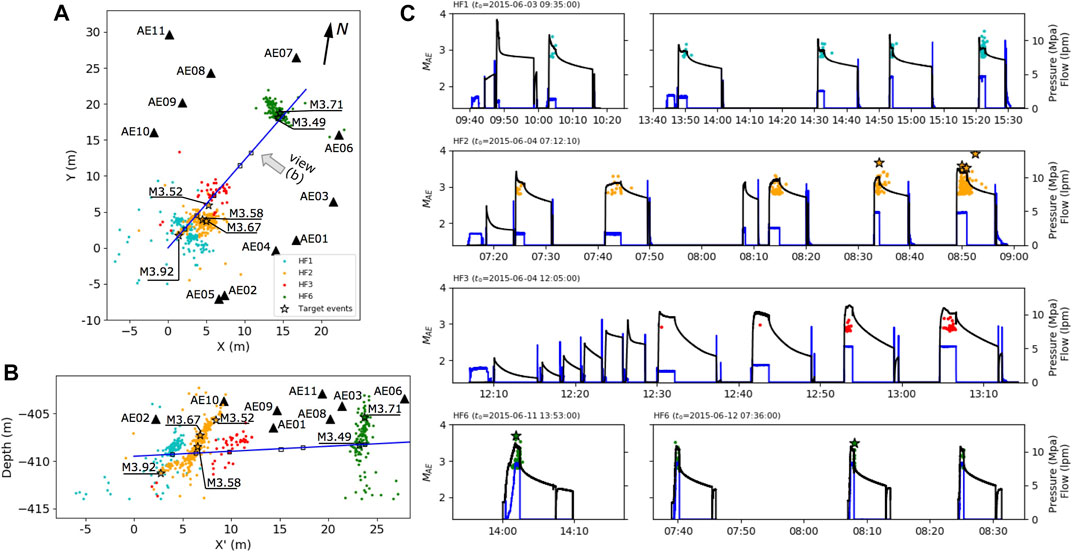
FIGURE 1. (A) and (B) AE hypocenters with MAE >2.8 located in the hydraulic fracturing experiments in the Äspö HRL from the last updated catalogue of Niemz et al. (2020). Stars denote the largest AE events analyzed in this study, indicating the corresponding MAE. The AE sensors (triangles) and injection intervals (squares) along the 28-m-long injection borehole (blue line) are also shown. The direction of view in (B) is indicated in (A). (C) Temporal evolution of the AE events of each HF experiment shown in (A) is plotted together with the injection pressures (black lines) and flow rates (blue lines). Initial time (t0) is indicated for each plot. HF1, HF2 and HF6 were performed with a conventional continuous injection scheme, while a cyclic progressive injection scheme is followed in HF3 showing less AE activity and lower MAE.
Typically, the source finiteness of small magnitude earthquakes, as well as AE events, is neglected under a point source approximation. Seismic source properties are then reduced to earthquake location, magnitude, and, in few cases, to a moment tensor, which analysis has been based on P wave first-motion polarities (Kwiatek et al., 2016). Relevant rupture features, such as rupture size, duration and directivity are not discussed and still represent a challenge at the scale of microseismicity and AEs. Here, we characterize the source finiteness for the largest AE events recorded during the HF experiments in the Äspö HRL, through a novel 3D-directivity analysis applied to 3D seismic monitoring networks. Unilateral ruptures, as well as, symmetric and asymmetric bilateral ruptures are tested to find the best fitting model for the 3D pattern of ASTFs. Such advanced characterization of the rupture processes can be used to discriminate the rupture and auxiliary plane and to better understand the geometry of induced fractures.
Methods
Apparent Durations in Mine-Scale Experiments
The high resolution AE seismicity recorded during the different HF stimulations in combination with the 3D geometry of the monitoring network and the high sampling of recordings at the Äspö HRL provide us a great opportunity to obtain apparent durations for AE events, which is a challenging step, considering their extremely low magnitudes and short durations. For some cases of global seismological applications, for instance in the case of deep-focus earthquakes, the initial portion of P-wave displacement is isolated from most other phases and represents well the source time function with a scalar correction for the seismic moment (Fukao, 1972; Kikuchi and lshida, 1993; Beck et al., 1995; Tibi et al., 1999). Similar conditions are found for the first arrivals of the P-waves recorded in the AE network of this small-scale experiment. The average distance from the source to the borehole sensors is only about 18 m, and the wave propagation is well described by a homogeneous full-space (Niemz et al., 2020). Therefore, the effects of local structure are minimal and secondary arrivals, for instance from reflections at the gallery walls, are expected to be either weak or not significantly overlapping with the fairly short duration of the direct P wave. In such circumstances, we can assume the duration of the first pulse observed in the P-wave as a rough estimation of the apparent duration. Although the amplitudes and polarities of these waveforms are affected by the source radiation pattern of the moment tensor and eventually by the sensor orientation and coupling (Manthei et al., 2001; Maghsoudi et al., 2013), such effects do not alter the apparent durations, which are only considered for the rupture directivity modeling.
We manually select six AE events, four from HF2 and two from HF6 (Figure 1), where the first P-wave pulses of unfiltered waveforms are well identified in at least nine out of 11 AE sensors (Figure 2, Supplementary Figure S1). Normalized square amplitudes of the first P-wave pulses are plotted to improve the visualization of the apparent duration measurements. The MAE of these selected AE events range from 3.49 to 3.92 (i.e., Mw ∼ −3.5, according to Kwiatek et al., 2018) corresponding with the largest and high-quality AE events. Note that few AE signals are discarded from our analysis, because the first P-wave pulse is not well-constrained, in presence of noisy records, low P amplitudes (e.g., for nodal stations affected by the radiation pattern near the intersection between the compressional and dilation quadrants) or anomalous long pulses, compared to the remaining stations (Figure 2). P-wave arrivals are manually picked and we calculate automatically the end of the apparent duration at the intersection of the first P-wave pulse with the baseline. Some variations in the apparent durations are observed in our target AE events ranging from 0.016 to 0.053 ms. This implies apparent corner frequencies in the range of 18–62 kHz and magnitudes as small as MW ∼ −3.5 (Kwiatek et al., 2018). On the other hand, the frequency dependent sensitivity of the AE sensors is known to affect recordings especially above 100 kHz (Ono 2018) and include low frequency noise below 3 kHz (Niemz et al., 2020), which could potentially affect our estimate of the apparent durations. To confirm the robustness of our results, we compared our apparent duration estimates, as retrieved from data filters in the frequency bands 0.5–500 kHz, 0.5–100 kHz, and 3–50 kHz (Supplementary Figure S2), and only find out negligible differences yielding the same apparent duration measurements. The lowest possible upper bound of the previous applied bandpass filter can be defined in 31 kHz because the first P-wave pulse cannot contain lower frequencies than the inverse of its period (about two times the minimum apparent duration). The resolution of finite source patterns, such as the directivity, formally requires the inclusion of higher frequencies (e.g., above 50 kHz). While apparent duration results from 2D directivity analysis are typically shown sorting based on the station azimuth, here we introduce other sorting strategy to visualize the 3D directivity effects based on the parameter κ described in the next section.
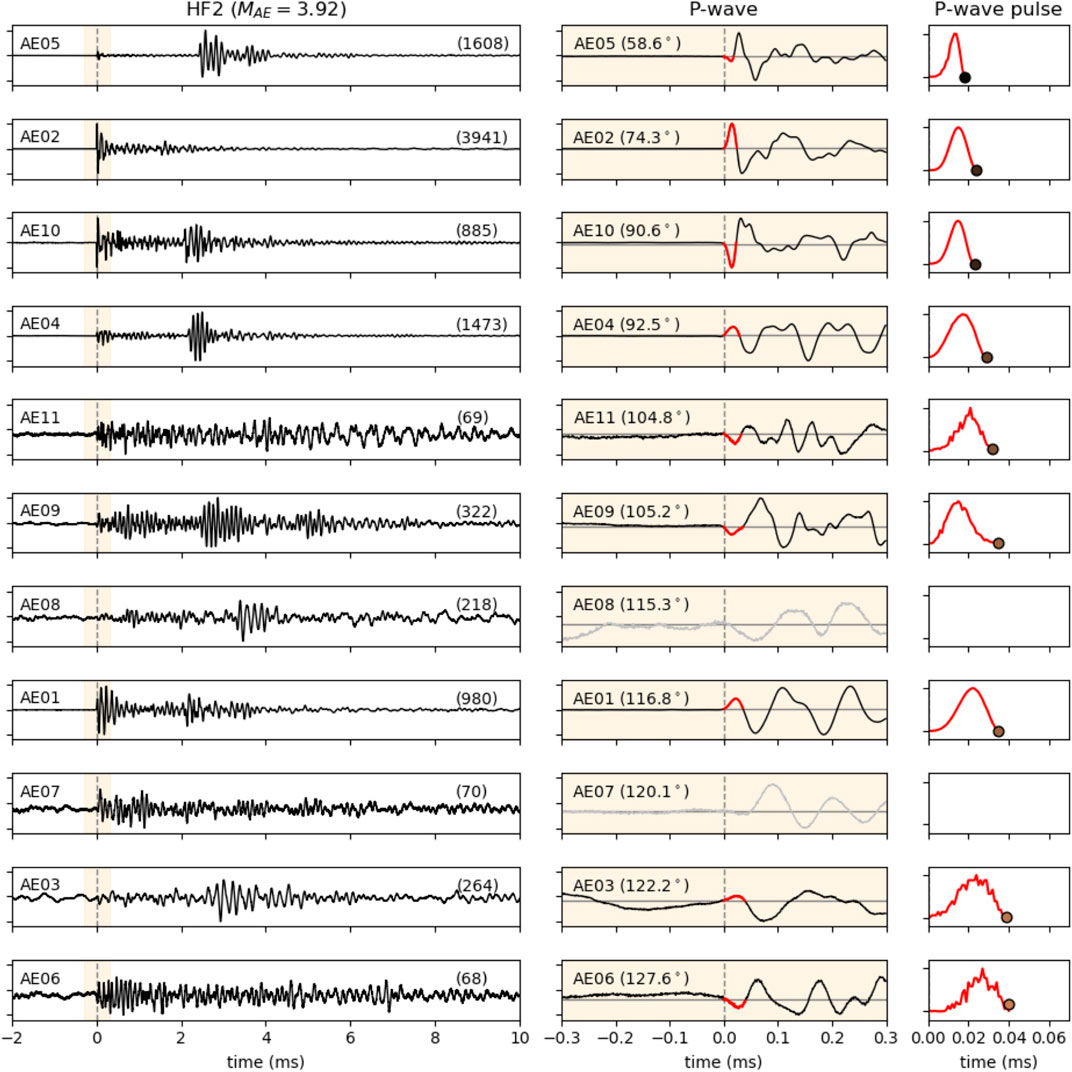
FIGURE 2. Apparent durations for the largest AE event recorded during HF2 in the Äspö HRL. We plot the unfiltered waveforms (black lines), P-wave window (orange band), the first P-wave pulses (red lines) and the apparent durations (dots according to the colorbar in Figure 3A). Manual picking and the baseline are indicated in the second column with vertical dashed gray lines and horizontal gray lines respectively. Waveforms are normalized according to the maximum amplitude (see labels in each trace of the first column) and sorted by the parameter κ (see labels of the second column). Some AE signals are discarded from the rupture directivity analysis because the first P-wave pulse is not well constrained and does not allow a clear estimate of the apparent durations (grey traces in second column for AE07 and AE08). The third column shows the normalized square amplitude of the P-wave pulse shown in the second column to improve the visualization of the apparent duration measurements.
Rupture Directivity Analysis in 3D
The source parameters associated to a line source (Haskell, 1964) are commonly inferred through the apparent duration fitting (e.g., Cesca et al., 2011; López-Comino et al., 2016). For unilateral ruptures, the apparent durations, Δt(ϕ), show the longest duration in the forward direction of the rupture propagation (α) and the shortest duration in the backward direction, which can be written as:
depending on the azimuth (ϕ) between the source and each receiver, and involving different variables: rise time (tr), rupture length (L), rupture velocity (vr), and P (or S) wave velocities (vP,S). In this manner, the rupture directivity is constrained along a horizontal plane and defined by a single angle, α.
For our 3D mine-scale case, we will consider spherical coordinates involving two angles (ϕ, θ): the azimuth ϕ, previously described in Eq. 1, and a polar angle θ, describing the deviation from the vertical axis (Supplementary Figure S3). We define the 3D rupture directivity vector,
representing the angle between the directivity vector and the station vector, ranging from 0° to 180° (Supplementary Figure S3). For κ values near 0°, indicating an alignment among station and rupture vectors, and thus observations ahead of the rupture direction, we expect to observe the shortest apparent durations. Conversely, we expect the opposite behavior, showing the largest apparent durations, for κ-values of ∼180°.
Replacing the angle ϕ-α in Eq. 1 with the new parameter κ, we can model the apparent durations Δt in 3D as a function of two angles, i.e., Δt (ϕ, θ), assuming a unilateral rupture. Consequently, the general 3D case for unilateral and (asymmetric) bilateral ruptures can be defined combining κ and the parameterization of Cesca et al. (2011), by the equation:
where the asymmetry of the rupture (χ) ranges from 0 for pure unilateral rupture to 0.5 for pure (symmetric) bilateral rupture. Theoretical radiation patterns of apparent durations for three significant cases (pure unilateral, pure bilateral and asymmetric bilateral) are shown in Supplementary Figure S4 for one specific directivity vector and considering reasonable values for the involved parameters according to the results obtained in the next section. Average apparent durations increase with decreasing rupture velocities, increasing rupture length and increasing rise time.
Theoretical curves of apparent durations vs. κ values following Eq. 3 can then be tested for all directions, applying a full grid search for ϕ in [0°, 360°] and θ in [0°, 180°]. L1-misfit for each tested direction is then obtained by comparing theoretical and observed apparent durations at each station, showing the uncertainties associated to the best solution (minimum L1-misfit) of the directivity vector. The inversion is solved through a full grid search approach including reasonable intervals and increments for the involved parameters. The χ-parameter varies between 0 (pure unilateral rupture) to 0.5 (pure bilateral rupture). Average P-wave and S-wave velocities were measured in-situ (vp = 5,800 m/s and vs = 3,200 m/s, Zang et al., 2017), thus we can consider a rupture velocity interval between 0.7 vs and 1.0 vs. The rise time is not expected to be larger than 1/3 of the true duration (e.g., Stein and Wysession, 2003), thereby we test below 1/3 of the average apparent duration. Despite our knowledge about the rupture length is limited for this magnitude range, some reasonable values of 10–30 cm can be estimated for such range of magnitudes (e.g., Eshelby, 1957; Kwiatek et al., 2018); then, a broader interval from 1 to 30 cm is tested. A jackknife test is also applied to assess the uncertainties of each parameter, which are quantified by the mean and standard deviation calculated from the different iterations (see Supplementary Table S1).
Directivity of Decimeter-Scale Acoustic Emission Events
Theoretical predictions assuming unilateral and asymmetric bilateral rupture models are considered to adjust the 3D radiation pattern defined by the apparent durations previously identified at each AE sensor (Figure 3A). Such predictions are also compared using the 2D approach yielding similar results and azimuthal directivity directions (Supplementary Figure S5). We scan all possible directions in 3D by increments of 5° for both vector angles (ϕ, θ) and the L1-misfit is calculated for each tested direction (Figure 3B, Supplementary Movies S1 and S2). The resulting rupture directivity vector is then defined by the minimum L1-misfit. Figures 3, 4 summarize the resulting inverted parameters from our 3D rupture directivity analysis (see also Supplementary Table S1 and Supplementary Movie S3).

FIGURE 3. Rupture directivity analysis in 3D for the target AE events recorded during HF2 and HF6 in the Äspö HRL. (A) For each target AE event, we show the apparent durations measurements (dots) along with the theoretical prediction (brown line) for the inverted model using a full grid search approach (labels indicate the solution of each parameter). (B) L1-misfit for each tested direction (dots) for the largest AE events recorded during HF2 (top) and HF6 (bottom). The directivity vector solution with minimum L1-misfit (red arrow) and the station vectors (gray lines) for each AE sensor are also shown. Red dots indicate the origin of the coordinate system. The radius for each tested direction is also scaled according to the L1-misfit values as in the colorbar.
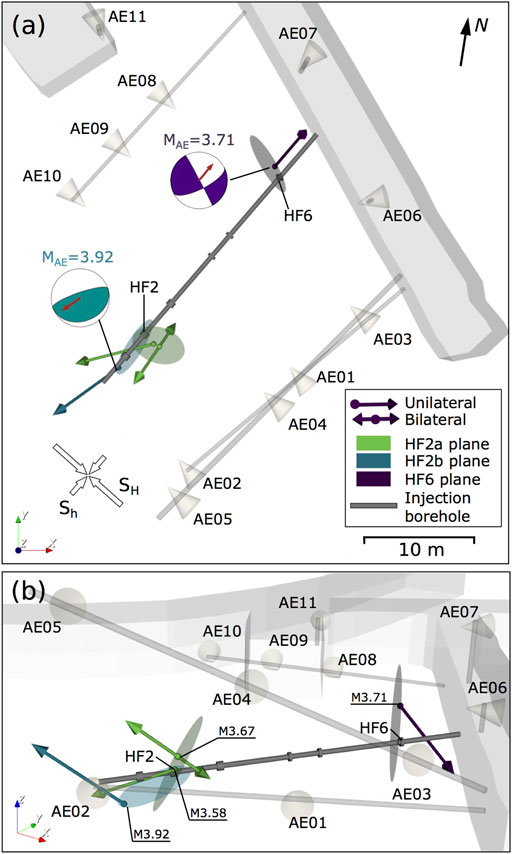
FIGURE 4. 3D views of the resulting rupture directivity vectors for the four largest target AE events in the Äspö HRL: (A) top view and (B) perspective view. Planar seismogenic regions identified by the AE activity (Niemz et al., 2020) are shown considering the hypocentral locations of our target events. The AE sensors are located in nearby boreholes and tunnel; they are oriented toward the stimulated volume along the 28-m-long injection borehole. Focal mechanisms obtained by Kwiatek et al. (2018) for the largest AE event in HF2 and HF6 are shown with their rupture directivity vectors (brown arrows) in (A). MAE is indicated for the target events in (B).
Despite our monitoring network configuration includes only AE sensors located above the injection borehole, robust results are inferred for four out of six target AE events (MAE > 3.52), showing the best adjustments for L1-misfits < 0.003 ms and small uncertainties of <10° associated to the 3D-directivity directions defined by the ϕ and θ angles. These results reveal a slightly predominance of unilateral ruptures for three out of four AE events. Similar azimuthal directivity directions are observed for the AE events belonging to the same HF stimulations, being 200°–255° for HF2 and 20°–40° for HF6 (Figures 3A, 4A). A predominant pattern along the vertical direction cannot be determined. Beside some intrinsic trade-offs among the involved parameters (Stich et al., 2020; López-Comino et al., 2021), we clearly identify high rupture velocities (3.14–3.20 km/s), very short rise times (<0.002 ms), and rupture lengths ranging 10–18 cm.
Discussion and Conclusions
Rupture directivity analysis is extended at mine-scale and can be recovered for microearthquakes recorded by 3D complex seismic monitoring configurations. The high-quality full waveforms recorded for the largest AE events during the HF2 and HF6 stimulations in the Äspö HRL has allowed us to estimate the apparent durations through the first pulses observed in the P-wave of the AE signals. We described a 3D-directivity approach where theoretical radiation patterns of apparent durations for unilateral and (asymmetric) bilateral ruptures are characterized by the introduction of a parameter κ, representing the angle between the directivity vector and the station vector. A full grid search is proposed to solve the inversion problem assessing the model performance through the L1-misfit in all plausible rupture directions and quantifying the associated uncertainties by a jackknife approach.
We recognize, for the first time, directivity effects for microfractures within granitic rock with magnitude as small as Mw ∼ −3.5 and rupture length of ∼13 cm lengths. Given the small number and narrow band of target magnitudes, no empirical relationships between magnitude and rupture length can be derived from our results (Supplementary Figure S6). Similar average apparent durations
Our results can resolve the fault plane ambiguities for the largest AE events in HF2 and HF6, when taking into account the moment tensor solutions reported in Kwiatek et al. (2018). Indeed, rupture vectors are always coplanar to one of the potential fault planes (see Figure 4A and the indicated rupture directivity vectors in the moment tensor solutions). Similar conclusions were drawn from a moment tensor study of hydrofrac-induced AE events in salt (Dahm et al., 1999). On the other hand, multiple fractures planes were inferry a 2D approximation of the ellipsoidal AE clusters revealing some strike variations and steep dipping angles (Niemz et al., 2020). Rupture directivity vectors can be discussed with respect to these main planes, considering the hypocentral locations of target AE events (Figure 4). For example, a secondary fracture zone mapped in HF2–RF4 and HF2–RF5, with a predominantly grew during the shut-in phase, is roughly aligned with the rupture vector of the largest AE event, which is controlled by the interaction with the previously fractured zone of HF1. For the remaining studied AEs, however, the rupture planes that we identify are inclined, when not perpendicular, to the larger scale (few meters) planar seismogenic regions(Figure 4B). Co-seismic rupture planes out of the plane of the hydrofracture were also found by a directivity analysis of AE in salt rock (Dahm, 2001). This confirms a clear difference among the orientation of the large scale extension of the fractured region, and the small scale orientation of single fracture planes. Indeed, single focal mechanisms already indicated a significant variability (Kwiatek et al., 2018), except for their pressure axes being consistently oriented according to a common stress field (i.e., σH oriented NE-SW to NNE-SSW).
The discussed mine-scale HF experiments in deep underground laboratories bear us also the chance to discuss rupture directivity patterns, which have been proposed for larger scale seismicity. Fluid-induced seismic processes have been observed over a broad range of spatial scales (Davies et al., 2013; Schultz et al., 2020), and very often with dense dedicated networks, which allow to resolve the rupture propagation for small to moderate earthquakes (e.g., 1.0 < Mw < 5.8). Lui and Huang (2019) calculated the directivity effects of the largest induced Oklahoma earthquakes and attributed the difference in rupture directions to expected pressurization of the fault zone, which relates to the distance away from injection zones and total injected volume. Folesky et al. (2016) analyzed the rupture directivity of the largest seismic events associated with the stimulation of geothermal reservoir in Basel (Switzerland) and found that the preferred rupture propagation depends on magnitude; events with local magnitude larger than two propagated backward into the perturbed volume while smaller events propagated away from the well. These studies suggest that the fluid injection has an effect on directional properties of the earthquake rupture processes. In this sense, our analysis evidences a predominant pattern of rupture directivity directions, as they are in general well aligned with the orientation of the minimum horizontal stress (e.g., Nolen-Hoeksema and Ruff 2001; Zang and Stephansson 2010); a preferred rupture directivity toward or away from the injection point is, however, not identified.
While based on a limited dataset, our findings suggest that the local stress condition may control the predominant direction of the rupture growth, beside the large scale distribution of AE locations and the pressure axis of the focal mechanism. This study confirms that directivity effects persist even at decimeter-scale ruptures and extends our knowledge to better understand the triggering processes of fluid-injection-induced earthquakes.
Data Availability Statement
Publicly available datasets were analyzed in this study. This data can be found here: The datasets selected for this study are available via request to the authors. Catalogue of induced AEs from Niemz et al. (2020). Moment tensor solutions were extracted from Kwiatek et al. (2018).
Author Contributions
JL-C and SC planned the research. JL-C has realized the rupture directivity analysis, supervised by SC; PN compiled the data and realized the movies of the results. JL-C prepared the initial draft and figures, with contributions and editing from all authors. AZ was the principal investigator of the 2015 mine-scale Äspö HRL underground experiments. All authors have contributed to the interpretation and discussion.
Funding
This research has been funded by the European Union’s Horizon 2020 research and innovation programme under the Marie Skłodowska-Curie grant agreement N° 754446 and UGR Research and Knowledge Transfer Found – Athenea3i; and by the Deutsche Forschungsgemeinschaft (DFG, German Research Foundation) – Projektnummer (407141557). SC and PN received funding from the EU project PostMinQuake, RFCS (899192). AZ was supported by funding received from the European Union’s Horizon 2020 research and innovation programme, Grant Agreement No. 691728 (Destress).
Conflict of Interest
The authors declare that the research was conducted in the absence of any commercial or financial relationships that could be construed as a potential conflict of interest.
The handling editor (APR) declared a past co-authorship with one of the authors (TD).
Acknowledgments
The in situ experiment at Äspö Hard Rock Laboratory (HRL) was supported by the GFZ German Research Center for Geosciences (75%), the KIT Karlsruhe Institute of Technology (15%) and the Nova Center for University Studies, Research and Development Oskarshamn (10%). An additional in-kind contribution of the Swedish Nuclear Fuel and Waste Management Co. (SKB) for using Äspö HRL as test site for geothermal research is greatly acknowledged.
Supplementary Material
The Supplementary Material for this article can be found online at: https://www.frontiersin.org/articles/10.3389/feart.2021.670757/full#supplementary-material
References
Abercrombie, R. E., Poli, P., and Bannister, S. (2017). Earthquake Directivity, Orientation, and Stress Drop within the Subducting Plate at the Hikurangi Margin, New Zealand. J. Geophys. Res. Solid Earth 122 (10), 188. doi:10.1002/2017JB014935
Ammon, C. J., Kanamori, H., Lay, T., and Velasco, A. A. (2006). The 17 July 2006 Java Tsunami Earthquake. Geophys. Res. Lett. 33. doi:10.1029/2006GL028005
An, C., Yue, H., Sun, J., Meng, L., and Báez, J. C. (2017). The 2015 Mw 8.3 Illapel, Chile, Earthquake: Direction‐Reversed Along‐Dip Rupture with Localized Water Reverberation. Bull. Seismological Soc. America 107 (5), 2416–2426. doi:10.1785/0120160393
Beck, S. L., Silver, P., Wallace, T. C., and James, D. (1995). Directivity Analysis of the Deep Bolivian Earthquake of June 9, 1994. Geophys. Res. Lett. 22, 2257–2260. doi:10.1029/95gl01089
Calderoni, G., Rovelli, A., Ben-Zion, Y., and Di Giovambattista, R. (2015). Along-strike Rupture Directivity of Earthquakes of the 2009 L'Aquila, Central Italy, Seismic Sequence. Geophys. J. Int. 203 (1), 399–415. doi:10.1093/gji/ggv275
Cesca, S., Heimann, S., and Dahm, T. (2011). Rapid directivity detection by azimuthal amplitude spectra inversion. J. Seismol. 15, 147–164. doi:10.1007/s10950-010-9217-4
Dahm, T., Manthei, G., and Eisenblätter, J. (1999). Automated Moment Tensor Inversion to Estimate Source Mechanisms of Hydraulically Induced Micro-seismicity in Salt Rock. Tectonophysics 306, 1–17. doi:10.1016/s0040-1951(99)00041-4
Dahm, T. (2001). Rupture Dimensions and Rupture Processes of Fluid-Induced Microcracks in Salt Rock. J. Volcanology Geothermal Res. 109, 149–162. doi:10.1016/s0377-0273(00)00309-7
Davies, R., Foulger, G., Bindley, A., and Styles, P. (2013). Induced Seismicity and Hydraulic Fracturing for the Recovery of Hydrocarbons. Mar. Pet. Geology. 45, 171–185. doi:10.1016/j.marpetgeo.2013.03.016
Dresen, G., Renner, J., Bohnhoff, M., Konietzki, H., Kwiatek, G., Klee, G., et al. (2019). STIMTEC—a Mine-Back Experiment in the Reiche Zeche Underground Laboratory. Geophys. Res. Abstr. 21, EGU2019–9357.
Eshelby, J. D. (1957). The Determination of the Elastic Field of an Ellipsoidal Inclusion, and Related Problems. Proc. R. Soc. A: Math. Phys. Sci. 241 (1226), 376–396. doi:10.1098/rspa.1957.0133
Fan, W., and McGuire, J. J. (2018). Investigating Microearthquake Finite Source Attributes with IRIS Community Wavefield Demonstration Experiment in Oklahoma. Geophys. J. Int. 214 (2), 1072–1087. doi:10.1093/gji/ggy203
Folesky, J., Kummerow, J., Shapiro, S. A., Häring, M., and Asanuma, H. (2016). Rupture Directivity of Fluid-Induced Microseismic Events: Observations from an Enhanced Geothermal System. J. Geophys. Res. 121 (11), 8034–8047. doi:10.1002/2016jb013078
Fukao, Y. (1972). Source Process of a Large Deep-Focus Earthquake and its Tectonic Implications - the Western Brazil Earthquake of 1963. Phys. Earth Planet. Interiors 5, 61–76. doi:10.1016/0031-9201(72)90074-x
Gischig, V. S., Doetsch, J., Maurer, H., Krietsch, H., Amann, F., Evans, K. F., et al. (2018). On the Link between Stress Field and Small-Scale Hydraulic Fracture Growth in Anisotropic Rock Derived from Microseismicity. Solid Earth 9 (1), 39–61. doi:10.5194/se-9-39-2018
Hartzell, S. H. (1978). Earthquake Aftershocks as Green's Functions. Geophys. Res. Lett. 5, 1–4. doi:10.1029/gl005i001p00001
Haskell, N. (1964). Total Energy and Energy Spectral Density of Elastic Wave Radiation from Propagating Faults. Bull. Seismological Soc. America 54 (6A), 1811–1841.
Huang, H.-H., Aso, N., and Tsai, V. (2017). Toward Automated Directivity Estimates in Earthquake Moment Tensor Inversion. Geophys. J. Int. 211, 1084–1098. doi:10.1093/gji/ggx354
Kane, D. L., Shearer, P. M., Goertz-Allmann, B. P., and Vernon, F. L. (2013). Rupture Directivity of Small Earthquakes at Parkfield. J. Geophys. Res. Solid Earth 118, 212–221. doi:10.1029/2012JB009675
Kikuchi, M., and Ishida, M. (1993). Source Retrieval for Deep Local Earthquakes with Broadband Records. Bull. Seismol. Soc. Am. 83, 1855–1870.
Király-Proag, E., Satriano, C., Bernard, P., and Wiemer, S. (2019). Rupture Process of the Mw 3.3 Earthquake in the St. Gallen 2013 Geothermal Reservoir, Switzerland. Geophys. Res. Lett. 46, 7990–7999. doi:10.1029/2019GL082911
Kneafsey, T. J., Dobson, P., Blankenship, D., Morris, J., Knox, H., Schwering, P., et al. (2018). An Overview of the EGS Collab Project: Field Validation of Coupled Process Modeling of Fracturing and Fluid Flow at the Sanford Underground Research Facility, Lead, SD, Proceedings of the 43rdWorkshop on Geothermal Reservoir Engineering. Stanford, CA: SGP-TR-213Stanford University.
Kolár, P., Petruzálek, M., Lokajícek, T., Síleny, J., Jechumtálova, Z., Adamová, P., et al. (2020). Acoustic Emission Events Interpreted in Terms of Source Directivity. Pure Appl. Geophys. 177, 4271–4288doi:10.1007/s00024-020-02517-w
Kurzon, I., Vernon, F. L., Ben-Zion, Y., and Atkinson, G. (2014). Ground Motion Prediction Equations in the San Jacinto Fault Zone: Significant Effects of Rupture Directivity and Fault Zone Amplification. Pure Appl. Geophys. 171 (11), 3045–3081. doi:10.1007/s00024-014-0855-2
Kwiatek, G., Martínez‐Garzón, P., and Bohnhoff, M. (2016). HybridMT: A MATLAB/Shell Environment Package for Seismic Moment Tensor Inversion and Refinement. Seismological Res. Lett. 87 (4), 964–976. doi:10.1785/0220150251
Kwiatek, G., Martínez-Garzón, P., Plenkers, K., Leonhardt, M., Zang, A., von Specht, S., et al. (2018). Insights into Complex Subdecimeter Fracturing Processes Occurring during a Water Injection Experiment at Depth in Äspö Hard Rock Laboratory, Sweden. J. Geophys. Res. Solid Earth 123, 6616–6635. doi:10.1029/2017JB014715
López-Comino, J.-Á., Mancilla, F. d. L., Morales, J., and Stich, D. (2012). Rupture Directivity of the 2011, Mw 5.2 Lorca Earthquake (Spain). Geophys. Res. Lett. 39, a–n. doi:10.1029/2011GL050498
López-Comino, J. A., Braun, T., Dahm, T., Cesca, S., and Danesi, S. (2021). On the Source Parameters and Genesis of the 2017, Mw 4 Montesano Earthquake in the Outer Border of the Val d'Agri Oilfield (Italy). Front. Earth Sci. doi:10.3389/feart.2020.617794
López-Comino, J. A., Cesca, S., Heimann, S., Grigoli, F., Milkereit, C., Dahm, T., et al. (2017). Characterization of Hydraulic Fractures Growth during the Äspö Hard Rock Laboratory Experiment (Sweden). Rock Mech. Rock Eng. 50 (11), 2985–3001. doi:10.1007/s00603-017-1285-0
López-Comino, J. A., and Cesca, S. (2018). Source Complexity of an Injection Induced Event: The 2016 Mw 5.1 Fairview, Oklahoma Earthquake. Geophys. Res. Lett. 45, 4025–4032. doi:10.1029/2018GL077631
López-Comino, J. A., Stich, D., Morales, J., and Ferreira, A. M. G. (2016). Resolution of Rupture Directivity in Weak Events: 1-D versus 2-D Source Parameterizations for the 2011, Mw 4.6 and 5.2 Lorca Earthquakes, Spain. J. Geophys. Res. Solid Earth 121, 6608–6626. doi:10.1002/2016JB013227
Lui, S. K., and Huang, Y. (2019). Do injection-induced earthquakes rupture away from injection wells due to fluid pressure change? Bull. Seismol. Soc. Am. 109 (1), 358–371.
Maghsoudi, S., Cesca, S., Hainzl, S., Kaiser, D., Becker, D., and Dahm, T. (2013). Improving the Estimation of Detection Probability and Magnitude of Completeness in Strongly Heterogeneous Media, an Application to Acoustic Emission (AE). Geophys. J. Int. 193, 1556–1569.
Manthei, G., Eisenblätter, J., and Dahm, T. (2001). Moment Tensor Evaluation of Acoustic Emission Sources in Salt Rock. Constr. Build. Mater. 193, 297–309. doi:10.1093/gji/ggt049
McGuire, J. J. (2017). A Matlab Toolbox for Estimating the Second Moments of Earthquake Ruptures. Seismological Res. Lett. 88 (2A), 371–378. doi:10.1785/0220160170
McGuire, J. J. (2004). Estimating Finite Source Properties of Small Earthquake Ruptures. Bull. Seismological Soc. America 94 (2), 377–393. doi:10.1785/0120030091
McGuire, J. J., Zhao, L., and Jordan, T. H. (2002). Predominance of Unilateral Rupture for a Global Catalog of Large Earthquakes. Bull. Seismological Soc. America 92 (8), 3309–3317. doi:10.1093/gji/ggt04910.1785/0120010293
Meng, H., McGuire, J. J., and Ben‐Zion, Y. (2020). Semiautomated Estimates of Directivity and Related Source Properties of Small to Moderate Southern California Earthquakes Using Second Seismic Moments. J. Geophys. Res. Solid Earth 125, e2019JB018566. doi:10.1029/2019JB018566
Niemz, P., Cesca, S., Heimann, S., Grigoli, F., von Specht, S., Hammer, C., et al. (2020). Full-waveform-based Characterization of Acoustic Emission Activity in a Mine-Scale Experiment: a Comparison of Conventional and Advanced Hydraulic Fracturing Schemes. Geophys. J. Int. 222 (1), 189–206. doi:10.1093/gji/ggaa127
Nolen-Hoeksema, R. C., and Ruff, L. J. (2001). Moment Tensor Inversion of Microseisms from the B-Sand Propped Hydrofracture, M-Site, Colorado. Tectonophysics 336, 163–181. doi:10.1016/s0040-1951(01)00100-7
Ono, K. (2018). Frequency Dependence of Receiving Sensitivity of Ultrasonic Transducers and Acoustic Emission Sensors. Sensors 18, 3861. doi:10.3390/s18113861
Park, S., and Ishii, M. (2015). Inversion for Rupture Properties Based upon 3-D Directivity Effect and Application to Deep Earthquakes in the Sea of Okhotsk Region. Geophys. J. Int. 203, 1011–1025. doi:10.1093/gji/ggv352
Ross, Z. E., Trugman, D. T., Azizzadenesheli, K., and Anandkumar, A. (2020). Directivity Modes of Earthquake Populations with Unsupervised Learning. J. Geophys. Res. Solid Earth 125, e2019JB018299. doi:10.1029/2019JB018299
Schoenball, M., Ajo‐Franklin, J. B., Blankenship, D., Chai, C., Chakravarty, A., Dobson, P., et al. The EGS Collab Team (2020). Creation of a Mixed-Mode Fracture Network at Meso-Scale through Hydraulic Fracturing and Shear Stimulation. J. Geophys. Res. Solid Earth 125, e2020JB019807. doi:10.1029/2020jb019807
Schultz, R., Skoumal, R. J., Brudzinski, M. R., Eaton, D., Baptie, B., and Ellsworth, W. (2020). Hydraulic Fracturing‐Induced Seismicity. Rev. Geophys. 58, e2019RG000695. doi:10.1029/2019RG000695
Stein, W., and Wysession, M. (2003). An Introduction to Seismology, Earthquakes, and Earth Structure. Malden, Mass: Blackwell, 498.
Stich, D., Martín, R., Morales, J., López-Comino, J. Á., and Mancilla, F. d. L. (2020). Slip Partitioning in the 2016 Alboran Sea Earthquake Sequence (Western Mediterranean). Front. Earth Sci. 8, 587356. doi:10.3389/feart.2020.587356
Tibi, R., Estabrook, C. H., and Bock, G. (1999). The 1996 June 17 Flores Sea and 1994 March 9 Fiji-Tonga Earthquakes: Source Processes and Deep Earthquake Mechanisms. Geophys. J. Int. 138, 625–642. doi:10.1046/j.1365-246x.1999.00879.x
Tilmann, F., Zhang, Y., Moreno, M., Saul, J., Eckelmann, F., Palo, M., et al. (2016). The 2015 Illapel Earthquake, Central Chile: a Type Case for a Characteristic Earthquake?. Geophys. Res. Lett. 43 (2), 574–583. doi:10.1002/2015gl066963
Villiger, L., Gischig, V. S., Doetsch, J., Krietsch, H., Dutler, N. O., Jalali, M., et al. (2020). Influence of Reservoir Geology on Seismic Response during Decameter-Scale Hydraulic Stimulations in Crystalline Rock. Solid Earth 11 (2), 627–655. doi:10.5194/se-11-627-2020
Villiger, L., Gischig, V. S., Kwiatek, G., Krietsch, H., Doetsch, J., Jalali, M., et al. (2021). Metre-scale Stress Heterogeneities and Stress Redistribution Drive Complex Fracture Slip and Fracture Growth during a Hydraulic Stimulation Experiment. Geophys. J. Int. 225, 1689–1703. doi:10.1093/gji/ggab057
Warren, L. M., and Shearer, P. M. (2006). Systematic Determination of Earthquake Rupture Directivity and Fault Planes from Analysis of Long-periodP-Wave Spectra. Geophys. J. Int. 164 (1), 46–62. doi:10.1111/j.1365-246X.2005.02769.x
Wu, Q., Chen, X., and Abercrombie, R. E. (2019). Source Complexity of the 2015 Mw 4.0 Guthrie, Oklahoma Earthquake. Geophys. Res. Lett. 46, 4674–4684. doi:10.1029/2019GL082690
Keywords: directivity, earthquake source, induced seismicity, hydraulic fracturing, acoustic emissions
Citation: López-Comino JÁ, Cesca S, Niemz P, Dahm T and Zang A (2021) Rupture Directivity in 3D Inferred From Acoustic Emissions Events in a Mine-Scale Hydraulic Fracturing Experiment. Front. Earth Sci. 9:670757. doi: 10.3389/feart.2021.670757
Received: 22 February 2021; Accepted: 05 May 2021;
Published: 17 May 2021.
Edited by:
Antonio Pio Rinaldi, ETH Zurich, SwitzerlandReviewed by:
Linus Villiger, ETH Zürich, SwitzerlandChet Hopp, Lawrence Berkeley National Laboratory, United States
Copyright © 2021 López-Comino, Cesca, Niemz, Dahm and Zang. This is an open-access article distributed under the terms of the Creative Commons Attribution License (CC BY). The use, distribution or reproduction in other forums is permitted, provided the original author(s) and the copyright owner(s) are credited and that the original publication in this journal is cited, in accordance with accepted academic practice. No use, distribution or reproduction is permitted which does not comply with these terms.
*Correspondence: José Ángel López-Comino, jalopezcomino@ugr.es