
Assessment of Sortability Using a Dual-Energy X-ray Transmission System for Studied Sulphide Ore


The Norman B. Keevil Institute of Mining Engineering, University of British Columbia, Vancouver, BC V6T 1Z4, Canada
*
Author to whom correspondence should be addressed.
Minerals 2021, 11(5), 490; https://doi.org/10.3390/min11050490
Submission received: 8 March 2021
/
Revised: 30 April 2021
/
Accepted: 1 May 2021
/
Published: 4 May 2021
(This article belongs to the Special Issue Advanced Techniques and Efficiency Assessment of Mechanical Processing)
Abstract
:In hard rock mining, sensor-based sorting can be applied as a pre-concentration method before the material enters the mill. X-ray transmission sensors have been explored in mining since 1972. Sorting ore of acceptable grade and waste material before processing at the mill can reduce the amount of tailings per unit of valuable metal in the mining operation and have many economic benefits. Ore samples used in this paper are from a polymetallic carbonate replacement deposit (gold-silver-lead-zinc sulphide) in Southeast Europe. This paper focuses on how the Dual-Energy X-ray Transmission (DE-XRT) data is generated and used for ore characterization and sortability for this sulphide ore. The method used in the DE-XRT analysis in this project is based on the dual-material decomposition method, which is used in the medical industry for radiology. This technique can distinguish sulphides from non-sulphides. However, the correlation developed between the DE-XRT response and the metal content is lacking. As a result, the DE-XRT response can only classify the material effectively but cannot reliably predict the metal content.
1. Introduction
Ore sorting is a sensor-based sorting and pre-concentration technology that is implemented before the processing stage and used to reduce the amount of low-grade ore and waste reporting to the mill feed. X-ray transmission sensors have been explored in mining since 1972, as described by Jenkinson et al. [1] This technology is widely used at airports for baggage inspection and the basic principles have been adopted as a sorting technique [2] This technology can also be utilized to recover ore from previously uneconomic waste and reduce the mill energy and reagent consumption by reducing the mass of ore being processed by the mill [3]. In greenfield projects, sensor-based sorting can further provide value by lowering processing capital costs [4]. The decline of available high-grade orebodies and decreasing head grades has further increased the attractiveness of pre-concentration, and, subsequently, ore sorting [5].
A critical parameter in obtaining the DE-XRT result is developing the H-L (High and Low energy) curves that determine the relative density of a given pixel based on its X-ray attenuation. In this paper, a dual-material decomposition method will be used to determine the sulphide material from the waste material. This study aims to assess the effectiveness of DE-XRT to sort the sulphides from the non-sulphides. Since the ore is very heterogeneous, different rock types were identified to account for the mineral composition of various pieces of rock. Hence, the test work was designed to assess each rock representing different mineralogy or rock type. Density measurements using DE-XRT were used to determine average atomic density by measuring the X-ray attenuation for each specimen used in the study, respectively. Both silver and gold assays are determined by the fire assay method, and the rest of the elements are determined by the Induction Coupled Plasma Method (ICP).
In this study, the equivalent gold grade is used to assess the value of the sample since it is a polymetallic deposit. The equivalent gold grade is calculated by summarizing the dollar value of gold, silver, zinc, and lead, divided by the price of gold. The commodity price used in this study to calculate equivalent gold grade is 1300 $/oz of Au, 17.5 $/oz of Ag, 5 $/lb of Mo, 1.25 $/lb of Zn and 1.05 $/lb of Pb.
2. Materials and Methods
Three main parameters were recorded for each rock specimen in this experiment: rock classification, DE-XRT output, and assays. It is critical to ensure that the same sample is assessed for each parameter to obtain correct data for correlation analysis. Five hundred rock specimens were used in this study, and the particle size ranged between +50 mm to 100 mm. The initial sample consisted of run-of-mine (ROM) material, which included fines and coarse particles not suitable for particle sorting. The ROM material was screened to the desired particle size between 50 mm and 100 mm and washed where the five hundred representative samples were selected.
2.1. Material Classification
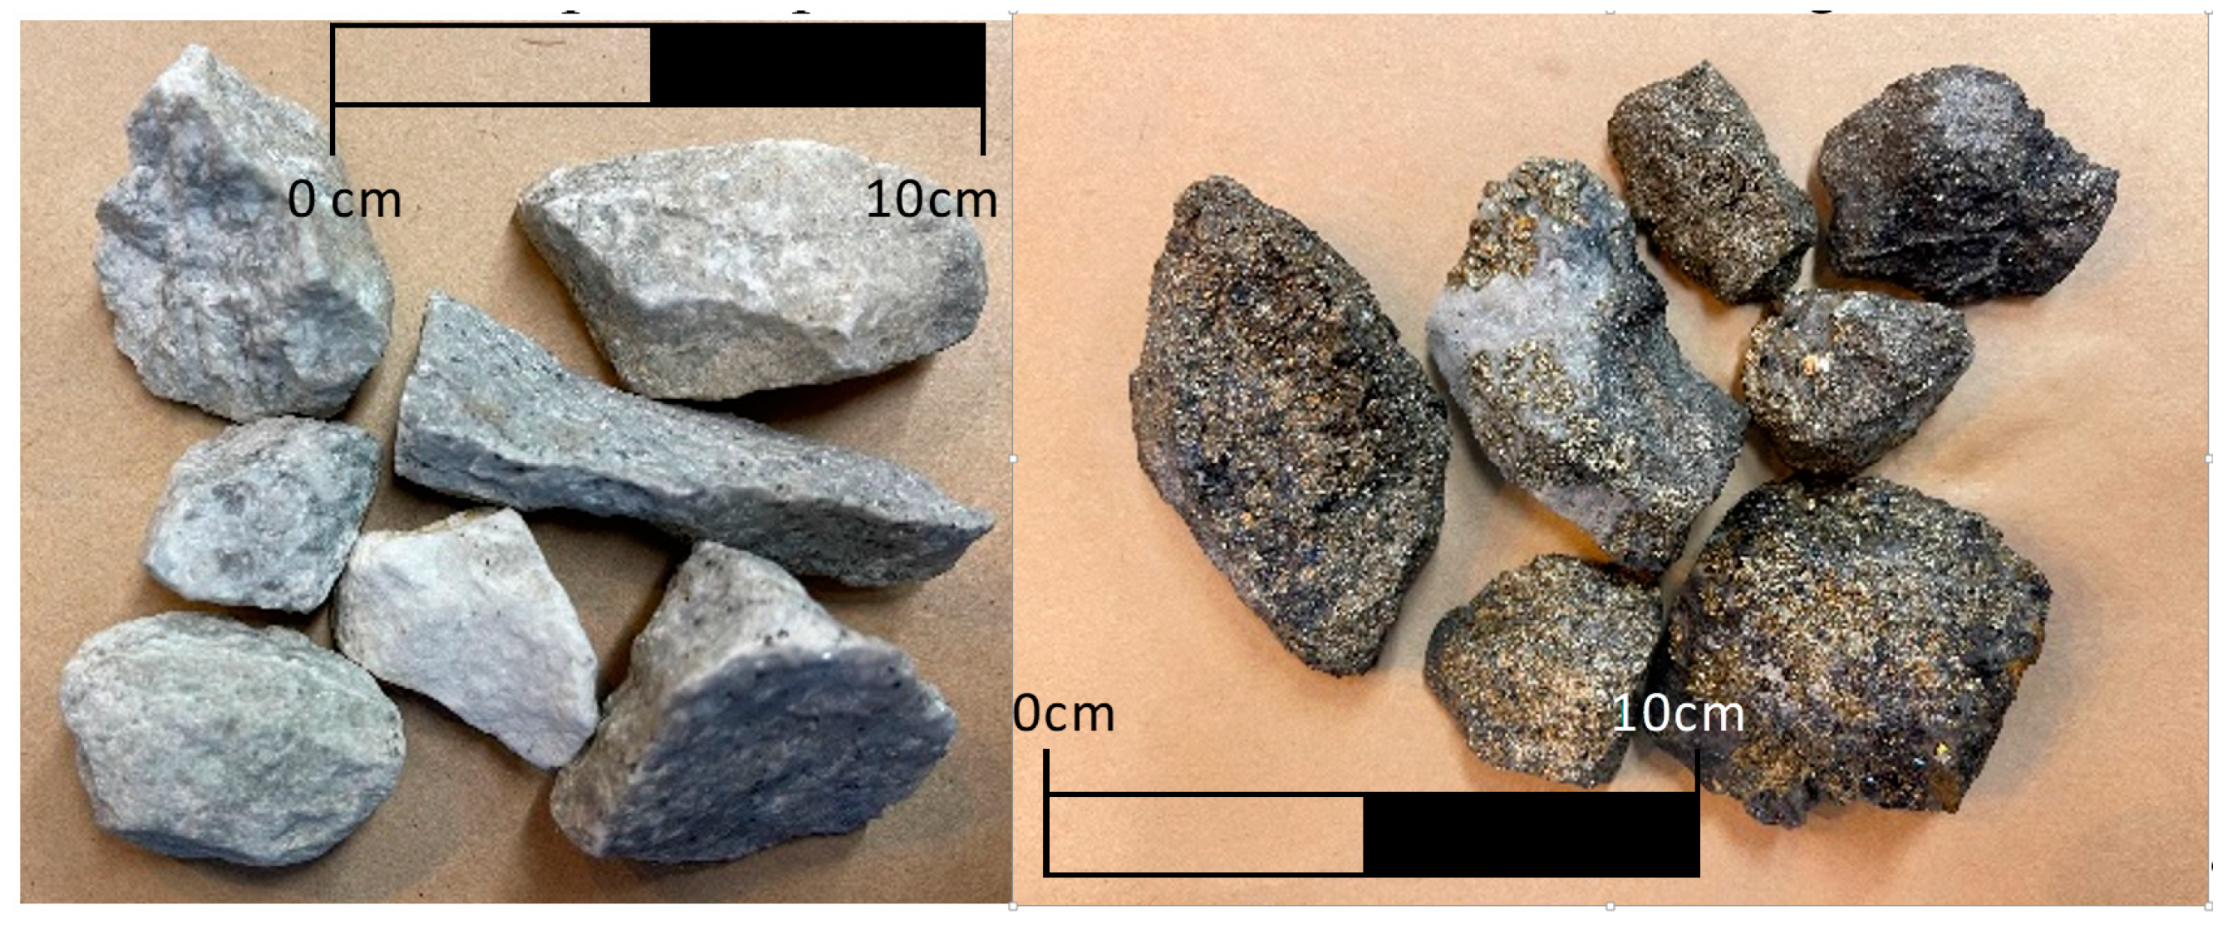
Individual rock specimen has been classified into two classes based on visual observations of mineralization. When classifying rock types into the two classes, two factors are considered for this ore deposit. Initially, visual parameters are considered where rock specimens are observed showing mineralization; those with silver or golden tints are considered sulphides, while the dull and whitish-looking rocks are considered non-sulphides (mostly carbonates in this case). Also, the density of the samples aids the classification, where the heavier sample of the same rock size is classified as a sulphide. Examples of sulphide and non-sulphide specimens are illustrated in Figure 1.
2.2. Dual-Energy X-ray Transmission (DE-XRT)
The Dual-Energy X-ray Transmission (DE-XRT) technology measures the X-ray attenuation according to Beer’s Law for monochromatic narrow X-ray beams [6], which is expressed in the equation below. The final µ coefficient will be a function of radiation energy in addition to the properties like material density and thickness [7].
The relationship between the high- and low-energy X-ray attenuation can be expressed by rearranging Equations (1) and (2), which is the basis of H-L curve generation:
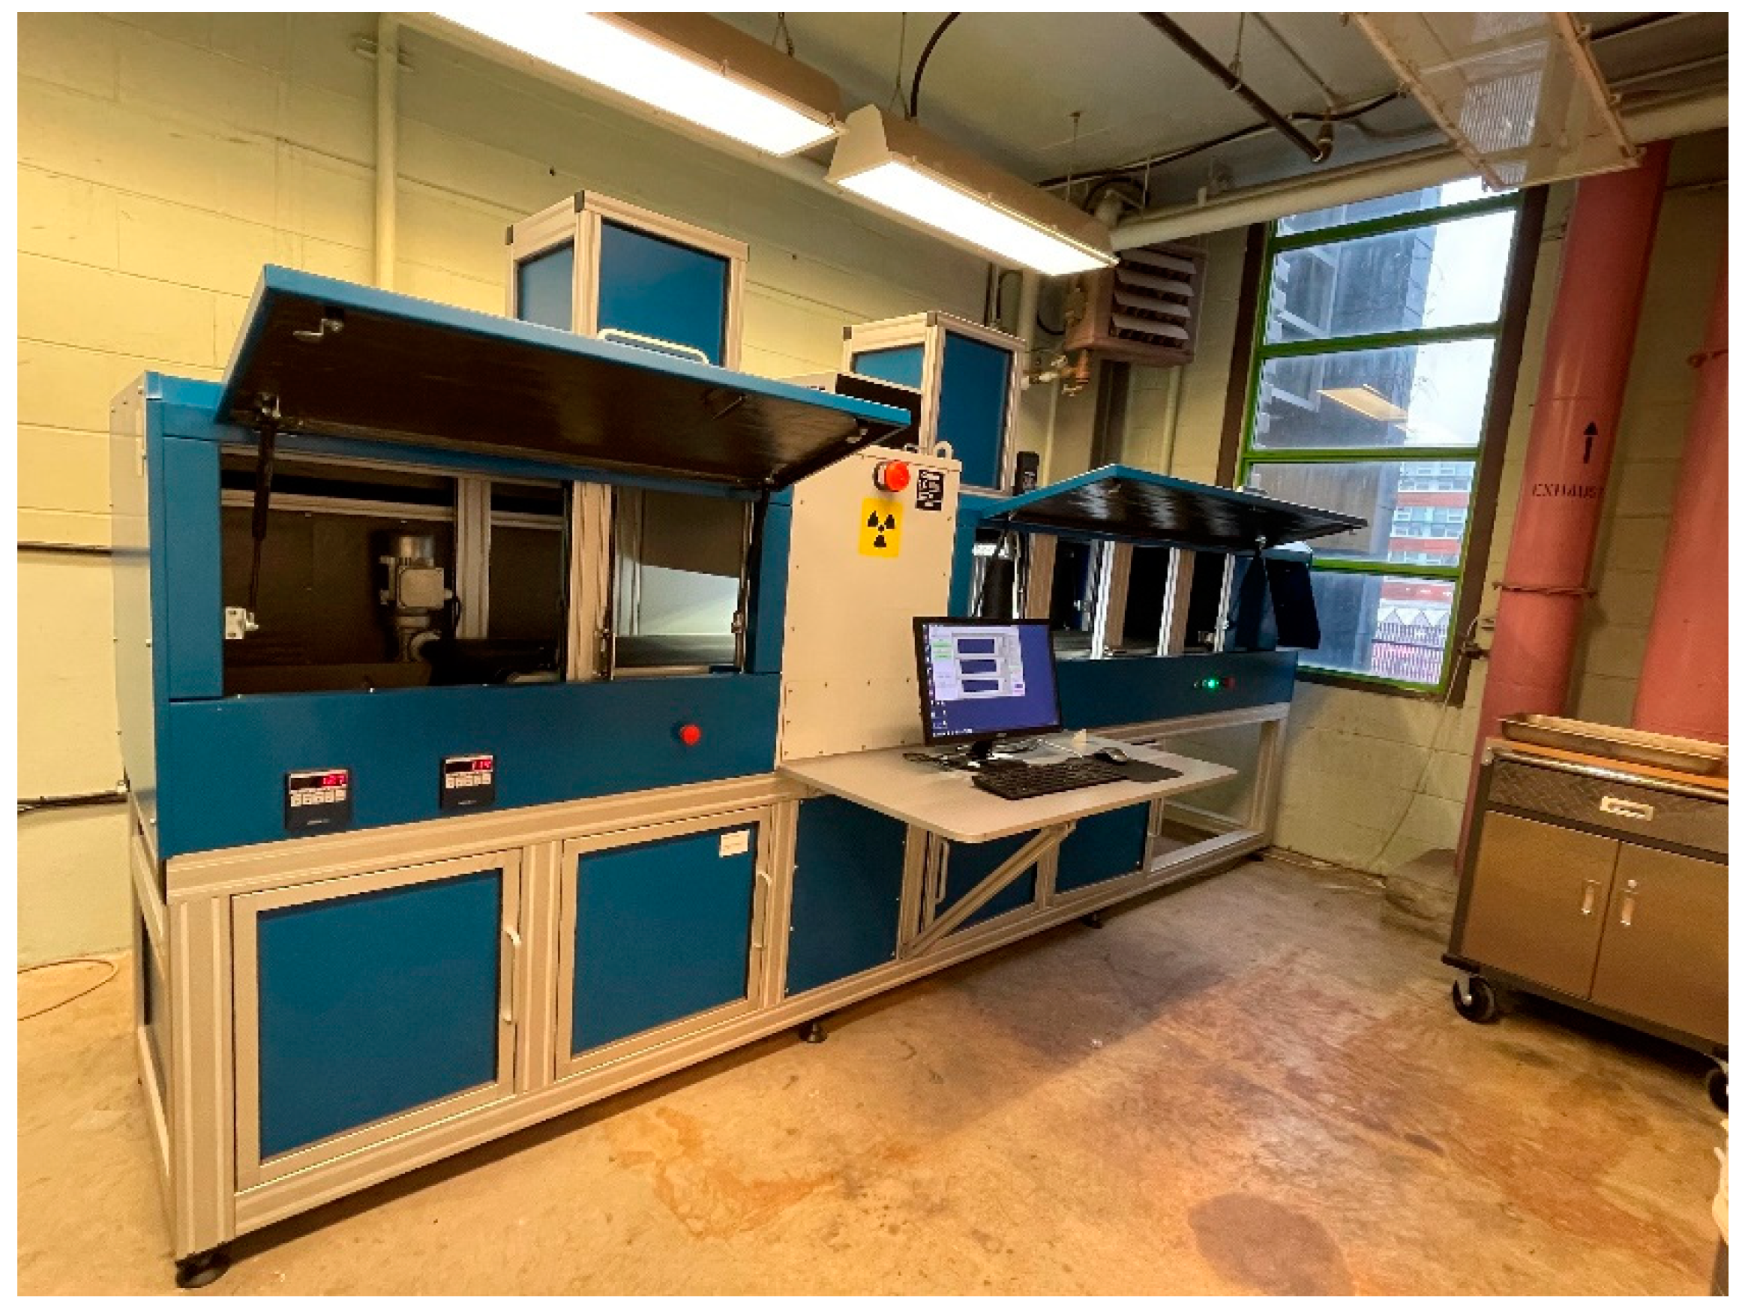
In this experiment, COMEX’s MSX-400-VL-XR system installed at the University of British Columbia (UBC) was used and illustrated in Figure 2. The equipment has an X-ray sensor with a 1.5 mm resolution and a belt width of 51 cm travelling at a speed of 0.5 m/s. In order to minimize the error from equipment malfunction such as miscalibrated detectors, the machine is maintained regularly and necessary repair would need to be completed [8].
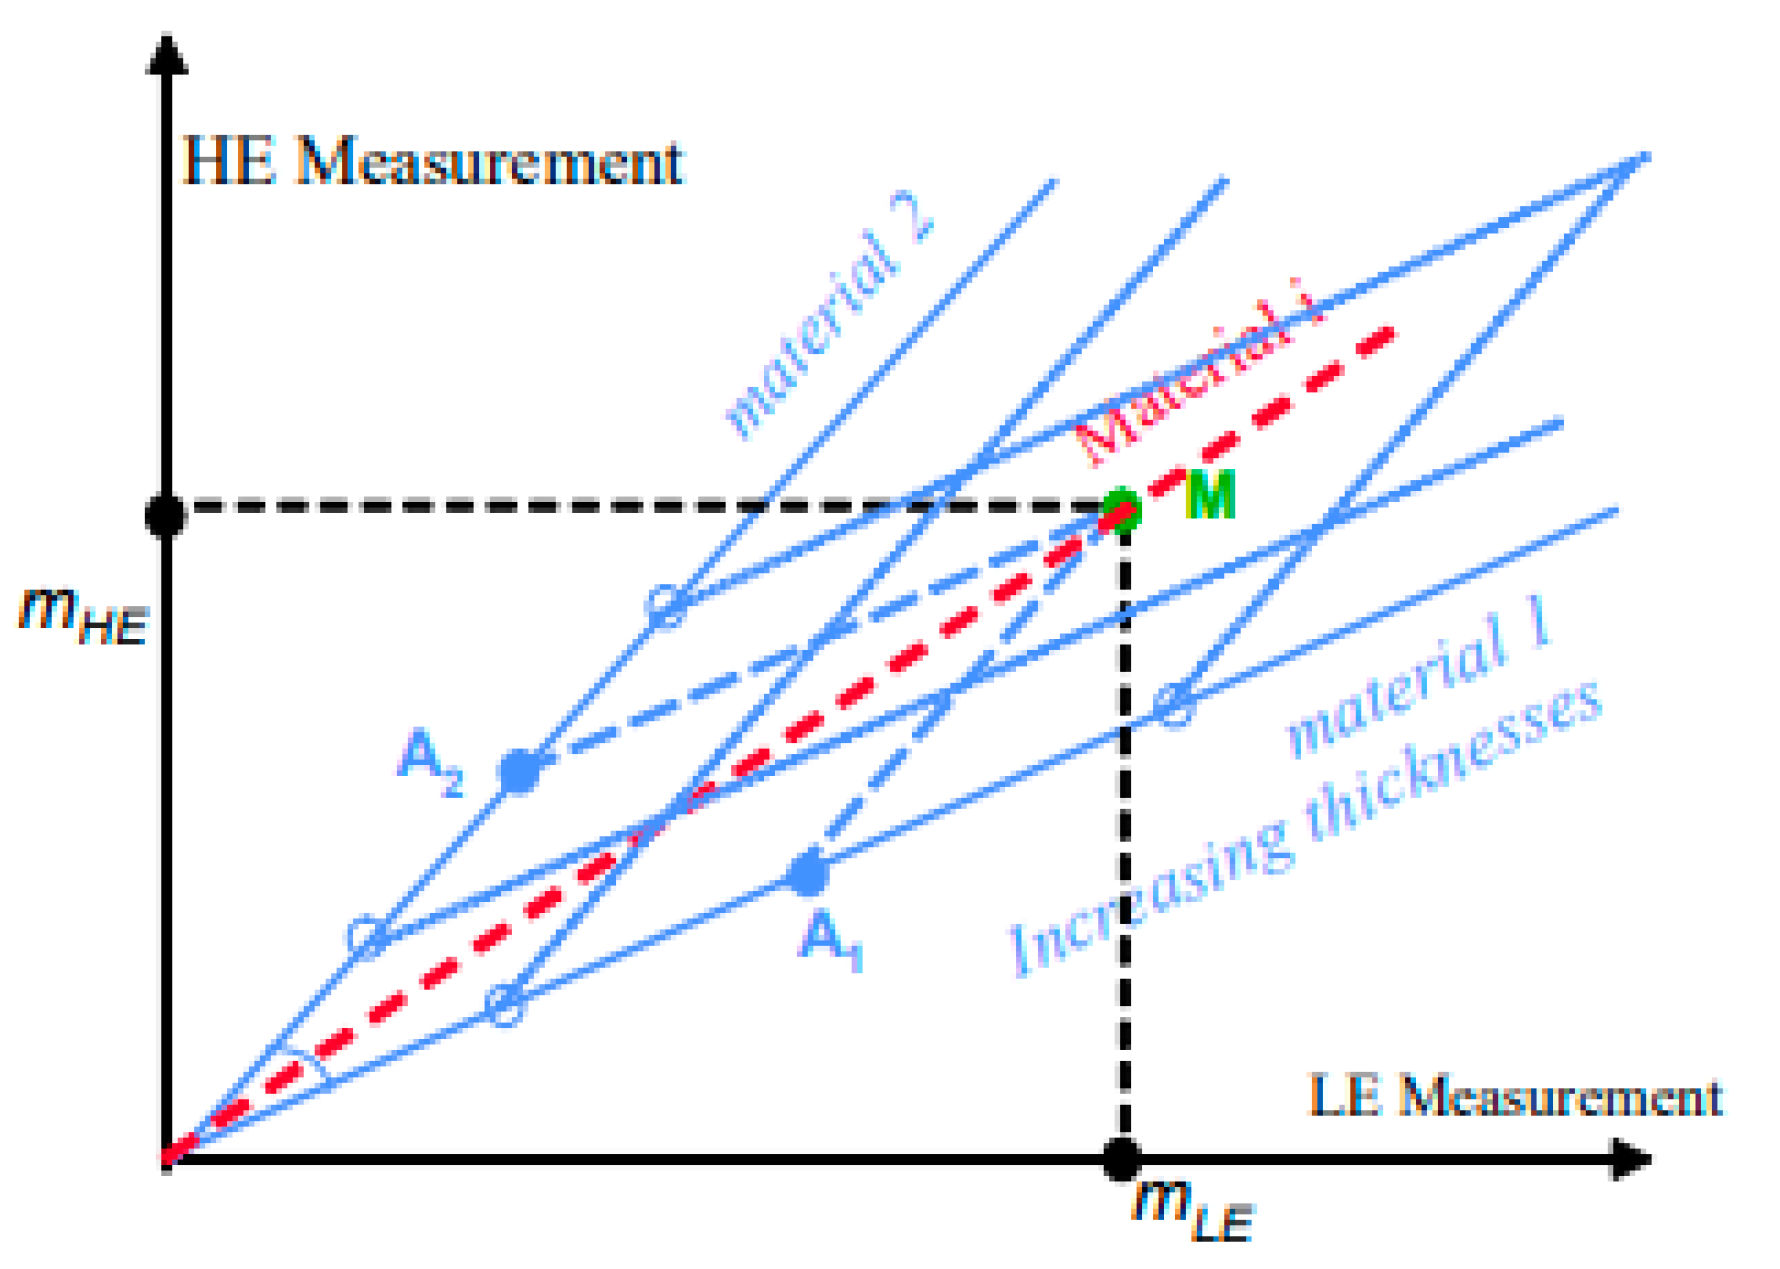
Using the COMEX MSX-400-VL-XR system, H-L curves are generated. The low-energy X-ray response represents the x-axis, and the high-energy X-ray response represents the y-axis. To use the dual-material decomposition method, two distinct material types were chosen. Figure 3 illustrates a visual representation of the dual-material decomposition method where Material 1 and Material 2 are vectors and where material can be represented as a sum of Material 1 and Material 2.
In this study, the two types of material chosen for validation were dictated by the amount of equivalent gold content in the specimen. The rock with an equivalent gold grade in the top fifth percentile (sulphide) and the bottom fifth percentile (non-sulphide) was chosen to generate the characteristic function in the H-L plot. The average grade of the entire sample was 13.47 g/t gold, 80.32 g/t silver, 2.58% lead, and 2.66% zinc. The unit of 1 g/t was equivalent to 1 ppm since there are one million grams in one metric ton. The rocks classified in the top fifth percentile of metal content can have gold grades as high as 60 g/t, silver grades of 200 g/t, lead grades of 7%, or zinc grades of 4%.
The relative density number for each pixel is determined by finding the magnitude of each vector from sulphides and non-sulphides. The relative density value, in this case, represents the percentage of being rock referred to as Material type 1, which is expressed in the equation below.
2.3. Assays
Upon completion of the XRT tests, the rocks were then sent for assaying. The assay determined the amount of valuable metals present in every rock using 30 g of a sample for fire assay. Additionally, a 33-element Inductively Coupled Plasma Atomic Emission Spectroscopy (ICP-AES, MS Analytical, Lanley, B.C., Canada was conducted on the individual samples.
3. Results and Discussion
In this sample, the ore and waste have been determined by the amount of particular mineralization visible macroscopically (by the naked eye). Of the five hundred rock specimens, 218 (43.6%) samples were visually classified as non-sulphides, and the remaining 282 (46.4%) samples were sulphides.
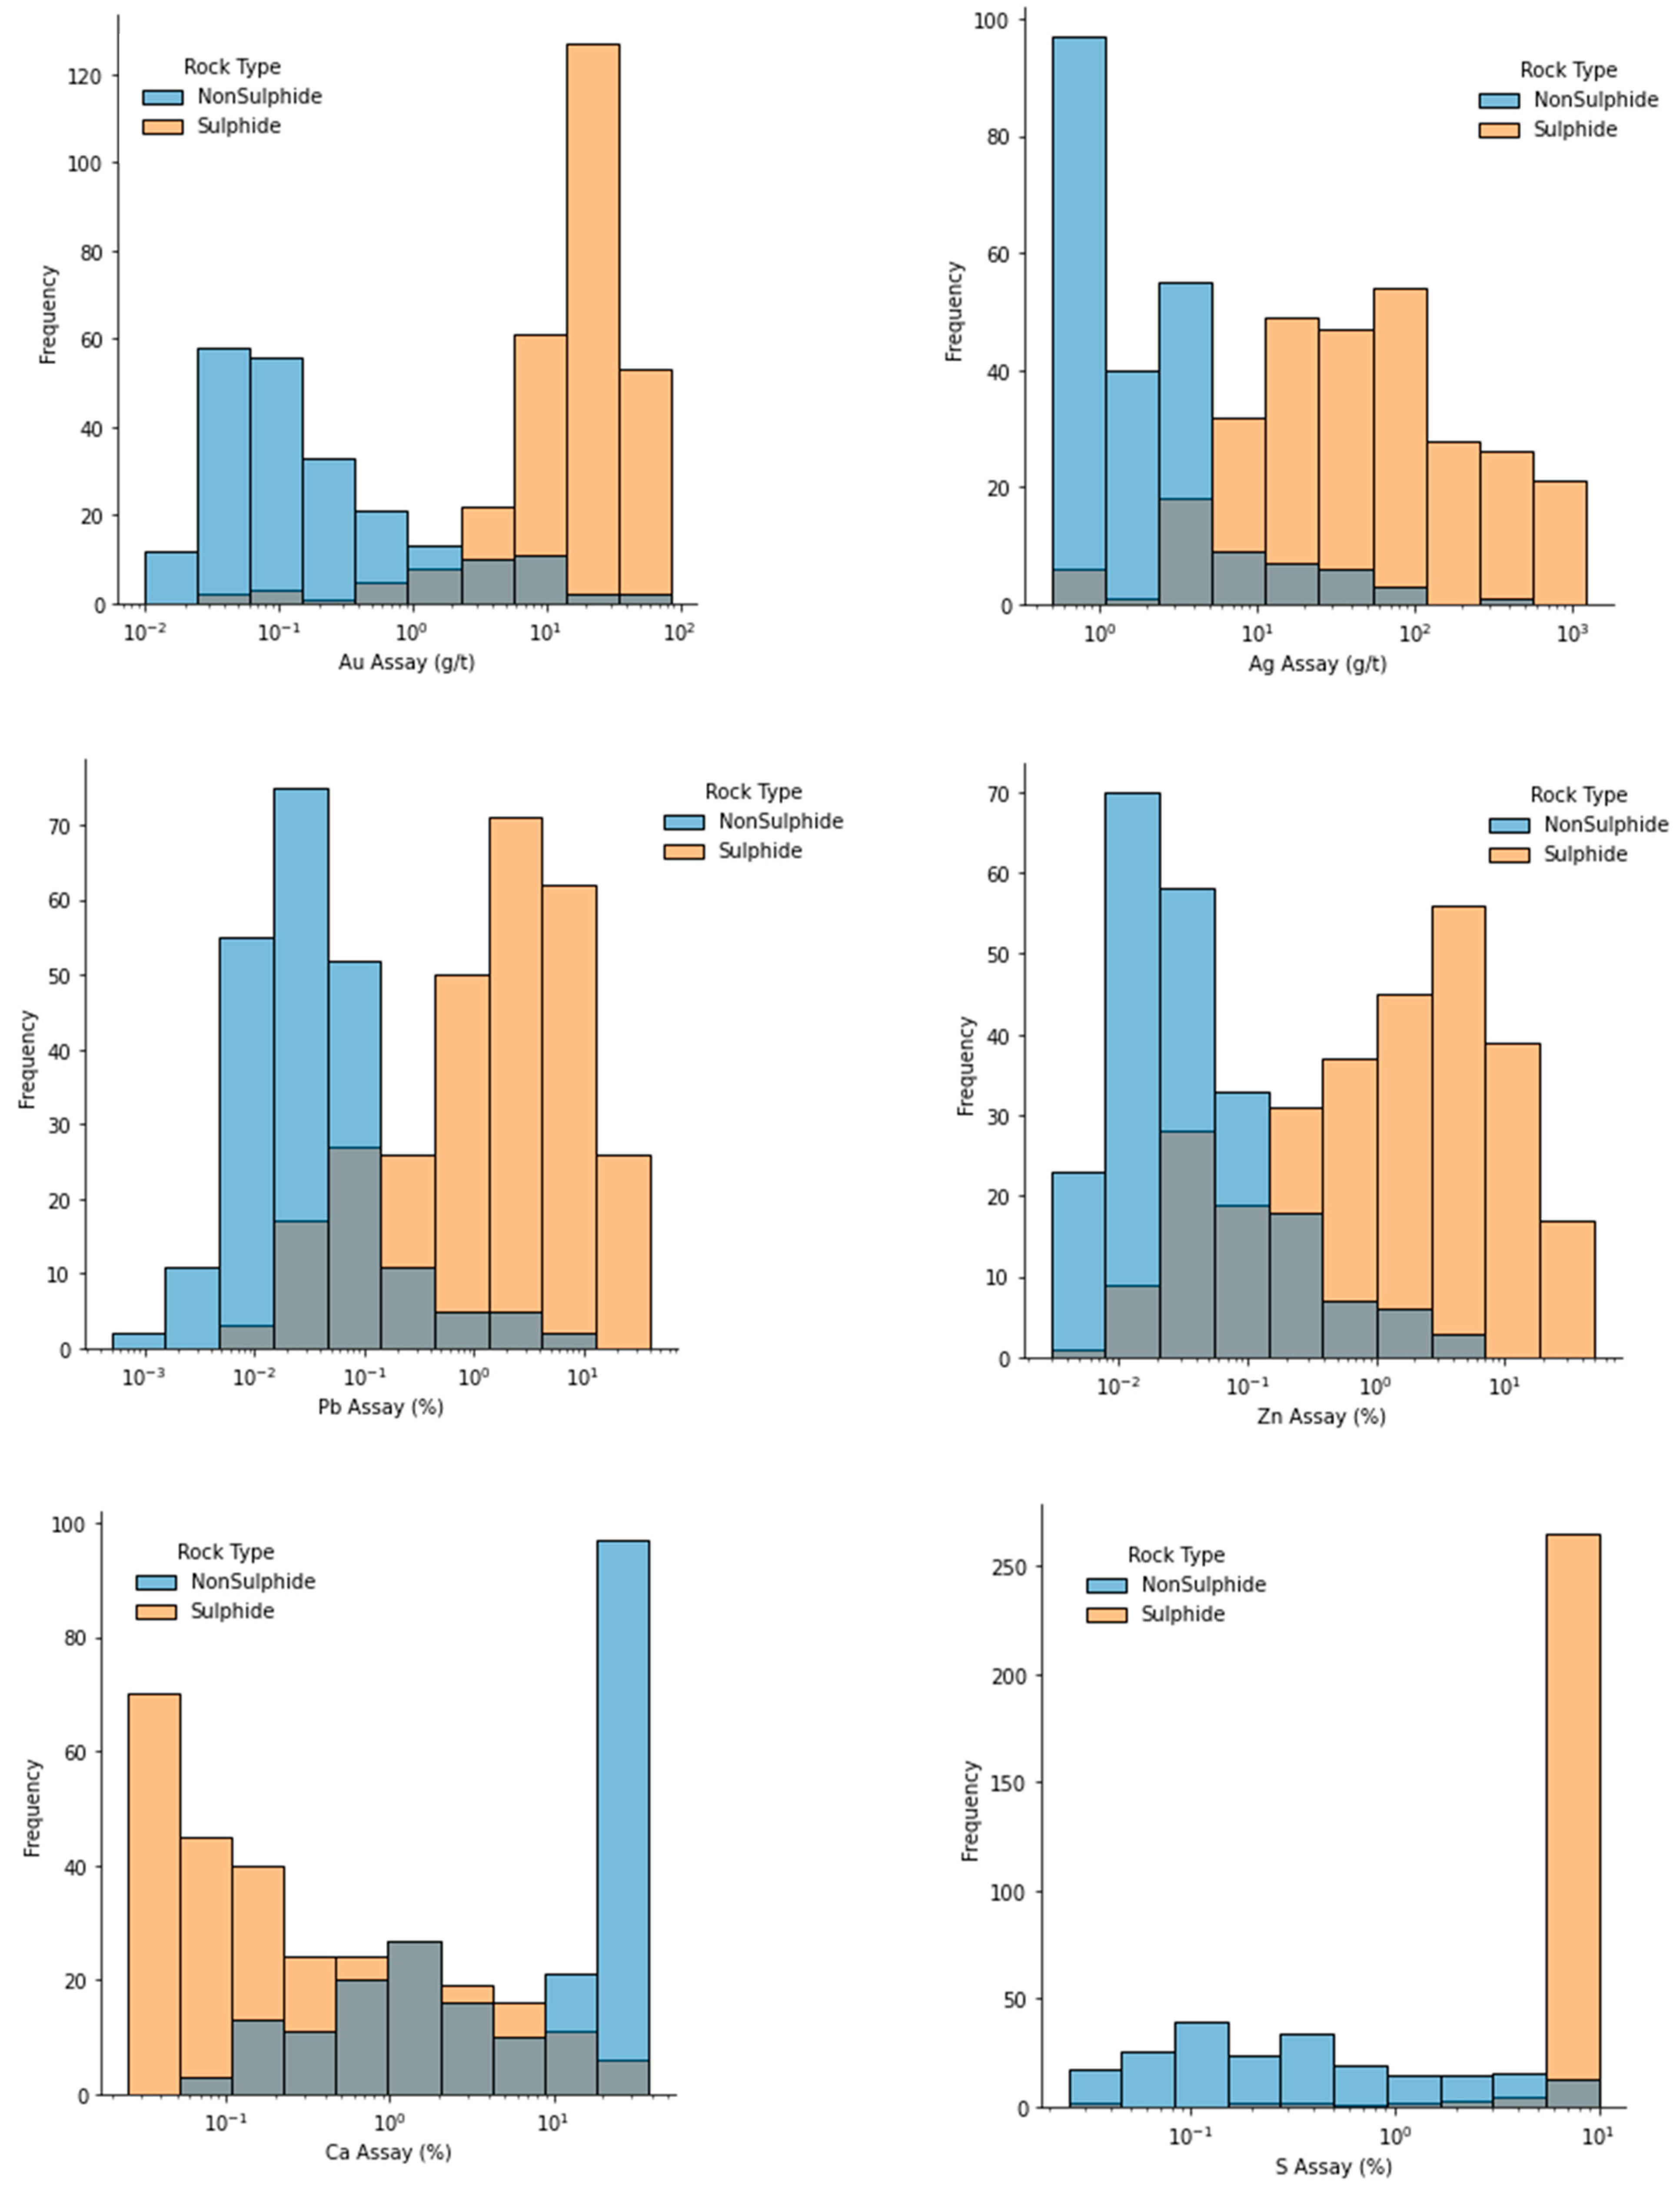
Figure 4 illustrates the distribution of six different assays for all samples, with rock types differentiated by colour (orange sulphides; blue non-sulphides). The histograms show that sulphide material tends to have a much higher grade for gold, silver, zinc, and lead, while non-sulphide materials tend to have much higher calcium content.
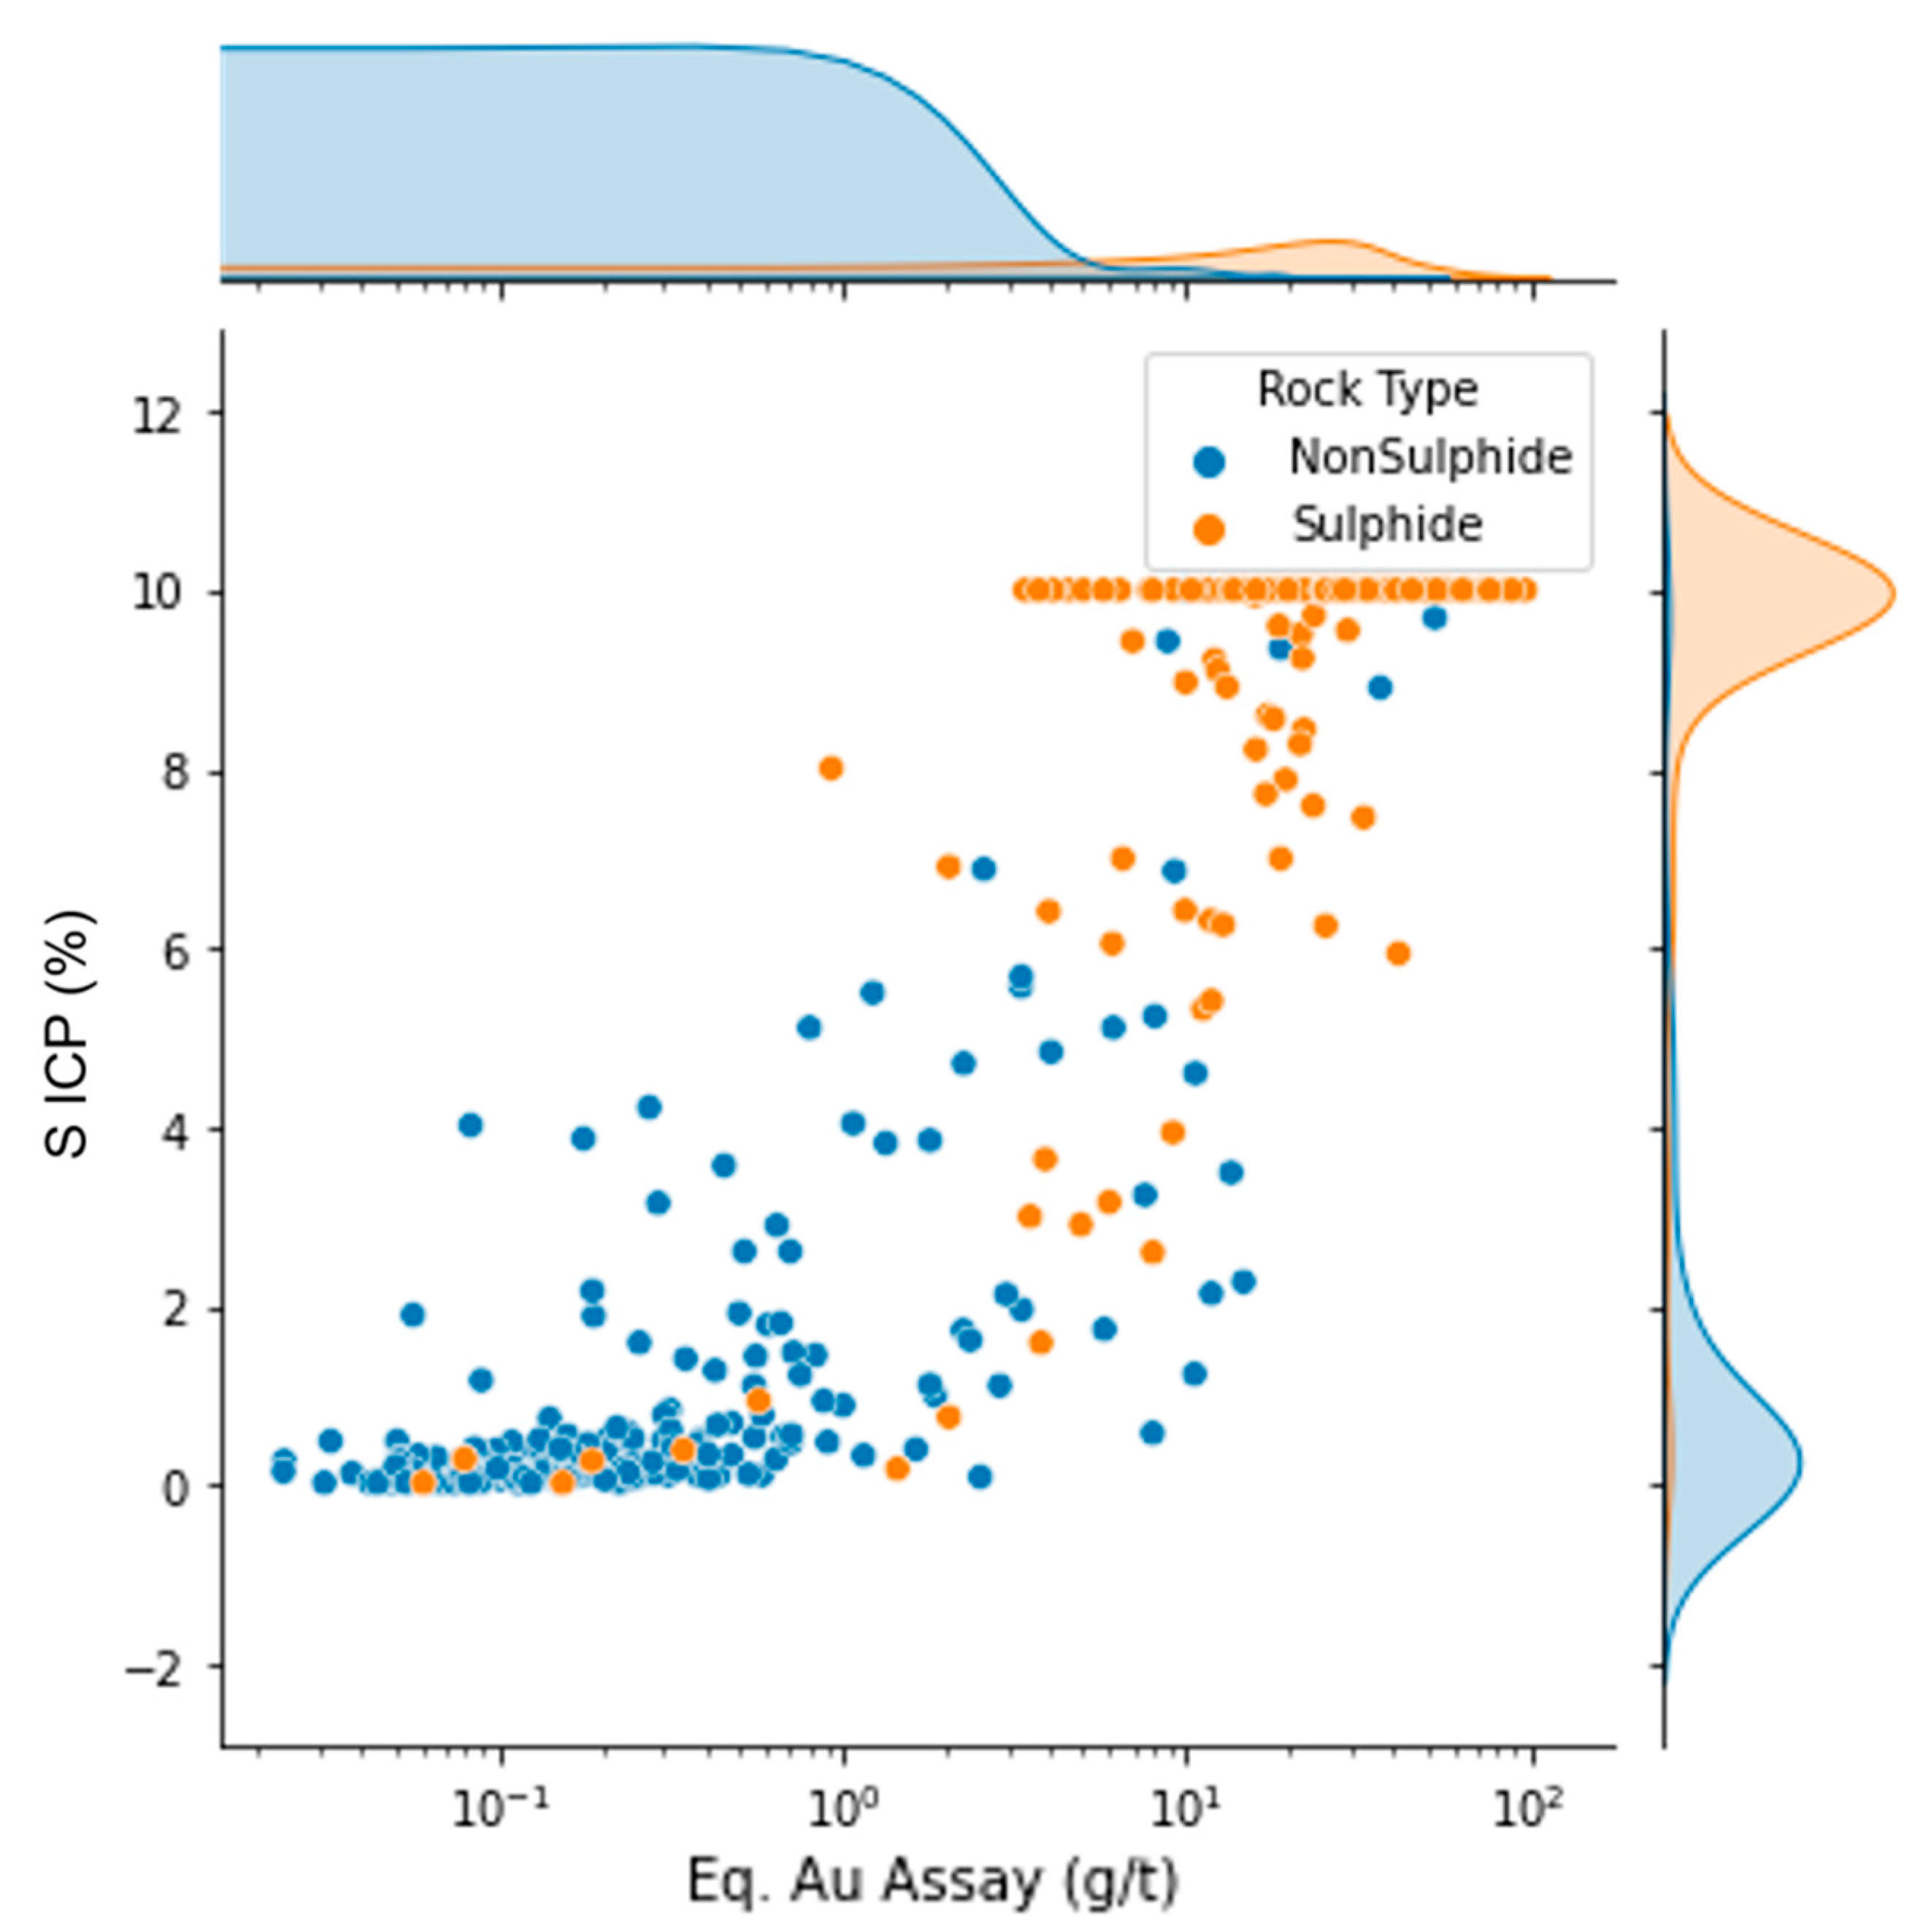
As illustrated in Figure 5, there are two distinct sets of materials. Sulphides (orange dots) have high equivalent gold grades as well as high sulphur content, while the non-sulphides have low equivalent gold grades and low sulphur content. This infers that there are distinct characteristics between the sulphide material and non-sulphide material.
3.1. DE-XRT Image Processing
Based on the H-L curve generated using the top and bottom 5 % of the samples with the highest equivalent gold grade, each specimen produced an image with relative density values representing each pixel. Three samples selected in Table 1 illustrate the difference between high, medium and low sulphur content samples (indicating sulphide content). The pixel values range from 0 to 1, where 0 is represented as blue, and 1 is represented as yellow.
In Table 1, there are distinct characteristics between these three samples. The colours represent each pixel’s relative density, ranging from 0 (dark blue) to 1 (yellow). The high relative density indicates that the sample is more likely to be a sulphide material. Valuable metals, iron, and sulphur are proportionally correlated, while the calcium content is inversely correlated. The high calcium content indicates that the waste material is composed of carbonates, while the sulphides have high iron, sulphur, and valuable metal content.
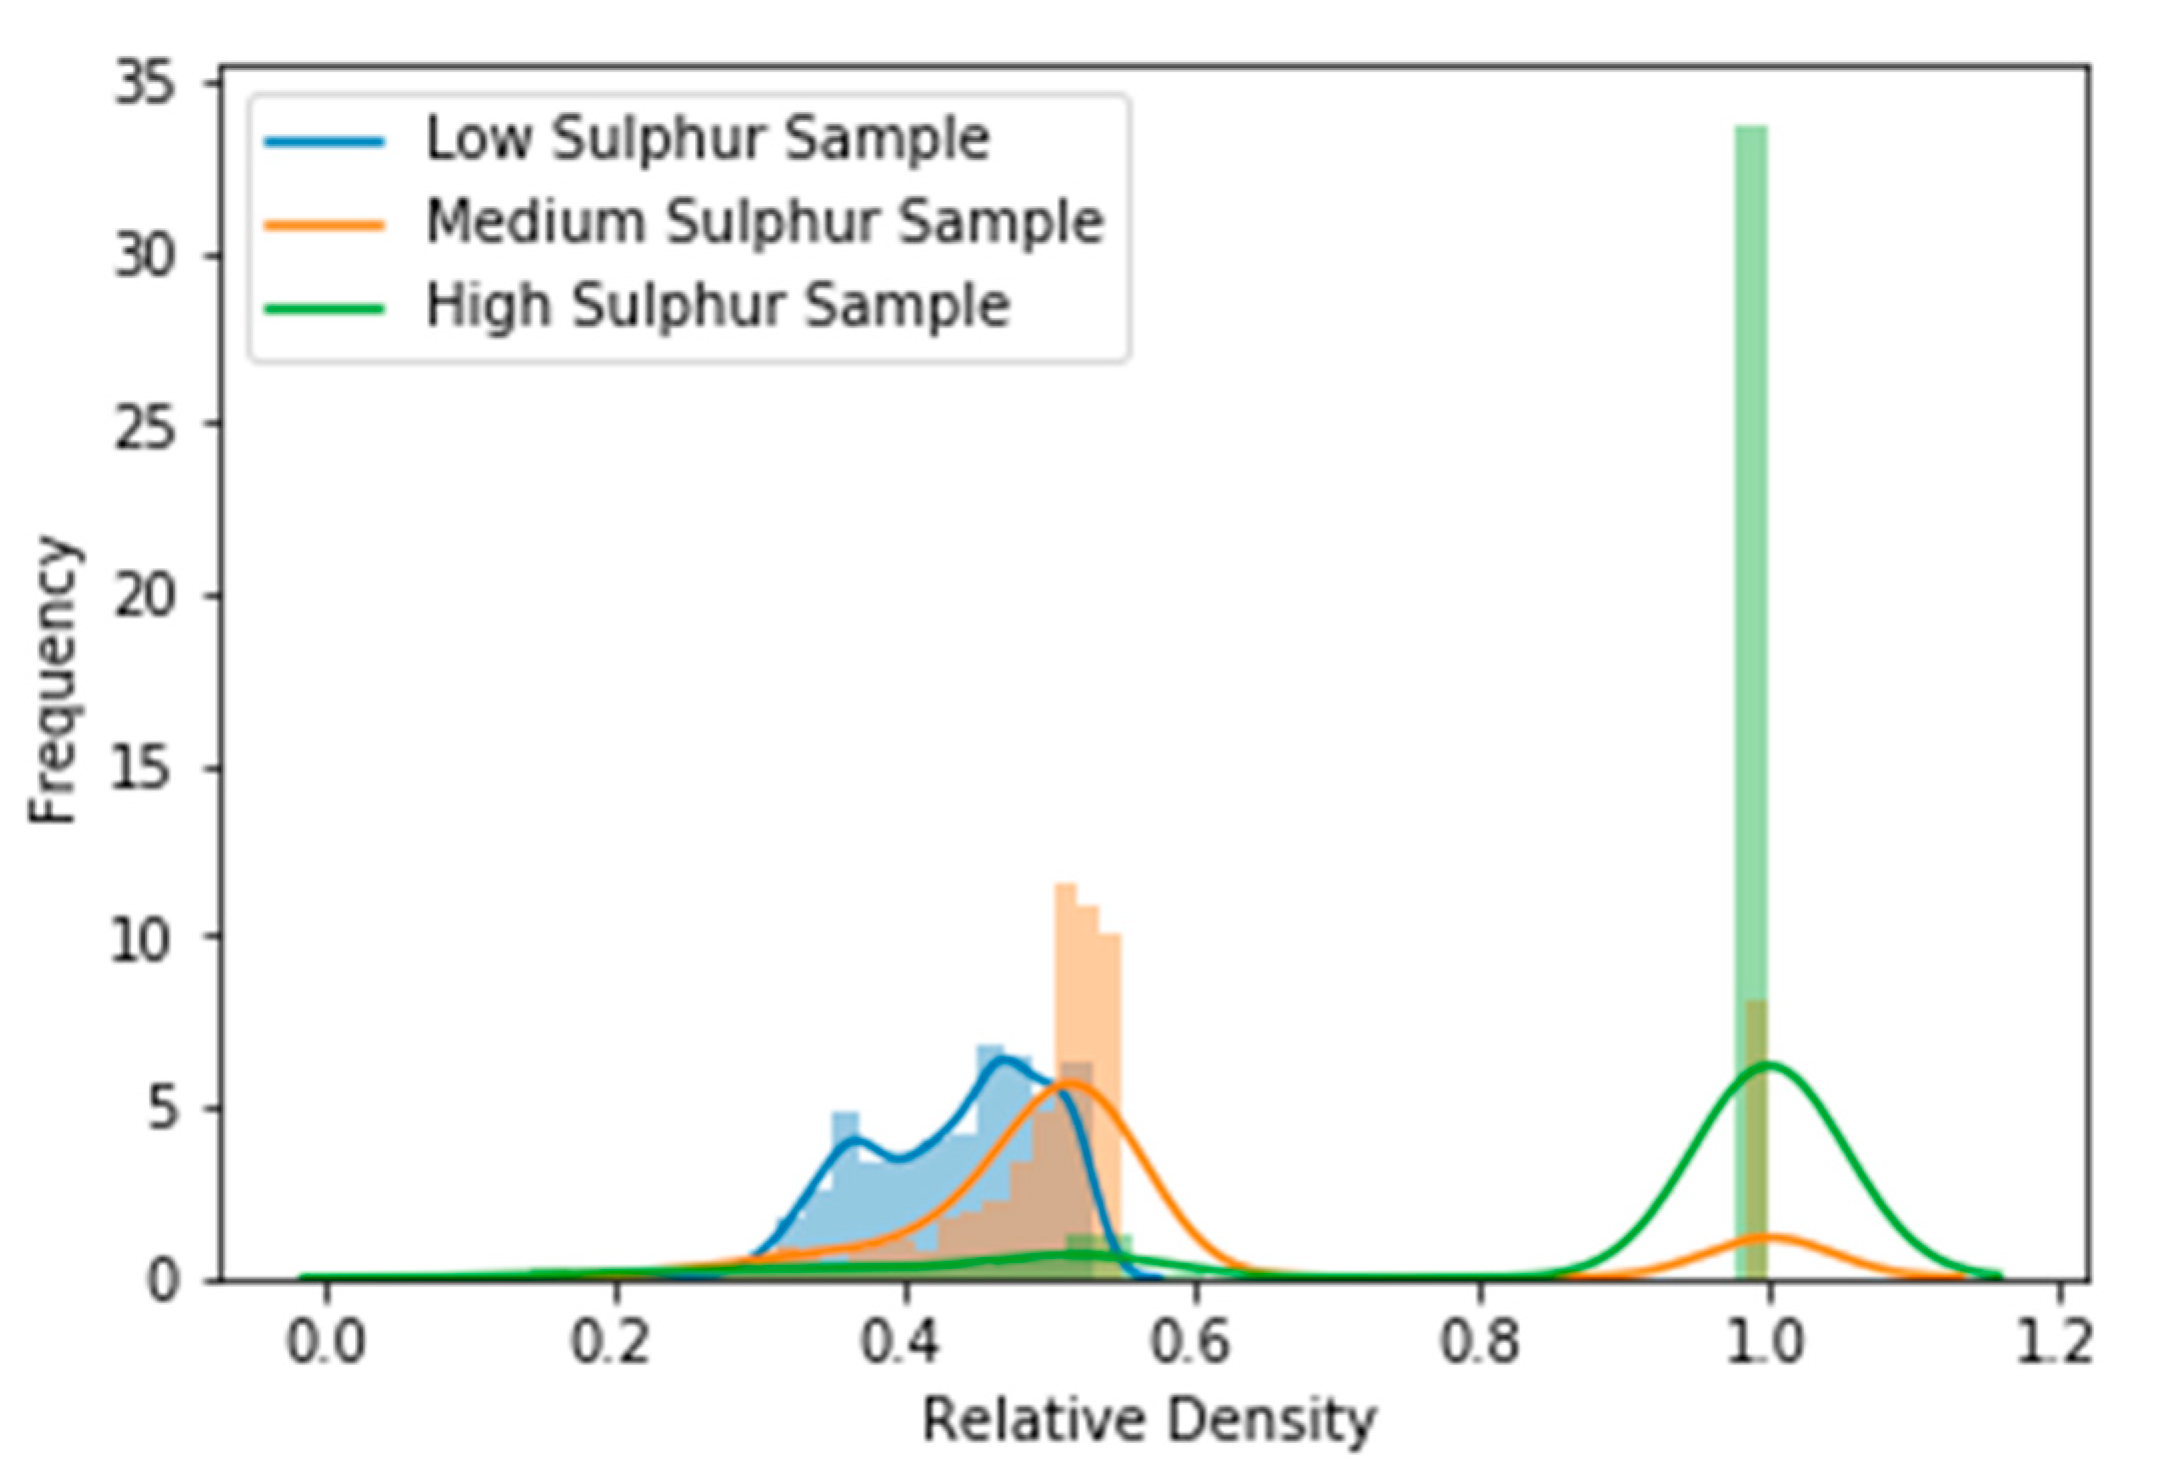
It is easy to distinguish the high sulphur samples from the low sulphur samples based on the relative XRT density distribution as illustrated in Figure 6. This suggests that taking an average value of the relative density of an entire sample can be effective in separating the sulphide from the non-sulphide rocks.
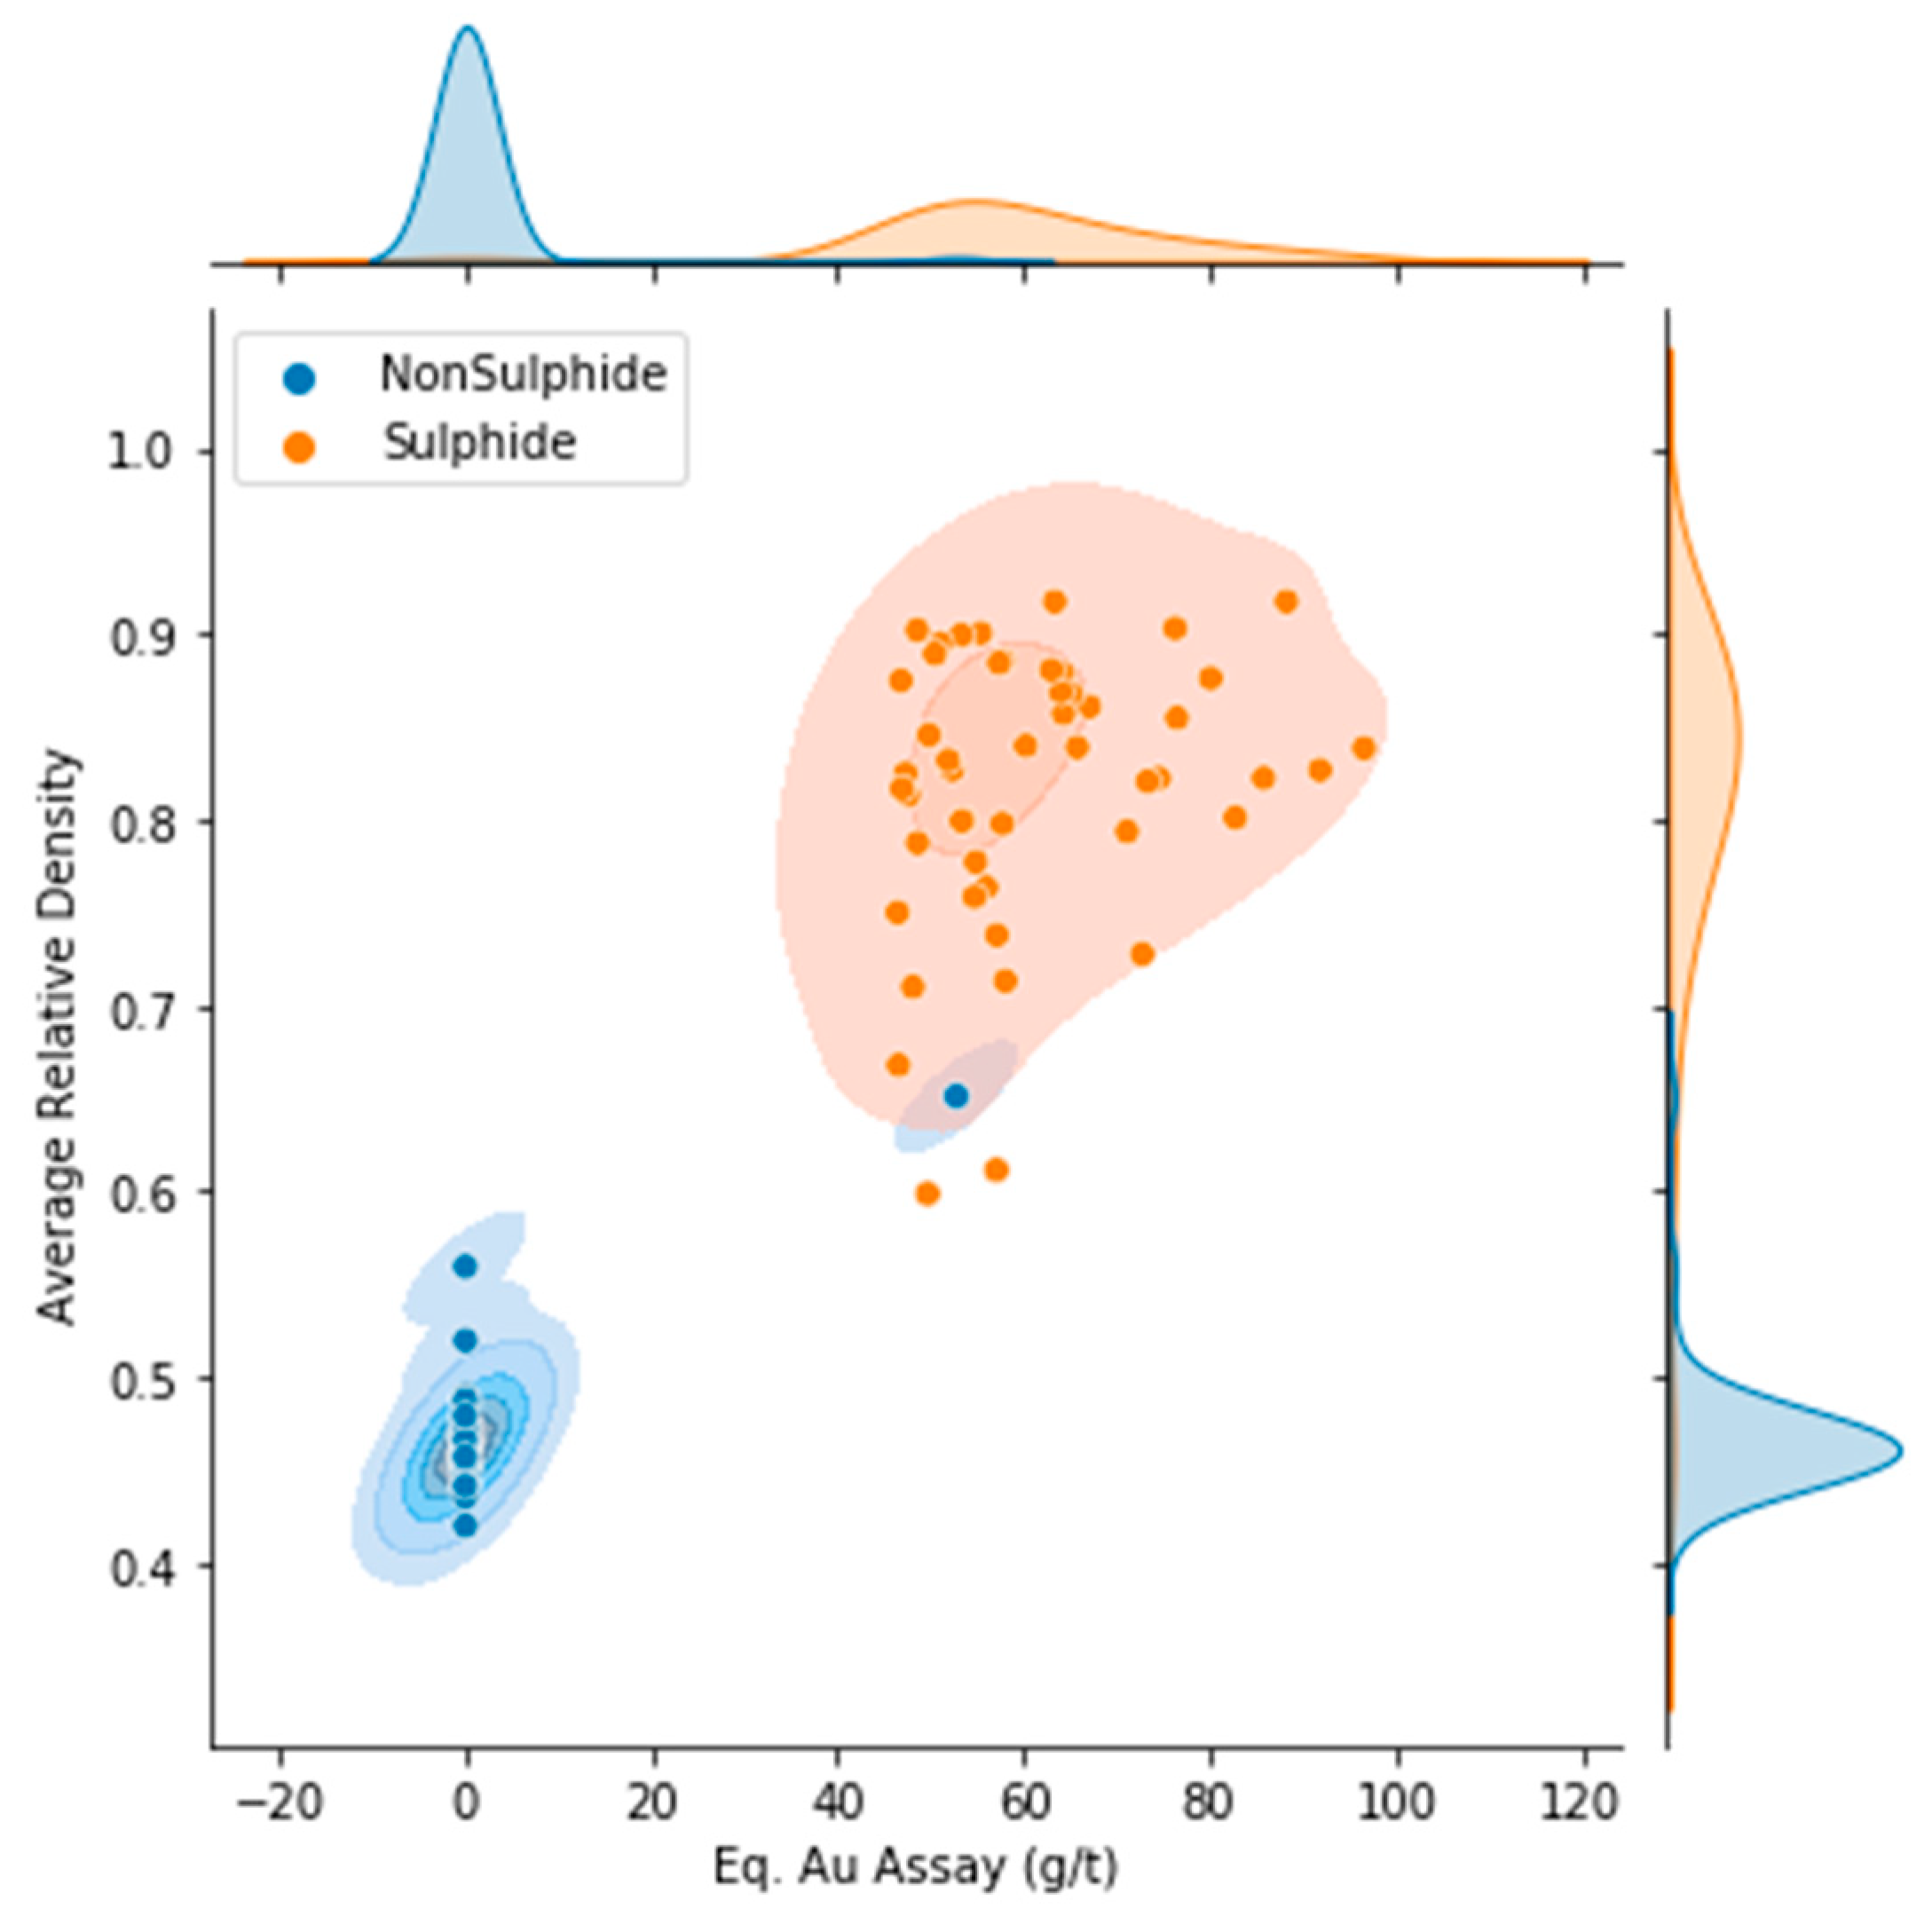
Figure 7 illustrates the top and bottom 10% of the samples based on equivalent gold grade. It is apparent that below 0.6 relative density, samples have significantly lower grade value. Also, there are two very distinct clusters of points that are distinguished by the rock type.
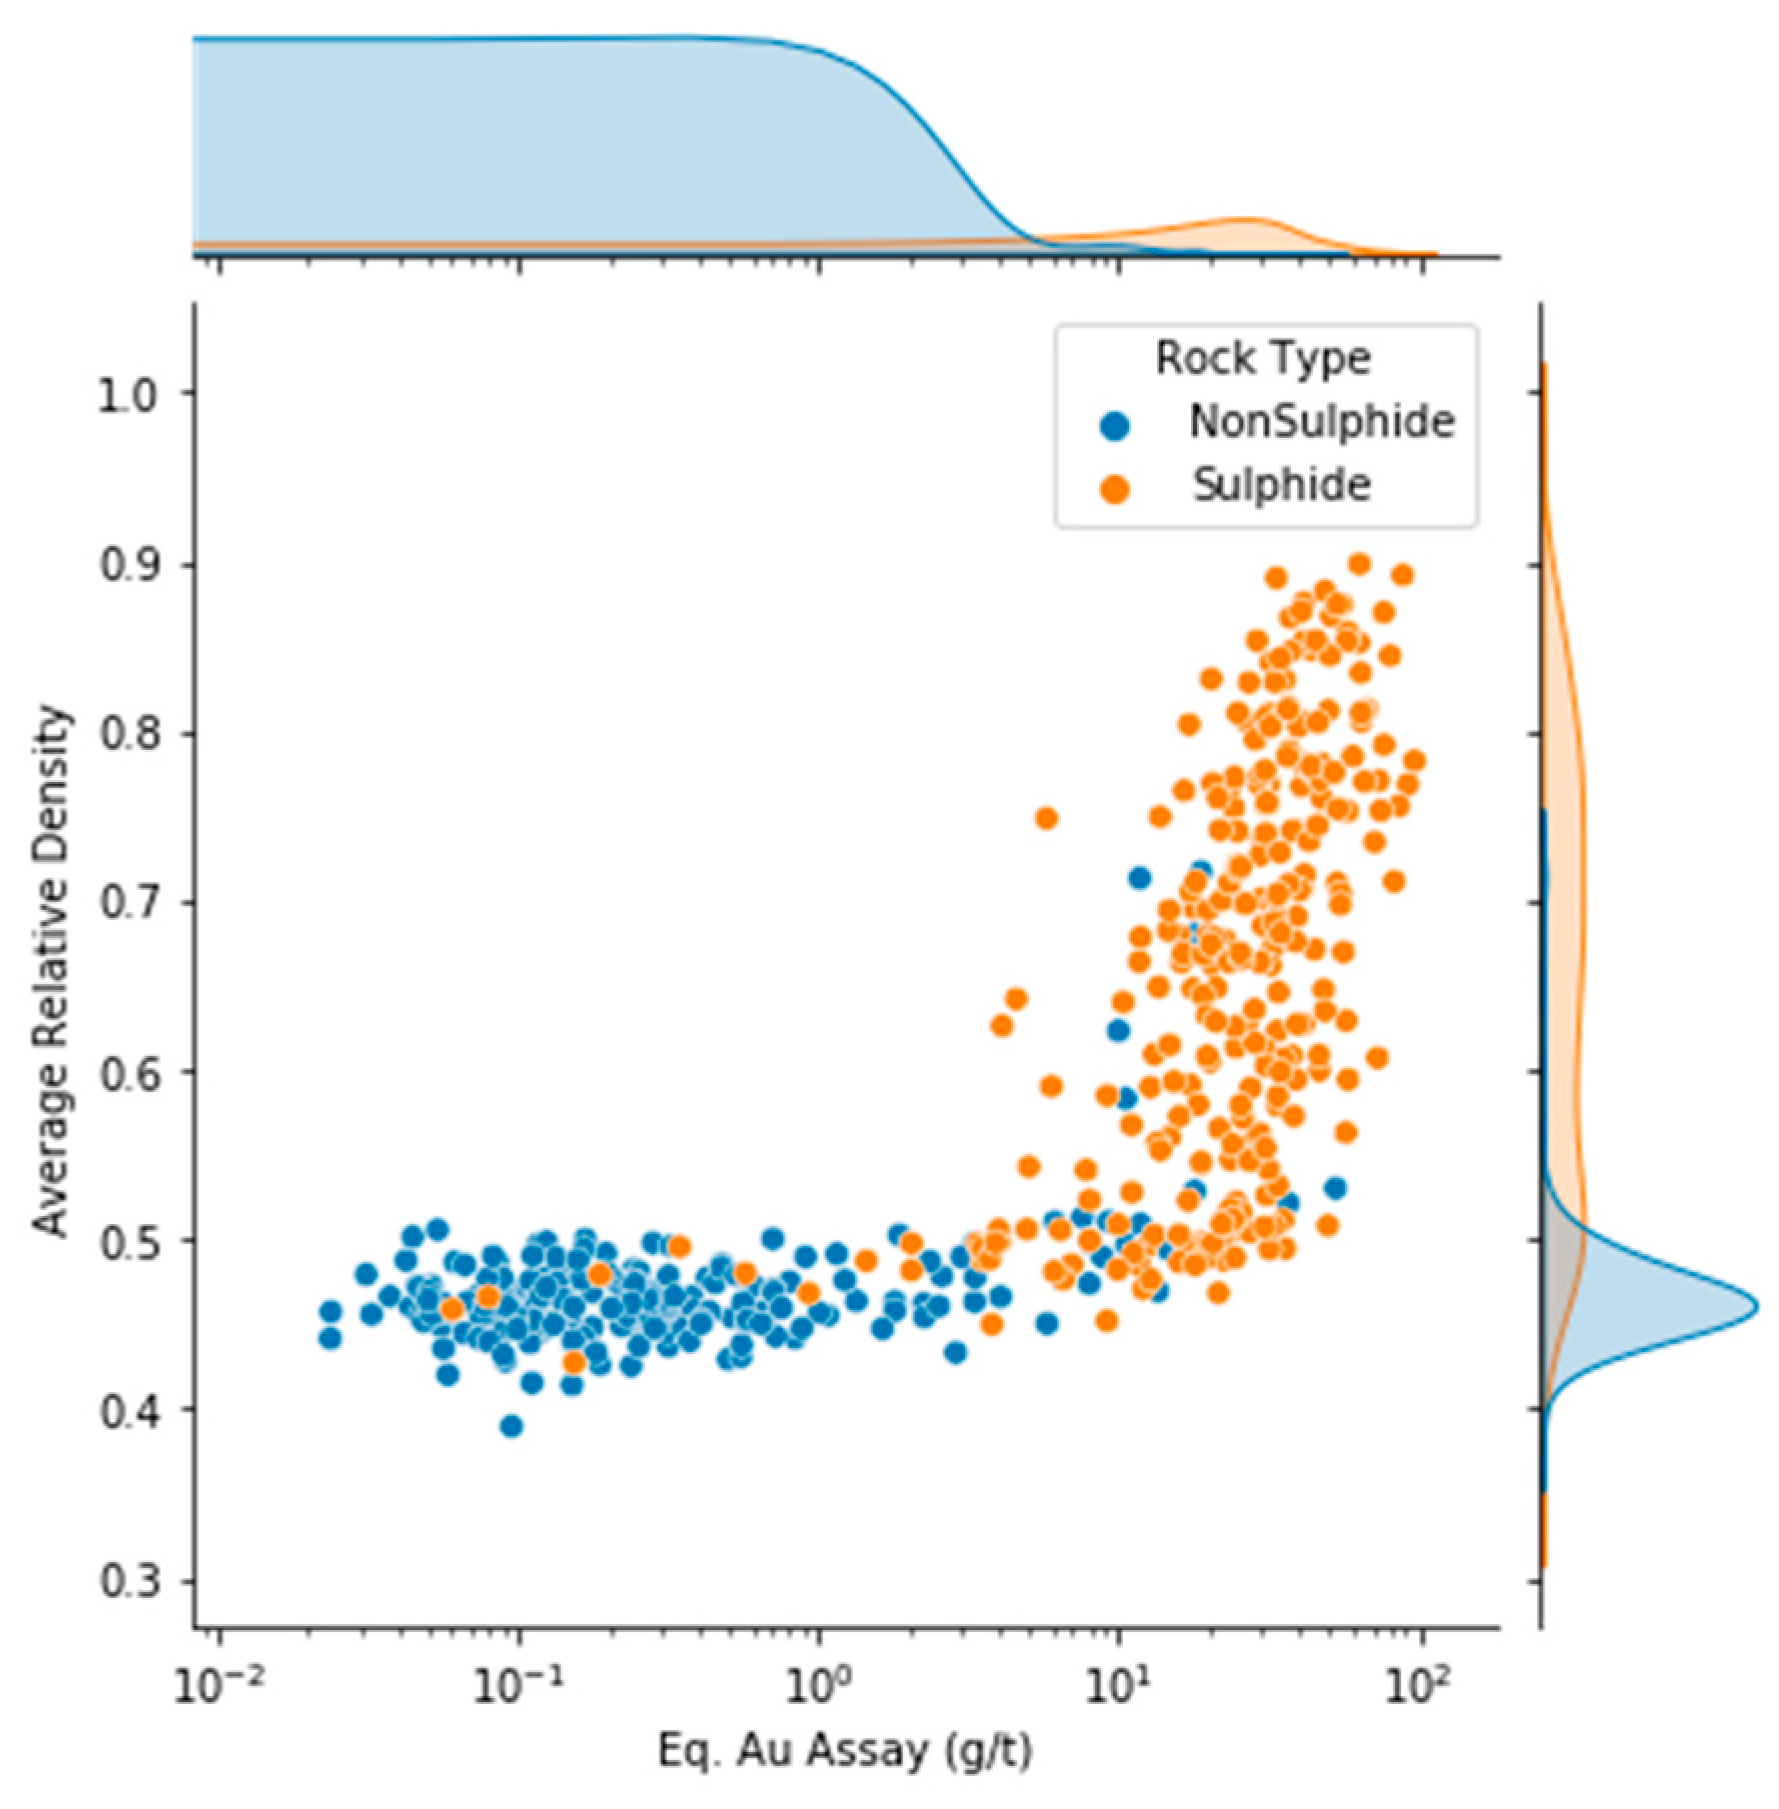
Figure 8 plots all samples where similar characteristics can be observed, as illustrated in Figure 7. The distribution of the y-axis shown on the right side of the graph demonstrates the potential for removing more than 90% of the non-sulphide material below a 0.6 average relative density. However, when using the logarithmic scale to visualize the trends (Figure 8) when the relative density is below 0.6, there is no correlation between relative density and equivalent Au. This makes grade prediction difficult by using XRT. The tentative range of grades can be estimated from the scatter plot of equivalent gold assay average as shown in Figure 7, but this is not accurate enough for proper grades prediction.
3.2. Sortability Analysis
To assess the sortability, the average relative density value for each rock is put in order from the highest value to the lowest value. The metal recovery can then be calculated at a given mass yield. The mass is assumed to be equal for all particles in this analysis.
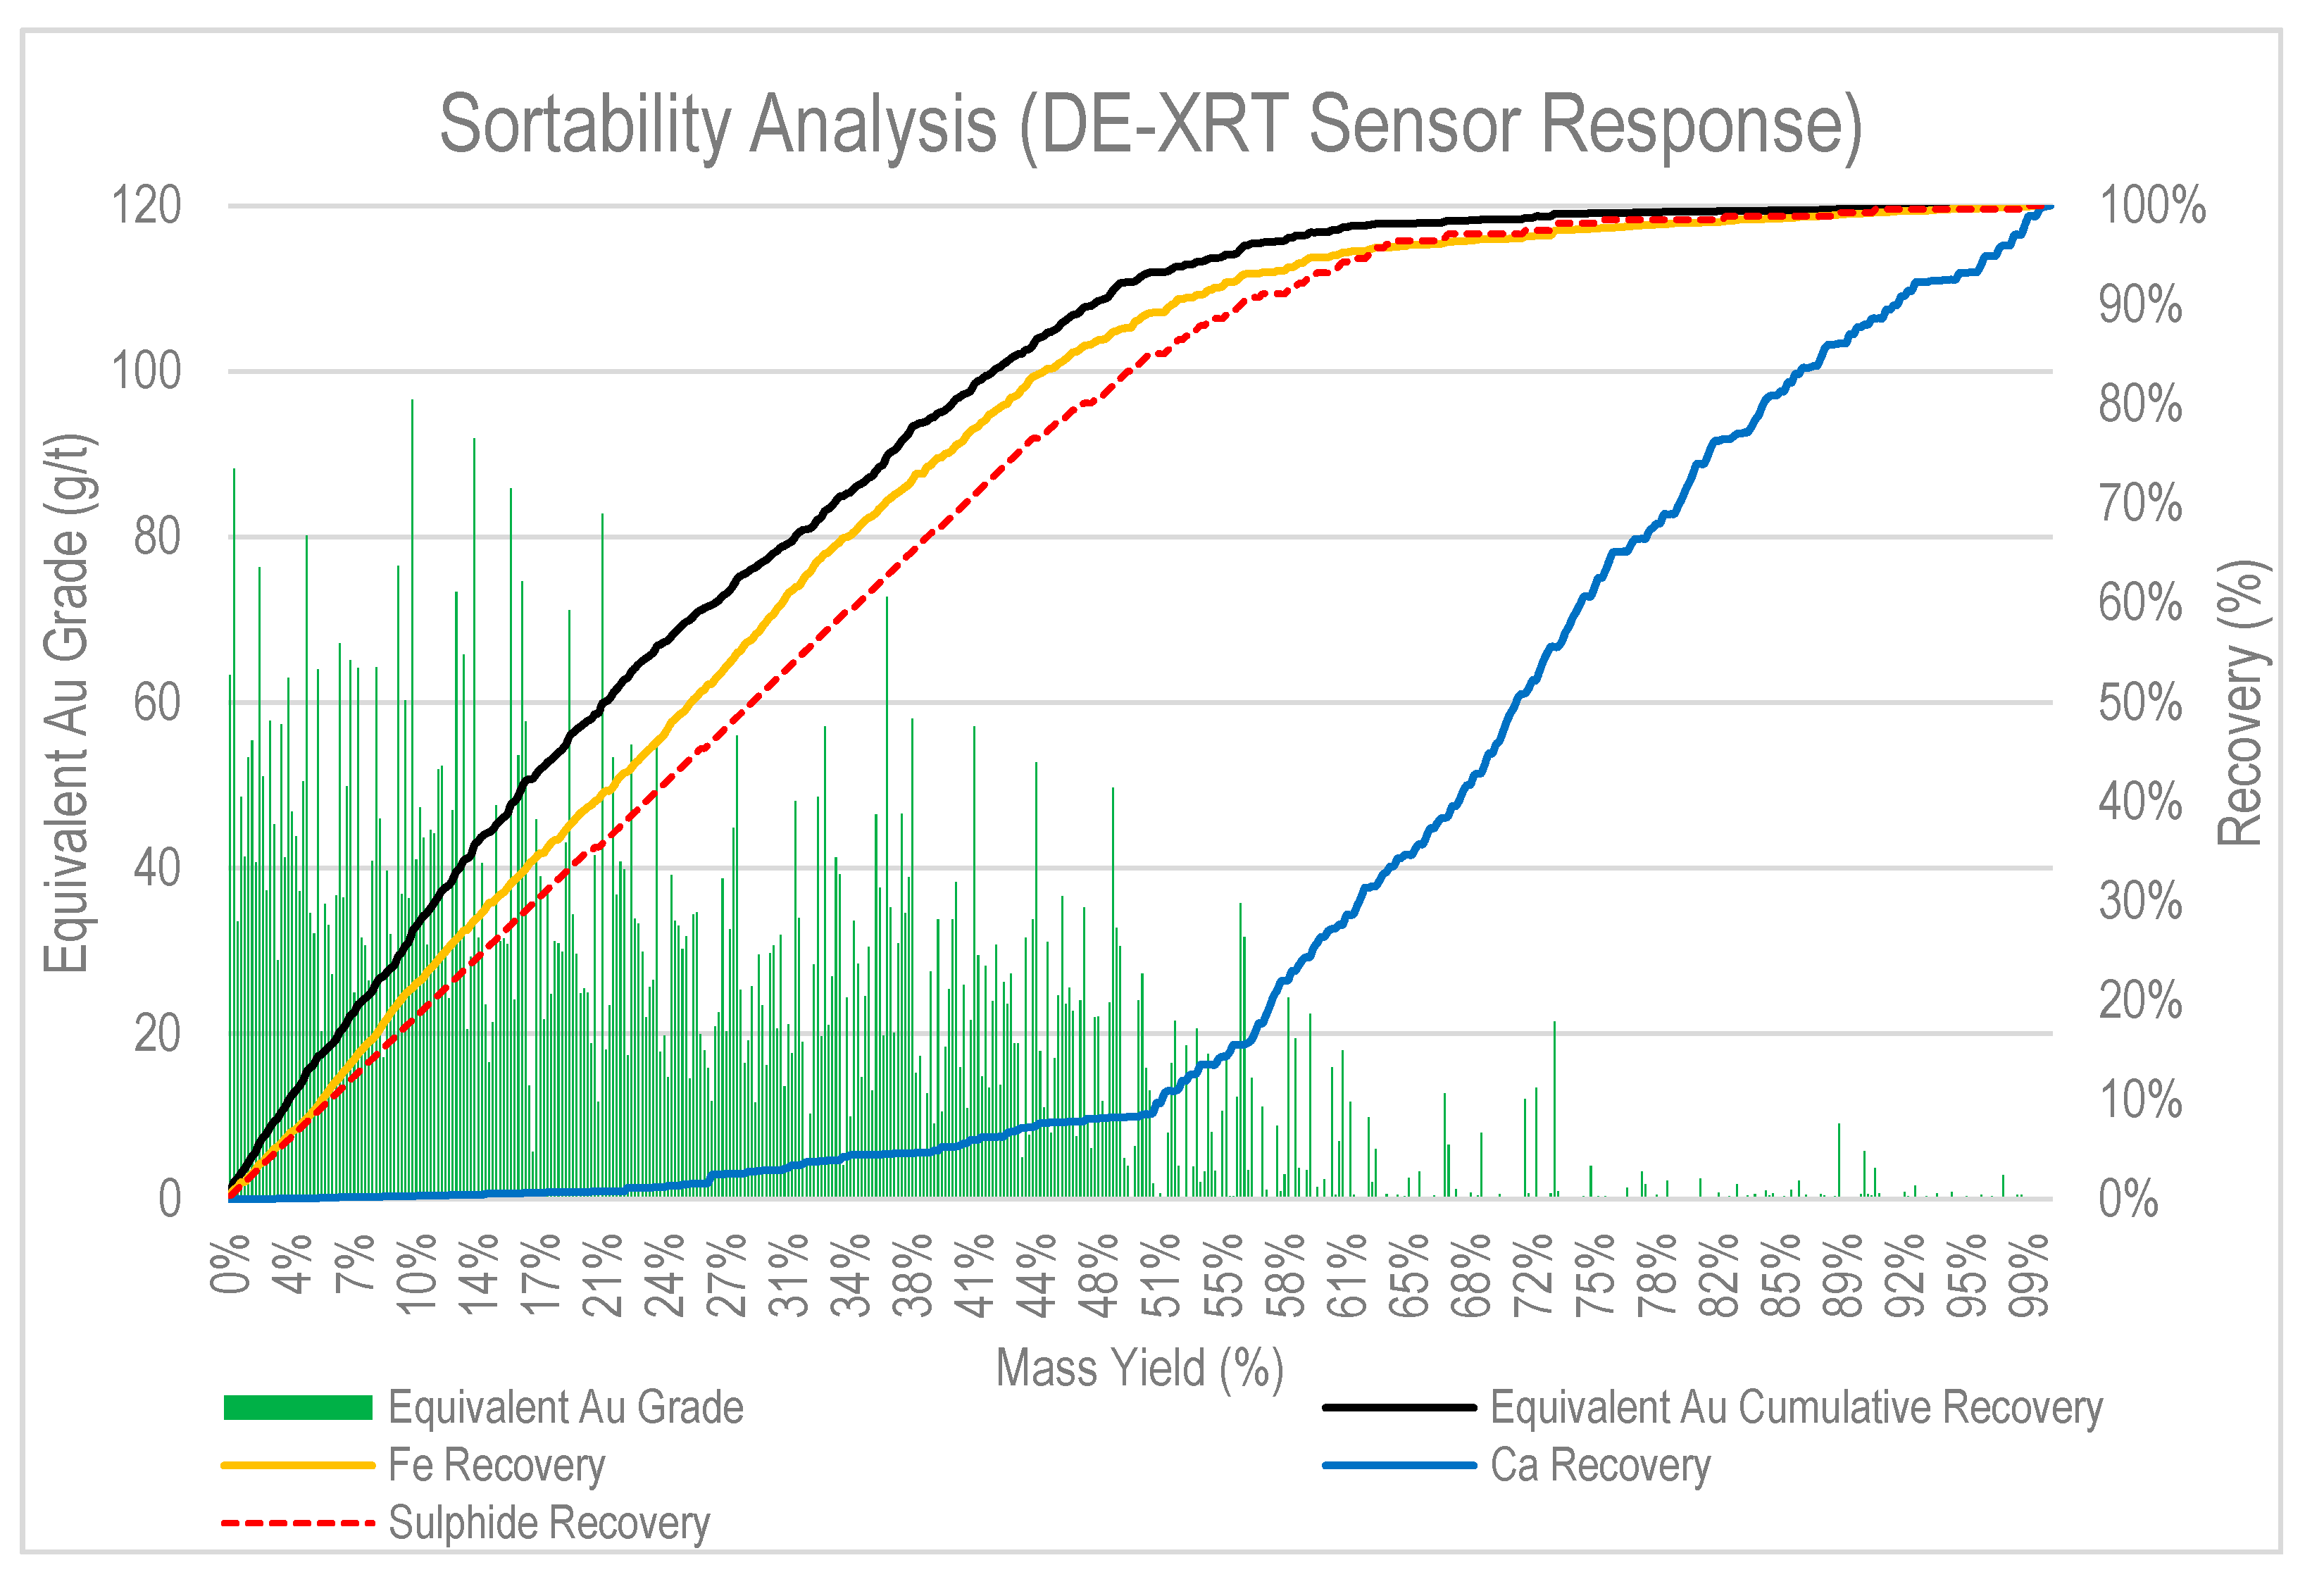
To plot a sortability curve derived from DE-XRT, each specimen is ranked by the lowest average relative density and the highest relative density. Then, the recovery curve is generated using the modelled metal grade of each rock specimen, as illustrated in Figure 8. The line graphs represent the cumulative mass yield and cumulative metal recovery (y-axis on the right side), while the bar graph represents the individual equivalent gold grade based on the descending order of average relative density for each particle.
As shown in Figure 9, 90% of sulphides can be recovered in approximately 55% of the mass. Furthermore, more than 95% of equivalent gold can be recovered in the same amount of mass. It is also important to note that at a 55% mass yield, the rate of calcium recovery almost doubles. This concludes that more carbonates are starting to be recovered when the 55% mass of rocks is being collected into the concentrate.
4. Conclusions
In this study, the effectiveness of DE-XRT in characterizing material type for sensor-based sorting was explored. The new to mineral processing approach of a dual-material decomposition method was used to the DE-XRT image analysis.
For the studied ore, it was shown that DE-XRT sorting technology can recover 90% of the sulphides with a 55% mass yield. Although the DE-XRT was unable to accurately predict the grade of the rock based on the average relative density of the sample, it was able to separate sulphides from non-sulphides effectively. There is potential for applying regression methods for the sulphide rocks since there is a linear correlation between equivalent gold assay and average relative atomic density above 0.6, shown in Figure 7.
In this work, the dual-material decomposition method using linear components has been discussed, where the individual pixel’s relative density is averaged for the entire sample. However, rather than averaging all the pixels within each sample, clustering methods can evaluate for nuggety mineralization. The clustering method can identify a cluster of pixels that share similar characteristics. For example, a quartz vein hosts a gold deposit where the amount of quartz vein in the sample can indicate the concentration of gold. An example of characterization criteria is that if more than fifty pixels of the nearest neighbour have a relative density value greater than 100, the sample can be characterized as an ore specimen. Furthermore, machine learning applications such as supervised learning can be used to train the classification of rock types based on a much larger set of samples.
In summary, the DE-XRT is an effective sensor that can be used to differentiate sulphides from waste. The dual-material decomposition method made it possible to use the characteristics of the sulphide materials and the non-sulphide materials to determine the composition of the sulphide.
Author Contributions
Conceptualization, Y.Z. and N.Y.; methodology, Y.Z.; software, Y.Z. and N.Y.; validation, Y.Z. and M.E.H.; formal analysis, Y.Z.; investigation, Y.Z.; resources, Y.Z.; data curation, Y.Z.; writing—original draft preparation, Y.Z.; writing—review and editing, Y.Z., N.Y. and M.E.H.; visualization, Y.Z. and N.Y.; supervision, M.E.H.; project administration, Y.Z.; funding acquisition, Y.Z. and M.E.H. All authors have read and agreed to the published version of the manuscript.
Funding
Sacré-Davey Engineering inc funded this research through the Mitacs Accelerate program.
Data Availability Statement
All data used in this article are from experiments conducted by the author. The name of the operations where the samples are collected are not disclosed.
Acknowledgments
From maintenance of the machine used for the experiments to lab supports, the Mining and Mineral Processing Engineering department has been very helpful throughout all experiments conducted for this paper.
Conflicts of Interest
The authors declare no conflict of interest.
References
- Jones., M.J. Tenth International Mineral Processing Congress, 1973: Proceedings of the Tenth International Mineral Processing Congress, Organized by the Institution of Mining and Metallurgy and Held in London in April, 1973; Institution of Mining and Metallurgy (Great Britain): London, UK, 1974. [Google Scholar]
- von Ketelhodt, L. Dual energy X-ray transmission sorting of coal. J. S. Afr. Inst. Min. Metall. 2010, 110, 371–378. [Google Scholar]
- Tong, Y. Technical Amenability Study of Laboratory-Scale Sensor-Based ore Sorting on a Mississippi Valley Type Lead-Zinc ore (T). Ph.D. Thesis, University of British Columbia, Vancouver, BC, Canada, November 2012. [Google Scholar]
- Bergmann, J.M. Latest developments and experiences in the beneficiation of coal using TOMRA X-ray transmission sorting machines. In Proceedings of the XIX International Coal Preparation Congress 2019, New Delhi, India, 13–15 November 2019; pp. 92–100. [Google Scholar]
- Lessard, J.; de Bakker, J.; McHugh, L. Development of ore sorting and its impact on mineral processing economics. Miner. Eng. 2014, 65, 88–97. [Google Scholar] [CrossRef]
- Zhang, G.; Chen, Z.; Zhang, L.; Cheng, J. Exact Reconstruction for Dual Energy Computed Tomography Using an H-L Curve Method. In Proceedings of the IEEE Nuclear Science Symposium Conference 2006, San Diego, CA, USA, 29 October–4 November 2006. [Google Scholar]
- Kolacz, J. Advanced sorting technologies and its potential in mineral processing 2012. AGH J. Min. Geoengin. 2012, 36, 39–48. [Google Scholar]
- Triche, B.L.; Nelson, J.T., Jr.; McGill, N.S.; Porter, K.K.; Sanyal, R.; Tessler, F.N.; McConathy, J.E.; Gauntt, D.M.; Yester, M.V.; Singh, S.P. Recognizing and Minimizing Artifacts at CT, MRI, US, and Molecular Imaging. RadioGraphics 2019, 39, 1017–1018. [Google Scholar] [CrossRef] [PubMed]
- Rebuffel, V.; Dinten, J.M. Dual-Energy X-Ray Imaging: Benefits and Limits. In Proceedings of the ECNDT 2006, Berlin, Germany, 25–29 September 2016. [Google Scholar]
Figure 1.
Non-sulphides (left) and sulphides (right).

Figure 2.
COMEX’s MSX-400-VL-XR System in UBC’s Coal and Mineral Processing Laboratory.

Figure 3.
The material decomposition method using vector addition [9].
Figure 3.
The material decomposition method using vector addition [9].

Figure 4.
Histogram of six different assays based on rock type.

Figure 5.
Scatter plot of equivalent gold assay versus ICP sulphur grade. Eq. Au—Equivalent Gold.

Figure 6.
Histogram of relative XRT-generated density for high, medium and low sulphur samples.

Figure 7.
Scatter plot of equivalent gold assay versus average relative density.

Figure 8.
Scatter plot of equivalent gold assay versus average relative density-logarithmic scale.

Figure 9.
Scatter plot of equivalent gold assay versus average relative density.


Table 1.
Comparison of three different specimens with low, medium, and high sulphur content.
| Sample Number | 260 | 493 | 459 |
|---|---|---|---|
| Images |  |  |  |
| Au Assay (g/t) | 0.34 | 6.93 | 41.19 |
| Ag Assay (g/t) | 0.50 | 40.00 | 347.00 |
| Pb Assay (%) | 0.12 | 1.32 | 10.01 |
| Zn Assay (%) | 0.22 | 3.68 | 6.05 |
| Eq. Au Assay (g/t) | 0.55 | 10.62 | 55.39 |
| As ICP (%) | 0.21 | 7.92 | 10.00 |
| Ca ICP (%) | 27.09 | 8.87 | 0.09 |
| Fe ICP (%) | 0.72 | 7.37 | 23.86 |
| Mg ICP (%) | 1.65 | 4.54 | 0.03 |
| Mn ICP (%) | 2.25 | 1.40 | 0.10 |
| S ICP (%) | 0.53 | 4.60 | 10.00 |
| Average Relative Density | 0.52 | 0.54 | 0.91 |
Publisher’s Note: MDPI stays neutral with regard to jurisdictional claims in published maps and institutional affiliations. |
© 2021 by the authors. Licensee MDPI, Basel, Switzerland. This article is an open access article distributed under the terms and conditions of the Creative Commons Attribution (CC BY) license (https://creativecommons.org/licenses/by/4.0/).
Share and Cite
MDPI and ACS Style
Zhang, Y.; Yoon, N.; Holuszko, M.E. Assessment of Sortability Using a Dual-Energy X-ray Transmission System for Studied Sulphide Ore. Minerals 2021, 11, 490. https://doi.org/10.3390/min11050490
AMA Style
Zhang Y, Yoon N, Holuszko ME. Assessment of Sortability Using a Dual-Energy X-ray Transmission System for Studied Sulphide Ore. Minerals. 2021; 11(5):490. https://doi.org/10.3390/min11050490
Chicago/Turabian StyleZhang, YiRan, Nawoong Yoon, and Maria E. Holuszko. 2021. "Assessment of Sortability Using a Dual-Energy X-ray Transmission System for Studied Sulphide Ore" Minerals 11, no. 5: 490. https://doi.org/10.3390/min11050490
Note that from the first issue of 2016, this journal uses article numbers instead of page numbers. See further details here.