
Lateral Deflection Behavior of Perforated Steel Plates: Experimental and Numerical Approaches

1
Hydrogen Ship Technology Center, Pusan National University, Busan 36241, Korea
2
Department of Naval Architecture and Ocean Engineering, Pusan National University, Busan 46241, Korea
*
Author to whom correspondence should be addressed.
J. Mar. Sci. Eng. 2021, 9(5), 498; https://doi.org/10.3390/jmse9050498
Submission received: 15 March 2021
/
Revised: 25 April 2021
/
Accepted: 27 April 2021
/
Published: 4 May 2021
(This article belongs to the Section Ocean Engineering)
Abstract
:This study aimed to investigate the behavioral characteristics of the lateral deflection of a simply supported perforated steel plate subjected to axial compression. Investigating the lateral deflection of the perforated plate is of great significance because the buckling limit of structural members can be predicted not only by strength but also by displacement (or deflection). For this purpose, we conducted buckling experiments by considering various variables of the perforated plate, such as opening size, thickness, and aspect ratio. In addition, a series of elastoplastic large deflection analyses were performed using the commercial finite element analysis program, and the calculated results were compared along with the experimental results. Finally, practical curves, which can predict lateral deflection with an increase in axial displacement, and the occurrence point of ultimate strength are reported in this study. The results showed that there was a distinct difference in the behavior of lateral deflection between perforated plates with different opening ratios. The local buckling occurred mainly around the opening and was more dominant with an increase in the opening ratio. In addition, the ultimate strength of the perforated plate was determined at the end of the local buckling phase.
1. Introduction
Recently, perforated plates have been widely used as the main structural member for various purposes, such as reduction of structural weight and accessibility of people. Therefore, buckling design is gaining considerable importance in the structural design stages with the increase in usage of thin and high-tensile steel. However, it is inevitable to investigate the structural behavior and strength characteristics of the perforated plate because it is known that opening leads to a significant reduction in the ultimate strength. Consequently, several studies on perforated plates have been conducted through experimental and finite element analysis to predict the buckling and ultimate strength [1,2,3,4]. The numerical and buckling analyses of thin steel plates with centered perforations through various design method is reported. To determine the critical buckling load and the ultimate buckling load of the plates, research has employed numerical simulation. The results showed the direct influence of the perforation ratio Ho/Lo (with Ho being the width and Lo the length of the perforation) [5]. The axial buckling of perforated plates reinforced with strips and middle tubes has been reported. The results showed that the buckling load decreased with increasing the hole size. In addition, application of reinforcing strips increased strength of the buckling in plates with known radius of the hole [6]. The cutout strengthening of perforated plates subjected to uniaxial compression has been reported. The finite element method has been employed to analyze the buckling behavior of perforated plates. The results showed that the strengthened perforated plates had higher buckling strengths than those of the unstrengthened ones. In addition, the elevations in elastic buckling stress and elasto-plastic ultimate strength showed a significant relationship to stiffener types and plate geometric parameters [7].
When the plate is subjected to an axial compressive load, the rectangular plates buckle in the elastic range. However, such perforated plates continue to be in a stable state because the tensile membrane stress generated at the swollen part (near the loading edges) interrupts the additional deflection [8]. However, the lateral deflection of the plates increases continuously beyond the buckling strength. In particular, lateral deflection causes a large geometric change around the opening; this geometrical change accelerates the buckling phenomenon by causing damages such as tears and cracks at the minimum cross-section.
The deflection of the plate reflects the degree of risk of plate buckling; therefore, the observation of the lateral deflection behavior of plates can be an alternative to estimate the post-buckling behavior after the primary buckling of the plate. In addition, investigating the lateral deflection of the perforated plate is of great significance because the buckling limit of structural members can be predicted not only by strength, but also by displacement (or deflection).
Similar to the ultimate strength, the lateral deflection behavior of the perforated plates depends on a variety of factors, such as opening size, slenderness ratio, aspect ratio, loading condition, and boundary conditions [9,10]. However, most prior research had been focused on the ultimate strength of the plate rather than the lateral deflection of the plate. Moreover, there is little research on perforated steel plates, which are being adapted to ships and offshore structures. Thus, this study investigated the lateral deflection behavior of simply supported perforated plates subjected to axial compression on the basis of a buckling experiment. For this purpose, buckling experiments were conducted considering three parameters of the perforated plate (opening size, thickness, and aspect ratio). In addition, a series of elastoplastic large deflection analyses were performed to compare the experimental results and prove the effectiveness of the testing results. Furthermore, practical curves, which can predict lateral deflection with the increase in axial displacement, and the occurrence point of ultimate strength are suggested on the basis of the experimental results.
2. Materials and Methods
2.1. Test Specimen and Scenario
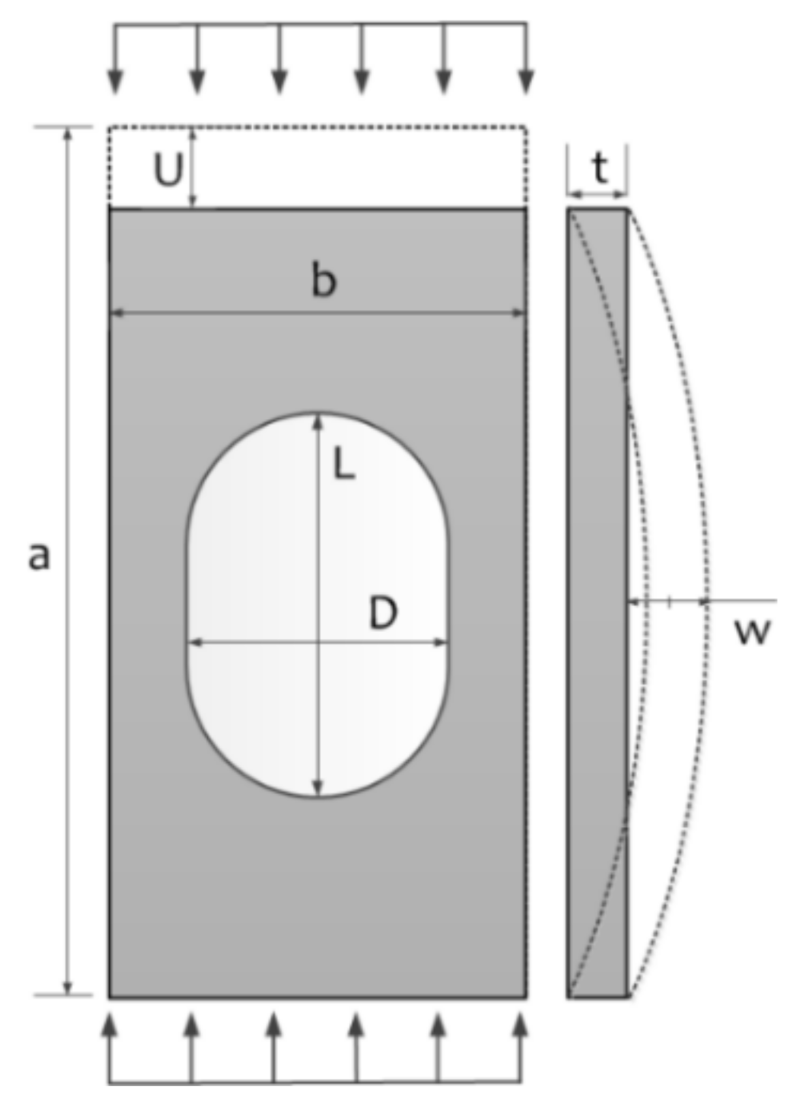
In this study, a perforated plate without stiffeners under axial compression was considered, as shown in Figure 1. The main dimensions of the perforated plate were length (a), breadth (b), thickness (t), opening in the plate length direction (L), opening in the plate breadth direction (D), axial displacement (U), and lateral deflection (w).
To investigate the lateral deflection characteristics of the perforated plates, we considered three variables—opening size (D/L), thickness (t), and aspect ratio (a/b)—on the basis of previous studies and actual shipment data [3,11,12,13]. From the previous reference data, the dimensions of the plates used in shipbuilding industries are in the following range: aspect ratio (1.00–6.55), slenderness ratio (1.42–3.83), breadth (800–975 mm), thickness (10–22 mm), opening size (400 mm × 600 mm, 500 mm × 700 mm, 600 mm × 800 mm), and opening ratio (0.44–0.83).
In this study, the breadth of perforated plates was fixed at 400 mm, and the other dimensions were adjusted on the basis of the corresponding breadth values. The average yield strength of the tested material, derived from the tensile test of the specimen (American Society for Testing and Materials (ASTM) standard A370, West Conshohocken, PA, USA), was 343 MPa. In addition, the chemical composition and specific scenario including plate dimensions are presented in Table 1 and Table 2, respectively [14]. As shown in the testing scenario, a series of buckling tests were performed on perforated plates. A total of 48 tests were performed, and the tests were repeated twice to determine reliability.
2.2. Experimental Apparatus
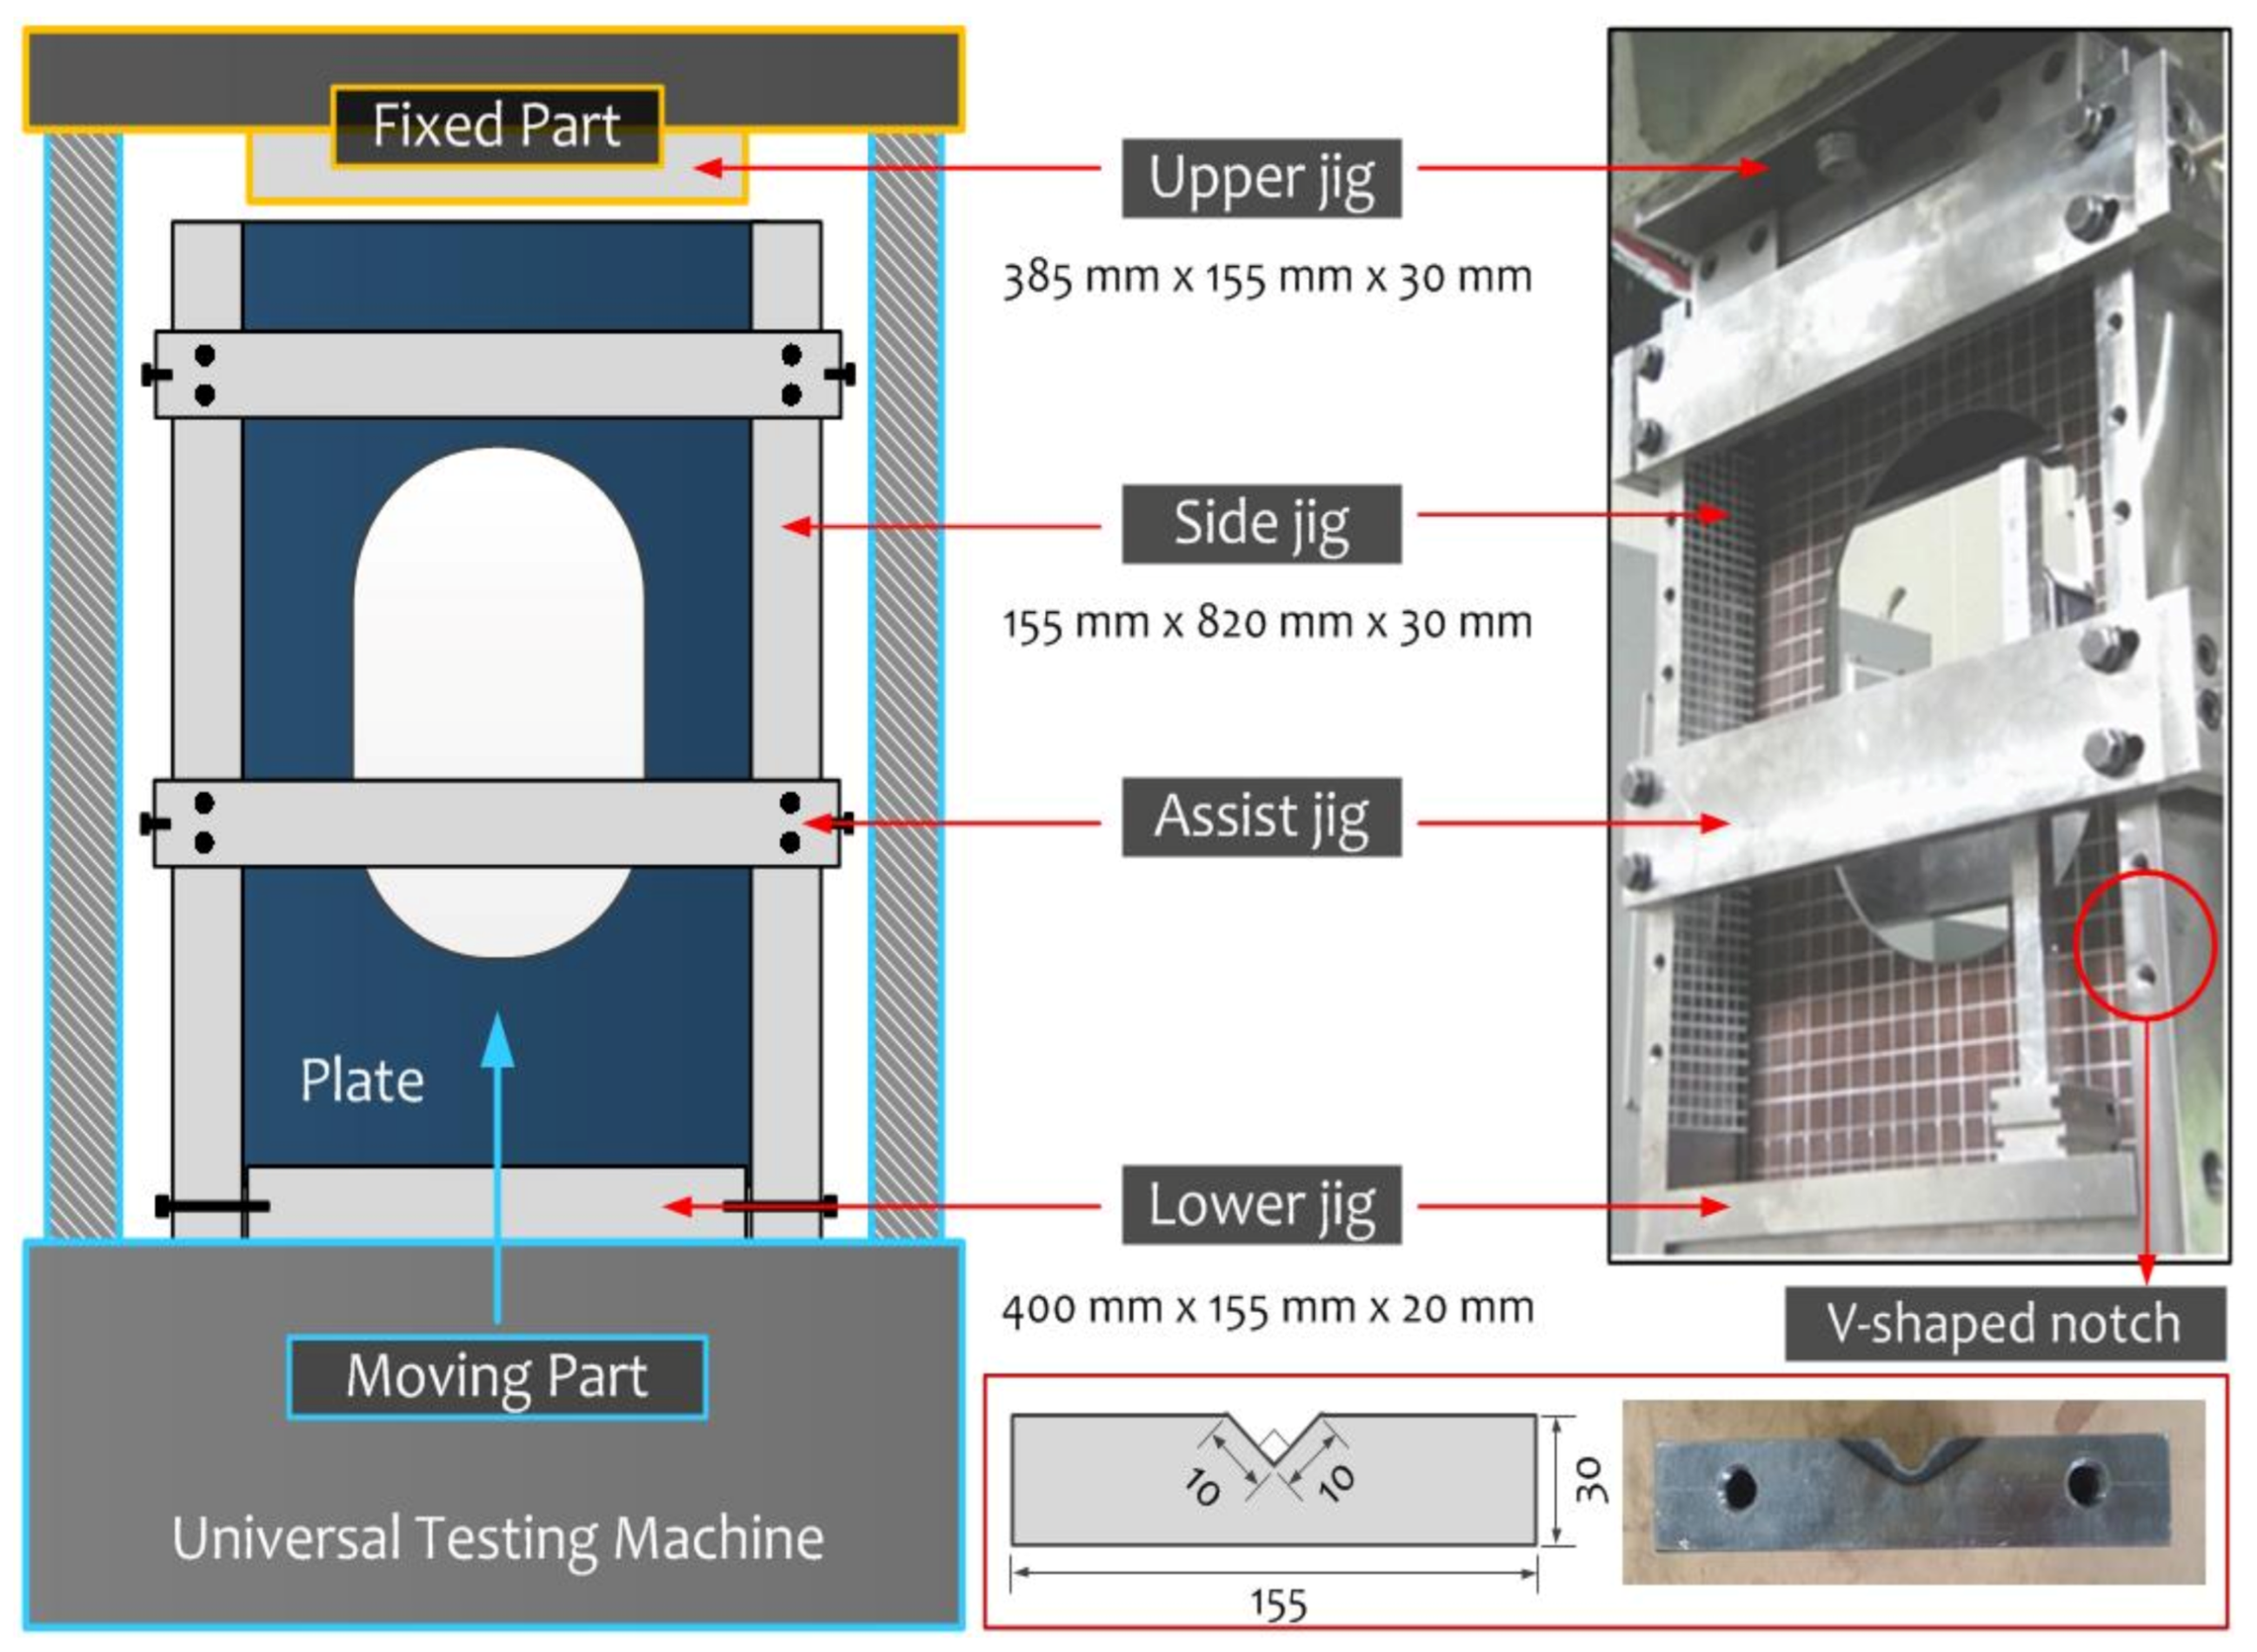
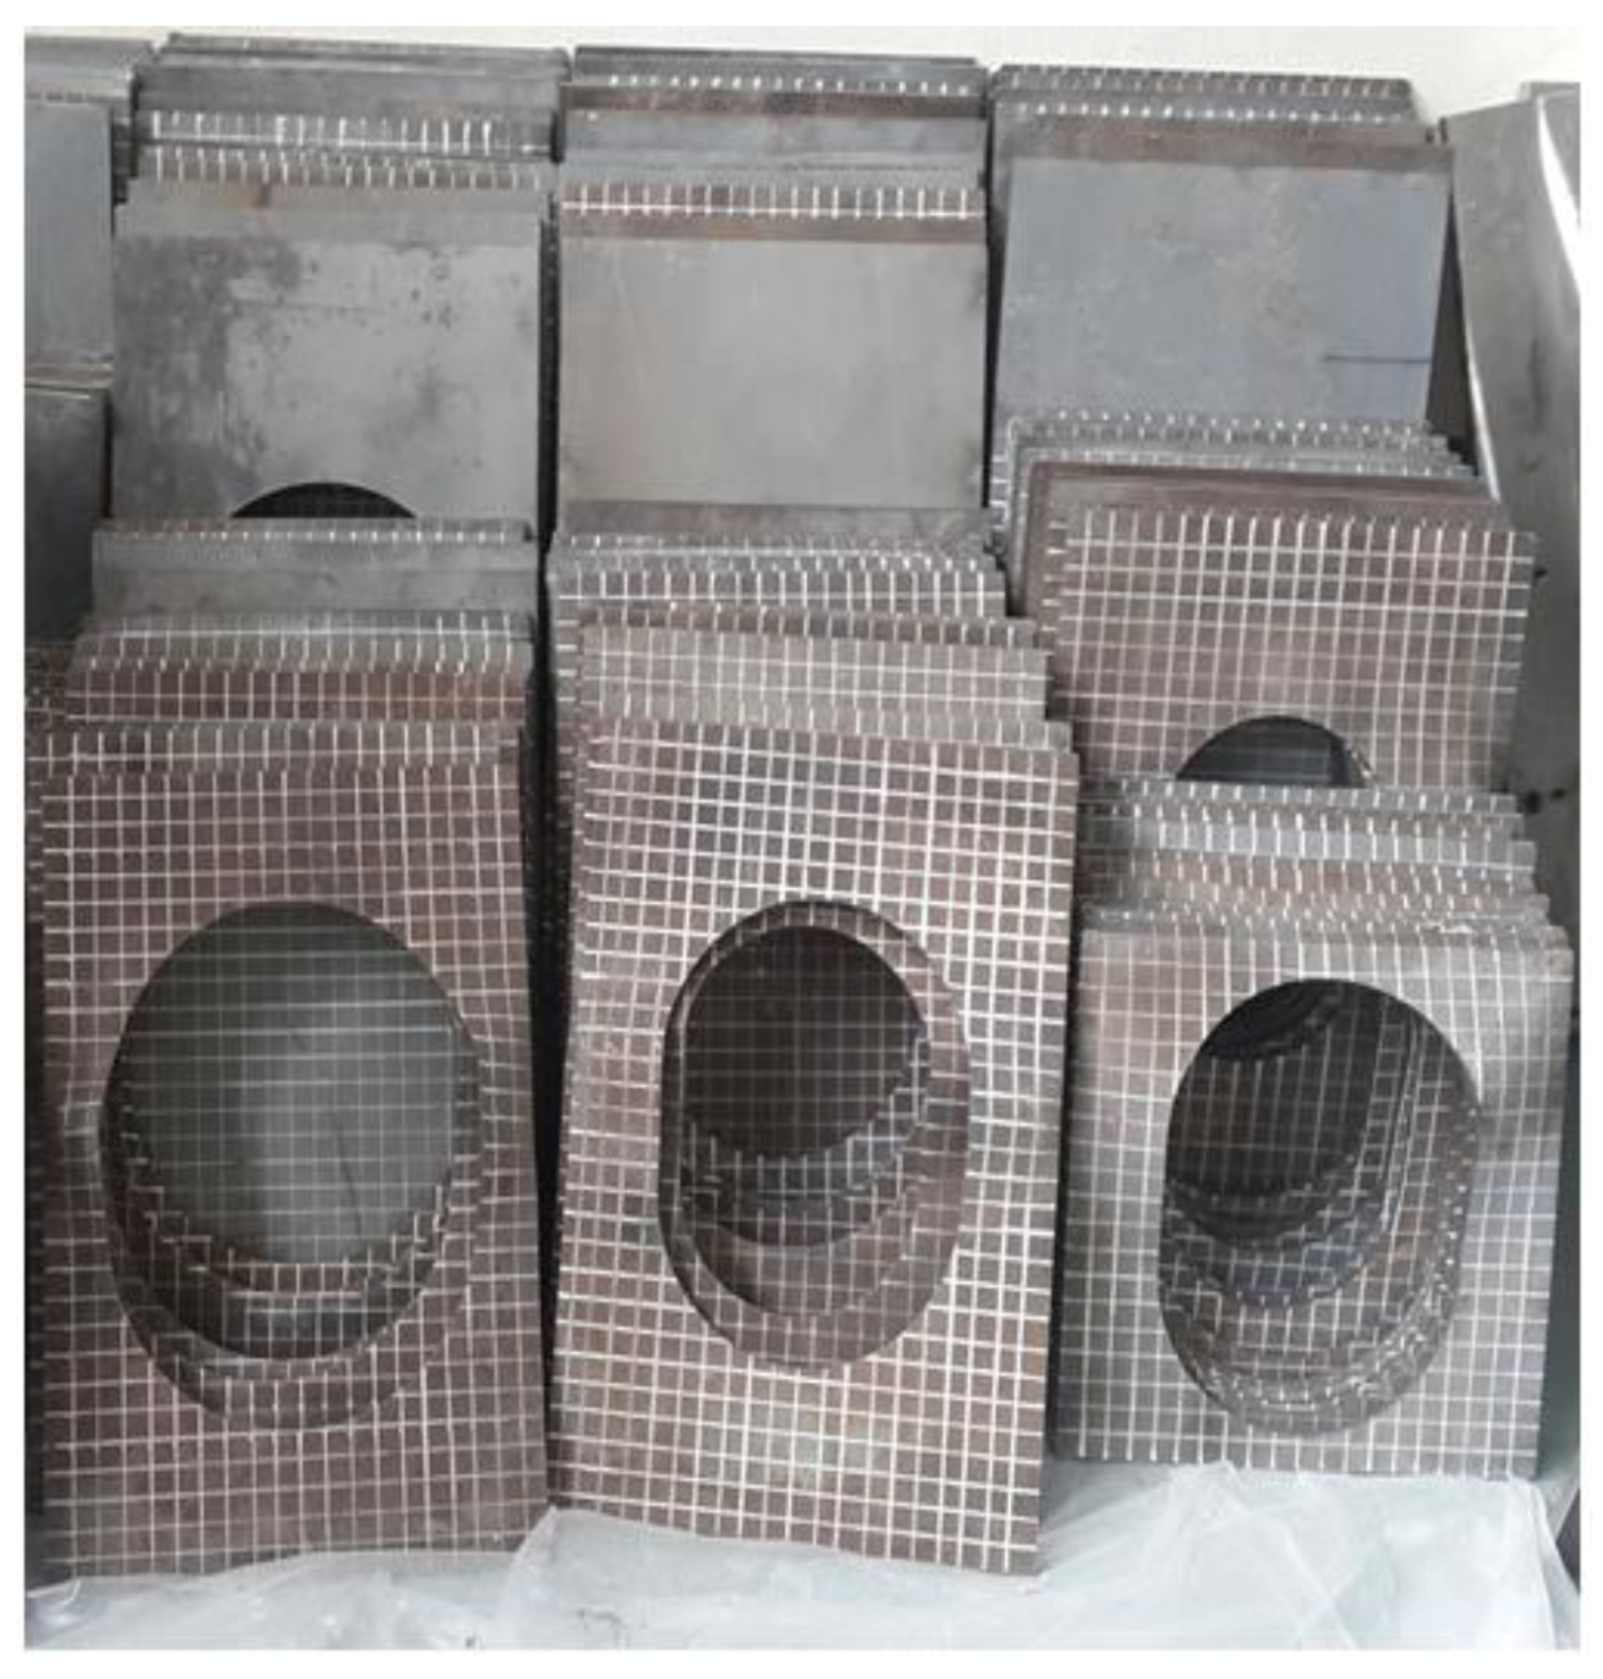
To perform a buckling experiment to investigate the lateral deflection behavior of the perforated plate, one should carry out reasonable idealization of the boundary condition of the plate. Generally, the four edges of the plate are supported by longitudinal, transverse, or other plates, which have relatively superior stiffness. Consequently, a simply supported boundary condition is more suitable for replicating the buckling behavior of the perforated plates than a clamped boundary condition. In addition, the buckling strength of simply supported plates is conservatively estimated in comparison with that of clamped plates [1]. In the present study, a simply supported boundary condition was considered throughout the experiment and finite element analysis, in terms of structural design, by adopting a safety factor. Figure 2 shows the experimental jigs with specific dimensions and the overall experimental setup. The longitudinal compression loading condition was implemented by fixing the side and lower jigs and moving only the upper jig. The assist jigs were installed at the top and middle of the jig to prevent the movement of side jigs while the specimen was subjected to a compression load. The side jigs were designed to be used to maintain straightness while the load was applied. To perform the test, we used a universal testing machine (UH 1000, SHIMADZU, Kyoto, Japan). The perforated plate specimens obtained after the buckling experiments are presented in Figure 3.
2.3. Finite Element Analysis
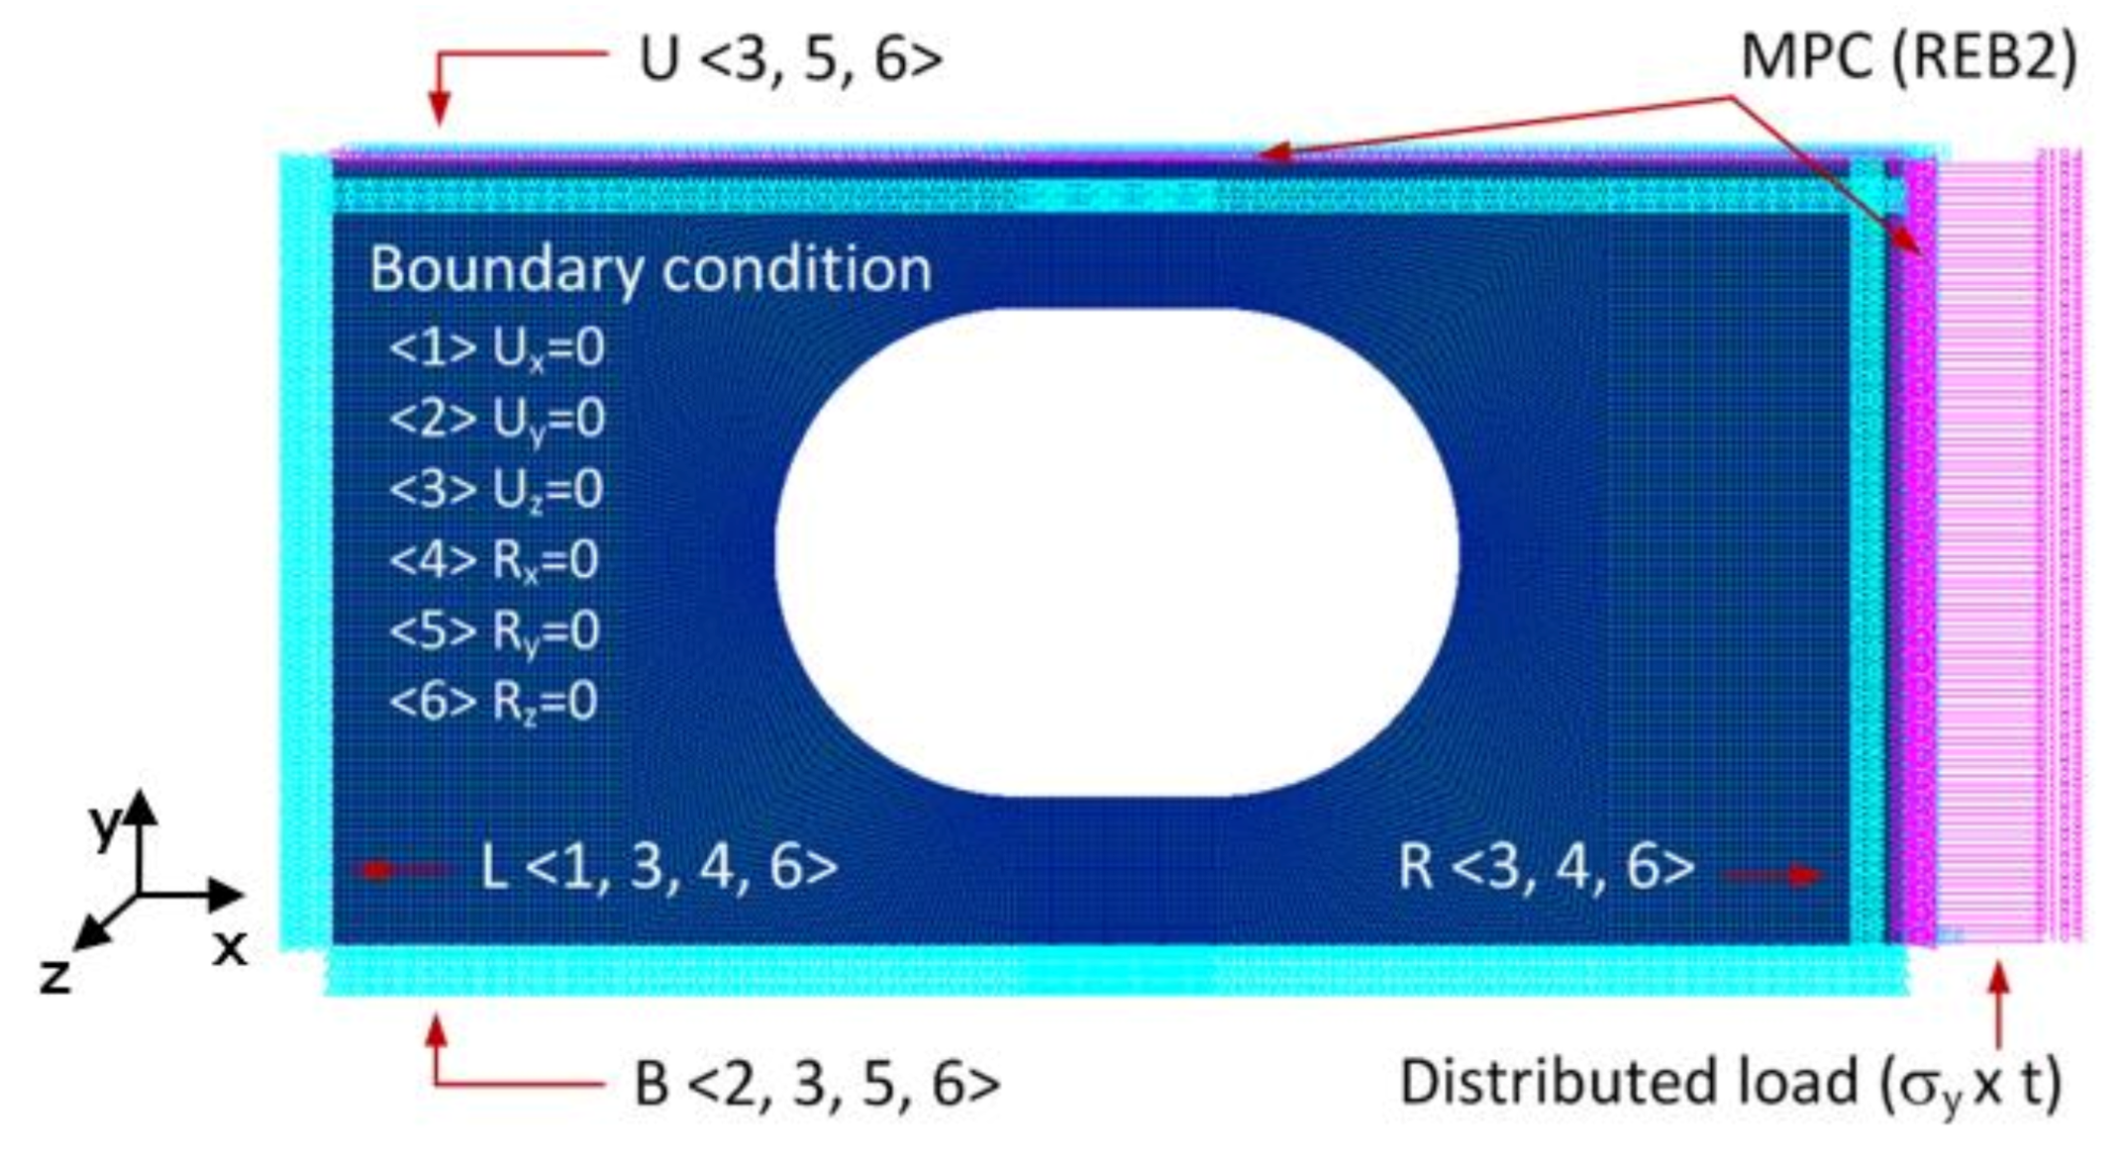
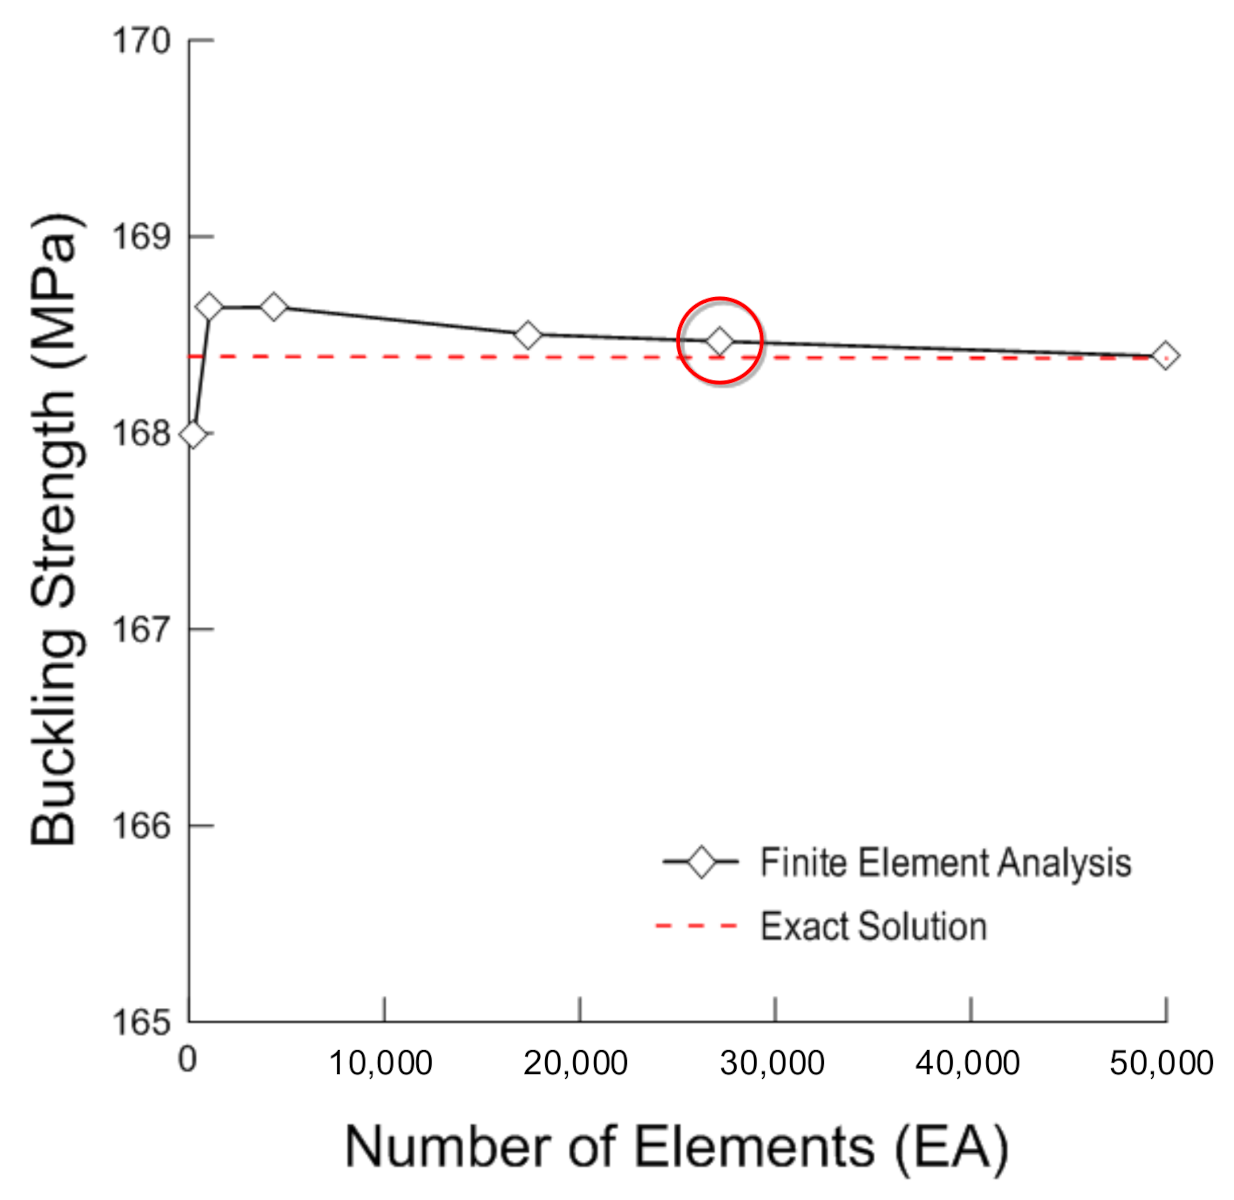
In this study, a stadium-type opening located at the center of the plate was considered as the target perforated plate. Similar to the experiment, a simply supported plate subjected to axial compression was considered. Figure 4 shows the specific loading and boundary conditions of the perforated plate. Here, the multi-point constraint element allowed for nodes that were located in the same line to be translated with the same axial displacement. For finite element modeling, the number of elements was determined through a mesh convergence study of the perforated plate, which had an aspect ratio of 2.0 and an opening size of 200 × 300 mm2, as shown in Figure 5. Through this, the optimal number of elements and the minimum element size were determined to be 27,200 and 2.50 × 2.50 mm2, respectively, on the basis of when the buckling strength converged as the exact solution.
In this study, the commercial finite element analysis program was used throughout the finite element analysis, and the arc-length method built in this program was selected as the numerical method on the basis of a previous study [1,15,16]. In addition, a two-dimensional shell element Quad4 was adopted as the element type, and an elastic-perfectly plastic model that ignores strain hardening was used as the material model. The specific material properties of the perforated plates are listed in Table 3 [14].
In contrast, the perforated plate has initial imperfections such as initial deflection and residual stress, which were generated by the fabrication processes such as cutting and filet welding. In general, the shape of the initial imperfection and magnitude is determined by the following equation [16,17,18]:
where t is the thickness, and β is the slenderness ratio of the plate. The mode shape and initial imperfection magnitude were derived by elastic buckling analysis, and Equation (1) was used for the nonlinear computations.
3. Results and Discussion
3.1. Axial Displacement
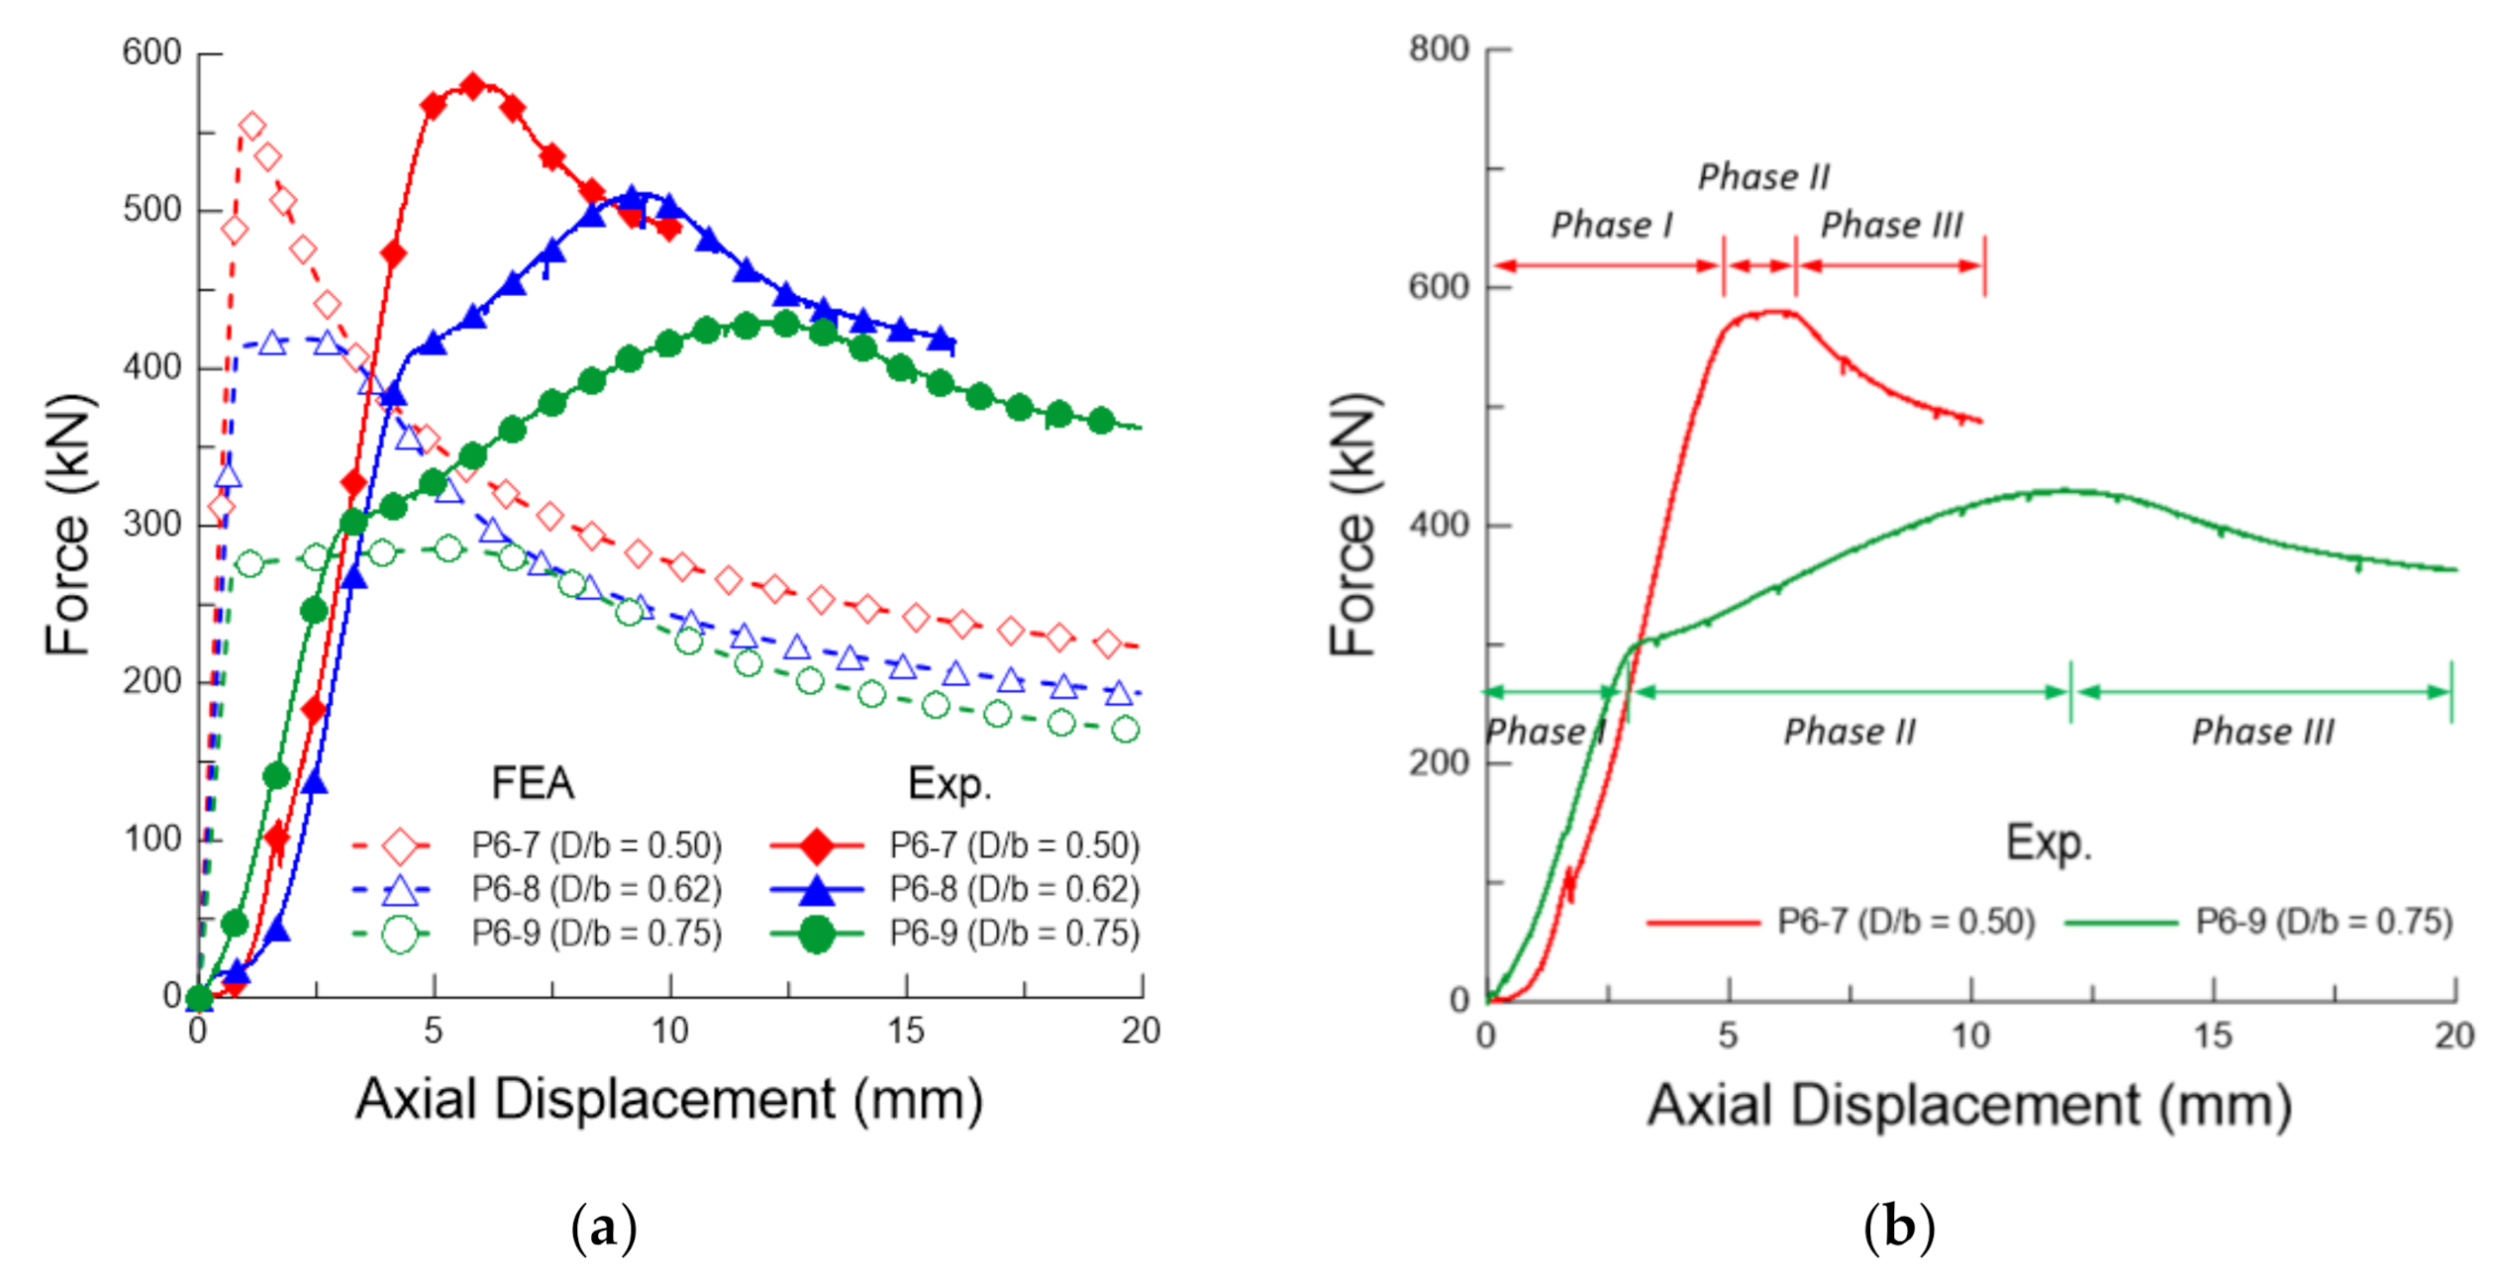
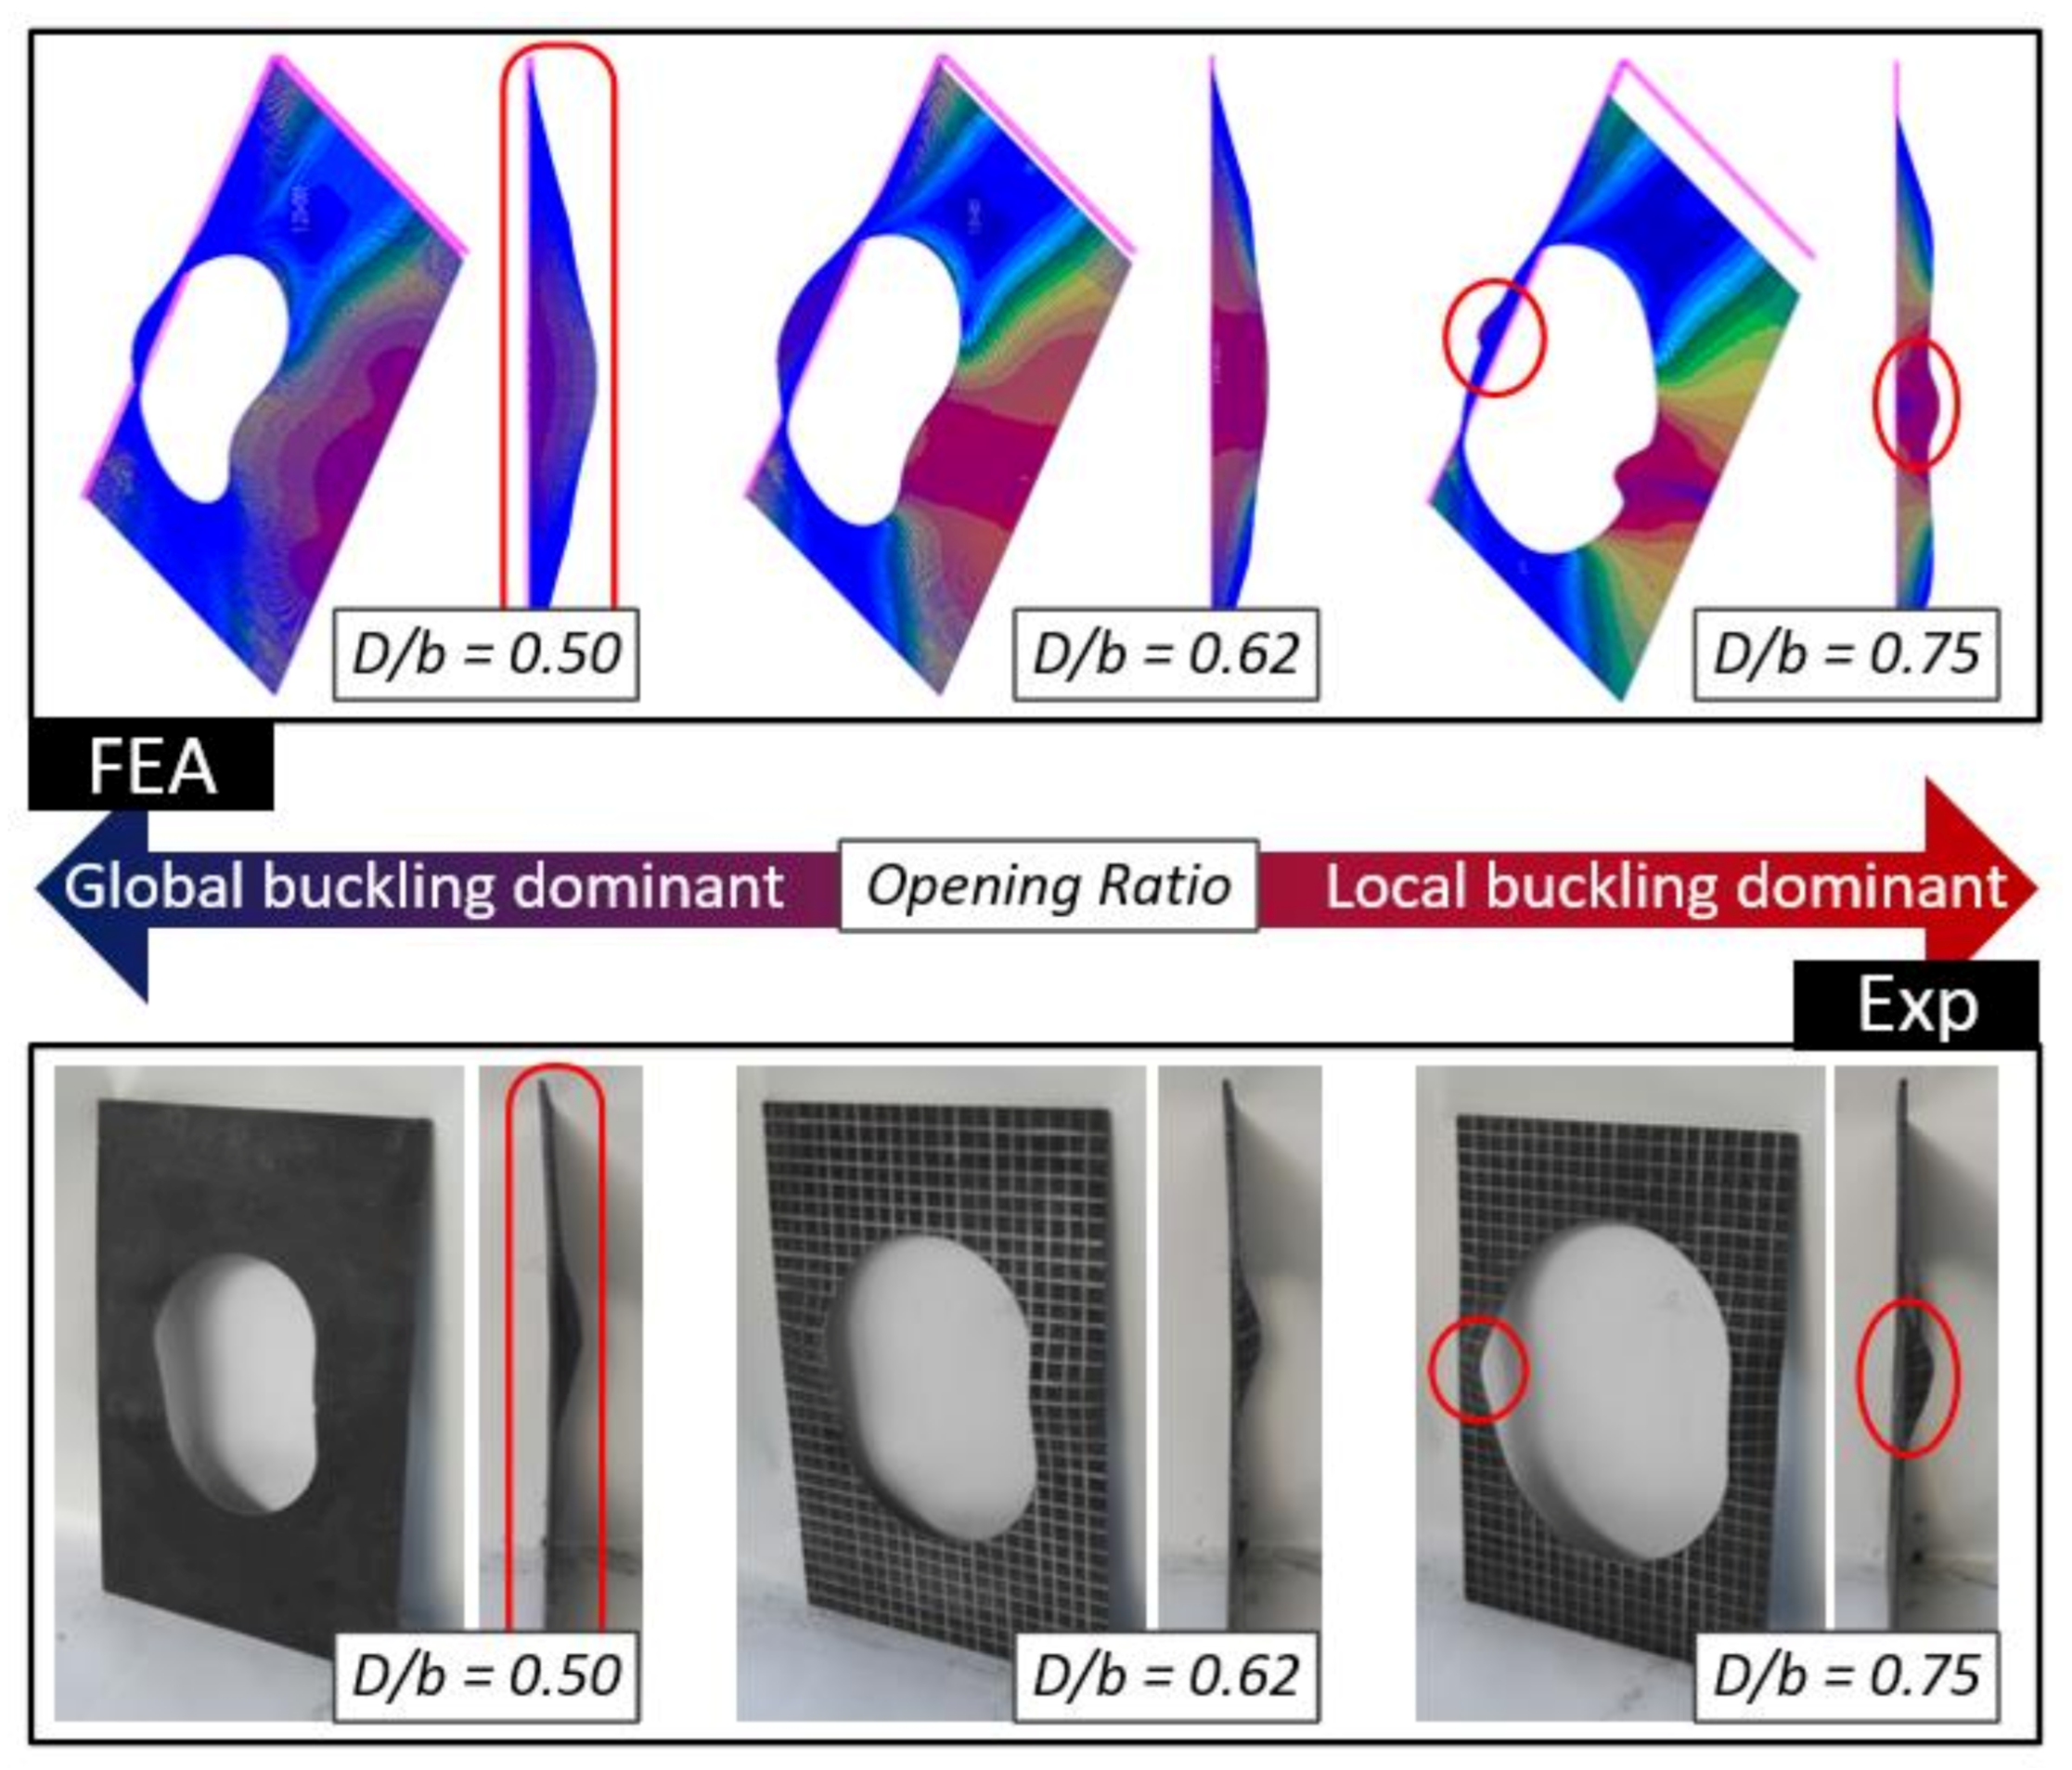
In general, the buckling phenomenon can be classified into two categories: global buckling and local buckling. Global buckling refers to the buckling that occurs on the whole structure because the overall structures are regarded as one unit structure, while local buckling refers to the skin buckles in a stiffened panel or some minor buckling around a hole [18]. Figure 6a shows the force–axial displacement curves of the perforated plate determined by the experiment and finite element analysis methods. As shown in Figure 6b, the buckling behavior of the perforated plate can be divided into three phases. Phase I represents the global buckling of the perforated plate, showing a continuous increase in the applied load with increasing axial displacement. With the entrance into phase II, which is represented as local buckling, the plate experiences a distinct decrease in stiffness, which reaches its maximum force at a part around the opening (especially at the minimum cross-section of the plate) during the process of local buckling. Then, the buckling of the perforated plate around the opening continues, causing lateral deflection to increase. Through Figure 6a,b, it can be confirmed that phase II of perforated plate becomes longer with the increase in the opening ratio. In addition, the length of phase II affects the maximum force of the perforated plate because the maximum force is determined at the end of this phase. As a result, local buckling is more likely to be dominant with an increase in the opening ratio in determining the maximum force applied to the perforated plate. However, global buckling is dominant in the case of a perforated plate with a small opening ratio. The buckling of perforated plates goes from global buckling to a more local buckling around the hole for a larger hole diameter/width ratio as assessed by performing linear and nonlinear buckling analyses of plates [19]. This trend can be observed in the results of the present study, as shown in Figure 7.
It was confirmed that the maximum force subjected to perforated plates decreased with the increase in the opening size. In addition, the maximum force obtained from the experimental approach was higher than that obtained from finite element analysis. When the aspect ratio of the plate was 1.5, the slope of the force–displacement curve decreased rapidly after the maximum force of the perforated plate showed a considerable change around the maximum force, as shown by the red line (P6-7). However, the slopes of the other graphs (P6-8, P6-9), which were the results of the perforated plate with an opening ratio (D/b) greater than 0.62, experienced two major changes.
As shown in Figure 6, the slope of the force–displacement curve measured in the experiment was noticeably lower than that of the finite element analysis. Similar characteristics have been reported in previous research. Xu et al. reported that the lower slope of the load–displacement curve of experiments is due to the existence of gaps between the specimen and the supports at the beginning of the experiment. That is, the perforated plate was not in full contact with the supporting jigs during the initial loading process [20]. Cui and Wang reported that the main reason for the lower slope of the force–displacement curve in experiments is that the compressive strain distributions near the perforation are not uniform along the longitudinal direction with increasing applied load on the plates [21]. Kim et al. reported that the reason for the significant difference in the slope of the force–displacement curve is the existence of gaps at bolted connections and the clearance between the rigid beam and the supporting jigs [22]. Additionally, the error can be explained by the holding device deformation, the absence of a material test, and the absence of the modeling of the multi-layered jig in the finite element modeling process. In the present study, a material test was performed by extracting the test samples from the target perforated plate prior to the plate compressive test, and the material properties obtained from the test results were used for the analysis. For this reason, the error was not likely due to the material properties. As reported in previous studies, the existence of the gaps between the plate and supporting jigs (not the perfect plate but the plate with the perforation) is considered a possible reason for the error. In addition, in the case of the buckling experiment, a load was applied to the specimen experiencing several layers of experimental jig, while it was directly applied to the specimen in the case of the finite element analysis. Unlike the finite element analysis, the supporting jig is not completely rigid, and therefore it can be deformed as a load is applied.
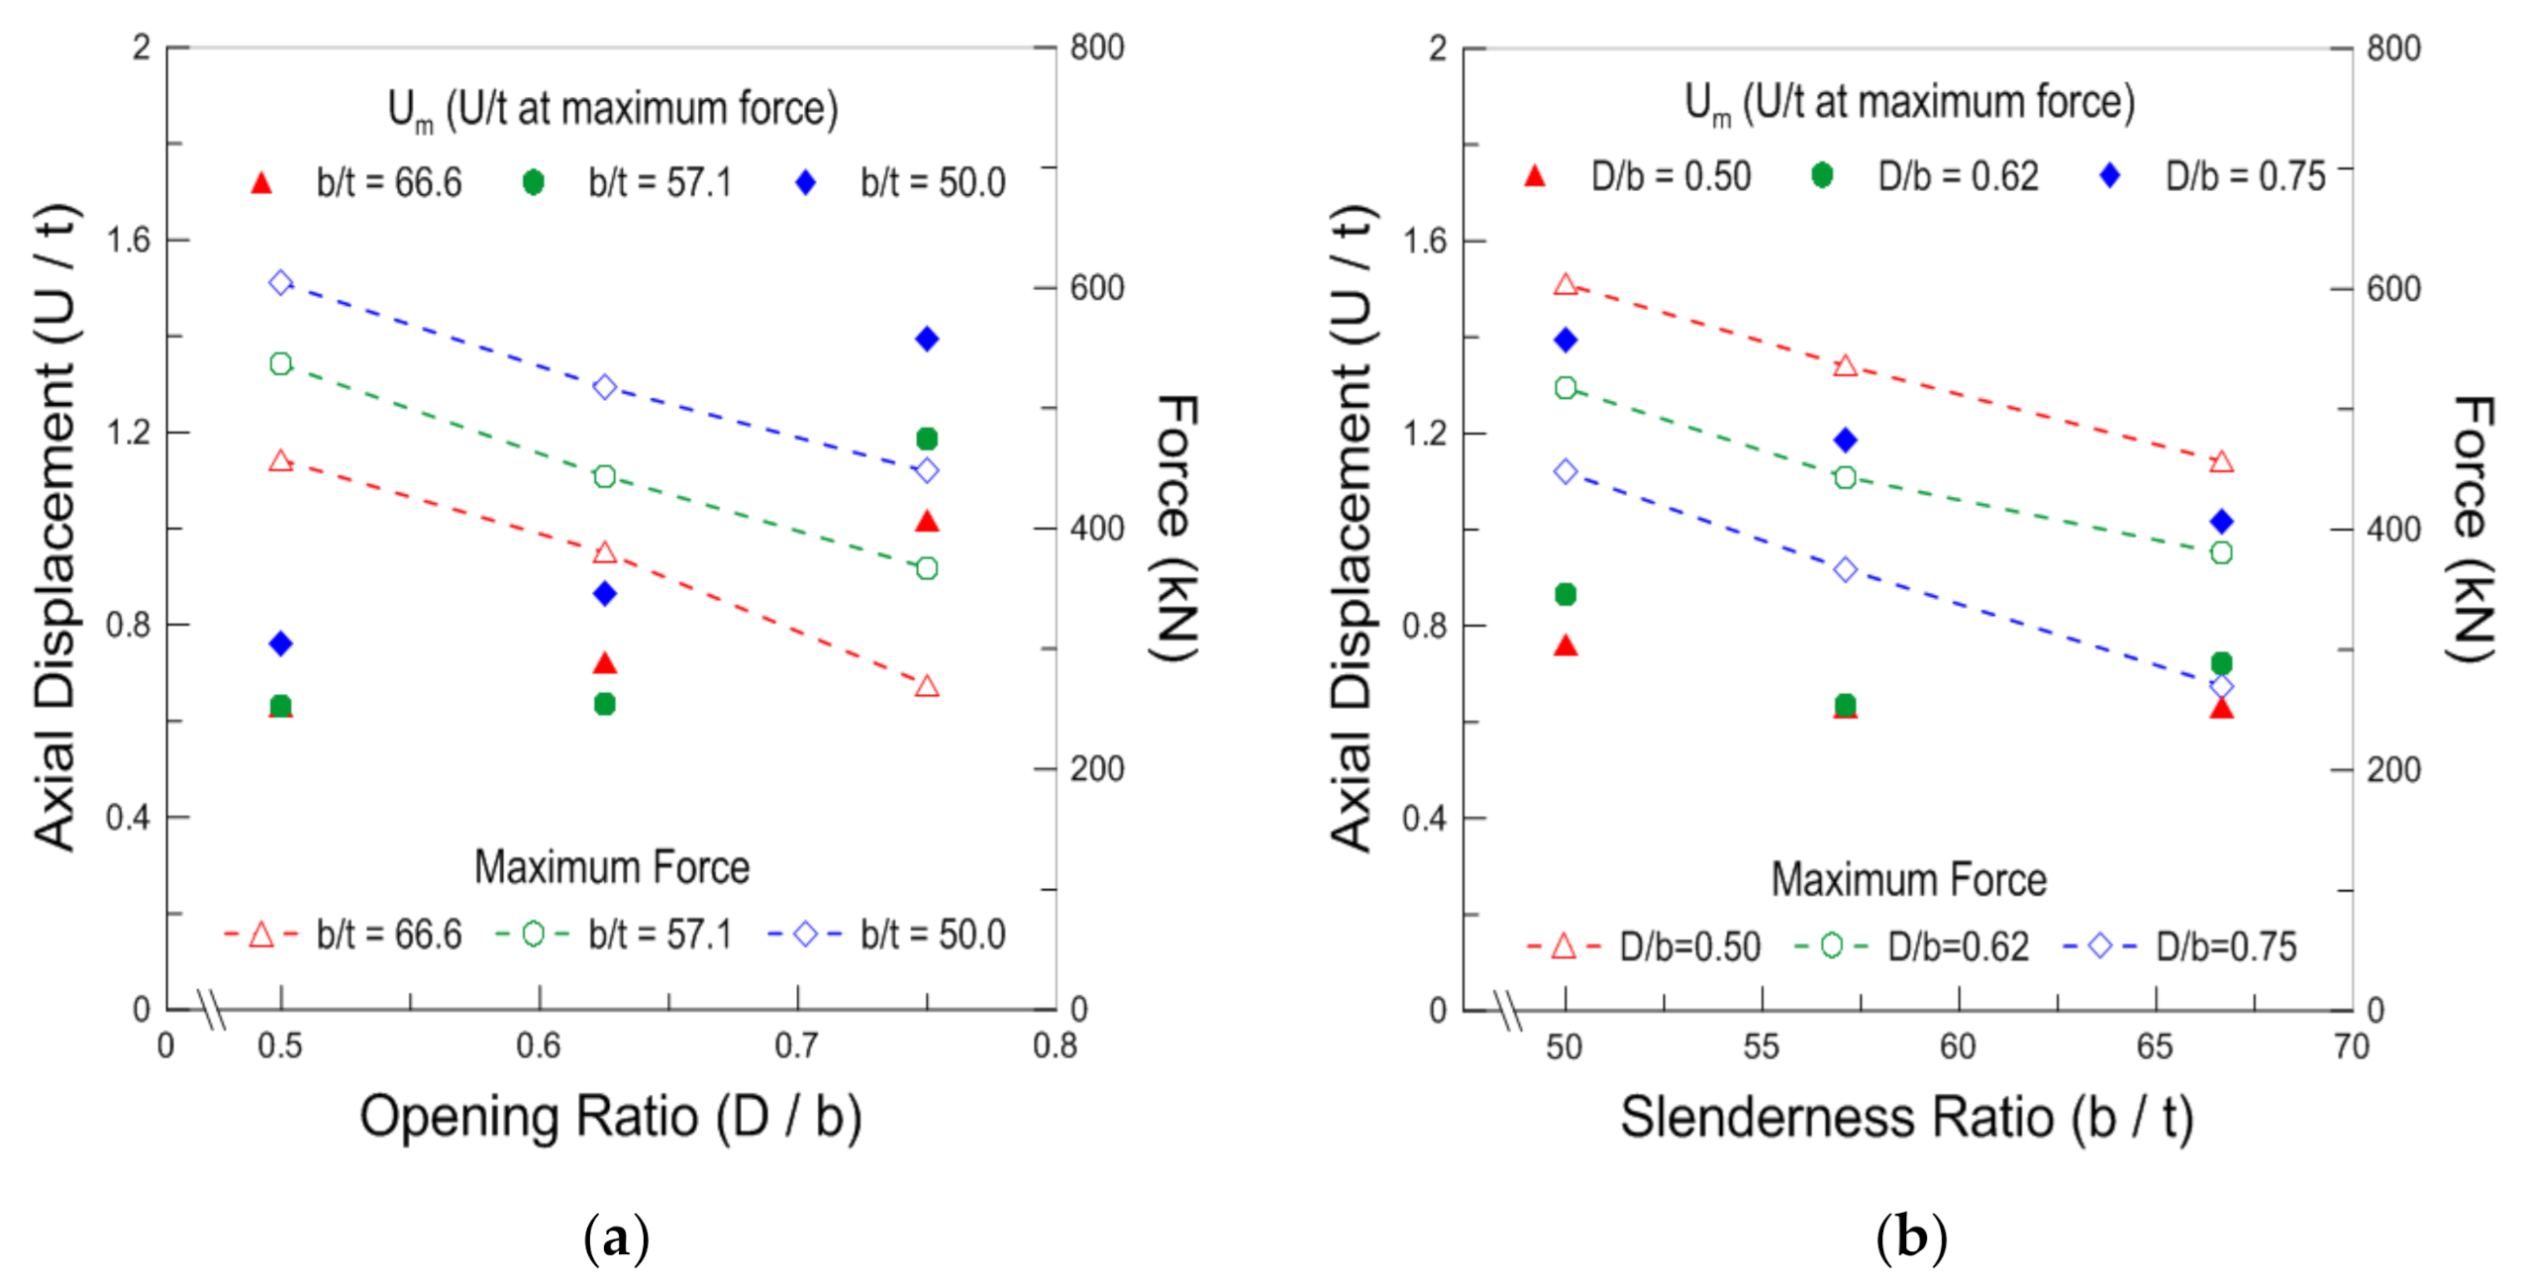
The ratio of axial displacement to thickness at maximum force, Um (U/t at maximum force), is an important parameter because the ultimate strength of the perforated plate can be determined by the applied axial displacement. In addition, Um can be a representative parameter for describing the features of the perforated plate because this parameter changes depending upon the main variables of the perforated plate, such as the opening ratio and slenderness ratio.
Figure 8 shows Um and the force dependent on opening ratio and slenderness ratio of the perforated plate. As shown in Figure 8a, Um increased with the increase in the opening size while force subjected to specimen decreased in the same condition. Through Figure 8b, which is the result with regard to slenderness ratio, it can be clearly seen that the maximum force and Um were decreased with increase in slenderness ratio. In addition, Um was significantly changed when the opening ratio was 0.75, while applied load to the perforated plate constantly changed depending upon the opening ratio and slenderness ratio. Um of perforated plate with opening ratio 0.75 was about 61–88% higher than that of plate with opening ratio 0.50.
As a result, Um increased as the opening ratio increased or the slenderness ratio decreased. In other words, a thick perforated plate with a large opening ratio must be more axially displaced to reach the maximum force of the plate. Therefore, it is recommended that one install a thick plate with a large opening size to delay the sudden buckling of the perforated plate in a certain part, which is expected to result in a large axial displacement.
3.2. Lateral Deflection
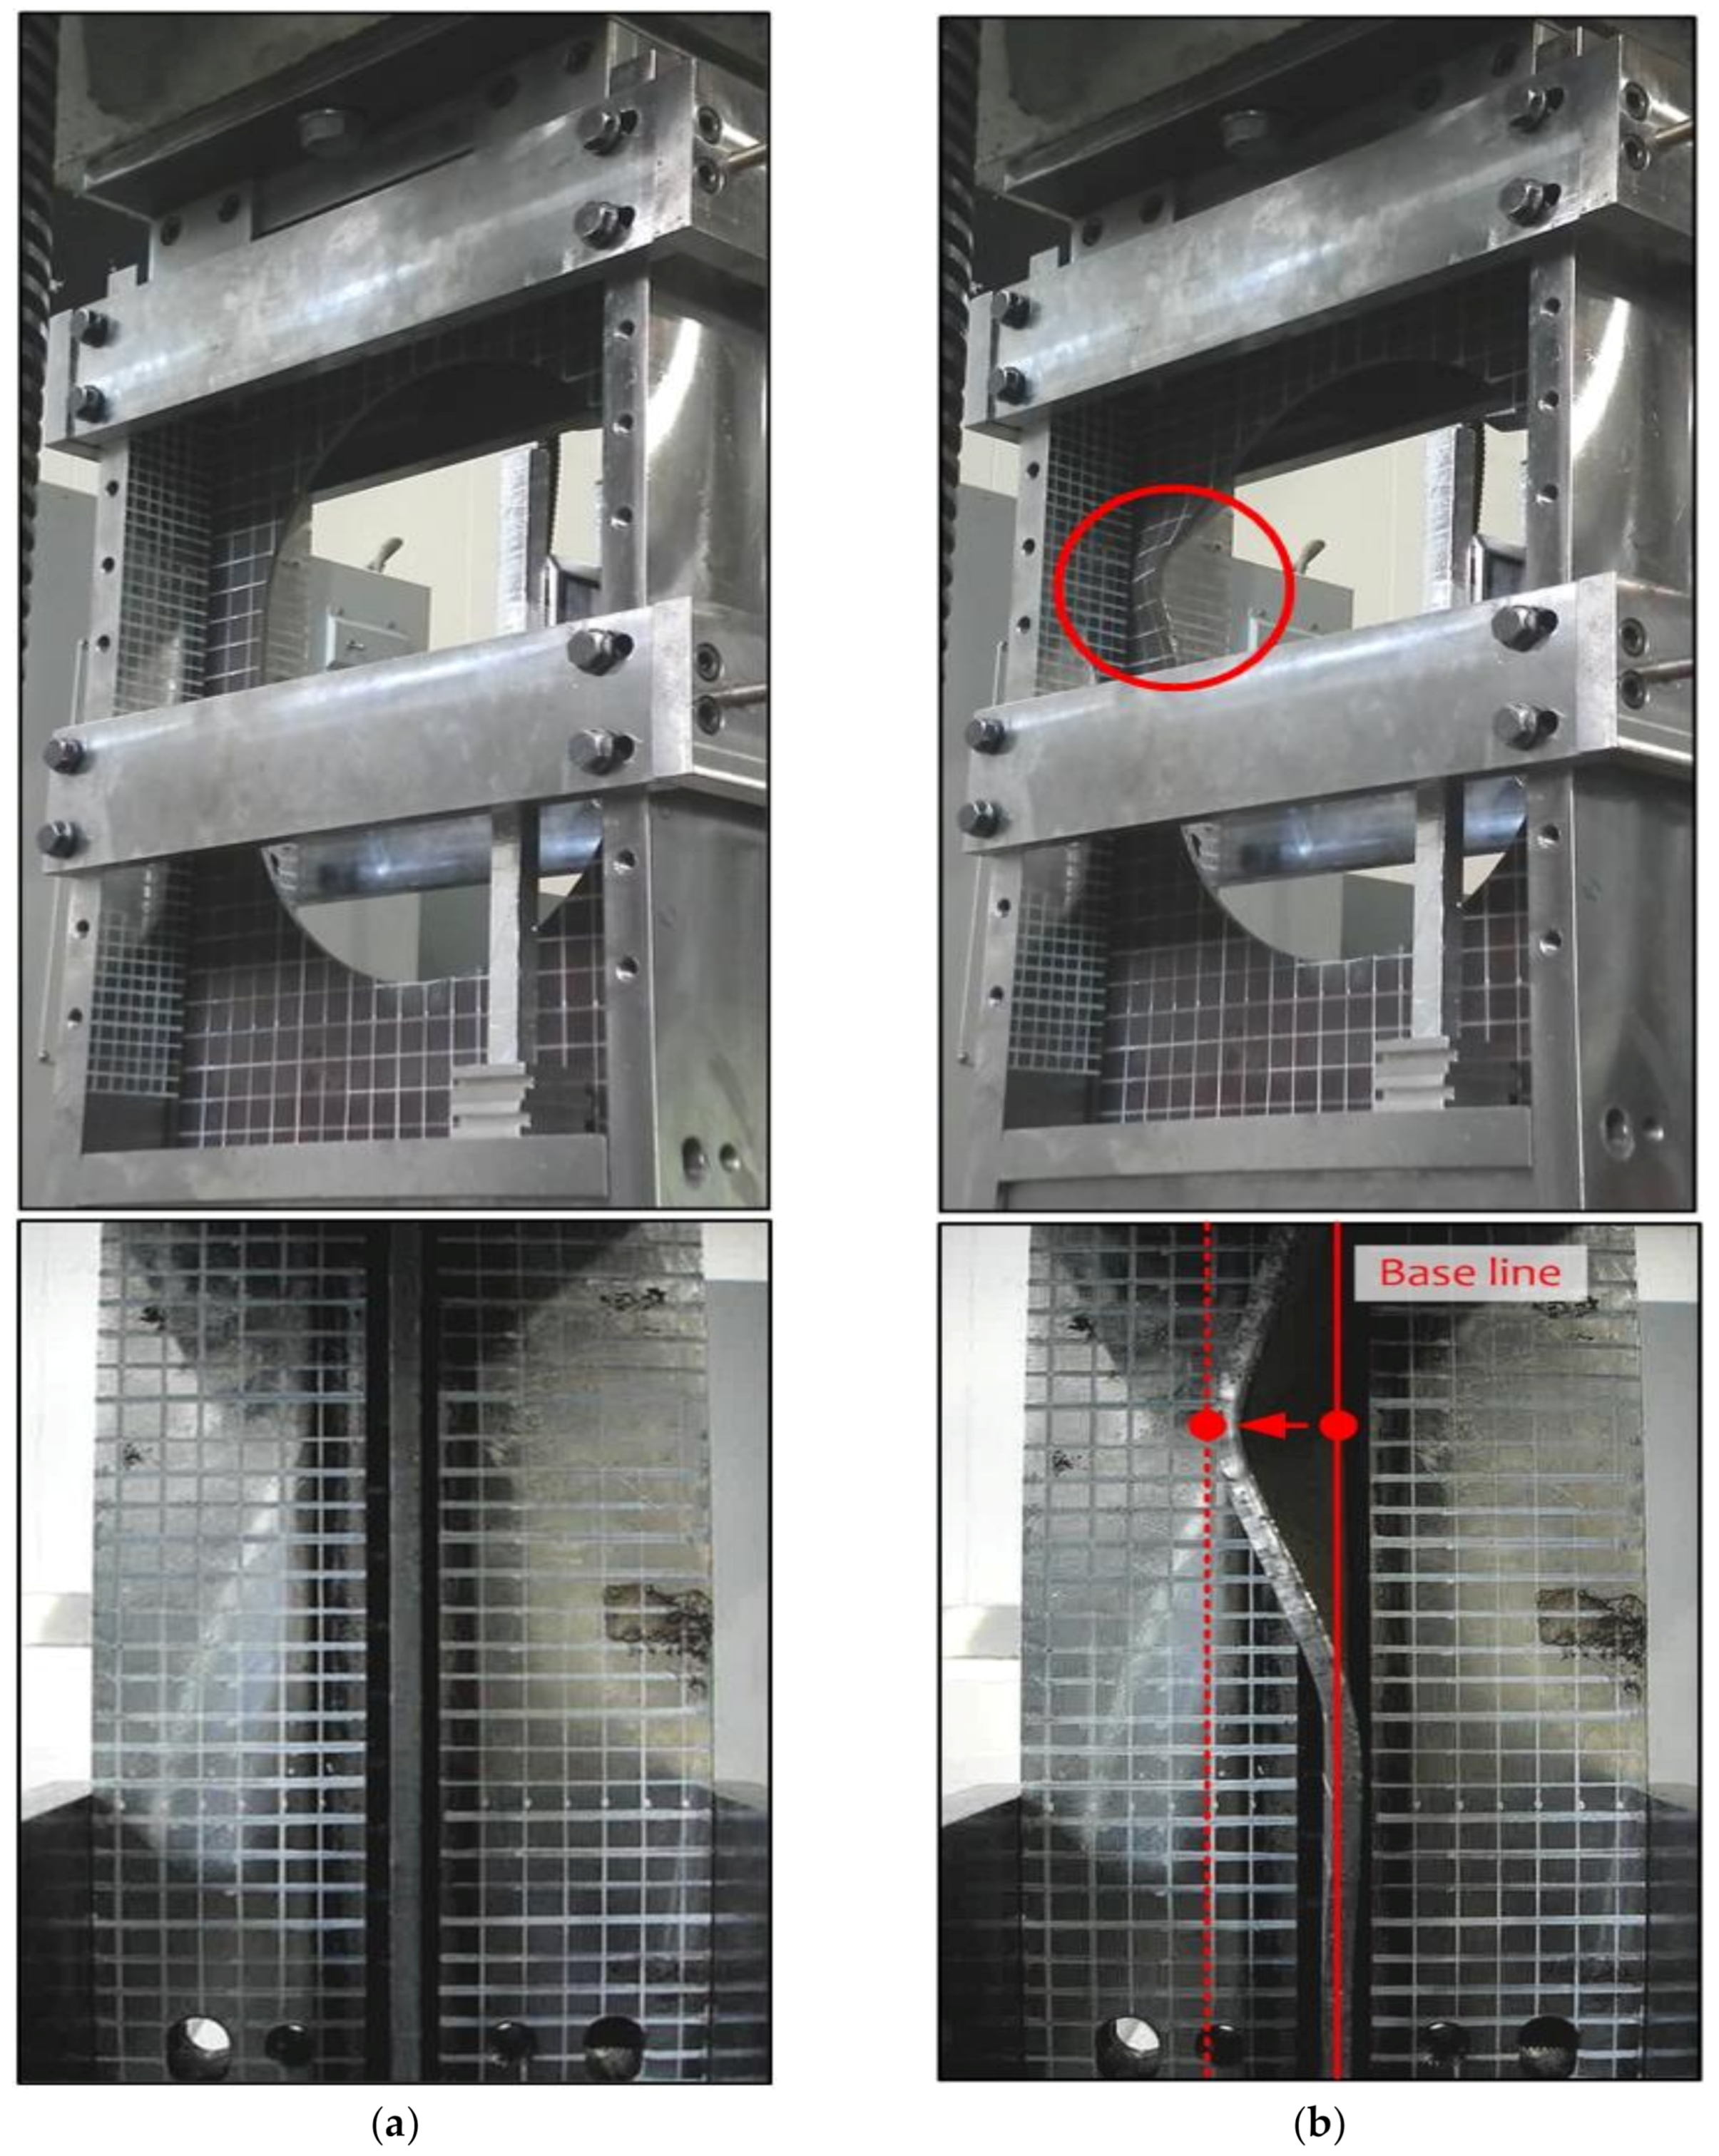
For the perforated plate, the occurrence location of the lateral deflection can be expected because the lateral deflection of the perforated plate tends to proceed near the longitudinal center of the plate with a minimum cross-section, as shown in Figure 7. Therefore, the axial displacement-dependent lateral deflection behavior of the perforated plate was observed using an additionally installed camera at the expected location of plate buckling. Figure 9 shows the lateral deflection variations of the perforated plate at different angles. In addition, the variations in the plate deformation were measured by observing and recording the outermost point of the plate in the out-of-plane direction through a graduated ruler at 10 mm intervals, which is drawn to buckling jig I, as shown in Figure 9.
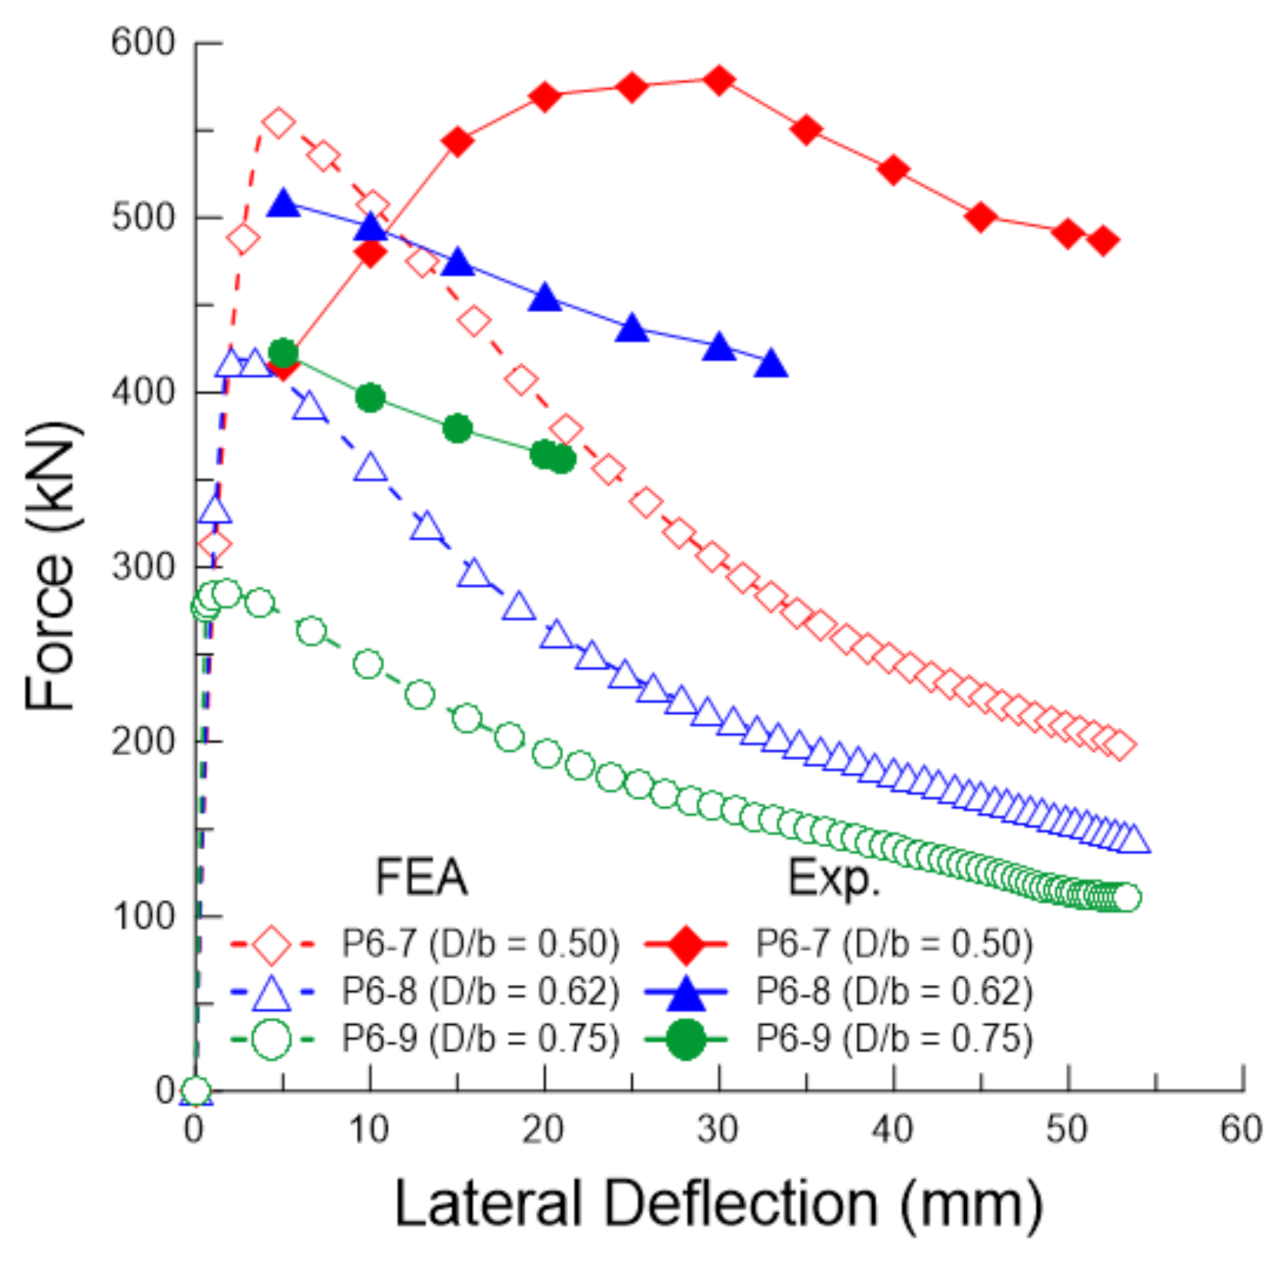
Figure 10 shows the relationship between the force and lateral deflection of the perforated plate obtained from the experiment and the finite element analysis approach. Because the testing specimen was an imperfect plate with initial imperfection, it was confirmed that the lateral deflection started to increase when the load was applied to the perforated plate.
In the experimental results, the lateral deflection of the perforated plate was measured at 5 mm intervals in excess of 5 mm. In all of the experimental stages, video recordings were used, and the lateral deflection data were analyzed using the video recording. As shown in Figure 10, the perforated plate with a relatively higher opening ratio (P6-8 and P6-9) showed a similar trend to the results obtained by finite element analysis. The required load for reaching a specific deflection of the plate was higher in the finite element analysis than the experiment. The lateral deflection of the perforated plate with a large opening ratio was less than 5 mm until the applied load was equal to the maximum force. However, once these plates reached their maximum force, the lateral deflection of the plate started to increase rapidly. However, in the case of a perforated plate with a relatively low opening ratio of 0.50 P6-7, the lateral deflection of the plate considerably increased prior to reaching its maximum force.
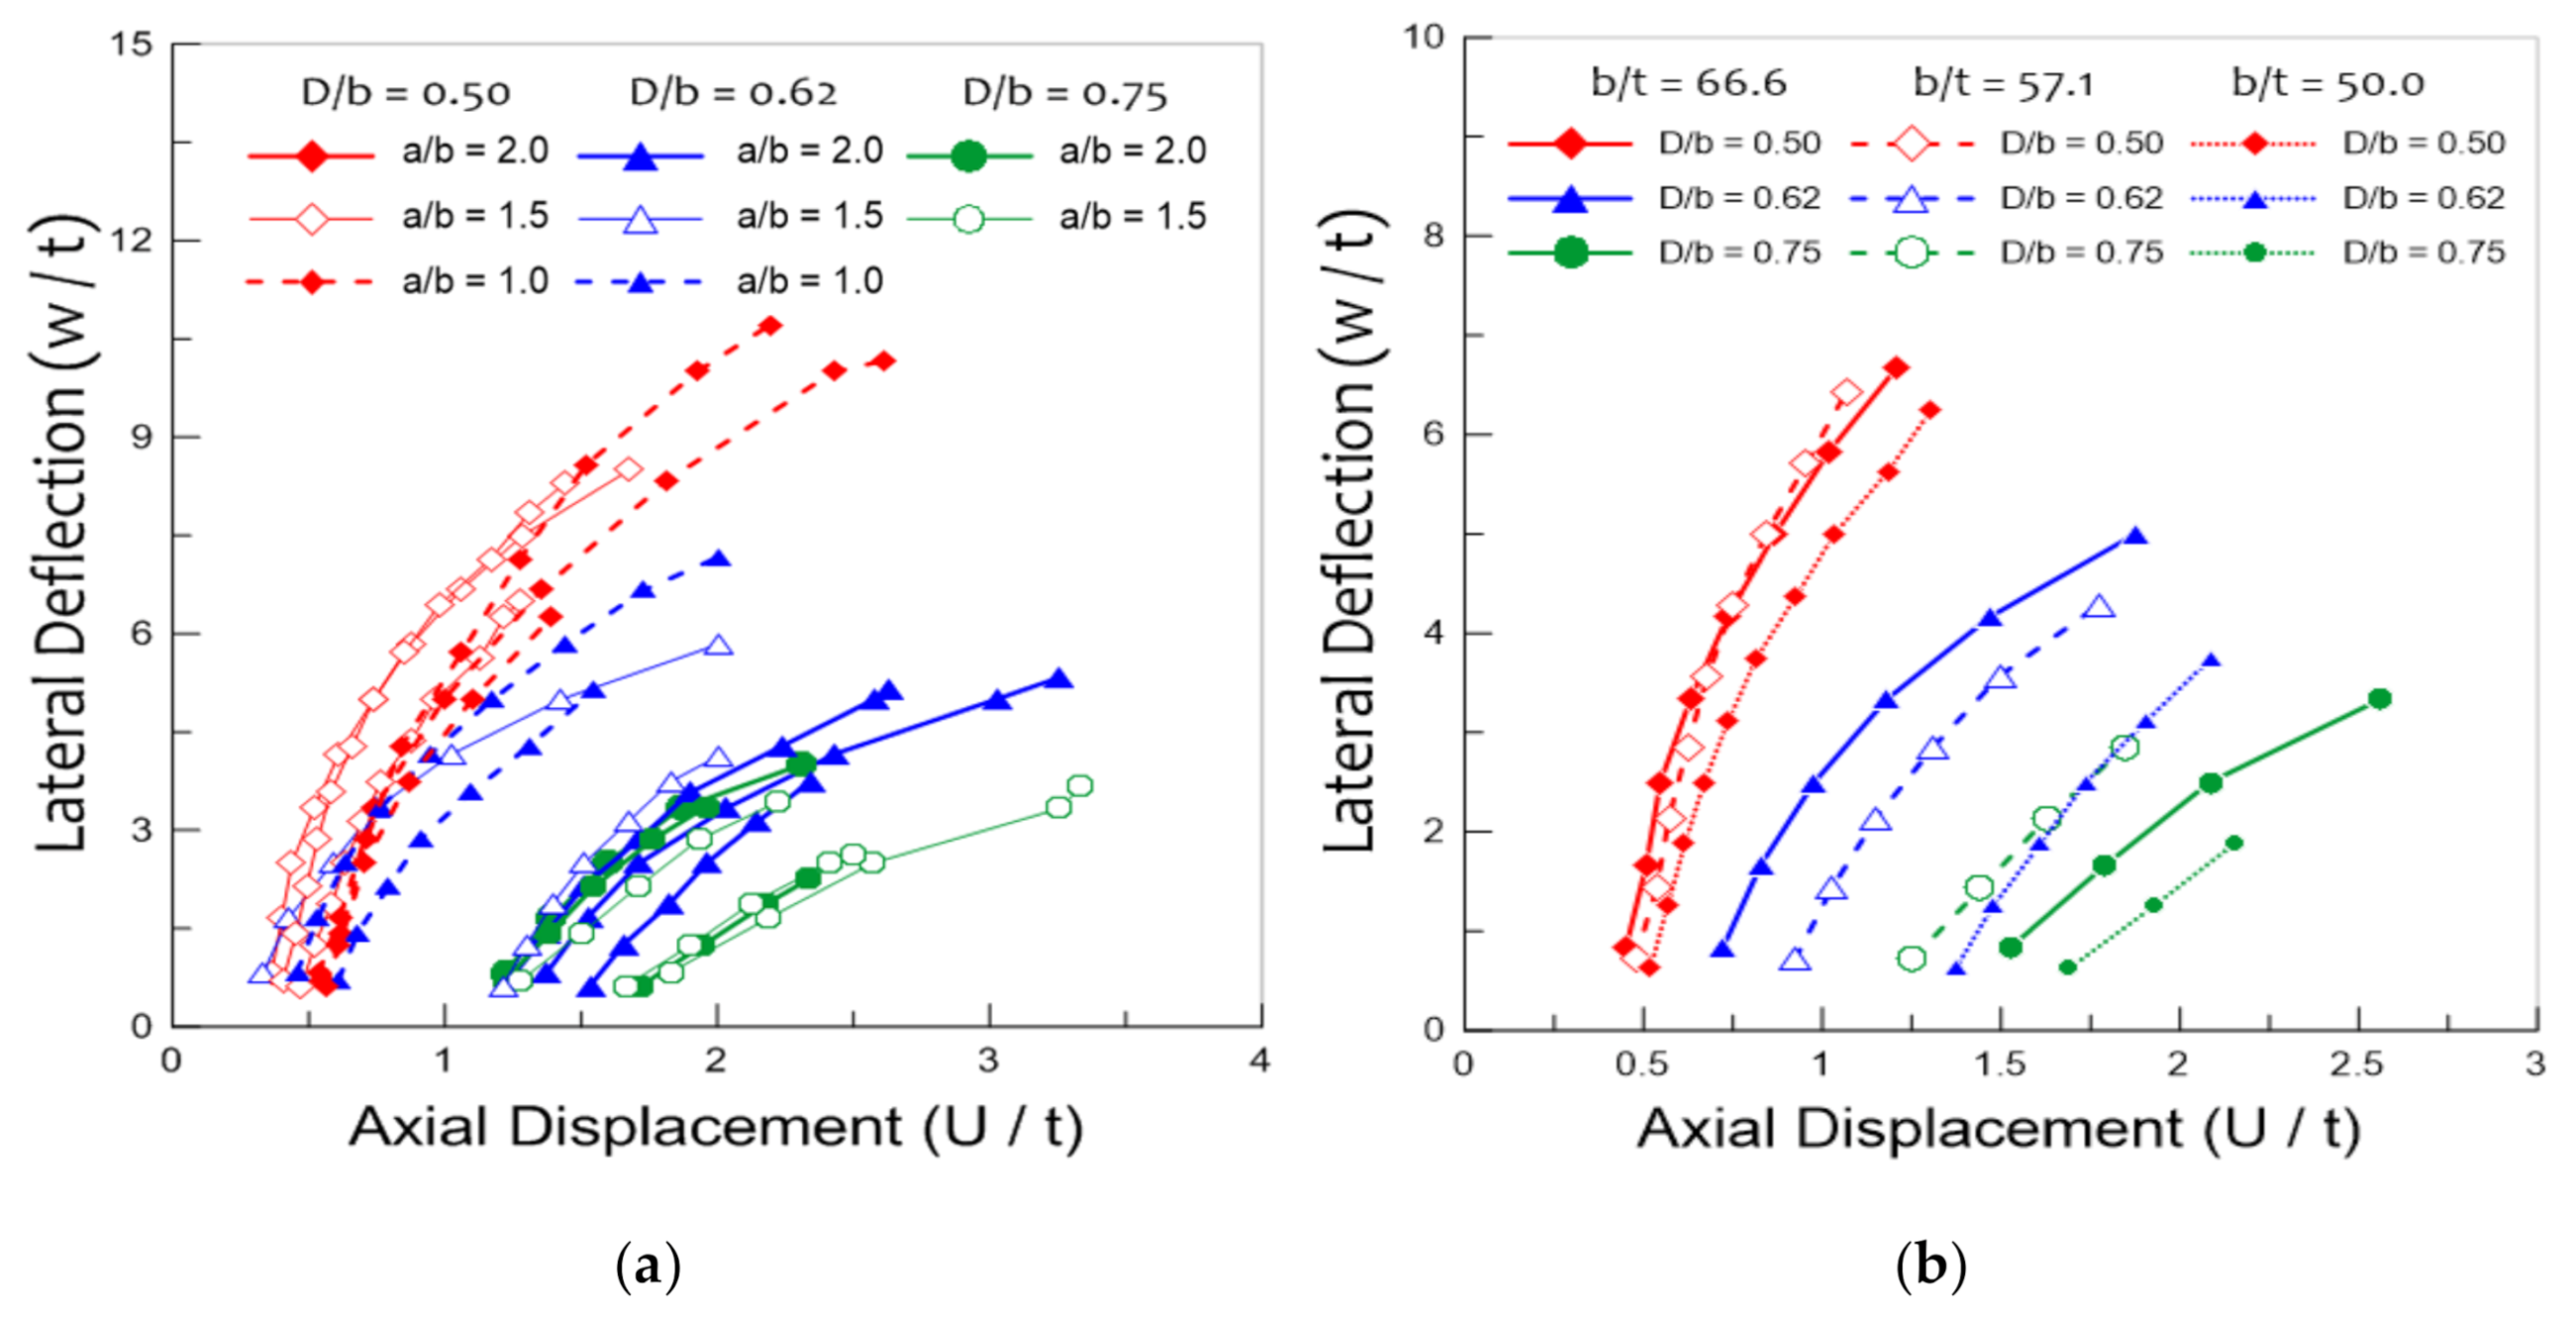
Figure 11 shows the relationship between the axial displacement and lateral deflection of the perforated plate depending on the opening ratio, slenderness ratio, and aspect ratio. Figure 11a shows the lateral deflection behavior of the perforated plate depending on the opening ratio and aspect ratio. It was confirmed that there were distinct differences in the lateral deflection behavior between the smallest opening ratio (D/b = 0.50) and the largest opening ratio (D/b = 0.75), such as the slope of curves and the occurrence point of the lateral deflection. The lateral deflection of the perforated plate, with an opening ratio of 0.50, increased rapidly, and almost simultaneously with the increase in the axial displacement, while those with an opening ratio of 0.75 maintained a constant level for a certain period of time as the axial displacement increased. After this constant period, the lateral deflection of this plate increased rapidly with the increase in axial displacement. As shown in the figure, the aspect ratio in the range of 1.0 to 2.0, however, had little influence on the lateral deflection of the perforated plate for individual cases (D/b = 0.5, 0.75). In contrast, a perforated plate with an opening ratio of 0.62 showed two different behaviors of other opening ratios. When the aspect ratio was 2.0, the behavior of the perforated plate with an opening ratio of 0.62 exhibited the characteristics of a perforated plate with an opening ratio of 0.75; however, when the aspect ratio was less than 1.5, the behavior of this plate exhibited a behavior similar to those with an opening ratio of 0.50. Figure 11b shows the lateral deflection–axial displacement curve with respect to the opening and slenderness ratio of the perforated plate. As shown in this figure, the occurrence point of lateral deflection was delayed, and the slope of the graph decreased with an increase in the opening ratio and a decrease in the slenderness ratio. As a result, low lateral deflection occurred with increasing opening ratio and decreasing slenderness ratio when the same amount of axial displacement occurred in the simply supported perforated plate under axial compression.
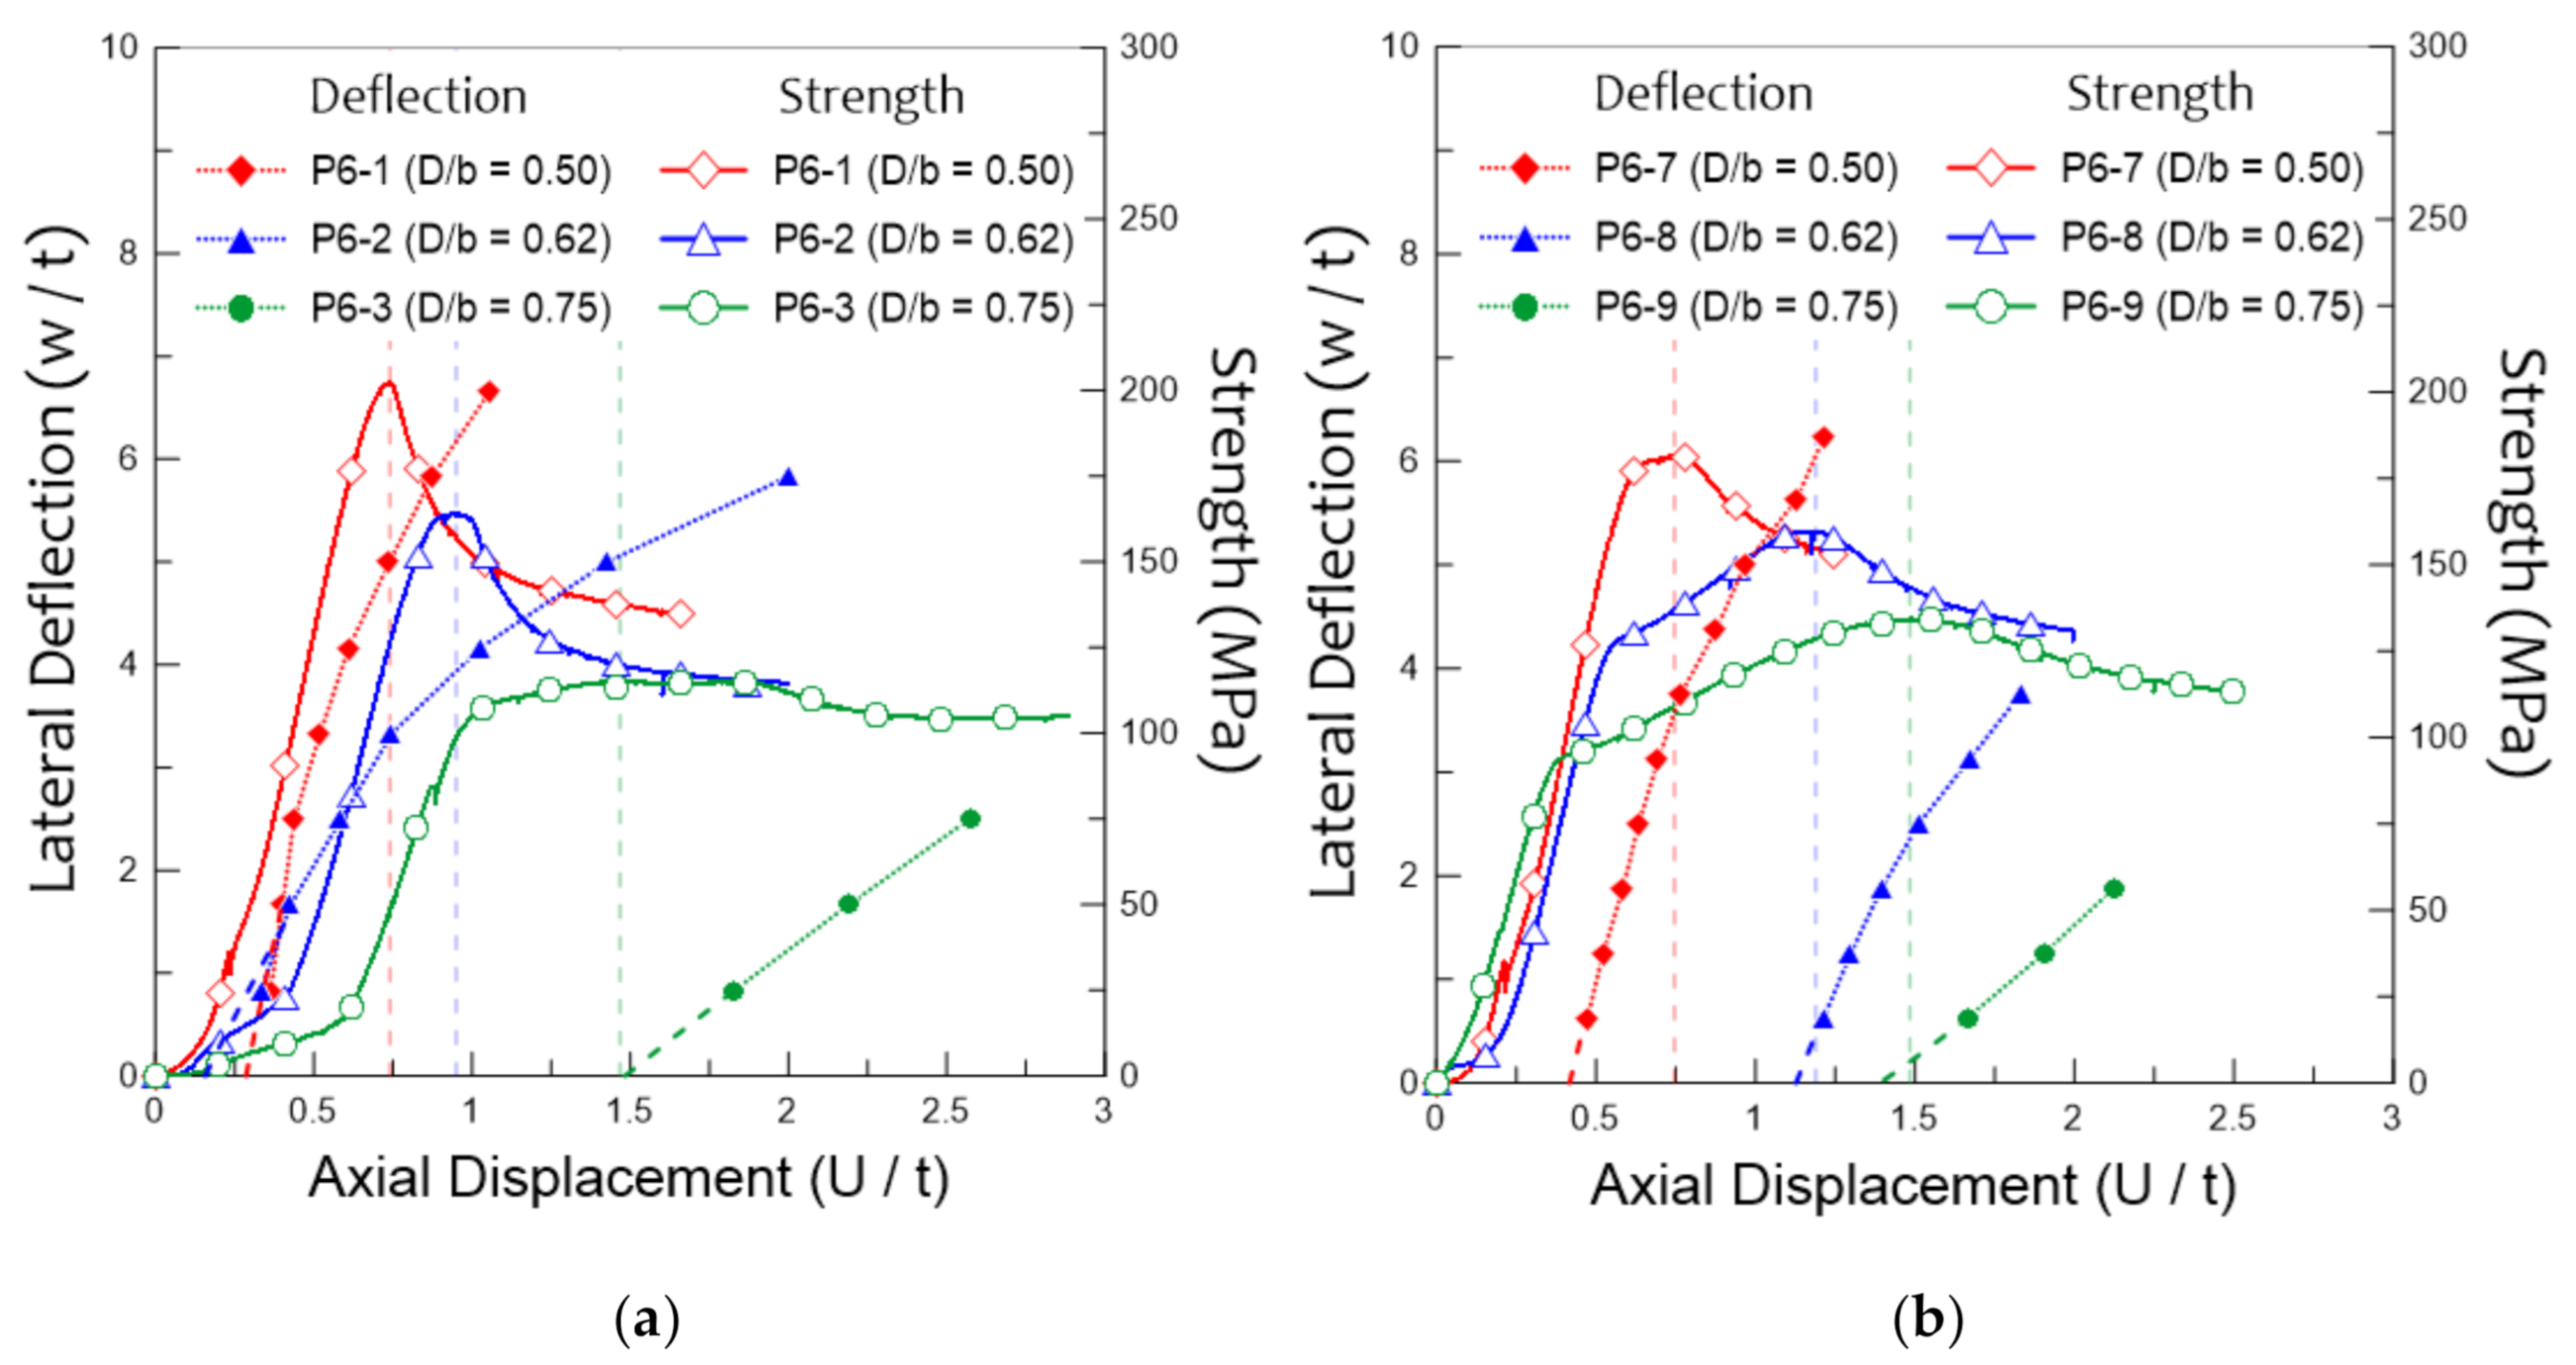
Figure 12 shows the variation in the lateral deflection and strength of perforated plates with the increase in axial displacement on the basis of the results of the buckling experiments. From the experimental results, more than 5 mm of lateral deflection of the perforated plate were measured, while less than 5 mm of lateral deflection was presented as a dotted line, which was obtained from the tendency after the lateral deflection of more than 5 mm. The vertical dotted lines in Figure 12 indicate the axial displacement when the perforated plate reached its ultimate strength. The lateral deflection of perforated plates at the ultimate strength can be simply confirmed through the intersection point between this dotted line and the lateral deflection–axial displacement curve.
In the ultimate strength aspect, the perforated plate with the decreasing opening ratio showed increasing ultimate strength. It was because the occurrence of the perforation led to the decrease of the plate width supporting the longitudinally acting loads. For this reason, the ultimate strength decreased as the opening ratio increased. This can be confirmed from the previously reported research outcomes. Kim et al. investigated the ultimate strength of a perforated steel plate under varying plate aspect ratios in the opening ratio range of 0.1744–0.8139. From the results, the ultimate strength showed a decreasing trend with the increasing opening ratio [16].
In the lateral deflection aspect, the perforated plate with a small opening ratio (P6-1, P6-7) was materially changed around the buckling strength of the perforated plates. However, the lateral deflection of the perforated plate with a large opening ratio (P6-3, P6-9) was maintained at a constant level below the ultimate strength of the plate, and then it was rapidly increased after the ultimate strength of the plate. In particular, in the case of a perforated plate with an opening ratio of 0.75, it was confirmed that the occurrence of lateral deflection indicated the perforated plates that had already reached their ultimate strength. In addition, this behavior occurred in the perforated plate with an opening ratio of 0.62 and a slenderness ratio (b/t) of less than 57.1. As a result, the occurrence of lateral deflection can cause buckling failure of the plate structure when applying a perforated plate with an opening ratio of over 0.62 and a slenderness ratio of less than 57.1. To apply the present results to the actual design process, one must consider applying two different criteria on specific dimensions of the perforated steel plate depending on the opening ratio. Cui and Wang reported that the structural collapse behavior showed different trends depending on the opening ratio, and that it is necessary to consider this in the structural design process [21].
3.3. Practical Curve
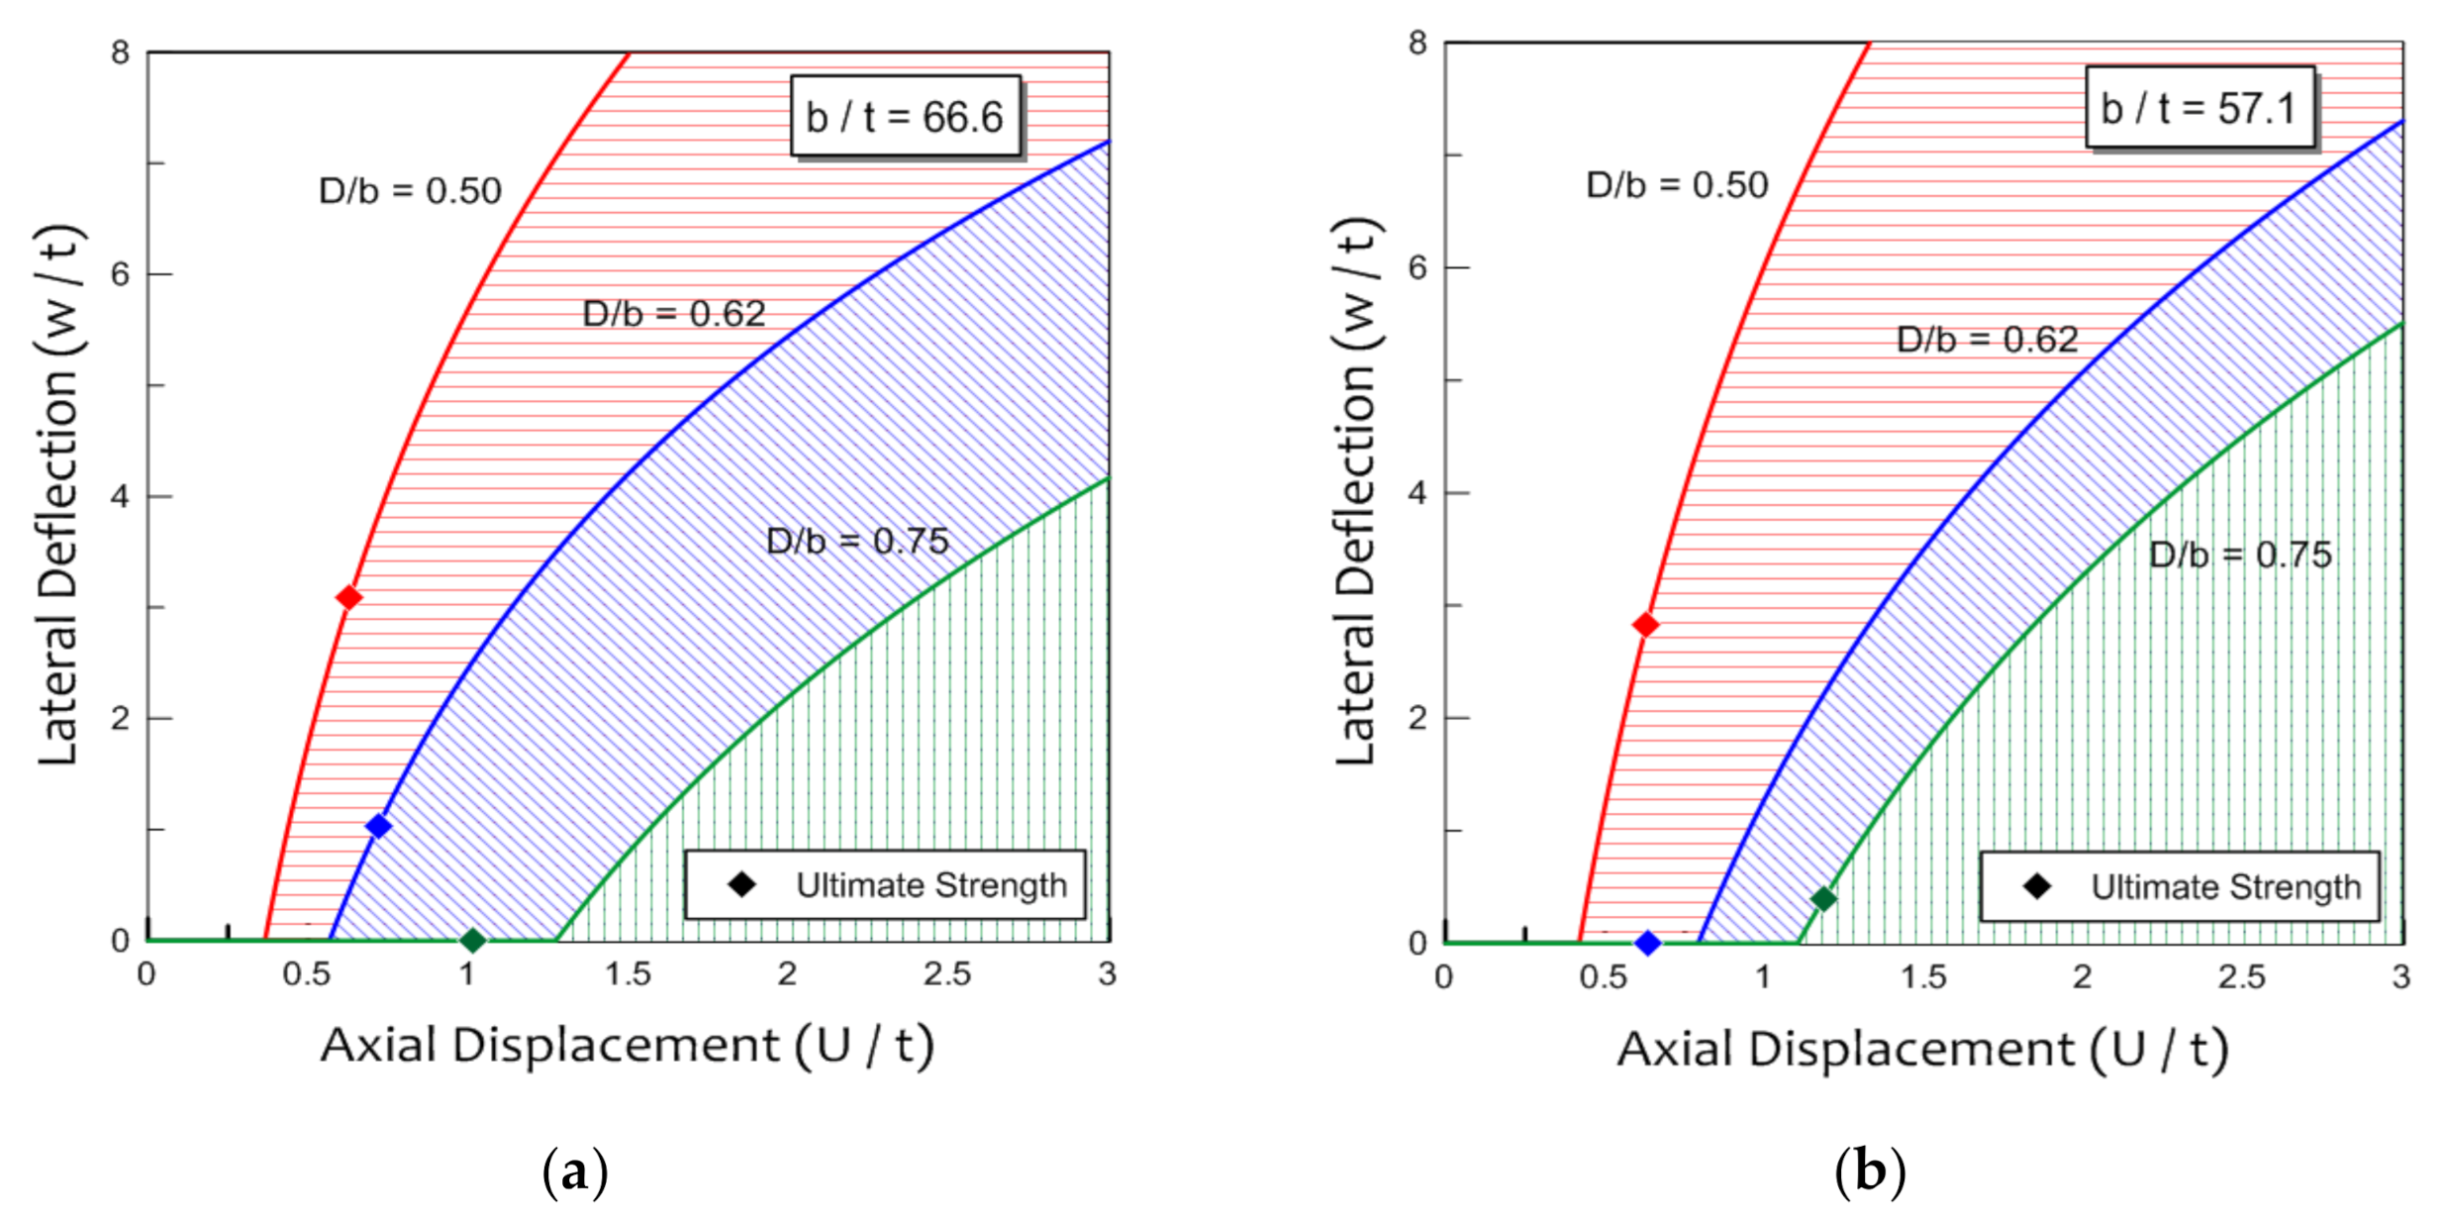
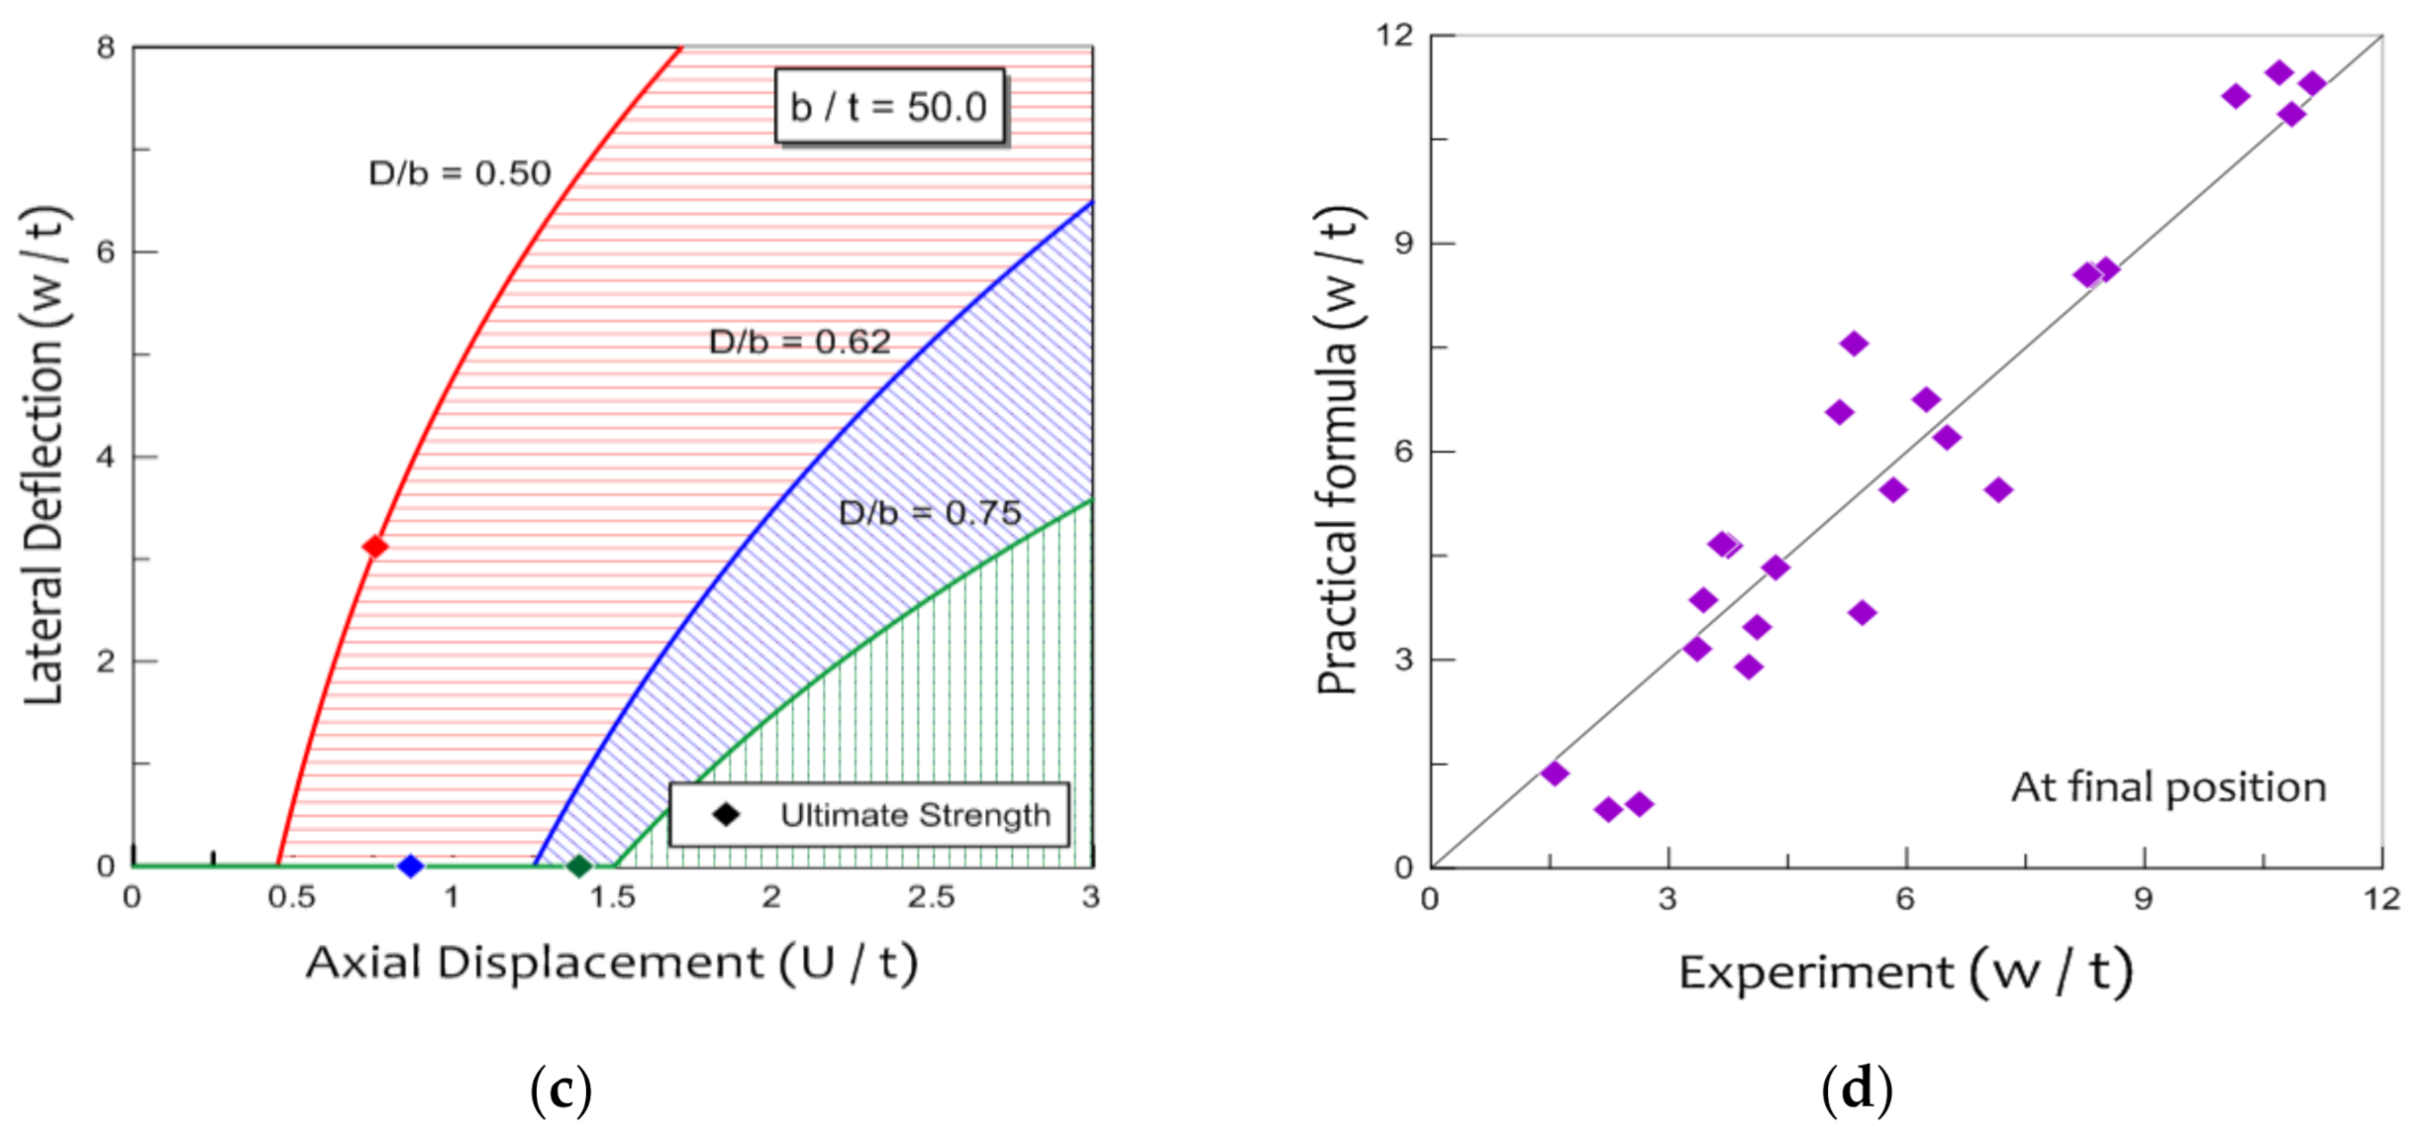
Practical curves were suggested on the basis of the above results, as shown in Figure 13. These curves show the relationship between lateral deflection and axial displacement, as well as the occurrence point of ultimate strength depending on the opening and slenderness ratio of the perforated plate. In these curves, the lateral deflection behavior below 5 mm followed the trend of lateral deflection over 5 mm. Moreover, the lateral deflection below the intersection point between the x-axis and the trend line of lateral deflection over 5 mm was assumed to be zero. From these curves, one can confirm that lateral deflection occurred earlier before the ultimate strength of the plate (after buckling strength) for a perforated plate with a small opening ratio, while lateral deflection occurred after the ultimate strength of the plate (or almost at the same time) for a perforated plate with a large opening ratio. In addition, the lateral deflection was reduced, and its occurrence point was delayed as the opening ratio increased. This trend was also seen as the slenderness ratio decreased.
As a result, the occurrence point of lateral deflection was delayed as the opening ratio increased and the slenderness ratio decreased. However, in the case of a thick perforated plate with a large opening ratio, the occurrence of lateral deflection indicated that the perforated plate had already reached its ultimate strength. On the basis of the suggested practical curves, we can predict the amount of lateral deflection as well as the occurrence point of the ultimate strength of the perforated plate with a certain opening and slenderness ratio as the axial displacement increased. The quantitative experimental results are summarized in Table 4.
4. Conclusions
This study aimed to investigate the behavior characteristics of the lateral deflection of a simply supported perforated plate under axial compression. For this purpose, we conducted a series of buckling experiments by considering the opening size, thickness, and aspect ratio of the perforated plates. In addition, an elastoplastic large deflection analysis was conducted to compare the results with the experimental results. The main findings of this study are summarized below.
- The axial displacement of the perforated plate at its ultimate strength increased with an increase in the opening ratio and thickness of the perforated plate. In other words, a thick perforated plate with a large opening size must be axially displaced higher in to reach its ultimate strength. Therefore, within the allowable stress ranges, it is recommended that one install a perforated plate with a large opening size and thickness to a certain part, which is expected to result in a large axial displacement.
- The perforated plate experiences two major changes: global and local buckling; the stiffness of the plate changes materially in each process. Local buckling occurred mainly around the opening and was more dominant with an increase in the opening ratio. In addition, the ultimate strength of the perforated plate was determined at the end of the local buckling phase.
- There was a distinct difference in the behavior of lateral deflection between perforated plates with different opening ratios. The lateral deflection of the perforated plate with a small opening ratio showed a rapid increase in the buckling strength of the plate. In contrast, the lateral deflection of the perforated plate with a large opening ratio was maintained at a constant level before the ultimate strength, and then it gradually increased after the ultimate strength of the plate.
- The occurrence point of lateral deflection delayed as the opening ratio increased, and the slenderness ratio decreased. However, in the cases of perforated plates with large opening ratios (more than 0.75) and small slenderness ratios (less than 57.1), the occurrence of lateral deflection indicated that the perforated plate had already reached its ultimate strength.
- The practical curves are suggested on the basis of the buckling experimental results, which showed the amount of lateral deflection with the increase in axial displacement as well as the occurrence point of ultimate strength dependent on the opening and slenderness ratio.
Using these results, we were able to predict the amount of deflection caused by the load acting on the plate or axial displacement. Through this, it is possible to prevent interference by securing the gap between the main equipment and the boards or to proceed with the design, such as setting an appropriate gap between the boards.
Author Contributions
Conceptualization and project administration, J.-M.L.; test and writing, J.-H.K. and D.-H.P.; experimental review and editing, S.-K.K.; numerical simulation and editing, J.-D.K. All authors have read and agreed to the published version of the manuscript.
Funding
This research was a part of the project titled “Development of the safety standards for marine hydrogen storage vessels and fuel supply systems”, funded by the Ministry of Oceans and Fisheries, Korea. This work was supported by the R&D Platform Establishment of Eco-Friendly Hydrogen Propulsion Ship Program (no. 20006644) funded by the Ministry of Trade, Industry and Energy (MOTIE, Korea).
Institutional Review Board Statement
Not applicable.
Informed Consent Statement
Not applicable.
Data Availability Statement
The data presented in this study are available on request from corresponding author.
Conflicts of Interest
The authors declare no conflict of interest.
References
- Kim, J.H.; Park, J.S.; Lee, K.H.; Kim, J.H.; Kim, M.H.; Lee, J.M. Computational analysis and design formula development for the design of curved plates for ships and offshore structures. Struct. Eng. Mech. 2014, 49, 705–726. [Google Scholar]
- El-Sawy, K.M.; Nazmy, A.S.; Martini, M.I. Elasto-plastic buckling of perforated plates under uniaxial compression. Thin Walled Struct. 2004, 42, 1083–1101. [Google Scholar]
- Kumar, M.S.; Alagusundaramoorthy, P.; Sundaravadivelu, R. Ultimate strength of ship plating under axial compression. Ocean Eng. 2006, 33, 1249–1259. [Google Scholar] [CrossRef]
- Ghavami, K.; Khedmati, M.R. Numerical and experimental investigations on the compression behaviour of stiffened plates. J. Constr. Steel Res. 2006, 62, 1087–1100. [Google Scholar]
- Silva, C.C.C.; Helbig, D.; Cunha, M.; Santos, E.D.; Rocha, L.A.O.; Real, M.V.; Isoldi, L.A. Numerical buckling analysis of thin steel plates with centered hexagonal perforation through constructal design method. J. Braz. Soc. Mech. Sci. Eng. 2019, 41, 309. [Google Scholar] [CrossRef]
- Seifi, R.; Chahardoli, S.; Attar, A.A. Axial buckling of perforated plates reinforced with strips and middle tubes. Mech. Res. Commun. 2017, 85, 21–32. [Google Scholar]
- Cheng, B.; Zhao, J. Strengthening of perforated plates under uniaxial compression: Buckling analysis. Thin Walled Struct. 2010, 48, 905–914. [Google Scholar]
- Mateus, A.F.; Witz, J.A. A parametric study of the post-buckling behavior of steel plates. Eng. Struct. 2001, 23, 172–185. [Google Scholar] [CrossRef]
- Han, D.S.; Han, G.J. The deflection coefficient of a rectangular plate reinforced in the middle. Int. J. Precis. Eng. Manuf. 2009, 10, 73–78. [Google Scholar] [CrossRef]
- Gong, Y.; Gao, Y.; Xie, D.; Liu, J. Deflection and fracture of a clamped plate under lateral indentation by a sphere. Ocean Eng. 2015, 103, 21–30. [Google Scholar]
- Kwon, Y.B.; Park, H.S. Compression tests of longitudinally stiffened plates undergoing distortional buckling. J. Constr. Steel Res. 2011, 67, 1212–1224. [Google Scholar] [CrossRef]
- Seifi, R.; Khoda-yari, N. Experimental and numerical studies on buckling of cracked thin-plates under full and partial compression edge loading. Thin Walled Struct. 2011, 49, 1504–1516. [Google Scholar] [CrossRef]
- Gordo, J.M.; Soares, C.G. Compressive tests on stiffened panels of intermediate slenderness. Thin Walled Struct. 2011, 49, 782–794. [Google Scholar] [CrossRef]
- Kim, J.H.; Park, D.H.; Kim, S.K.; Kim, M.S.; Lee, J.M. Experimental study and development of design formula for estimating the ultimate strength of curved plates. Appl. Sci. 2021, 11, 2379. [Google Scholar] [CrossRef]
- Memon, B.A.; Su, X.Z. Arc-length technique for nonlinear finite element analysis. J. Zhejiang Univ. Sci. A 2004, 5, 618–628. [Google Scholar] [CrossRef]
- Kim, J.H.; Jeon, J.H.; Park, J.S.; Seo, H.D.; Ahn, H.J.; Lee, J.M. Effect of reinforcement on buckling and ultimate strength of perforated plates. Int. J. Mech. Sci. 2015, 92, 194–205. [Google Scholar] [CrossRef]
- Smith, C.S.; Davidson, P.C.; Chapman, J.C.; Dowling, P.J. Strength and stiffness of ships’ plating under in-plane compression and tension. Trans. R. Inst. Nav. Archit. 1988, 130, 227–296. [Google Scholar]
- Ueda, Y.; Yao, T. The influence of complex initial deflection modes on the behavior and ultimate strength of rectangular plates in compression. J. Constr. Steel Res. 1985, 5, 265–302. [Google Scholar] [CrossRef]
- Mert, M. Linear and Nonlinear Buckling Analyses of Plates Using the Finite Element Method. Master’s Thesis, Linkoping University, Linkoping, Sweden, June 2014. [Google Scholar]
- Xu, S.; Liu, B.; Wu, Y.G.W.; Soares, C.G. Experimental and numerical analysis of ultimate strength of inland catamaran subjected to vertical bending moment. Ocean Eng. 2019, 188, 106320. [Google Scholar] [CrossRef]
- Cui, J.; Wang, D. An experimental and numerical investigation on ultimate strength of stiffened plates with opening and perforation corrosion. Ocean Eng. 2020, 205, 107282. [Google Scholar] [CrossRef]
- Kim, U.N.; Choe, I.H.; Paik, J.K. Buckling and ultimate strength of perforated plate panels subject to axial compression: Experimental and numerical investigations with design formulations. Ships Offshore Struct. 2009, 4, 337–361. [Google Scholar] [CrossRef]
Figure 1.
Schematic of dimensions of a perforated plate.

Figure 2.
Experimental jigs and overall picture of test set-up.

Figure 3.
Specimens of the perforated plate after buckling experiment.

Figure 4.
Loading and boundary conditions of the perforated plate.

Figure 5.
Mesh convergence study of perforated plate.

Figure 6.
(a) Force–axial displacement curve and (b) the three phases behavior of the perforated plate.
Figure 6.
(a) Force–axial displacement curve and (b) the three phases behavior of the perforated plate.

Figure 7.
Buckling phenomenon of perforated plates dependent on the opening ratio (a/b = 1.5 and t = 8 mm).
Figure 7.
Buckling phenomenon of perforated plates dependent on the opening ratio (a/b = 1.5 and t = 8 mm).

Figure 8.
Axial displacement/force dependent on (a) the opening ratio (D/b) and (b) slenderness ratio (b/t) at ultimate strength of perforated plate.
Figure 8.
Axial displacement/force dependent on (a) the opening ratio (D/b) and (b) slenderness ratio (b/t) at ultimate strength of perforated plate.

Figure 9.
Changes in lateral deflection of the perforated plates: (a) initial and (b) deformed conditions.
Figure 9.
Changes in lateral deflection of the perforated plates: (a) initial and (b) deformed conditions.

Figure 10.
Force–lateral deflection curve of perforated plates.

Figure 11.
Relationship between lateral deflection and axial displacement (a) dependent on aspect ratio and (b) opening ratio.
Figure 11.
Relationship between lateral deflection and axial displacement (a) dependent on aspect ratio and (b) opening ratio.

Figure 12.
Relationship between force and lateral deflection of perforated plates: (a) 66.6 (b/t) and (b) 50 (b/t)
Figure 12.
Relationship between force and lateral deflection of perforated plates: (a) 66.6 (b/t) and (b) 50 (b/t)

Figure 13.
Practical curves for estimating lateral deflection of perforated plates: (a) 66.6 (b/t), (b) 57.1 (b/t), and (c) 50.0 (b/t) and (d) correlations between lateral deflection results from experiment and practical formula.
Figure 13.
Practical curves for estimating lateral deflection of perforated plates: (a) 66.6 (b/t), (b) 57.1 (b/t), and (c) 50.0 (b/t) and (d) correlations between lateral deflection results from experiment and practical formula.


Table 1.
Chemical compositions (wt.) of selected mild steel.
| Material | Chemical Composition | ||||||
|---|---|---|---|---|---|---|---|
| C | Si | Mn | P | S | Ni | Cr | |
| Mild steel | 0.150 | 0.220 | 0.900 | 0.010 | 0.004 | 0.010 | 0.020 |
Table 2.
Scenario and dimensions of the perforated plate.
| Test Model | Plate | Opening Size | ||
|---|---|---|---|---|
| a/b | t (mm) | D (mm) | L (mm) | |
| P8-1 | 2.0 | 6 | 200 | 300 |
| P8-2 | 250 | 350 | ||
| P8-3 | 300 | 400 | ||
| P8-4 | 7 | 200 | 300 | |
| P8-5 | 250 | 350 | ||
| P8-6 | 300 | 400 | ||
| P8-7 | 8 | 200 | 300 | |
| P8-8 | 250 | 350 | ||
| P8-9 | 300 | 400 | ||
| P6-1 | 1.5 | 6 | 200 | 300 |
| P6-2 | 250 | 350 | ||
| P6-3 | 300 | 400 | ||
| P6-4 | 7 | 200 | 300 | |
| P6-5 | 250 | 350 | ||
| P6-6 | 300 | 400 | ||
| P6-7 | 8 | 200 | 300 | |
| P6-8 | 250 | 350 | ||
| P6-9 | 300 | 400 | ||
| P4-1 | 1.0 | 6 | 200 | 300 |
| P4-2 | 250 | 350 | ||
| P4-3 | 7 | 200 | 300 | |
| P4-4 | 250 | 350 | ||
| P4-5 | 8 | 200 | 300 | |
| P4-6 | 250 | 350 | ||
Table 3.
Material properties for the tested plate.
| Material | Elastic Modulus | Poisson Ratio | Yield Stress |
|---|---|---|---|
| Mild steel | 210 GPa | 0.3 | 343 MPa |
Table 4.
Result of the buckling tests.
| Test Model | At Maximum Force | At Final Position | ||
|---|---|---|---|---|
| U/t | σu/σy | U/t | w/t | |
| P8-1 | 0.653 | 0.615 | 2.504 | 10.85 |
| P8-2 | 0.613 | 0.460 | 3.258 | 5.333 |
| P8-3 | 0.568 | 0.322 | 2.309 | 4.000 |
| P8-4 | 0.654 | 0.627 | 2.146 | 11.12 |
| P8-5 | 0.507 | 0.526 | 2.627 | 5.143 |
| P8-6 | 1.051 | 0.413 | 1.957 | 3.357 |
| P8-7 | 0.905 | 0.591 | 1.880 | 8.322 |
| P8-8 | 0.788 | 0.512 | 2.344 | 3.750 |
| P8-9 | 1.305 | 0.424 | 2.335 | 2.250 |
| P6-1 | 0.740 | 0.590 | 1.678 | 8.500 |
| P6-2 | 0.950 | 0.478 | 2.001 | 5.833 |
| P6-3 | 1.467 | 0.335 | 3.334 | 3.667 |
| P6-4 | 0.654 | 0.542 | 1.439 | 8.286 |
| P6-5 | 0.801 | 0.391 | 1.740 | 4.355 |
| P6-6 | 1.321 | 0.352 | 2.226 | 3.429 |
| P6-7 | 0.745 | 0.529 | 1.273 | 6.500 |
| P6-8 | 1.189 | 0.465 | 2.001 | 4.125 |
| P6-9 | 1.484 | 0.391 | 2.500 | 2.625 |
| P4-1 | 0.500 | 0.461 | 2.615 | 10.16 |
| P4-2 | 0.598 | 0.448 | 2.003 | 7.167 |
| P4-3 | 0.583 | 0.507 | 2.193 | 10.71 |
| P4-4 | 0.596 | 0.469 | 1.549 | 5.431 |
| P4-5 | 0.626 | 0.531 | 1.391 | 6.250 |
| P4-6 | 0.620 | 0.437 | 1.503 | 1.556 |
Publisher’s Note: MDPI stays neutral with regard to jurisdictional claims in published maps and institutional affiliations. |
© 2021 by the authors. Licensee MDPI, Basel, Switzerland. This article is an open access article distributed under the terms and conditions of the Creative Commons Attribution (CC BY) license (https://creativecommons.org/licenses/by/4.0/).
Share and Cite
MDPI and ACS Style
Kim, J.-H.; Park, D.-H.; Kim, S.-K.; Kim, J.-D.; Lee, J.-M. Lateral Deflection Behavior of Perforated Steel Plates: Experimental and Numerical Approaches. J. Mar. Sci. Eng. 2021, 9, 498. https://doi.org/10.3390/jmse9050498
AMA Style
Kim J-H, Park D-H, Kim S-K, Kim J-D, Lee J-M. Lateral Deflection Behavior of Perforated Steel Plates: Experimental and Numerical Approaches. Journal of Marine Science and Engineering. 2021; 9(5):498. https://doi.org/10.3390/jmse9050498
Chicago/Turabian StyleKim, Jeong-Hyeon, Doo-Hwan Park, Seul-Kee Kim, Jeong-Dae Kim, and Jae-Myung Lee. 2021. "Lateral Deflection Behavior of Perforated Steel Plates: Experimental and Numerical Approaches" Journal of Marine Science and Engineering 9, no. 5: 498. https://doi.org/10.3390/jmse9050498
Note that from the first issue of 2016, this journal uses article numbers instead of page numbers. See further details here.