Does the New Urbanization Influence Air Quality in China?
 Yan Wu
 Zhixiang Cui2
 - 1School of Economics, Beijing Technology and Business University, Beijing, China
- 2School of Architecture and Urban Planning, Shenzhen University, Shenzhen, China
- 3School of International Development and Cooperation, University of International Business and Economics, Beijing, China
Previous studies have empirically investigated the influence of China’s urbanization on atmosphere pollution, the findings in the literature are however controversial and inconclusive across regions, data, and methodologies. This study uses the city-level panel data, 113 key cities of environment protection from the Ministry of Ecology and Environment, covering most of the provinces in China for the period 2013–2017 to investigate the different impacts of the new urbanization pilot policy on air quality and related air pollutants including six major pollutant sources, which are PM2.5, PM10, SO2, CO, NO2, and O3. The study finds that, first, based on the difference-in-difference (DID) method, the new urbanization on average tends to improve the air quality in the pilot cities. Second, based on the quantile DID method, the new urbanization tends to improve the air quality in the lower air quality quantiles (0.1–0.6); however, it has no significant impact in the higher air quality quantiles (0.7–0.9). Third, the impacts of the new urbanization on the air quality vary among different energy-related air pollutants. The new urbanization pilot policy tends to restrain SO2, PM10, and PM2.5, increase CO and O3 and has no impact on NO2. The results indicate that China should pay more attention to promote green consumption and new energy applications and increase urban construction efficiency to further reducing air pollutions in the new urbanization process.
Introduction
As China entered a stage of rapid urbanization with a large increase in urban energy demand, urban air pollution, especially smog caused by PM2.5 and PM10, had become increasingly serious and attracted wide attention from the public. In 2014, the Chinese government announced the New Urbanization Plan (2014–2020), which aimed to promote human-oriented and sustainable urban development in China, thus distinguishing itself from the past urbanization model of excessive concentration of population, destruction of the environment and excessive consumption of resources.
The new urbanization is a national strategy of China. Chinese Premier Li Keqiang said that one of the core objectives of this strategy is to integrate the concept and principles of ecological civilization into the whole urbanization process. It is not at the expense of destroying the ecology and polluting the environment, but promotes the economic, social and environmental balanced development, and pursues a new path of intensive, intelligent, green and low-carbon urbanization. The greatest feature of this plan is that it seeks to address environmental and social issues in the process of urbanization, while also laying the foundation for economic sustainable development through environmental constraints. Until now, the Chinese National Development and Reform Commission has implemented the new type of urbanization pilot policy in 61 cities at the prefecture-level in 2015 and added 19 more in December 2016, which covered most of the regions of China, involving 31 provinces and greatly boosting Chinese urbanization.
Whether China’s new urbanization conform to the environmental Kuznets curve (Grossman and Krueger, 1991), causing pollution to the atmosphere? Some studies have empirically investigated the influence of China’s urbanization on atmosphere pollution, the findings in the literature are however controversial and inconclusive across regions, data, and methodologies.
First, many studies proposed that China’s urbanization might bring some environmental issues in addition to economic growth. On the one hand, some studies have focused on the impact of urbanization on air pollution in certain areas of China. For example, based on the PM2.5 concentration data during 2000–2016 in the Chinese Yangtze River Delta region, Yang et al. found that there was a positive correlation between urbanization and PM2.5 concentrations (Yang et al., 2020). Based on the case study in Pearl River Delta of Guangdong, China, Zhang et al. found that the ozone precursors, NOx and VOC emission from vehicles, industries and power plants increased region-wide, and in particular in the newly formed prefectural municipalities (Zhang et al., 2011). Based on high-resolution urban climate simulations for evaluating the impact of urbanization on air stagnation, Li et al. found that urbanization worsened the problem of air stagnation in Shenzhen of China (Li et al., 2019). Taking the Beijing-Tianjin-Hebei urban agglomeration of China as an example, Du et al. found that economic urbanization had a much stronger influence on air quality than land urbanization or population urbanization (Du et al., 2019). On the other hand, some studies investigated the relationship between urbanization and air pollution in China as a whole. For example, based on emission inventory data from 2014, gathered from 289 cities, Fang et al. found that urbanization has played an important negative role in determining air quality in Chinese cities. The population, urbanization rate, automobile density, and the proportion of secondary industry were all found to have had a significant influence on air quality (Fang et al., 2015). By examining and comparing PM2.5 concentrations in urban and the surrounding regions, significant positive correlations were found between PM2.5 and urban population, and between PM2.5 and urban second industry fraction, suggesting that urbanization had a considerable impact on PM2.5 concentrations (Han et al., 2014). Exploring the spatiotemporal profile of PM2.5 concentrations in China from 1998 to 2016, Wang et al. verified that PM2.5 concentrations increased along with urbanization and industry, but enhancing abatement investment and clean energy consumption can reverse the increasing trend (Wang et al., 2018). Employing atmospheric models with the higher-order decoupled direct method to simulate effects of urbanization on O3, Yim et al. found that Chinese urbanization increased O3, and O3 has become less/more sensitive to unit changes in NOx and VOC emissions in various cities (Yim et al., 2019). Using full-coverage remotely sensed PM2.5 and population density data, Han et al. found that both population density and PM2.5 concentration increased rapidly from 2000 to 2014, especially in East and Central China, as well as China’s high population density urban areas and the major cities (Han et al., 2018).
Second, some other studies considered that urbanization would benefit the environment, especially reducing air pollution. For example, a case study on 17 cities in Shandong Province of China showed that the values of urban environmental entropy were negative in most cities from 2001 to 2008, which implies that there is a positive correlation between the development of urbanization and air quality (Wang et al., 2012). Using a cross-sectional data of 282 cities, Lin and Zhu found that the urbanization process has a significant and negative effect on air pollutant concentration, which means that cities with higher urbanization rate tend to have lower air pollutant concentration, including SO2, PM2.5 and PM10 (Lin and Zhu, 2018). Using China Census data on population, migration, and household fuel use for 2000 and 2010, Aunan and Wang found that the largest population-weighted exposure reduction was estimated for rural-to-urban migrants (Aunan and Wang, 2014). By extending the STIRPAT Model and using China’s provincial panel data from 2005 to 2015, Xu et al. found that the higher levels of population and land urbanization in eastern China would promote the production of sulfur dioxide and nitrogen oxides, but reduce PM2.5; the improvement of population and land urbanization in the central and western regions has reduced all air pollutants (Xu et al., 2019). Chen et al. examined the influence of land urbanization on meteorology and air quality in China’s Yangtze River Delta, finding that land urbanization results in a decrease in the PM2.5 concentration in most urban areas (Chen et al., 2020).
Third, a few others considered that in the process of urbanization, the air quality and the level of urbanization have different relations under different urbanization stages and types and in different regions. For example, based on panel data of 30 provinces in China during 2006–2015, Liang and Yang found that there is an environmental Kuznets inverted U curve between economic growth and environmental pollution, and between urbanization and environmental pollution (Liang and Yang, 2019). Using a prefecture-level panel dataset of Yangtze River Economic Belt over the period 2003–2014, Zhu et al.(2019b) found that there is no significant relationship between economic urbanization and PM2.5 concentrations, but population urbanization exerts a significant and positive effect on PM2.5 concentrations, while land urbanization shows a negative but insignificant influence (Zhu et al., 2019). Taking Beijing-Tianjin-Hebei urban agglomeration from 2000 to 2015 as an example and using a geographically and temporally weighted regression model, Liang et al. found that urbanization improved the environmental quality in mountainous areas, but aggravated the degree of local environmental pollution in plains and coastal areas (Liang et al., 2019).
Though the previous analyses show that China’s urbanization has significant impacts on air pollution, there is no directly related study on the impact of the new urbanization pilot policy on air quality and energy-related air pollutants. Therefore, the direction of the impact of the new urbanization pilot policy on air quality and pollutions is still uncertain and needs to be empirically tested further. To fill this gap, this paper is intended to empirically study the heterogeneous impact of the new urbanization pilot policy on air quality based on the difference-in-difference (DID) method and quantile DID method meanwhile investigating its impacts on different sources of related air pollutants in the pilot cities. The result of this study will help clarify the potential problems of the implementation of the new urbanization pilot policy from the perspective of air pollution sources and provide important empirical evidence and policy implications for the environmental improvement of China. The new urbanization pilot policy provides an effective quasi-natural experiment in assessing the impact of specific policy event on urban air quality.
The study has made two major contributions. First, it is the first study to access the impact of the New Urbanization pilot policy on air quality based on the DID method. This specific analysis can pinpoint whether the strategy made a significant impact. Second, it investigates that the impact of the strategy on the air varies among different energy-related air pollutants including PM2.5, PM10, SO2, CO, NO2, and O3, and varies among different quantile levels of the air quality. Such heterogeneous effects are conducive to understanding the relationship between air quality and human economic activities and making air improvement policies based on different air pollutants under the context of the new urbanization.
There are three findings from this study. First, China’s new urbanization strategy on average tends to improve the air quality in the pilot cities compared with the other key cities of environment protection where the new urbanization pilot policy has not been implemented. Second, based on the quantile DID method, the strategy tends to improve the air quality in the pilot cities at the lower quantile levels from 0.1 to 0.6, which have the higher degree of air pollution, and it has no significant impact in the pilot cities at the higher quantile levels from 0.7 to 0.9. Third, the impact of new urbanization pilot on air pollution varies among six major energy-related air pollutant sources. It tends to restrain SO2, PM10, and PM2.5 concentrations, increase CO and O3 concentrations and have no significant effect on NO2 concentration.
In the next section, we will introduce the study areas and the air quality situation. Results analyses the relationship between urbanization and air pollutions and gives a literature review. Discussion estimates the regression models for air quality and energy-related pollutions based on the DID method. Conclusion empirically assesses the impact of the new urbanization pilot policy on air quality and discusses whether the impacts vary among different energy-related air pollution sources in the pilot cities. Finally, Data Availability Statement provides the conclusion and policy implications.
Materials and Methods
Pilot Cities Distribution
For the number of cities, the sample range focused by this study is 113 key monitoring cities of environment protection from the Ministry of Ecology and Environment (previously Ministry of Environmental Protection). The problem of air pollution is more serious in these cities. In other words, both the new urbanization pilot cities of the treatment group and the non-pilot cities of the control group are within the scope of these cities. This sampling method can guarantee that the air qualities of the two groups have parallel trends before the policy event for the DID model. In addition, the Ministry of Ecology and Environment started to collect air pollutants data in key cities such as PM2.5 and PM10 from 2013.
Figure 1 shows the geographical locations of 113 key cities and 37 new urbanization pilot cities out of 113 in 2015. We find that the pilot cities almost scattered in most of the regions in China and the control group regions and the treatment group regions are overlapped.
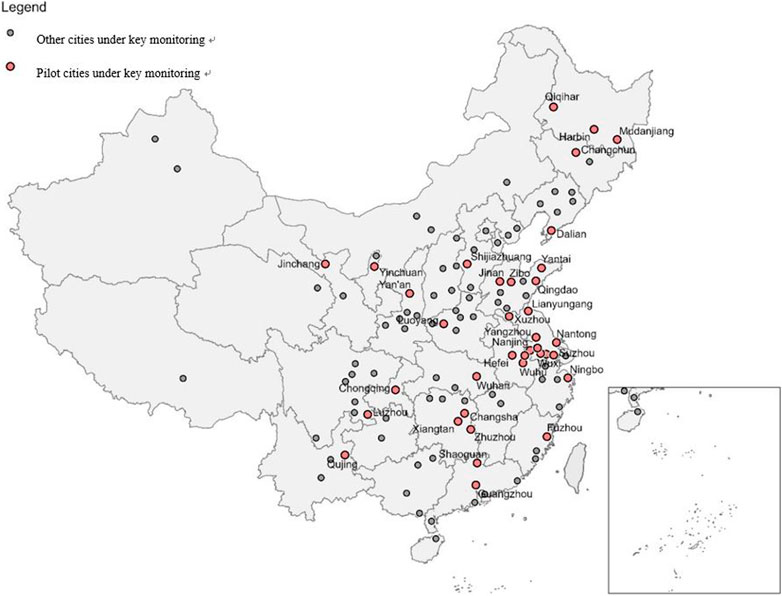
FIGURE 1. Locations of the pilot cities.
China’s air quality index consists of six major pollutants, including PM2.5, PM10, SO2, CO, NO2, and O3. The scatter plot of Figure 2 shows the distribution of the six pollutants’ levels f from 2013 to 2017 and gives a pollution standard with a horizontal line for each air pollutant. The point above the horizontal line indicates that the annual concentration of the city exceeds the pollution standard, while the point below the line indicates that the annual concentration is lower than the standard. We can find that: First, the annual average concentrations of pollutants PM2.5, PM10, and SO2 fell obviously, transforming from most above the standard to most below the standard. Second, the annual average concentration of CO has decreased, but the pollution level is still relatively lower than the other air pollutants. In addition, NO2 declined but exceeded the standard in most pilot cities, possibly due to the increased traffic and car use in China. Third, O3 pollution is absolutely contrary to other pollutants. In recent years, the O3 pollution level in pilot cities has gradually increased. By 2017, most cities have exceeded the annual average concentration. This may be related to the quick increase of Volatile Organic Compounds (VOC) in Chinese cities, and the increase of ultraviolet radiation caused by the decrease of PM2.5 and PM10 concentration, which is a necessary condition for forming the VOCs.
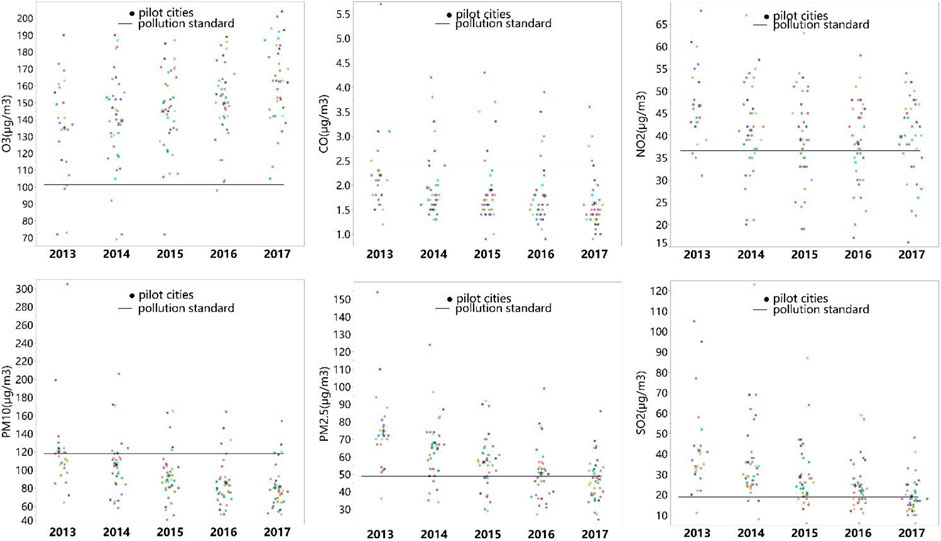
FIGURE 2. Air pollutant distribution of the pilot cities.
For depicting the changing trends, we also present the average change of six air pollutants in the pilot cities as shown in Figure 3. We can conclude that except for Ozone pollution, all the major air pollutants have been restrained so the air quality has been improved in the pilot cities.

FIGURE 3. Air pollutants in the pilot cities.
Relationship Between New Urbanization and Air Quality
In general, with the per capita income increases and economic growth, energy consumption by residents and industrial productions will increase, and related pollutions will follow up with an increase. As per capita income rises to a certain stage, people tend to use clean energy to protect the environment, and related pollution declines. Therefore, in the early stage of Chinese urbanization with the rapid growth of income, there are unavoidable air pollutions, such as CO and NO2 from traffic development, PM10, and PM2.5 from the construction industry. After a certain stage of urban development, with the improvement of people’s environmental awareness, the strictness of social regulation requirements on the environment, and the upgrading of the city’s leading industries from the manufacturing industry to the service industry, the degree of air pollution may decline (Zhao et al., 2020).
Chinese new urbanization strategy launched in 2014 is not a policy specifically designed to affect air quality but compared with the past urbanization, there are obvious differences in energy utilization and environmental protection because the new urbanization puts forward high requirements in terms of green and low-carbon transformation development and controlling the size of the urban population through four channels: intensive urbanization, intelligent urbanization, green urbanization, and low-carbon urbanization. The coordination development between urbanization and the ecological environment has become the direction of China’s new urbanization (Wu, 2018). Figure 4 shows the basic mechanism as follows.
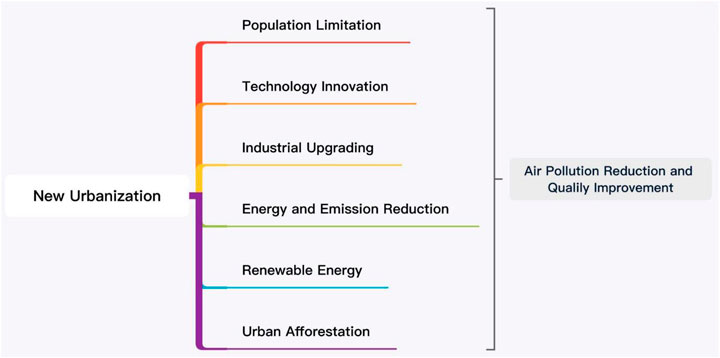
FIGURE 4. Influencing mechanism.
First, intensive urbanization requires that urban development is intensive in land resource use and development scale. In the past, China’s urbanization was always accompanied by the excessive development of land resources, resulting in land urbanization significantly faster than population urbanization. The overexpansion of some cities have not only resulted in the inefficient use of resources but also increased air pollution (Zhu et al., 2019; Han and Wu, 2020). In particular, the new urbanization pilot cities are required to promote urbanization on an appropriate scale. For example, the urban population density should be limited to about 100 people per hectare in the pilot cities. Therefore, intensive planning, construction and use of land and the limitation of population urbanization are highlighted, which lead to a more effectively and economically fossil energy use than other cities where the new urbanization pilot has not been implemented.
Second, intelligent urbanization related to green ecology requires that urban development should be accompanied by technological innovation. Nowadays, China’s new urbanization takes intelligence and green ecology as the core theory. Increasing cities have joined the planning and construction of green ecology and intelligent urbanization (Su et al., 2020). The construction of intelligent cities under the background of new urbanization bears the important national mission of green development, environmental governance, ecological civilization, and sustainable development (Niu, 2014). Based on the intelligent urbanization development such as the internet of things, cloud computing and big data, the rate of technological upgrading is getting faster and faster. Science and technology progress not only enhance the efficiency of production and management but also break the limit of time and space, realize an organic combination of the factors between production and life. Owing to the technological innovation under intelligent urbanization, the industrial structure is upgraded and energy use is more efficient, which will promote energy conservation and pollution emission reduction, thus improving the urban air quality.
Third, green urbanization requires that urbanization space and layout should fully consider the carrying capacity of resources and environment and maintain the healthy and sustainable development of urbanization (Hao et al., 2020; Wang and Chen, 2021). For example, China is constructing the “sponge cities” in the new urbanization pilot cities, which will strengthen the soil and water conservation capacity based on large-scale afforestation. Another case is the sunken green space, roof greening and surface softening movement in the pilot cities for the purification of air pollution. However, based on the green urbanization level panel data of nine provinces in the Yellow River Basin from 2006 to 2018, Shi et al. (2020) measured the green urbanization level of each province through principal component analysis and factor analysis, finding that the overall level of green urbanization in the Yellow River Basin has steadily and rapidly increased, but there are significant spatial differences. The green urbanization level of eastern provinces is significantly higher than that of central and western provinces.
Fourth, low-carbon urbanization requires a clean and efficient utilization of fossil energy, especially for the development of renewable energy (Wu et al., 2019). In addition, it requires the recycling of resources in pilot urban areas, with the focus on promoting a low-carbon lifestyle among urban residents. Wang and Shi (2019) found that low-carbon city construction can significantly reduce urban haze pollution through technological effect and environmental regulation effect. However, Liu et al. (2016) considered that in China, the urban construction closely related to the field of energy, construction, transportation operation has not formed an effective mode of low carbon development. For example, urban areas have excessive energy density and the energy structure is dominated by coal, the energy-saving potential of urban construction is not effectively developed, low carbon mode of public transport and infrastructure construction is also imperfect.
In fact, many of the pilot cities have achieved significant improvements in air quality under the guidance of the new urbanization development strategy. For example, Shijiazhuang, as a pilot of the new urbanization, has continuously promoted the transformation of emission reduction in key industries in the city. First, Shijiazhuang has promoted low-emission upgrading in the steel, cement, glass, ceramic and other related industries, and ban open burning of straw and garbage as well as fireworks and crackers. Second, Shijiazhuang has strengthened the control of dust from mines and sand fields, and the control of construction and urban dust. Third, Shijiazhuang was actively promoting the application of new energy vehicles. By the end of 2020, 80 per cent of new postal, taxi, commuter and light logistics delivery vehicles in the main urban areas have used new energy vehicles or clean energy vehicles, and all buses were replaced with new energy vehicles. Fourth, Shijiangzhuang effectively promoted clean heating by strictly controlling total coal consumption. Construction and expansion of coal - consuming projects are prohibited in the city. Fifth, the city pushed forward the relocation and closure of heavily polluting enterprises. The data show that in Shijiazhuang in 2017, PM2.5 concentration decreased by about 20% compared with that in 2016.
For another example, Guangzhou, as a pilot of the new urbanization, has continuously adjusted and optimized its industrial structure to accelerate the formation of a low-emission industrial system. First, Guangzhou attached importance to the construction of a low-carbon transportation system, and vigorously promote the construction of a network of bus lanes at more levels. Second, Guangzhou actively promoted green building and low-carbon development through the whole process of urban construction and strived to avoid large-scale demolition and construction. Third, the whole city has been designated as a coal-free zone. In addition, Guangzhou has also built an international low-carbon industrial park. The enterprise introduction standard is less than or equal to 0.398 tons of standard coal consumption per 10,000 yuan GDP. At the same time, the average annual growth rate of the industrial scale of the enterprise is more than 20%. The park has mainly attracted new energy industry, internet industry, new material industry and other low-carbon and environmental protection enterprises. The data show that Guangzhou has achieved six consecutive years of improvement in six air pollutant sources from 2015 to 2020.
Variables and Methods
We use the panel data, containing 113 key cities of environment protection from the Chinese Ministry of Ecology and Environment from 2013 to 2017, which covers 37 new urbanization pilot and also key protection cities constituting the treatment group, and 76 other key but not new urbanization pilot cities constituting the control group. The data of the air quality and the related air pollutants come from the China Statistical Yearbooks on Environment NBS (2018a), and the data of all the control variables come from the China City Statistical Yearbooks (NBS, 2018b). The basic descriptive statistics of the above variables are shown in the following Table 1.
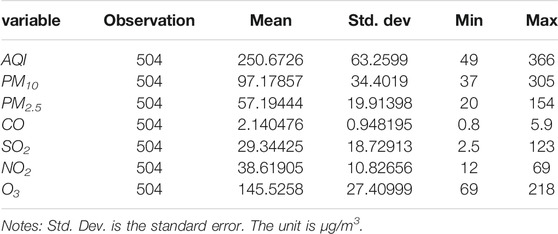
TABLE 1. The variables descriptive statistics.
According to previous studies, we control for the following variables which are expected to have impacts on air quality and related pollutants.
Urbanization is defined as the proportion of the urban population in the total population and denoted as UR. Existing studies on the relationship between urbanization and air pollution are mainly divided into three categories. First, cities lead to increased energy consumption, which in turn worsens the air. But most of this situation happens in the early stages of urbanization. Second, urbanization improves the utilization rate of public facilities and transportation, forms an industrial agglomeration, and then reduces the cost of pollution treatment, which is conducive to reducing pollution emissions. Third, more studies believe that the relationship between urbanization and air pollution is nonlinear, such as inverted U, N-shaped or U-shaped, etc (e.g., Zhao et al., 2020). Therefore, we do not prejudge the effect of urbanization on air quality.
The industrial structure is defined as the ratio of service industrial value-added over GDP and denoted as SER. Promoting the service industry with low energy consumption and high added-value is an effective way to realize the transformation and upgrading of industrial structure and it is conducive to reducing the level of urban pollution (e.g, Wu et al., 2019; Hao et al., 2020). We predicted that it has a positive effect on air quality in cities.
Per capita GDP is the natural logarithm itself and denoted as PGDP. Some scholars considered that the increase in per capita GDP will result in increased urban air pollution (e.g., Zhu et al., 2019). However, other scholars believed that there is a negative effect or inverted-U shaped relationship between per capita GDP and urban air pollution based on the Environmental Kuznets Curve (Hao et al., 2019). Therefore, we do not prejudge the effect of urbanization on air quality.
FDI is defined as the share of foreign direct investment (FDI) stock over GDP and denoted as FDI/GDP. Some scholars considered that FDI has a negative impact on urban air quality (e.g., Zhu et al., 2019). However, other scholars believed that FDI has significant spatial technological spillovers, improving air quality in China (Jiang et al., 2018). Therefore, we do not prejudge the effect of urbanization on air quality.
Technology spending is defined as the share of fiscal science and technology expenditure over GDP and denoted as TEC/GDP. Technology investment will promote technological progress, which will greatly improve production efficiency and reduce energy consumption, especially the progress of energy-saving and pollution reduction technology. We predicted that it has a positive effect on air quality in cities.
The simplest method for estimating the effects of a policy is to compare the difference before and after the policy implementation in the treatment group (the region or individual affected by the policy). This is to subtract the sample mean before the policy implementation from the sample means after the policy implementation in the treatment group. However, since the macroeconomic environment also changes over time (time effects), differences before and after the policy implementation are probably not the same as the policy effects (treatment effects). To solve this problem, we can find a control group that is not included in the policy region as a counterfactual reference, then taking the difference before and after the policy implementation of the control group as the time effects of the treatment group. We subtract the difference before and after the policy in the control group from the difference before and after the policy in the treatment group to obtain a more reliable estimate of the policy effect (Ashenfelter, 1978).
Therefore, the paper uses the above difference in difference (DID) method to investigate the impact of the new urbanization strategy on air quality and energy-related air pollutants in the new urbanization pilot cities (treatment group) by comparing the implementation of this pilot policy before and after, within and without the new urbanization pilot group in the range of key cities with air pollution from the Ministry of Ecology and Environment. Other cities that are not in the pilot range but within the key monitoring cities constitute the control group. The DID method can avoid the endogeneity problem existing in the policy as the independent variable, that is, it can effectively control the unobtainable individual heterogeneity and the influence of the unobtainable factors changing with time, and avoid the reciprocal causation between the dependent variable and independent variable. However, the difference between the regions before and after the implementation of policies may not be the treatment effects. Multiple tests, such as the parallel trend test and placebo test, are needed to judge whether the results meet the conditions for using the DID method. Also, several issues related to the validity of the method need to be clarified further.
First, this paper focuses on the new urbanization pilot cities within the key monitoring cities of environmental pollution from the Ministry of Environment Protection. In our sample period, 37 pilot cities out of 61 meet the conditions and they are almost scattered in 34 provinces of China (Figure 1). Therefore, the policy at the provincial level only affects one or two cities, it will not interfere with the overall effects of the new urbanization pilot policy. In addition, during this period there were no other major national policies that could reduce air pollution in these new urbanization pilot and also key monitoring cities with air pollution. For example, “China’s “2 + 26” urban air improvement policy (Tough battle against urban air pollution) started in 2018 and there are not similar broad emission reduction policies overlapping in our data period 2013–2017.”
Second, considering the selective bias issue, on the one hand for the DID method, selective bias generally occurs when improper grouping fails to satisfy the assumption of the parallel trend. If we choose all the other non-pilot cities in China as the control group, or we choose the non-key monitoring cities as the control group, the trends in air pollution in both groups may be completely inconsistent before the pilot policy. It may result in the biased estimation of the results and lead to the failure of the natural experiment characterized by randomness based on the DID method. However, in the range of key environmental monitoring cities, we choose the new urbanization pilot and also key monitoring cities with air pollution as the treatment group and other cities that are not in the pilot range but within the key monitoring cities as the control group, which can contribute to satisfying the parallel trend hypothesis before the pilot policy event. Therefore, based on the sampling and grouping of our study the selective bias in outcomes is inexistent. On the other hand, the choice of the new urbanization pilot cities is not concerned about the level of air quality in advance, so the sample selection is random. Its main purpose is to improve the urbanization level in China and it is not a specialized environment-improving policy. After the new urbanization pilot policy implemented, more considerations may be given to sustainable development and environmental friendliness, but there are also other key reforming areas such as the equalization of public services and optimization of economic structure in the new urbanization. Therefore, from the perspective of the pilot policy itself, there may is not sample pre-selection bias related to final air quality outcomes.
Finally, considering that the new urbanization pilot cities in the treatment group cover almost all provinces in China, the control group regions and the treatment group regions are overlapped. The propensity score matching (PSM) sampling method can only control unobservable inter-group differences that do not change with time, so the PSM method may be ineffective and not suitable for the sample in our study.
In this paper, the DID method will be adopted, and the new urbanization pilot policy in 2015 will be put forward as a quasi-natural experiment to investigate its effect on air quality and energy-related air pollutants, including PM2.5, PM10, SO2, CO, NO2, and O3. Therefore, the following DID models are constructed:
Eqs 1–7 are the DID estimation models that take time and city fixed effects into account. In all the models, i stands for the city from 1 to 113, and t stands for the year from 2013 to 2017. The dependent variables lnAQDit, lnSO2it, lnNO2it, lnPM10it, lnCOit, lnO3it, and lnPM2.5it in this paper are respectively the days of air quality equal to or above grade II (Good), SO2 concentration, NO2 concentration, PM10 concentration, CO concentration, O3 concentration and PM2.5 concentration of the new urbanization pilot cities. Postit is the dummy variable for the processing time effect of the new urbanization pilot. For Postit, the years after the implementation of the new urbanization pilot are set as 1, and the previous years are set as 0. NURi is the dummy variable for processing the treatment group, indicating whether the city belongs to the new urbanization pilot scope. If it is a city in the new urbanization pilot scope, set this variable as 1, otherwise it is 0. NURi·Postit is the interaction term between NURi and Postit, which is the core variable concerned by the DID method. Xit is a series of control variables that may cause changes in air quality and energy-related air pollutant emissions, including urbanization rate, industrial structure, per capita GDP, FDI, and Science and Technology expenditure. ψt is the year fixed effect, αiis the city fixed effects, εit is the random disturbance term.
We focus on the coefficient β of the variable NURi·Postit, whose economic implication can be explained by the impact of the new urbanization pilot on the dependent variables. Taking Model 1 as an example, if the coefficient of β is positive and statistically significant, then the new urbanization pilot tends to improve the air quality in the pilot cities. On the contrary, if it is negative and statistically significant, the pilot policy event tends to deteriorate the air quality in the pilot cities.
Results
New Urbanization Pilot and Urban Air Quality
We gradually add the city fixed effect, year fixed effect and city time trend effect. Standard errors are clustered at the city level. Compared with other regions, the air quality and energy-related air pollutants may have some inherent change trend, rather than the new urbanization development strategy effect. For example, the process of industrial upgrading to the service sector will lead to a gradual decrease in energy consumption and pollutant emissions. Ignoring the underlying trend change of dependent variables in the treatment group will produce the bias of missing variables and make the estimated results unreliable. The interaction item between city and time trends is added in column (2) of Table 2. This interaction item control for the likely trends in the treatment group. All subsequent regressions are controlled for city and time fixed effects, and due to space constraints, there may be no repeated reporting in the subsequent tables.
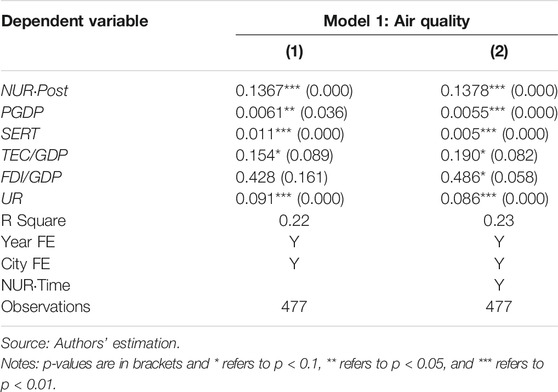
TABLE 2. The DID results for the air quality.
In Table 2, the coefficients of the interaction terms are significantly positive at the 1% level, indicating that the new urbanization strategy has a significantly positive impact on the air quality in the new urbanization pilot cities. There may be three main reasons for this finding. First, with the increase in per capita income along with urbanization, urban residents’ awareness of environmental protection is rising. Second, under the background of new urbanization, the land is no longer excessively developed and resources are no longer excessively consumed. More attention is paid to the improvement of their utilization efficiency, and the pillar industry of the city shifts to the service industry with less pollution. Third, the progress and promotion of smart cities, low-carbon and energy-saving technologies also promote the improvement of air quality in the new urbanization process.
As to the control variables, the regression results of per capita GDP and urbanization rate are positive and statistically significant, indicating that the increases of per capita GDP and urbanization rate will promote the air quality in the pilot cities. Different from the Kuznets curve, urbanization and economic development of our sample cities with relatively low or medium development levels can promote the improvement of air quality, which is may due to the green and low-carbon urbanization modes and the optimization of industrial structure in recent years. The regression results of FDI stock over GDP are positive and statistically significant, indicating that FDI has promoted the air quality in the pilot cities. The possible reason is that through technology spillovers and industry-leading effects, FDI promotes local technological progress and industrial upgrading, and promotes the reduction of energy use and pollutant emissions. Besides, the regression results of other control variables are consistent with theory and expectation.
In Table 3, we divide the air quality into nine sub-points from low to high. Based on the quantile DID method, the new urbanization strategy tends to improve the air quality at the lower and medium quantile levels from 0.1 to 0.6. However, it has no significant impact at the higher quantile levels from 0.7 to 0.9. The results indicate that the new urbanization strategy tends to improve the air quality in the lower air quality cities and has no significant impact on the air quality in the higher air quality cities. The reason is perhaps that in the pilot cities with higher air quality, the new urbanization strategy is likely to focus more on other aspects of the new urbanization such as the equal acce ss to public services for both urban and rural populations, which is another core element of the new urbanization, but focus less on air quality because of its lower air pollution level.
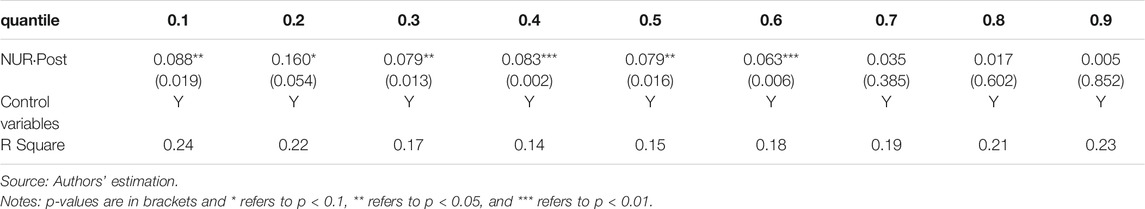
TABLE 3. The Quantile DID results for the air quality.
New Urbanization Pilot and Urban Air Pollutants
The effects of the new urbanization strategy on different sources of energy-related air pollution may vary because of the different sources. In this part, we will examine the impacts of the new urbanization pilot policy on six major air pollutants including PM2.5, PM10, SO2, CO, NO2, and O3 based on the DID method.
In Table 4, the regression results show that the variable NURPost is significantly negative at the 1 per cent level in Model 2, Model 4, and Model 7, significantly positive at the 10 per cent level in Model 5 and significantly positive at the 5 per cent level in Model 6, but negative and insignificant in Model 3, indicating that the new urbanization development strategy tends to restrain energy-related SO2, PM10, and PM2.5 concentrations, increase CO and O3 concentrations and has no impact on NO2 concentration.
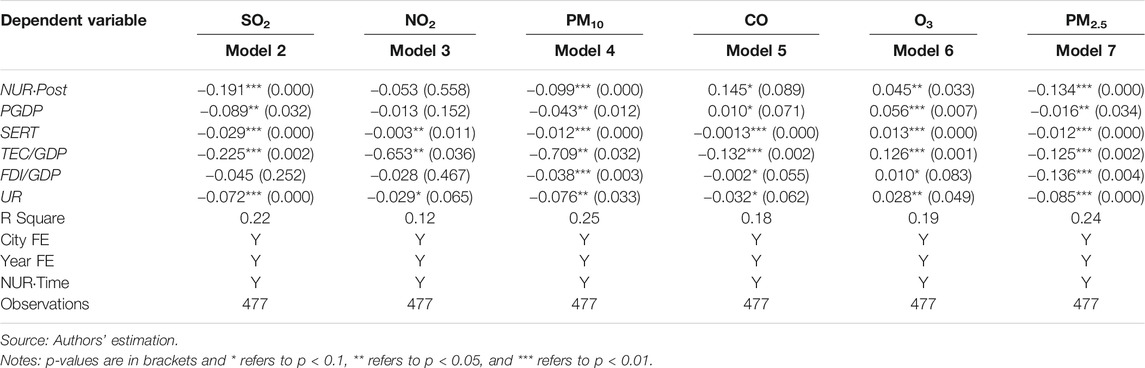
TABLE 4. The DID results for different air pollutants.
There may be several reasons for these findings. First, 90% of SO2 in China comes from industrial coal combustion. In recent years, along with the new urbanization process, the gradual reduction of coal use and the progress of emission filtration technology in urban industrial development are quite obvious, thus reducing the SO2 emissions in the urban areas. Second, China has been eliminating a large number of outdated capacities in cities, such as the steel industry, and the proportion of coal in urban energy consumption continues to decline, which are also beneficial to PM10 and PM2.5 reduction. Third, low-carbon urbanization, as well as intelligent urbanization under the new urbanization strategy, can effectively promote the improvement of energy efficiency and the use of renewable energy, and promote fossil energy conservation and pollution reduction. Fourth, more than 80% of the CO in the atmosphere of Chinese cities is discharged by fuel vehicles. The pilot cities are mainly small and medium-sized cities with lower and middle levels of urban development, and the urban residents of these cities mainly purchase fuel cars. As income rises, private car ownership and car travel rise, thereby unavoidably driving CO emissions. Fifth, in 2019, O3 has become the second-largest air pollutant in Chinese cities after PM2.5. O3 pollution occurs mostly in sunny summer, and it is more common in developed countries. For China, on the one hand, the average temperature increases because of the urban heat island effect and global warming, especially in the summer when extremely hot weather increases significantly the O3 pollutions are severe; on the other hand, the reduction of haze during the new urbanization leads to more sufficient ultraviolet rays, which can promote the synthesis of O3 between nitrogen oxides and organic volatiles. Sixth, unlike CO pollution, which mainly comes from human factors, although industrial production and automobile exhaust can cause NO2, in general, it is more likely affected by natural factors, which can be also proved from the lowest coefficient of R2 (0.12). For example, lightning can form a large amount of NO2 in thunderstorms weather. Therefore, the impact of the new urbanization strategy on NO2 is insignificant.
For the control variables, the impacts of FDI stock over GDP on CO, PM10, and PM2.5 pollutions are significantly negative, but it is significantly positive for O3 and insignificant for SO2 and NO2. Foreign enterprises in China mainly invest in labour-intensive industries and tertiary industries. Heavy industries with high SO2 and NO2 pollution are mainly Chinese state-owned enterprises. Besides, FDI can promote the industrial upgrading, technology spillover, and economic growth of the local cities, thus tending to restrain PM10, PM2.5, and CO pollutions but increase O3 concentration to some extent. The regression results of other control variables are consistent with theories and expectations.
Discussion
Data Validity and Robustness Check
First, we test whether the mean values of the dependent variable air quality between the treatment group and the control group are equal after the new urbanization pilot. The results show that the p-value equals zero from the base period, which indicates that there is a significant difference in air quality between the two groups.
Second, this paper conducts a further parallel trend check before the new urbanization pilot. DID model does not require the mean values to be the same between the control group and treatment group but hypothesizes that the trends in the treatment group and control group should be the same before the policy implementation. To support this assumption, Figure 5 shows that there is no obvious difference between the two groups in the 2 years before the implementation of the new urbanization pilot policy. It shows that before the implementation of the new urbanization pilot, the dummy variables are not statistically significant at the 5% level. Therefore, there is a parallel trend before the new urbanization pilot policy between the treatment group and control group, because the treatment effect is not distinguishable from zero before the policy event. Furthermore, from the year 2015, the impact of the policy on the air quality is positive, gradually increasing with time and is statistically significant each year. In the two years after the implementation of the new urbanization pilot policy, the effects of the policy increase from 13.8% in the year of implementation to 19.2% 2 years after implementation.
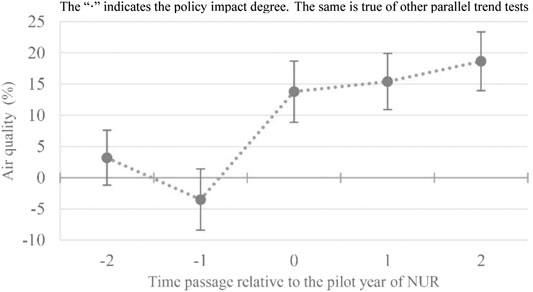
FIGURE 5. The parallel trend test for the air quality.
Third, a possible cause of estimation bias is the omission of important variables. Similar to Cai et al. (Cai et al., 2016) and La Ferrara et al. (La Ferrara et al., 2012), by randomly selecting the new urbanization pilot cities from the sample, this paper conducts a further placebo test for the results. The sample of this paper includes 113 key cities of environment protection, of which 37 are the new urbanization pilot cities. Accordingly, 37 cities were randomly selected from 113 cities and set as the pseudo treatment group, and the remaining cities are set as the pseudo control group, to build a dummy cross term variable NURifalsePostit for the placebo test. Because the pseudo treatment group was randomly generated, the placebo cross-term should not have a significant effect on the dependent variable. In other words, the regression coefficients should be overall insignificant if there is no significant deviation of the missing variable. Furthermore, to avoid the interference of other low-probability events on the estimated results, the above process was repeated 200 times for regression analysis. Figure 6 reports the estimated coefficient and the distribution of the corresponding p-value in the 200 random generation treatment group. It shows that the mean of the regression coefficients is close to zero (coefficient mean 0.0006), and most p values are greater than 0.1. Meanwhile, the vertical line in Figure 6 represents the actual estimation coefficient, which is an outlier in the estimated coefficients of the placebo test. It is proved that the improvement of air quality is not caused by other unobserved factors. In other words, the estimated results without errors caused by missing variables are robust.
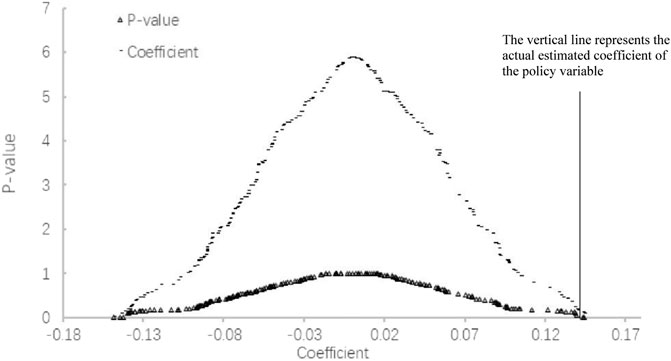
FIGURE 6. Placebo test for the robustness.
Method Rationality and Research Limitations
First, it is true that air quality in non-pilot cities has been improved because of China’s overall upgrading of industrial structure, advances in energy conservation and emission reduction technologies, and stronger environmental regulations. The parallel trend test does not require that the treatment group and the control group have opposite trends, but that the development trend in the treatment group is significantly faster than or lower than the control group after the policy. So even though the trend in both groups is upward, there may exist a faster and a slower trend in the treatment group after the policy, which can be clearly indicated in Figures 7–12.
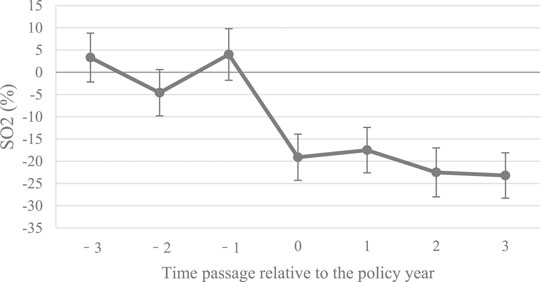
FIGURE 7. The parallel trend test for the SO2.
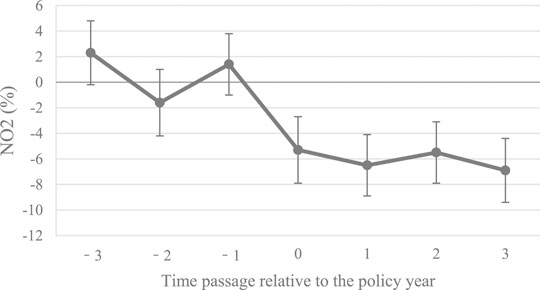
FIGURE 8. The parallel trend test for the NO2.
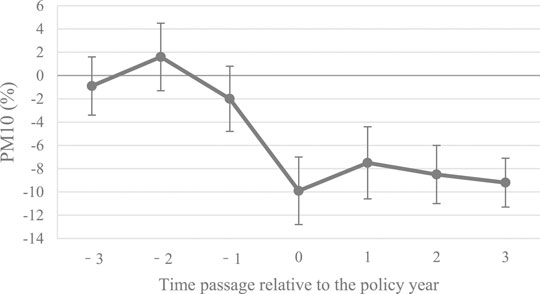
FIGURE 9. The parallel trend test for the PM10.
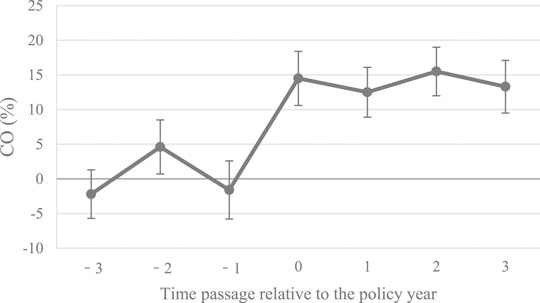
FIGURE 10. The parallel trend test for the CO.
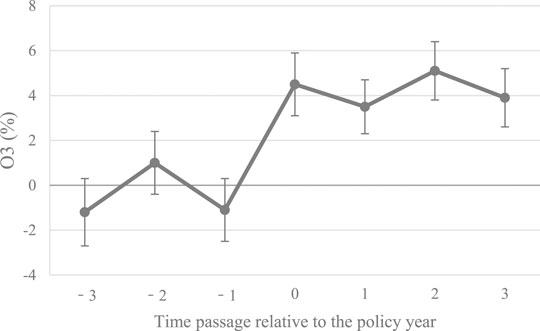
FIGURE 11. The parallel trend test for the O3.
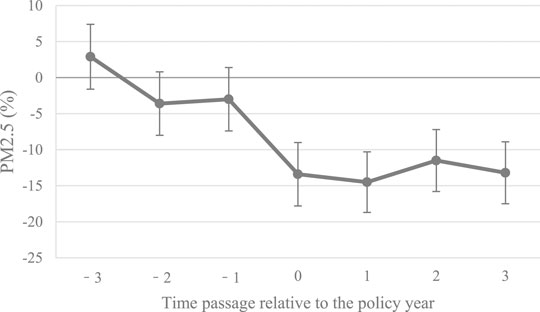
FIGURE 12. The parallel trend test for the PM2.5.
Second, although our DID model only examined the effect of the policy in the year it was implemented, we think the effect of the policy on air quality will last for a long time. China’s new-type urbanization pilot policy is not a one-year plan, but a long-term one. The goal is to promote sustainable urban development on the premise of efficient use of resources and environmentally friendly protection, and to raise the level of urbanization to the level of developed countries, with an urbanization rate of 75% by 2035.
Third, the above research has given some findings and policy implications on this topic below. However, it should be acknowledged that due to the time series is just till 2017, whether the effects of the new urbanization pilot policy on air quality and related air pollutants continue to this day is unknown. China’s Ministry of Ecology and Environment has only started to collect air pollutants in some major polluting cities since 2013. Except for the DID method, by comparing the new urbanization development of different regions, we may find out something new between China’s new urbanization and air pollution.
Conclusion
This study uses the city-level panel data, 113 key cities of environment protection from the Ministry of Ecology and Environment, covering most of the provinces in China for the period 2013–2017 to investigate the different impacts of the new urbanization pilot policy on air quality and related air pollutants including six major pollutant sources based on the difference-in-difference (DID) method and quantile DID method.
The study finds that, first, based on the difference-in-difference (DID) method, the new urbanization on average tends to improve the air quality in pilot cities compared with other cities where the new urbanization pilot policy has not been implemented. Second, based on the quantile DID method, the new urbanization tends to improve the air quality in the lower air quality cities, however, it has no significant impact in the higher air quality cities. Third, the impacts of the new urbanization pilot policy on the air quality vary among different energy-related air pollutants. The new urbanization development strategy tends to restrain SO2, PM10, and PM2.5 concentration, increase CO and O3 concentration and has no impact on NO2 concentration.
The findings of this study may generate some policy implications. In line with the United Nations Sustainable Development Goals (SDGs) of building sustainable consumption and production patterns and taking urgent action to address climate change, China should make more national efforts to control urban air pollution. For example, in the process of urban construction, China needs to promote clean energy application and increase construction efficiency to further reducing haze pollutions in big cities. Second, some small and medium-sized cities’ governments can further intensify the vehicle emission standards and extend the tax and subsidy policies designed to encourage the purchase of electric vehicles like Beijing to reduce oil consumption. At the same time, the public transportation system like subways and electric buses can be more quickly improved. Third, the Chinese urban manufacturing industry can reduce the emissions of pollutants such as NO2 and VOC that will form ozone pollution in cities. For example, from June to August when ozone pollution is high, the processes involving high VOC emissions of related industries can be stopped during the high-temperature period of the day, such as 1 PM–5 PM. Fourth, more government expenditure should be used in increasing the Urban forest coverage for improving the air pollution purifying capability in cities, which is also in line with China’s recently proposed carbon-neutral plan. Fifth, China can further develop intelligent and intensive cities from new urbanization pilot cities to other cities for increasing energy efficiencies and reducing consumption thus decreasing air pollution in cities. Finally, China can pay more attention to promote the conception of green production and consumption among urban companies and residents, upgrading urban industrial structure, facilitating the advances in energy conservation and emission reduction technologies, and implementing stronger environmental regulations to reduce pollutant emissions for dealing with potential urban air pollution issues in the future.
Data Availability Statement
The original contributions presented in the study are included in the article/Supplementary Material, further inquiries can be directed to the corresponding author.
Author Contributions
YW: Conceptualization, Methodology, Writing-Original draft preparation, Validation. ZC: Investigation, Visualization, Software. CH: Data curation, Writing-Reviewing and Editing, Supervision.
Funding
This work was financially supported by the Beijing Municipal Commission of Education (PXM2019_014213_000007, SM201910011011).
Conflict of Interest
The authors declare that the research was conducted in the absence of any commercial or financial relationships that could be construed as a potential conflict of interest.
References
Ashenfelter, O. (1978). Estimating the Effect of Training Programs on Earnings. Rev. Econ. Stat. 60, 47–57. doi:10.2307/1924332
Aunan, K., and Wang, S. (2014). Internal Migration and Urbanization in China: Impacts on Population Exposure to Household Air Pollution (2000-2010). Sci. Total Environ. 481, 186–195. doi:10.1016/j.scitotenv.2014.02.073
Cai, X., Lu, Y., Wu, M., and Yu, L. (2016). Does Environmental Regulation Drive Away Inbound Foreign Direct Investment? Evidence from a Quasi-Natural Experiment in China. J. Dev. Econ. 123, 73–85. doi:10.1016/j.jdeveco.2016.08.003
Chen, T., Li, M., Luo, L., Deng, S., Zhou, R., and Chen, D. (2020). Simulating the Effects of Land Urbanization on Regional Meteorology and Air Quality in Yangtze River Delta, China. Appl. Geogr. 120, 102228. doi:10.1016/j.apgeog.2020.102228
Du, Y., Wan, Q., Liu, H., Liu, H., Kapsar, K., and Peng, J. (2019). How Does Urbanization Influence PM 2.5 Concentrations? Perspective of Spillover Effect of Multi-Dimensional Urbanization Impact. J. Clean. Prod. 220, 974–983. doi:10.1016/j.jclepro.2019.02.222
Fang, C., Liu, H., Li, G., Sun, D., and Miao, Z. (2015). Estimating the Impact of Urbanization on Air Quality in China Using Spatial Regression Models. Sustainability 7, 15570–15592. doi:10.3390/su71115570
Grossman, G., and Krueger, A. (1991). Environmental Impacts of a North American Free Trade Agreement. Natl. Bur. Econ. Res. doi:10.3386/w3914
Han, H., and Wu, W. (2020). Analysis of Interaction Effect between New Urbanization and Intensive Land Use: Comprehensive Evaluation of Beijing-Tianjin-Hebei Urban Agglomeration Based on PVAR Model. Urban Issues 07, 11–20. (In Chinese).
Han, L., Zhou, W., Li, W., and Li, L. (2014). Impact of Urbanization Level on Urban Air Quality: A Case of Fine Particles (PM2.5) in Chinese Cities. Environ. Pollut. 194, 163–170. doi:10.1016/j.envpol.2014.07.022
Han, L., Zhou, W., Li, W., and Qian, Y. (2018). Urbanization Strategy and Environmental Changes: An Insight with Relationship between Population Change and Fine Particulate Pollution. Sci. Total Environ. 642, 789–799. doi:10.1016/j.scitotenv.2018.06.094
Hao, Y., ChenLiao, Y. F. H., and Wei, Y. M. (2019). China's Fiscal Decentralization and Environmental Quality: Theory and an Empirical Study. Environ. Dev. Econ. 25 (2), 159–181. doi:10.1017/S1355770X19000263
Hao, Y., Zheng, S. Q., Zhao, M. Y., Wu, H. T., Guo, Y. X., and Li, Y. W. (2020). Reexamining the Relationships Among Urbanization, Industrial Structure, and Environmental Pollution in China—New Evidence Using the Dynamic Threshold Panel Model. Energ. Rep. 6, 28–39. doi:10.1016/j.egyr.2019.11.029
Jiang, L., Zhou, H. F., Bai, L., and Zhou, P. (2018). Does Foreign Direct Investment Drive Environmental Degradation in China? an Empirical Study Based on Air Quality Index from a Spatial Perspective. J. Clean. Prod. 176, 864–872. doi:10.1016/j.jclepro.2017.12.048
La Ferrara, E., Chong, A., and Duryea, S. (2012). Soap Operas and Fertility: Evidence from Brazil. Am. Econ. J. Appl. Econ. 4, 1–31. doi:10.1257/app.4.4.1
Li, Z., Zhou, Y., Wan, B., Chen, Q., Huang, B., Cui, Y., et al. (2019). The Impact of Urbanization on Air Stagnation: Shenzhen as Case Study. Sci. Total Environ. 664, 347–362. doi:10.1016/j.scitotenv.2019.01.232
Liang, L., Wang, Z., and Li, J. (2019). The Effect of Urbanization on Environmental Pollution in Rapidly Developing Urban Agglomerations. J. Clean. Prod. 237, 117649. doi:10.1016/j.jclepro.2019.117649
Liang, W., and Yang, M. (2019). Urbanization, Economic Growth and Environmental Pollution: Evidence from China. Sustain. Comput. Inform. Syst. 21, 1–9. doi:10.1016/j.suscom.2018.11.007
Lin, B., and Zhu, J. (2018). Changes in Urban Air Quality during Urbanization in China. J. Clean. Prod. 188, 312–321. doi:10.1016/j.jclepro.2018.03.293
Liu, Q., Li, G., Chen, Y., and Ouyang, H. (2016). Problems and Countermeasures of Low-Carbon Urbanization in China. Chin. Popul. Resour. Environ. 26, 42–46. (In Chinese).
NBS, , NBS (National Bureau of Statistics of China) and Ministry of Ecology and Environment (2018a). China Statistical Yearbooks on Environment. (Beijing: China Statistics Press). (in Chinese).
NBS, , NBS (National Bureau of Statistics of China) (2018b). China City Statistical Yearbook. (Beijing: China Statistics Press). (in Chinese).
Niu, W. Y. (2014). Smart Cities Are the Driving Force of New Urbanization. Bull. Chin. Acad. Sci. 29, 34–41. (In Chinese).
Shi, L., Cai, Z., Ding, X., Di, R., and Xiao, Q. (2020). What Factors Affect the Level of Green Urbanization in the Yellow River Basin in the Context of New-type Urbanization?. Sustainability 12, 2488. doi:10.3390/su12062488
Su, L., Fan, J., and Fu, L. (2020). Exploration of Smart City Construction under New Urbanization: A Case Study of Jinzhou-Huludao Coastal Area. Sust. Comput. Inform. Syst. 27, 100403. doi:10.1016/j.suscom.2020.100403
Wang, H., and Shi, D. (2019). A New Type of Urbanization Is Conducive to the Alleviation of Haze Pollution: Empirical Evidence from the Construction of Low-Carbon Cities. J. Shanxi Univ. Finance Econ. 41, 15–27. (In Chinese).
Wang, K., and Chen, M. (2021). Epistemology of Green Urbanization in China. J. Urban Plann. 01, 10–17. (In Chinese).
Wang, Q., Yuan, X., Ma, C., Zhang, Z., and Zuo, J. (2012). Research on the Impact Assessment of Urbanization on Air Environment with Urban Environmental Entropy Model: A Case Study. Stoch. Environ. Res. Risk Assess. 26, 443–450. doi:10.1007/s00477-011-0493-5
Wang, X., Tian, G., Yang, D., Zhang, W., Lu, D., and Liu, Z. (2018). Responses of PM2.5 Pollution to Urbanization in China. Energy Policy 123, 602–610. doi:10.1016/j.enpol.2018.09.001
Wu, H. L. (2018). A Review of the Research on the Synergistic Development of New Urbanization and Environment under the Concept of Sustainable Development. Ind. Tech. Econ. 37, 02–105. (In Chinese).
Wu, H. T., Hao, Y., and Weng, J. (2019). How Does Energy Consumption Affect China's Urbanization? New Evidence from Dynamic Threshold Panel Models. Energy Policy 127, 24–38. doi:10.1016/j.enpol.2018.11.057
Xu, S. C., Miao, Y. M., Gao, C., Long, R. Y., Chen, H., Zhao, B., et al. (2019). Regional Differences in Impacts of Economic Growth and Urbanization on Air Pollutants in China Based on Provincial Panel Estimation. J. Clean. Prod. 208, 340–352. doi:10.1016/j.jclepro.2018.10.114
Yang, D., Chen, Y., Miao, C., and Liu, D. (2020). Spatiotemporal Variation of PM2.5 Concentrations and its Relationship to Urbanization in the Yangtze River Delta Region, China. Atmos. Pollut. Res. 11, 491–498. doi:10.1016/j.apr.2019.11.021
Yim, S. H. L., Wang, M., Gu, Y., Yang, Y., Dong, G., and Li, Q. (2019). Effect of Urbanization on Ozone and Resultant Health Effects in the Pearl River Delta Region of China. J. Geophys. Res. Atmos. 124, 11568–11579. doi:10.1029/2019JD030562
Zhang, Y. N., Xiang, Y. R., Chan, L. Y., Chan, C. Y., Sang, X. F., Wang, R., et al. (2011). Procuring the Regional Urbanization and Industrialization Effect on Ozone Pollution in Pearl River Delta of Guangdong, China. Atmos. Environ 45, 4898–4906. doi:10.1016/j.atmosenv.2011.06.013
Zhao, Z. B., Yuan, T., Shi, X. P., and Zhao, L. D. (2020). Heterogeneity in the Relationship between Carbon Emission Performance and Urbanization: Evidence from China. Mitigation Adaptation Strateg. Glob. Change 25 (7), 1363–1380. doi:10.1007/s11027-020-09924-3
Zhu, L. Y., Hao, Y., Lu, Z. N., Wu, H. T., and Ran, Q. Y. (2019b). Do economic Activities Cause Air Pollution? Evidence from China’s Major Cities. Sust. Cities Soc. 49, 101593. doi:10.1016/j.scs.2019.101593
Keywords: air quality, air pollutants, difference in difference, new urbanization strategy, China
Citation: Wu Y, Cui Z and Hu C (2021) Does the New Urbanization Influence Air Quality in China?. Front. Environ. Sci. 9:645010. doi: 10.3389/fenvs.2021.645010
Received: 22 December 2020; Accepted: 03 May 2021;
Published: 21 May 2021.
Edited by:
Tsun Se Cheong, Hang Seng University of Hong Kong, ChinaCopyright © 2021 Wu, Cui and Hu. This is an open-access article distributed under the terms of the Creative Commons Attribution License (CC BY). The use, distribution or reproduction in other forums is permitted, provided the original author(s) and the copyright owner(s) are credited and that the original publication in this journal is cited, in accordance with accepted academic practice. No use, distribution or reproduction is permitted which does not comply with these terms.
*Correspondence: Cong Hu, bshida@126.com