Hypoxia Generated by Avian Embryo Growth Induces the HIF-α Response and Critical Vascularization
 Christopher Carroll1,2
  Niklas Engström1,2
  Patrik F. Nilsson1
  Emma R. Haxen1,2
  Sofie Mohlin1,2,3 Peter Berg4
  Ronnie N. Glud5,6,7
  Emma U. Hammarlund1,2*
- 1Translational Cancer Research at the Department of Laboratory Medicine, Lund University, Lund, Sweden
- 2Lund Stem Cell Center, Lund University, Lund, Sweden
- 3Divison of Paediatrics, Department of Clinical Sciences, Lund University, Lund, Sweden
- 4Department of Environmental Sciences, University of Virginia, Charlottesville, VA, United States
- 5Hadal and NordCEE, Institute of Biology, University of Southern Denmark, Odense, Denmark
- 6Danish Institute of Advanced Study (DIAS), University of Southern Denmark, Odense, Denmark
- 7Tokyo University of Marine Science and Technology, Tokyo, Japan
Cancer research has transformed our view on cellular mechanisms for oxygen sensing. It has been documented that these mechanisms are important for maintaining animal tissues and life in environments where oxygen (O2) concentrations fluctuate. In adult animals, oxygen sensing is governed by the Hypoxia Inducible Factors (HIFs) that are stabilized at low oxygen concentrations (hypoxia). However, the importance of hypoxia itself during development and for the onset of HIF-driven oxygen sensing remains poorly explored. Cellular responses to hypoxia associates with cell immaturity (stemness) and proper tissue and organ development. During mammalian development, the initial uterine environment is hypoxic. The oxygenation status during avian embryogenesis is more complex since O2 continuously equilibrates across the porous eggshell. Here, we investigate HIF dynamics and use microelectrodes to determine O2 concentrations within the egg and the embryo during the first four days of development. To determine the increased O2 consumption rates, we also obtain the O2 transport coefficient (DO2) of eggshell and associated inner and outer shell membranes, both directly (using microelectrodes in ovo for the first time) and indirectly (using water evaporation at 37.5°C for the first time). Our results demonstrate a distinct hypoxic phase (<5% O2) between day 1 and 2, concurring with the onset of HIF-α expression. This phase of hypoxia is demonstrably necessary for proper vascularization and survival. Our indirectly determined DO2 values are about 30% higher than those determined directly. A comparison with previously reported values indicates that this discrepancy may be real, reflecting that water vapor and O2 may be transported through the eggshell at different rates. Based on our obtained DO2 values, we demonstrate that increased O2 consumption of the growing embryo appears to generate the phase of hypoxia, which is also facilitated by the initially small gas cell and low membrane permeability. We infer that the phase of in ovo hypoxia facilitates correct avian development. These results support the view that hypoxic conditions, in which the animal clade evolved, remain functionally important during animal development. The study highlights that insights from the cancer field pertaining to the cellular capacities by which both somatic and cancer cells register and respond to fluctuations in O2 concentrations can broadly inform our exploration of animal development and success.
Highlights
- O2 and HIF dynamics in ovo and in tissue during day 0–4 of avian embryogenesis.
- Early phase of in ovo hypoxia, despite the eggshell being permeable to O2.
- Hypoxia induced by early avian development facilitates correct avian development.
- Determination of the O2 diffusion coefficient over eggshell and associated membranes.
- Increased O2 consumption rates, a small gas cell, and early membrane properties facilitate the establishment of hypoxia within the porous eggshell.
Introduction
Oxygen is fundamental for the viability of adult vertebrates. However, the perceived causality between sufficient O2 and the existence of animal life overshadows a less intuitive relationship between low oxygen concentrations (hypoxia) and animal development and evolution.
Hypoxia promotes cell immaturity (stemness), which is key during cell migration, tissue formation, and tissue homeostasis (Simon and Keith, 2008). For example, mammalian blood and immune cells are continuously replenished from hematopoietic stem cells that reside in the hypoxic (<2%) bone marrow (Mantel et al., 2015); conditions that would be deemed severely hypoxic by marine biologists (Hofmann et al., 2011). In contrast, higher O2 concentrations promote cell differentiation and less versatile cell fate spectra (Vaapil et al., 2012). These insights challenge the conventional view that high O2 concentrations are permissive of the development and evolution of complex organisms, such as animals. Rather, a dualistic view on O2 appears appropriate since mechanisms for harnessing hypoxia – in niches, phases, or through cellular capabilities – might have been beneficial traits during animal evolution (Hammarlund, 2019).
The cancer field has profoundly expanded our understanding of hypoxic cell signaling in mammalian tissues by focusing on the Hypoxia Inducible Factors (HIF). This family of transcription factors regulates hypoxic responses, such as angiogenesis, during both tumor and animal development and are noted in all bilateral animal phyla (Semenza, 2012; Mohlin et al., 2017; Hammarlund et al., 2018). HIF-α subunits are constitutively translated but only stabilized during hypoxia, to then lead to a response. This linkage is exemplified by the HIF stabilization in muscle cells during anaerobic workout, which induces the formation of new blood capillaries that subsequently enhance oxygenation of the tissue (Iyer et al., 1998). A complete hypoxic response therefore relies on the combination of environmental hypoxia and a cellular HIF response. As of today, these two components are often observed and discussed separately. Hypoxia and HIF are also viewed differently in different scientific fields. Contrasting views are held by the cancer field, where hypoxia represents stress, and the field of Earth history, where hypoxia represents an ancestral normalcy. Developmental biology provides an arena in the middle, in which studies can decipher how and when life orchestrates sensing and responses to fluctuations in O2.
It remains generally unexplored when and how environmental hypoxia and HIF responses are established and interact during early animal development. Considering that a hypoxic environment is inferred to be important for proper mammalian development and that HIF responses are inferred to be critical for vertebrate organ development (Tian et al., 1998; Dunwoodie, 2009; Niklasson et al., 2020), avian development offers a conundrum by occurring within a porous, O2-permeable membrane (the calcareous eggshell). The early embryo is an almost planar and two-dimensional (2D) piece of tissue (e.g., 5 cell layers thick at HH8, Hamburger and Hamilton, 1951), where most cells will be exposed to ambient O2 concentrations within the egg. How, then, are its hypoxia-dependent processes first established? One such hypoxia-dependent process is the development of blood vessels. In theory, vascularization should be hampered by the eggshell being permeable to O2. Still, as early as embryonic day (E) 2–3, the avian vascular system develops underneath the porous eggshell (Mortola, 2009).
Here, we hypothesize and explore the potential existence of an early phase of environmental hypoxia within chicken eggs and investigate whether such a phase, combined with HIF stabilization, facilitates correct development of the embryo. To address these questions, we determine O2 transport over the eggshell through two technically independent methods. We also determine O2 dynamics within the gas cell above the developing embryo (in ovo) and in the embryonic tissues (ex ovo) through microelectrode measurements. We note a phase of severely hypoxic conditions evolving in the first or second day of embryogenesis (E1-E2) and estimate how this phase is driven by increased O2 consumption rates (VO2). We further demonstrate the increase of HIF-α protein levels in the embryo at the phase of hypoxia and how incubation of eggs at normoxia (21%) over the first 4 days negatively affects avian embryogenesis.
Materials and Methods
Direct Determination of O2 During Early Embryogenesis, in ovo and in Tissue
Domestic Lohman Brown chick (Gallus gallus) eggs were delivered fresh to the laboratory (fertilized and unfertilized). O2 concentrations within the gas cell of the eggs (in ovo) during the first 4 days of incubation and development were quantified using Clark type O2 microelectrodes, with an internal reference and guard cathode maintaining low O2 levels in the internal electrolyte (Revsbech, 1989). Microelectrodes with tips of 5–10 μm were utilized (Unisense Ox-10). The dimensions of fertilized eggs were measured, a small hole (∼2 mm) was drilled through the shell in the blunt end of the egg without rupturing the inner membrane, and the eggs were mounted with the blunt end down on a stand next to a micromanipulator with the microelectrode (Figures 1A,B). The hole was covered (Parafilm) to avoid leakage and enable an additional sensor calibration at the end of the experiment. The microelectrode was introduced into and upward through the egg to a position in the gas cell ∼1–2 mm below the upper eggshell surface. The gas cell is normally positioned at the blunt tip of the egg, but in our setup moved to the pointed tip (and the hole drilled in the blunt tip). To maintain 37.5°C around the egg during measurements, heating wires connected to a thermostat were placed on the stand and the whole setup was insulated with a Styrofoam box (Supplementary Figure 1). Microelectrode data were recorded using the SensorTrace Suite Software. Temperature (T), and relative humidity (RH) inside the incubator were recorded with a HOBO MX temp RH logger, and software. The microelectrode continuously recorded the change in O2 concentrations within the egg’s gas cell during incubation. To calibrate the electrode after the measurements, two holes (0.2 mm) were drilled through the eggshell at the pointy end of the egg, into which first (a) 100% air, and then (b) 100% N2 was injected with a gas-tight glass syringe. The microelectrode readings during injections served as calibration points for (a) ∼21% and (b) 0% O2. After opening the egg, the development of the embryo and the position of the tip of the glass electrode were noted. In parallel, microelectrodes were used to record O2 concentrations within embryonal tissues (ex ovo), sampled from the first four days of incubation and development (Figure 1C). The oxygenation status of the embryonal tissue was determined using the same experimental setup as described in Niklasson et al. (2020). At each developmental stage between HH10 and HH24 as defined by Hamilton-Hamburger (HH) (Hamburger and Hamilton, 1951), embryos (n ≥ 3) were extracted and O2 was immediately measured in four positions. In each embryo, O2 levels were determined in the sacral region (tail), the head, the heart, and the vagal region (back).
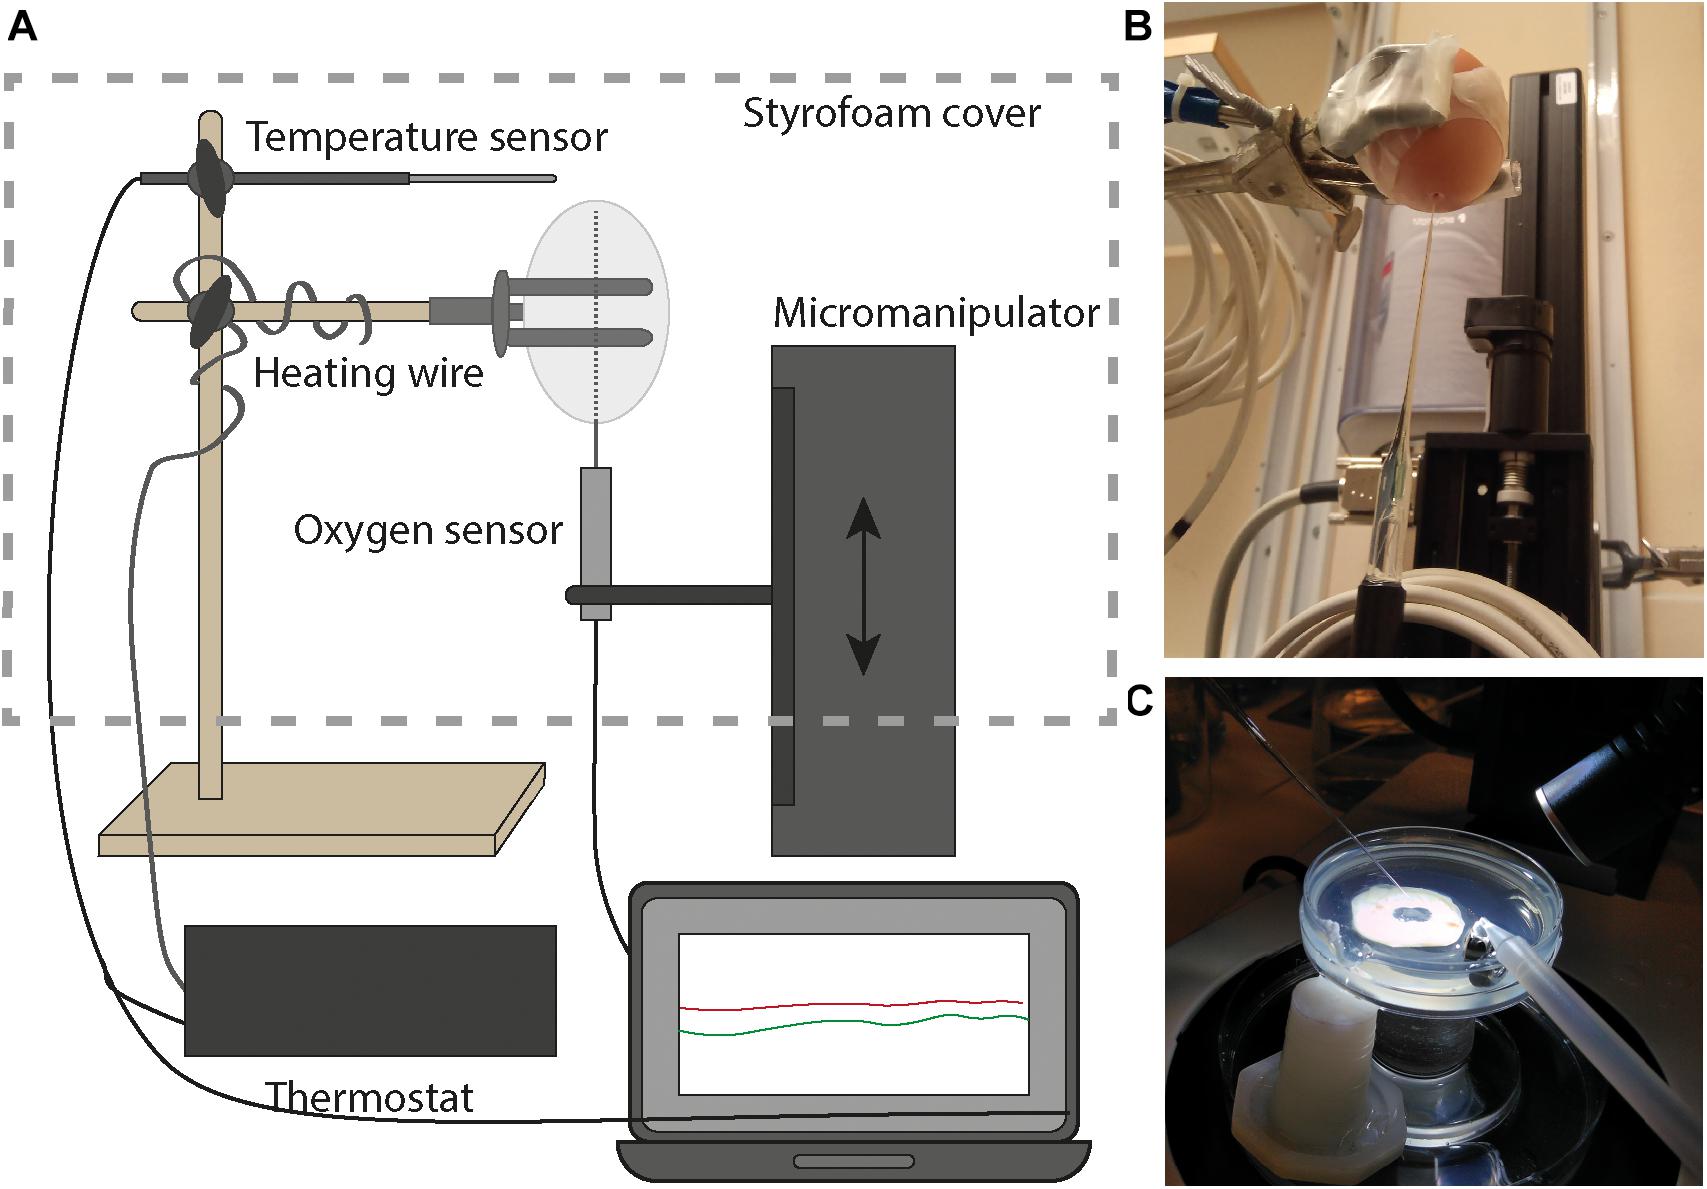
Figure 1. Experimental setup for the direct quantification of O2 concentrations in the egg and embryo. (A) During incubation, microelectrodes were logging measurements in ovo and temperature was maintained in a Styrofoam bell jar. (B) The microelectrode mounted on the micromanipulator entered the egg from below. (C) Microelectrodes determined O2 concentrations within the embryo tissues ex ovo immediately upon opening, as described in Niklasson et al. (2020).
HIF Protein Levels
Fertilized eggs were incubated for 2–5 days after which embryos were harvested for determination of protein expression. Upon opening the eggs, the developmental stage of embryos HH was determined using morphological features and the number of somites. Embryos and allantois were dissected and separated. The samples were subsequently pooled for different developmental stages (three replicates of 10–35 embryos for each sample). Samples were kept on ice, homogenized in a cooled tissue lyser (100 μl urea lysis buffer mixed with protease and phosphatase inhibitor cocktails) and stored at −80°C. Determination of protein expression was performed using western blotting. Cell lysates (70 μg) were separated by 10% SDS-PAGE (BioRad), transferred to nitrocellulose membrane, blocked with blocking buffer (BioRad), and imaged on a Biorad Chemidoc, using antibodies for HIF-1α (NB100-479 at dilution 1:500) and HIF-2α (ab199 at dilution 1:4000), normalized to b-actin (12004163).
Exposing Early Avian Development to Normoxia
A hole (∼2 mm) was carefully drilled in the blunt end of fertilized eggs. The hole was drilled at an angle to prevent it from becoming covered by dried albumen during incubation, and shell membrane covering the holes was removed (Supplementary Figure 2). These eggs and control eggs were incubated in a humidity chamber to maintain full RH inside the eggs at 37.5°C for 2, 3, 4 and 5 days (n = 20–40 in each group and day, see Supplementary Table 3). At each endpoint, the developmental stage (HH; by morphology and number of somites) and the diameter of the surficial vascular system (allantois) were noted. Viable embryos were checked for possible developmental abnormalities. To simulate a 21% O2 excess and test whether delayed development was caused by the drilled hole rather than the normoxia, some eggs (n = 20) were incubated unopened at 40% O2 for 3 days. To test the effect of environmental hypoxia, eggs were also incubated for 1 to 3 days at 10% O2 while opened (n = 20) and unopened (n = 20).
Quantification of the O2 Diffusion Coefficient of Eggshell
To fully understand O2 dynamics within the egg, we determine the O2 transport across the eggshell. O2 diffusion across the eggshell is driven by differences in O2 concentration on its in- and outside. Under quasi-steady state conditions, the diffusive O2 flux (F) can be expressed by Fick’s first law of diffusion (1).
Where F is the diffusive flux of O2 (mol m–2 s–1), DO2 the diffusion coefficient of O2 in the eggshell material (m2 s–1), and the O2 concentration gradient (mol m–4) across the eggshell. Here, we assume that a majority of the resistance is in the eggshell proper. Eq. 1 can be approximated as Eq. 2.
Where C is the O2 concentration in the gas cell inside the egg, Camb the constant O2 concentration imposed on the outside of the egg, and Δz is thickness of the eggshell. Using this approximation in a mass balance equation for the gas cell inside the egg, we get Eq. 3.
Where A (m2) is the eggshell area around the gas cell and V (m3) is the volume of the gas cell. Eq. 3 has the analytical solution Eq. 4.
Where Ci is the initial O2 concentration in the gas cell (t = 0). From rearranging Eq. 4, we get Eq. 5.
Where a is a known constant equal to Eq. 6:
DO2 (the value sought) is a simple fitting constant that can be determined by least-square fitting of experimental data. We determined DO2 based on empirical data from two independent approaches, one direct (using the microelectrodes) and one indirect (based on water vapor).
Direct Quantification Using Microelectrodes in ovo
We used microelectrodes to determine DO2 of the eggshell. Microelectrodes with tips of 5–10 μm were custom made and calibrated at the Hadal Center at University of Southern Denmark. The microelectrode was mounted on a motor-driven micromanipulator and introduced into and upward through the egg, as described above. The upper part of the egg was covered with a glass bell jar, sealed well below the gas cell (Supplementary Figure 3). The bell jar was connected to air or 100% N2 that passed through two gas washers to maintain 100% RH (Supplementary Figure 4). The lower rim of the bell jar was sealed to the egg with a paste, through which a needle allowed gas escape. Microelectrode data were logged (Pyrofix software), as was temperature (HOBO MX temp RH logger). The setup settled for about 10 min with flow of air (∼21% O2) while logging the microelectrode data. Subsequently, a switch was turned to quickly replenish the air with 100% N2. The microelectrode continuously recorded the change in O2 concentrations within the egg’s gas cell. After reaching 0% O2 in the gas cell, the switch was turned again, and the bell jar quickly re-filled with air. This was repeated 4–6 times per egg (n = 9). Calibration was performed as described above. After calibration, the top of the egg was opened, and height (max from eggshell at the pointy end to yolk) and diameter of the gas cell were measured with a caliper.
Indirect Quantification via the Water Diffusion Coefficient for the Eggshell
To complement the direct microelectrode approach, we quantified the H2O diffusion coefficient (DH2O) for the eggshells and converted this value to DO2. Unfertilized eggs (n = 59) were weighed on arrival and incubated for 3 to 9 days at 37.5 ± 0.2°C and 22.8 ± 0.2% RH. During this time, they were weighed at the same time every day. At the end of the experiment the width, heights and shell thickness of the eggs were measured using a caliper. The water evaporation rate over the entire eggshell area was assessed from the weight loss during the four days of incubation.
To calculate the diffusion coefficients, we made the following assumptions: (a) the weight change is constant between weight measurement points (interpolated linearly), (b) the diffusion coefficient is constant over time, (c) only water evaporates and across the entire eggshell area, (d) RH inside the egg is 100%, and (e) eggshell thickness is uniform. Assuming equal temperature inside and outside and 100% RH inside the egg, the water vapor concentration difference over the eggshell was calculated using the Arden Buck relation. To calculate the water vapor diffusion coefficient of eggshell, we re-applied (2). Assuming that the concentration gradient is in steady state, (2) can be rewritten as (7):
Where ΔN is water loss (moles), Δz is eggshell thickness (m), ΔC is concentration difference of water vapor over the eggshell (mol m–3) which is derived from RH, A is the whole area over which water vapor can diffuse (m2), and Δt is time between measurements (s). ΔN can be calculated from the weight loss measured over time. The area of each egg A was estimated by dividing its area into two ellipsoids, using its measured dimensions (Supplementary Figure 4B).
By measuring multiple eggs, an average value of the DH2O of eggshell could be determined, allowing the conversion to DO2. At 310K and 1 atm, DO2 (O2 in air) = 0.2196 cm2 s–1 and DO2 (water in air) = 0.2267 cm2 s–1, yielding a ratio of 0.9686 (Higgins and Binous, 2013).
Determining O2 Consumption
The chick embryo’s oxygen consumption (VO2) creates an O2 pressure gradient, resulting in the flux of oxygen across the eggshell (Mortola, 2009). To assess the O2 dynamics within the intact gas cell of the egg over time, we must combine the recording of O2 concentrations with our assessments of the continuous influx of O2 over the porous eggshell. We here ignore O2 that is supplied to the gas cell from the egg white. Although O2 is also transported from the egg white to the gas cell, we evaluate that the significantly slower diffusion of O2 in liquid compared to gas allows us to ignore the O2 contribution from the egg white. Thus, to determine the influx of molar O2 over time, we assumed that O2 only diffuses into the gas cell of the egg from the outside. The gas cell is located at the top of the egg in the setup used here. The transport into the egg gas cell is estimated using Eq. 8.
Where J is diffusive transport (mol s–1), DO2 is the diffusion coefficient (m2 s–1), A is the area of the gas-cell eggshell area (m2), ΔC is the difference in O2 concentration (mol m–3), and Δz is the eggshell thickness (m). The area increases over incubation, and to estimate this, we measured the increase of gas-cell volume inside the eggs over incubation. The volume of the gas cell was regularly measured by breaking the eggs open underwater, one side at a time, and funneling the air to an upside-down graduated cylinder filled with water. The evacuated gas was measured with that measuring flask. Overall, these estimates of the molar flow of O2 over the eggshell, allow us to evaluate overall VO2 during the first days of embryogenesis.
Results
In ovo O2 Measurements During Incubation Using Microelectrodes
Oxygen concentrations in the gas cell of unfertilized eggs were in equilibrium with air for up to 4 days in the incubator (Supplementary Figure 5 and Supplementary Table 1). By contrast, fertilized eggs exhibited lower and variable O2 concentrations in the gas cell during this time (Figure 2A and Supplementary Table 2). At E1 or E2, O2 decreased to 10–50% of the starting levels. The distinct decrease in O2 concentrations lasted for 6–24 h, after which O2 levels increased but remained below the initial values until the end of the experiments (by E5 at the latest). All embryos had developed and were alive by the end of the experiment. Out of four eggs incubated over E3, three recorded a slight increase in gas-cell O2 concentrations at E3.5.
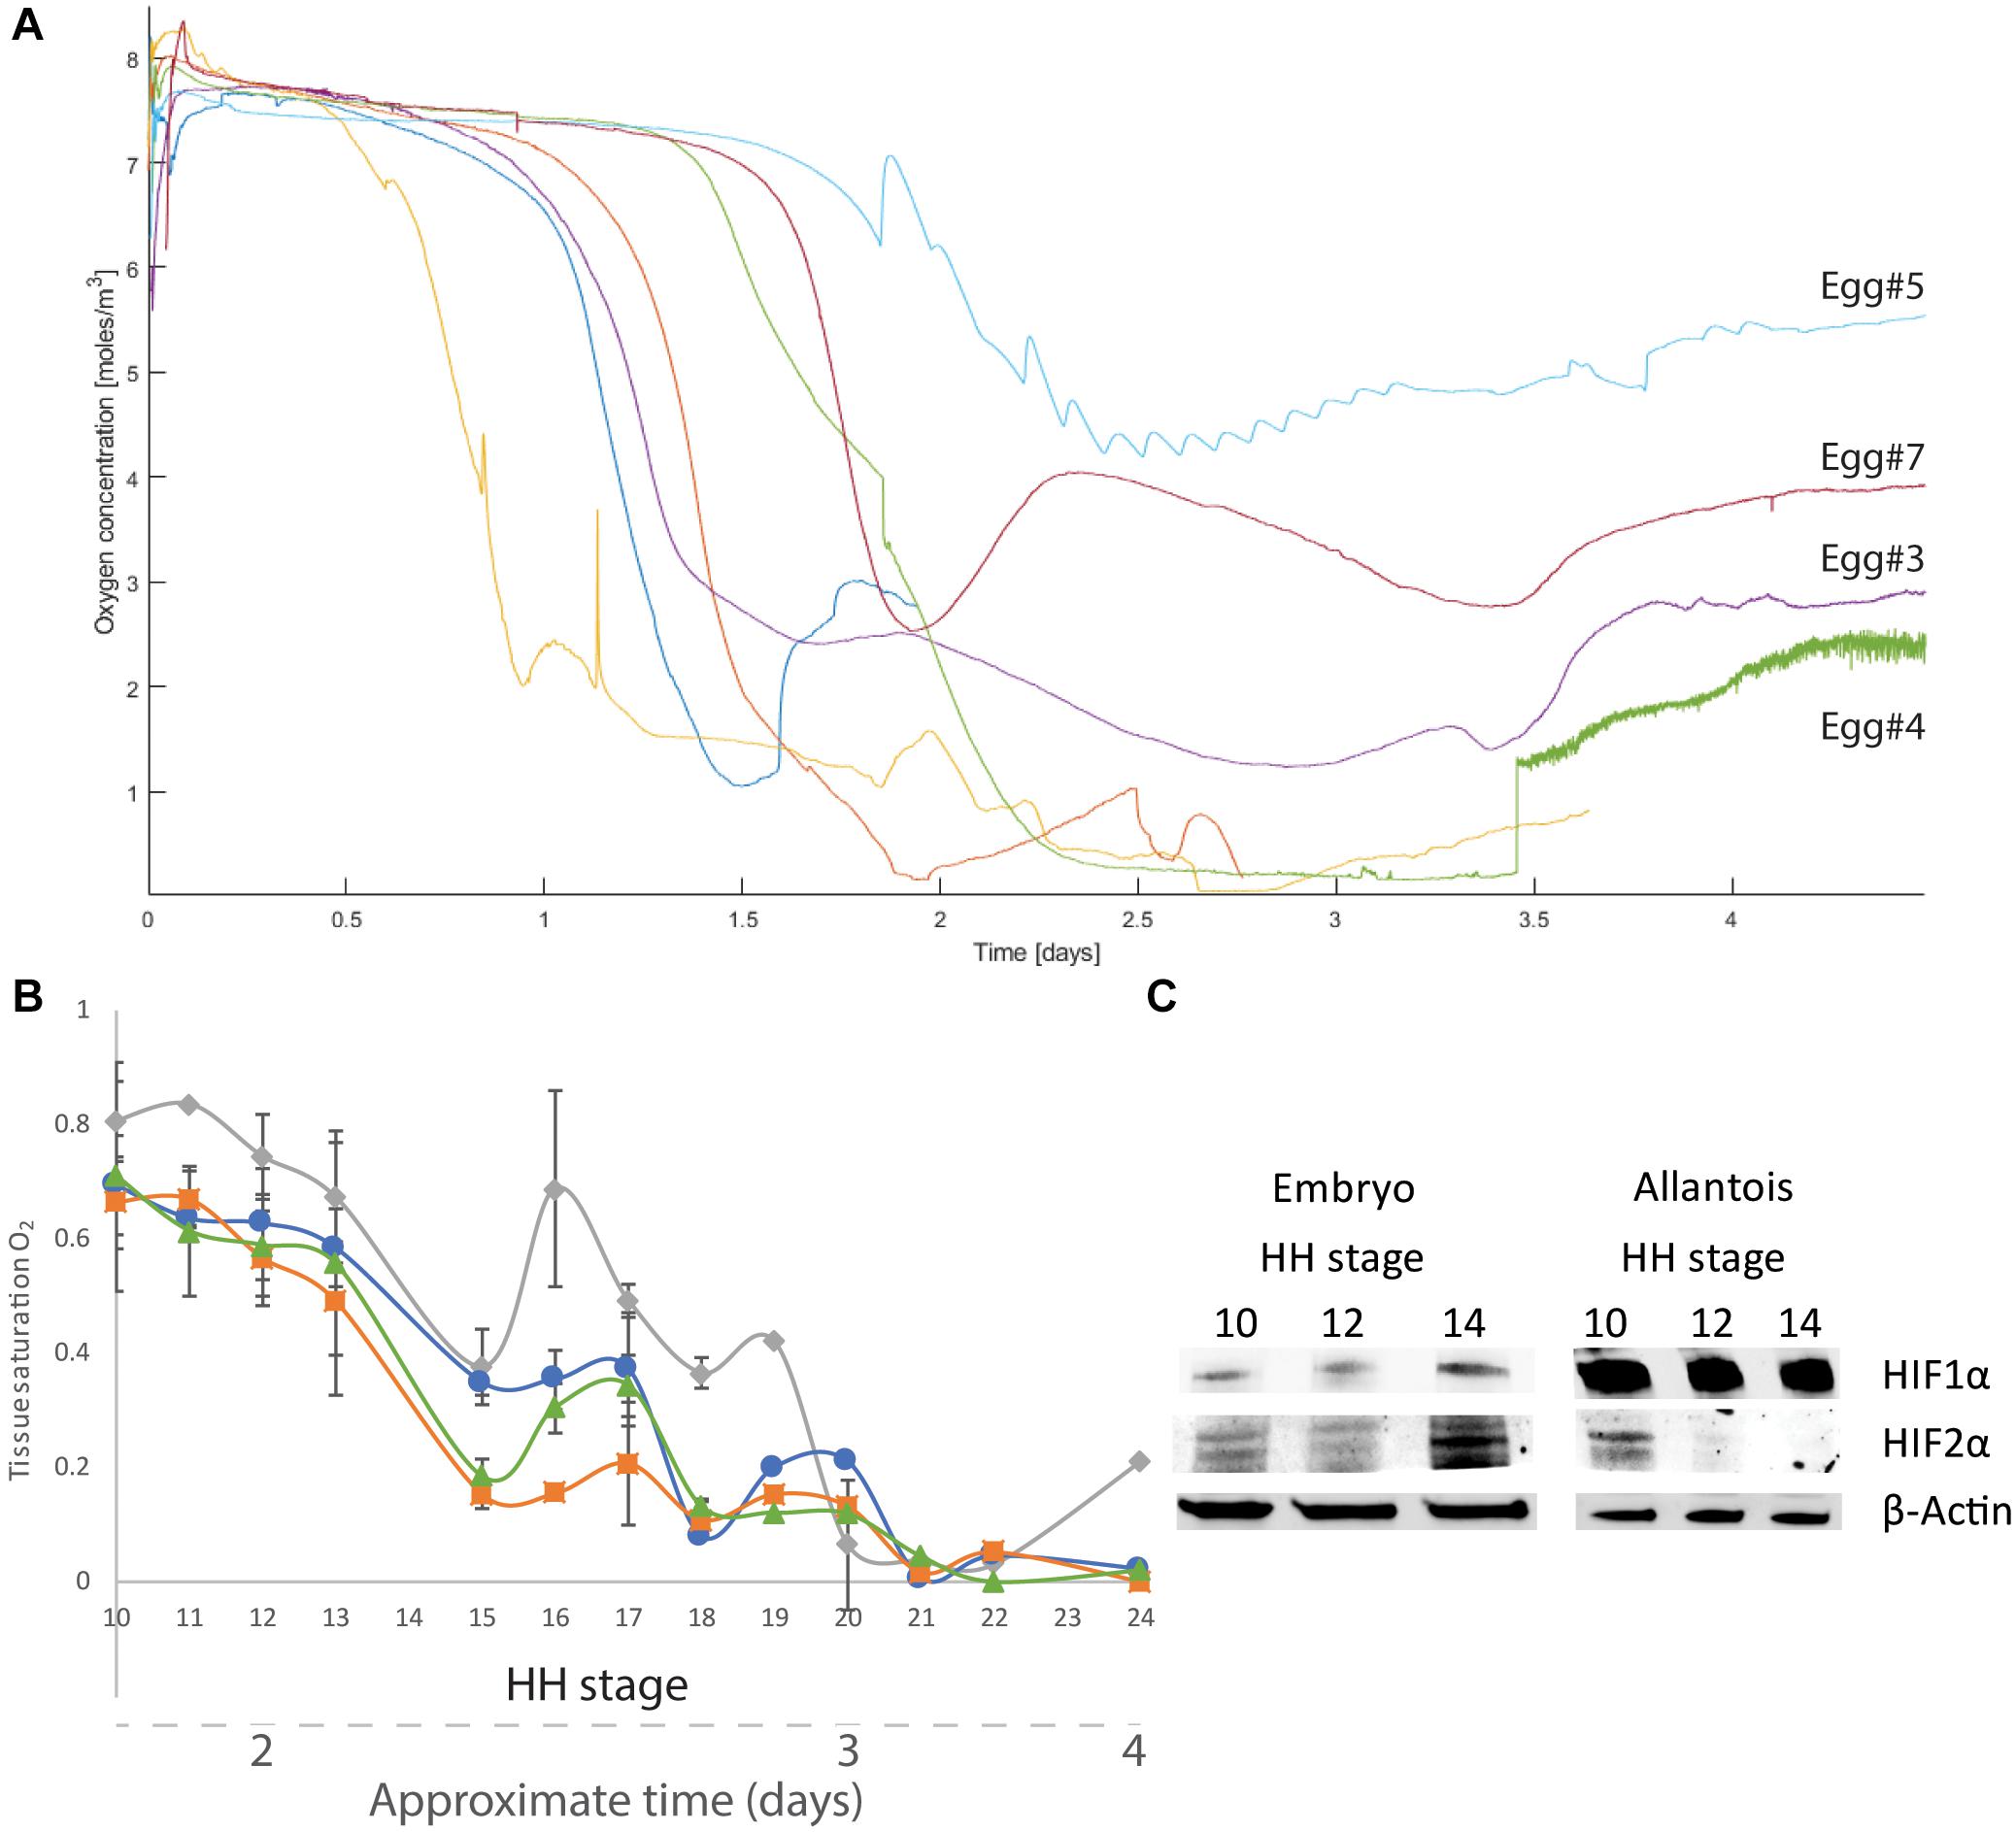
Figure 2. O2 concentrations near and in the embryo as well as HIF-α expression. (A) During incubation of fertilized eggs (n = 7), the gas cell saw a decrease in O2 concentrations. (B) Tissue O2 within the embryo measured ex ovo immediately after opening (full saturation under 21% atmospheric O2 = 1). From HH10 (approximately E1) to HH24 (approximately E4), oxygenation in the sacral region (gray diamonds), head (blue circles), heart (green triangles), and vagal region (orange squares) demonstrate a decrease in O2 (black bars represent standard error). (C) HIF expression based on whole-embryo samples. Expression of HIF-1α and HIF-2α is lower in samples from developmental stages HH10 and HH12 than in samples from stage HH14. In samples of the allantois, HIF-1α is strongly expressed from HH10 to HH14, while HIF-2α expression is detectable at HH10 but absent thereafter.
Measurements of tissue oxygenation over the same time period demonstrated an overall decrease from near fully saturated at developmental stage HH10 (∼30 h or E1) to 20–30% of full saturation at HH 15 (∼E2), corresponding to atmospheric O2 concentrations of 4–8% (Figure 2B). At developmental stage HH24 (∼E4), O2 is <10% of full saturation, corresponding to atmospheric O2 concentrations of 2% or less. The trend of tissue O2 decreasing from nearly fully saturated to what corresponds to <2% of atmospheric O2 concentrations is observed in the tail (sacral region), heart, back (vagal region), and head.
HIF Protein Levels
HIF expression was investigated in both whole-embryo lysates and surrounding allantois. HIF-1α and HIF-2α expression increased between the HH10 and HH14 developmental time points in the embryos. HIF-1α expression was threefold and HIF-2α expression was fourfold higher in HH14 than HH10. Expression of HIF-1α was high in allantois at all stages, whereas HIF-2α was only expressed at HH10 (Figure 2C).
Exposing Early Avian Development to Normoxia
To test the importance of the hypoxic phase, eggs were incubated with a drilled hole such that early development occurred under atmospheric O2 (21%). Embryogenesis under atmospheric O2 for up to 5 days led to increased death rates of the embryos, compared to endogenous conditions. Average death rates for embryos incubated for 2–5 days were 7.5% for control and 59.8% for those with an opening (Figure 3A). Viable embryos in the opened eggs were significantly delayed in their development (Figure 3B) and their vascular system (allantois) was significantly smaller (Figure 3C) than that of embryos in the intact eggs (for statistical tests see Supplementary Table 3). The vascular systems of embryos in eggs with an opening to air (21% O2) were morphologically deformed compared to those of control embryos (Figure 3D and Supplementary Figures 6, 7). Embryos incubated for 3 days at 40% O2 in unopened eggs demonstrated a similar delay in development as for opened eggs, that is significant (Supplementary Table 4). Embryos in opened and unopened eggs that were incubated at 10% O2 were at a similar developmental stage at E1 but all dead at E3 (Supplementary Table 4).
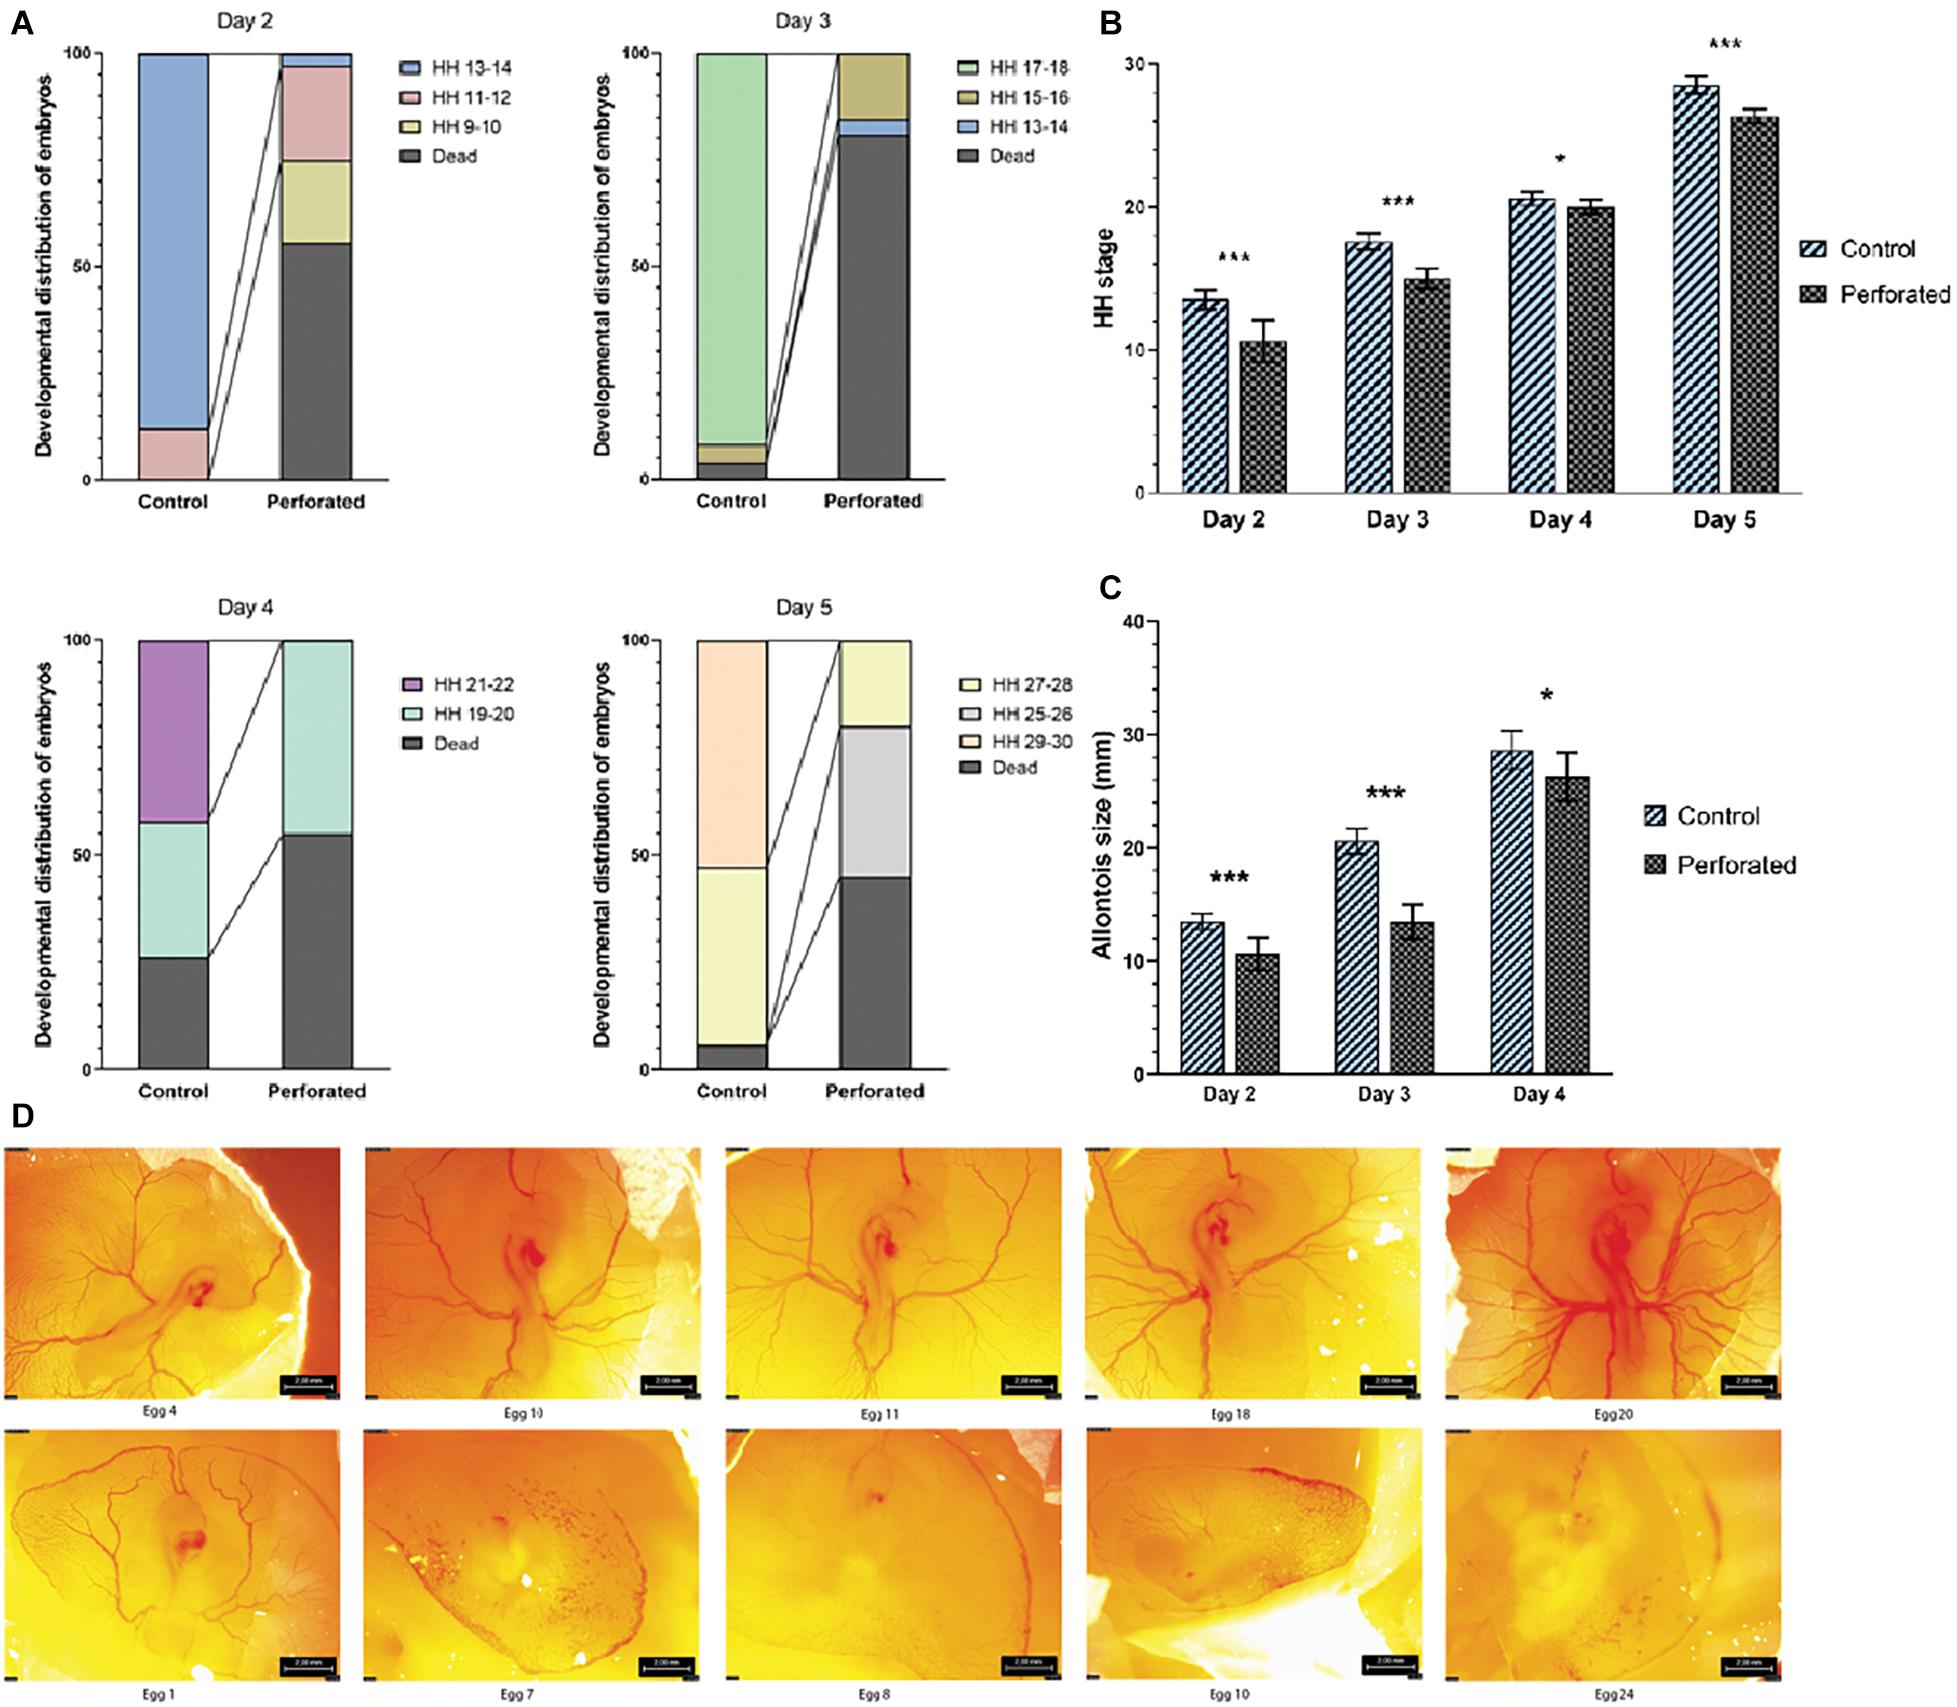
Figure 3. Developmental effects of exposure to atmospheric O2 during early embryogenesis. (A) The death rates (%) and developmental stage (HH) in treated (perforated) and control groups at day 2–4 of incubation. (B) The delay in developmental stage of living embryos is significant. (C) The surficial vascular system (allantois) diameter of embryos in the control group and the perforated group after 2 and 4 days of incubation. (D) Normal avian development after 3 days of incubation (upper) and after full access to atmospheric O2 (lower). Scale bar: 2 mm. Error bars represent standard deviation. The asterisks denote a significant difference obtained through Mann-Whitney U tests for HH stages (discrete) and Welch’s t-test for allantois size (continuous): *p ≤ 0.05; ***p ≤ 0.001. For Day 2: Ncontrol = 33, Nperforated = 16, U = 34.5. For Day 3: Ncontrol = 23, Nperforated = 5, U = 2. For Day 4: Ncontrol = 14, Nperforated = 9, U = 27. For Day 5: Ncontrol = 16, Nperforated = 11, U = 14.
Quantification of the O2 Diffusion Coefficient of Eggshell
To understand the generation of the observed hypoxia, O2 diffusion and flux over the eggshell was investigated. Continuous measurements of O2 inside the gas cell after shifting ambient O2 levels from 21 to 0% demonstrated that O2 diffuses out of the gas cell over the eggshell within ∼20 min (Figure 4A and Supplementary Table 5). The eggshell thickness was on average 0.4 mm (0.39⋅10–3 ± 0.04⋅10–3 m) and its area on average 71 cm2 (7.1⋅10–03 ± 0.3⋅10–03 m2). Based on these data, DO2 was determined as 3.37⋅10–09 0.14*10E−9 m2 s–1 (Figure 4B, crosses).
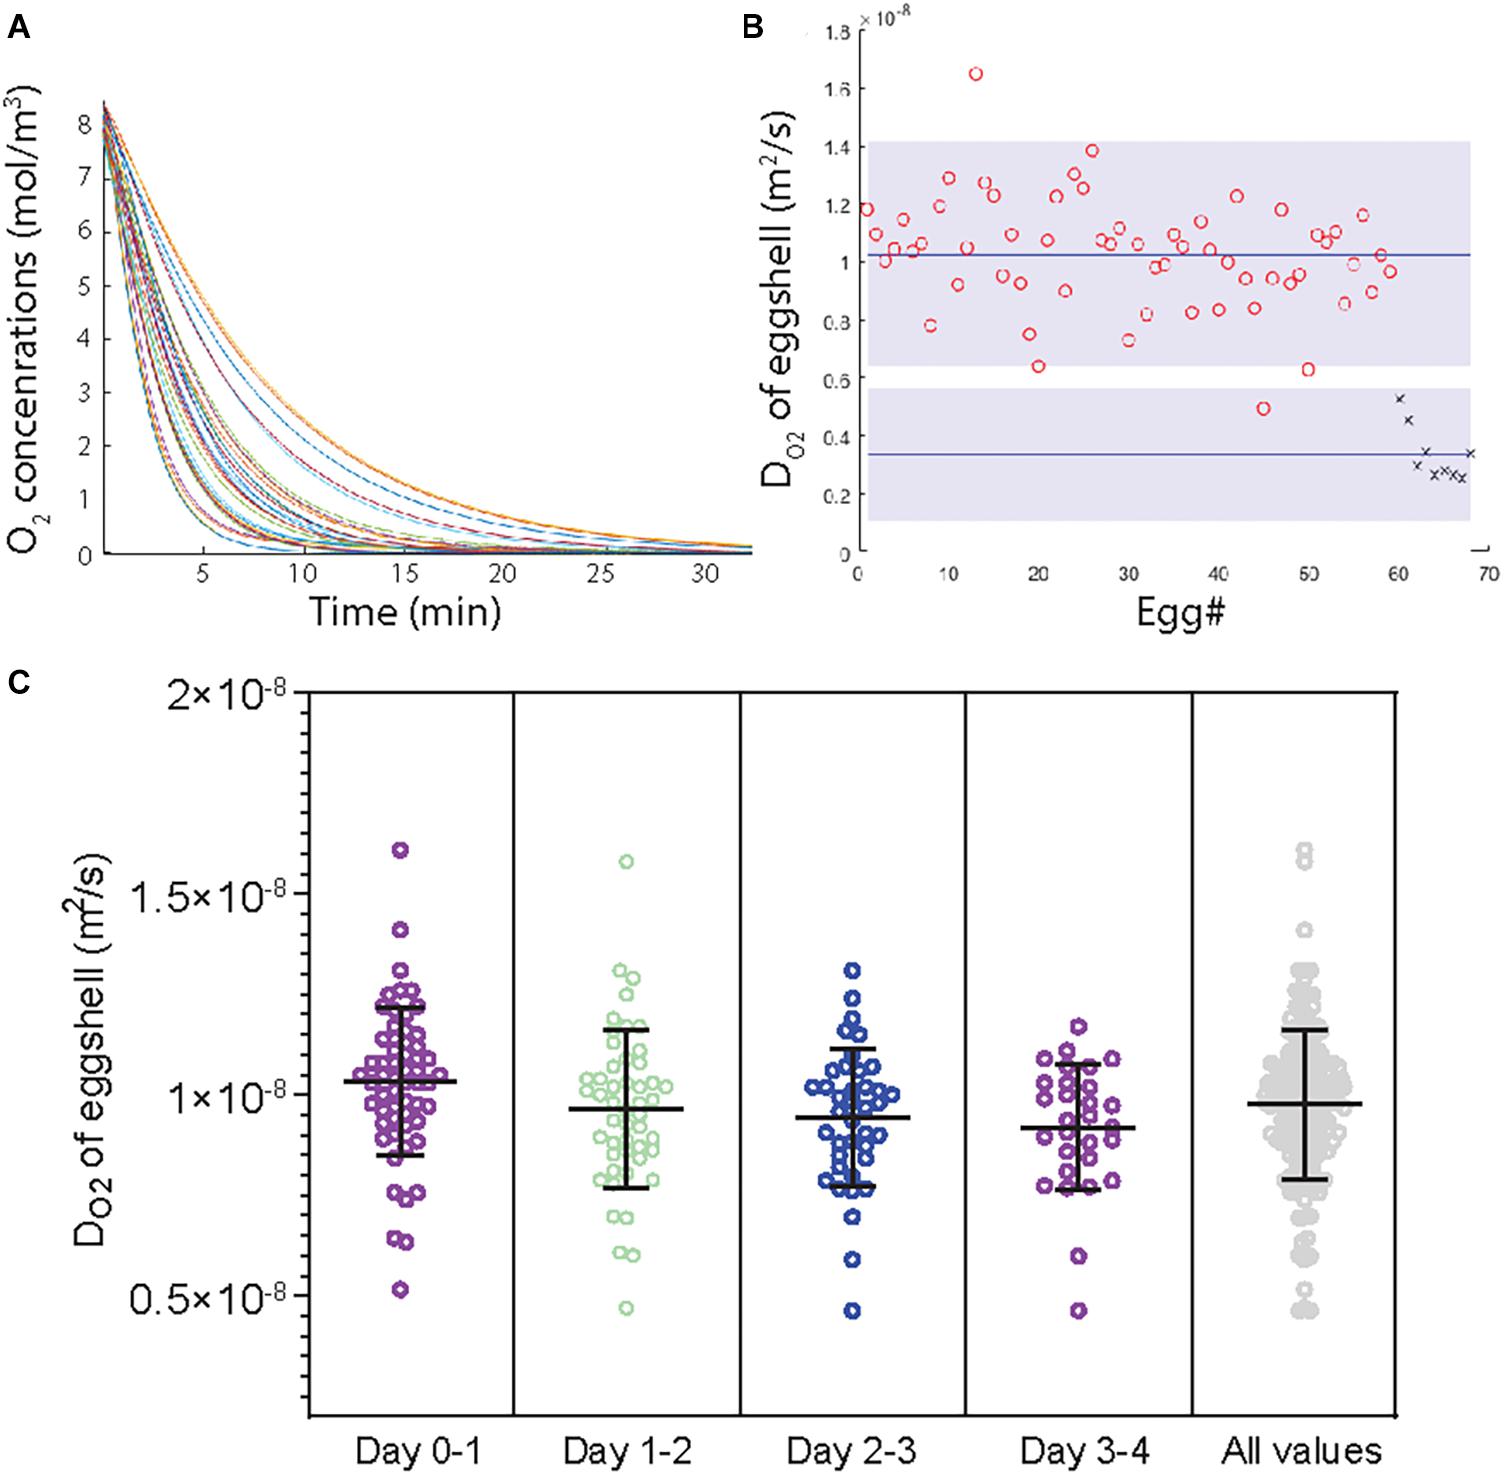
Figure 4. Quantifications of DO2. (A) The loss of O2 from the gas cell of the egg when N2 surrounds the egg, as measured with microelectrodes in ovo. (B) A comparison of DO2 values obtained through direct (crosses; n = 9) and indirect (circles, n = 59) methods. The average is marked (blue line), as is the significance (p < 0.05) as obtained through the Welch t-test (gray field). (C) The indirectly determined DO2 (based on water evaporation over four days) is also reported for each day (1–4) and overall (n = 59). Horizontal lines denote the mean value for each time interval and the error bars represent the standard deviation from the mean.
During the first 4 days, unfertilized eggs kept at 37.5°C lost on average 0.58 (±0.04) g day–1 corresponding to a loss of ∼1.3% (Supplementary Figure 8 and Supplementary Tables 6, 7). The corresponding water diffusion coefficient (DH2O) was on average 10.27⋅10–9 ± 0.25⋅10–9 m2 s–1. The value of DO2 was determined as 9.95⋅10–9± 0.24⋅10–9 m2 s–1 (Figure 4B, circles). The indirectly determined DO2 values were largely constant for the first 4 days of incubation (Figure 4C).
Determining O2 Consumption
We used the indirectly determined DO2, the gas-cell volume increase (Supplementary Table 8), and the direct measurements of O2 concentrations within the gas cell of eggs that were viable for 4 days or more (n = 4) to determine O2 consumption within the eggs. Using the indirectly determined DO2 allows an estimation of flux of oxygen into the egg. When the hypoxic phase is generated inside the eggs, VO2 increases 3–7 times, from ∼2⋅10–8 to 6–14⋅10–8 mol s–1 (Figure 5). Flux was also estimated using the directly determined DO2 values (Supplementary Figure 10).
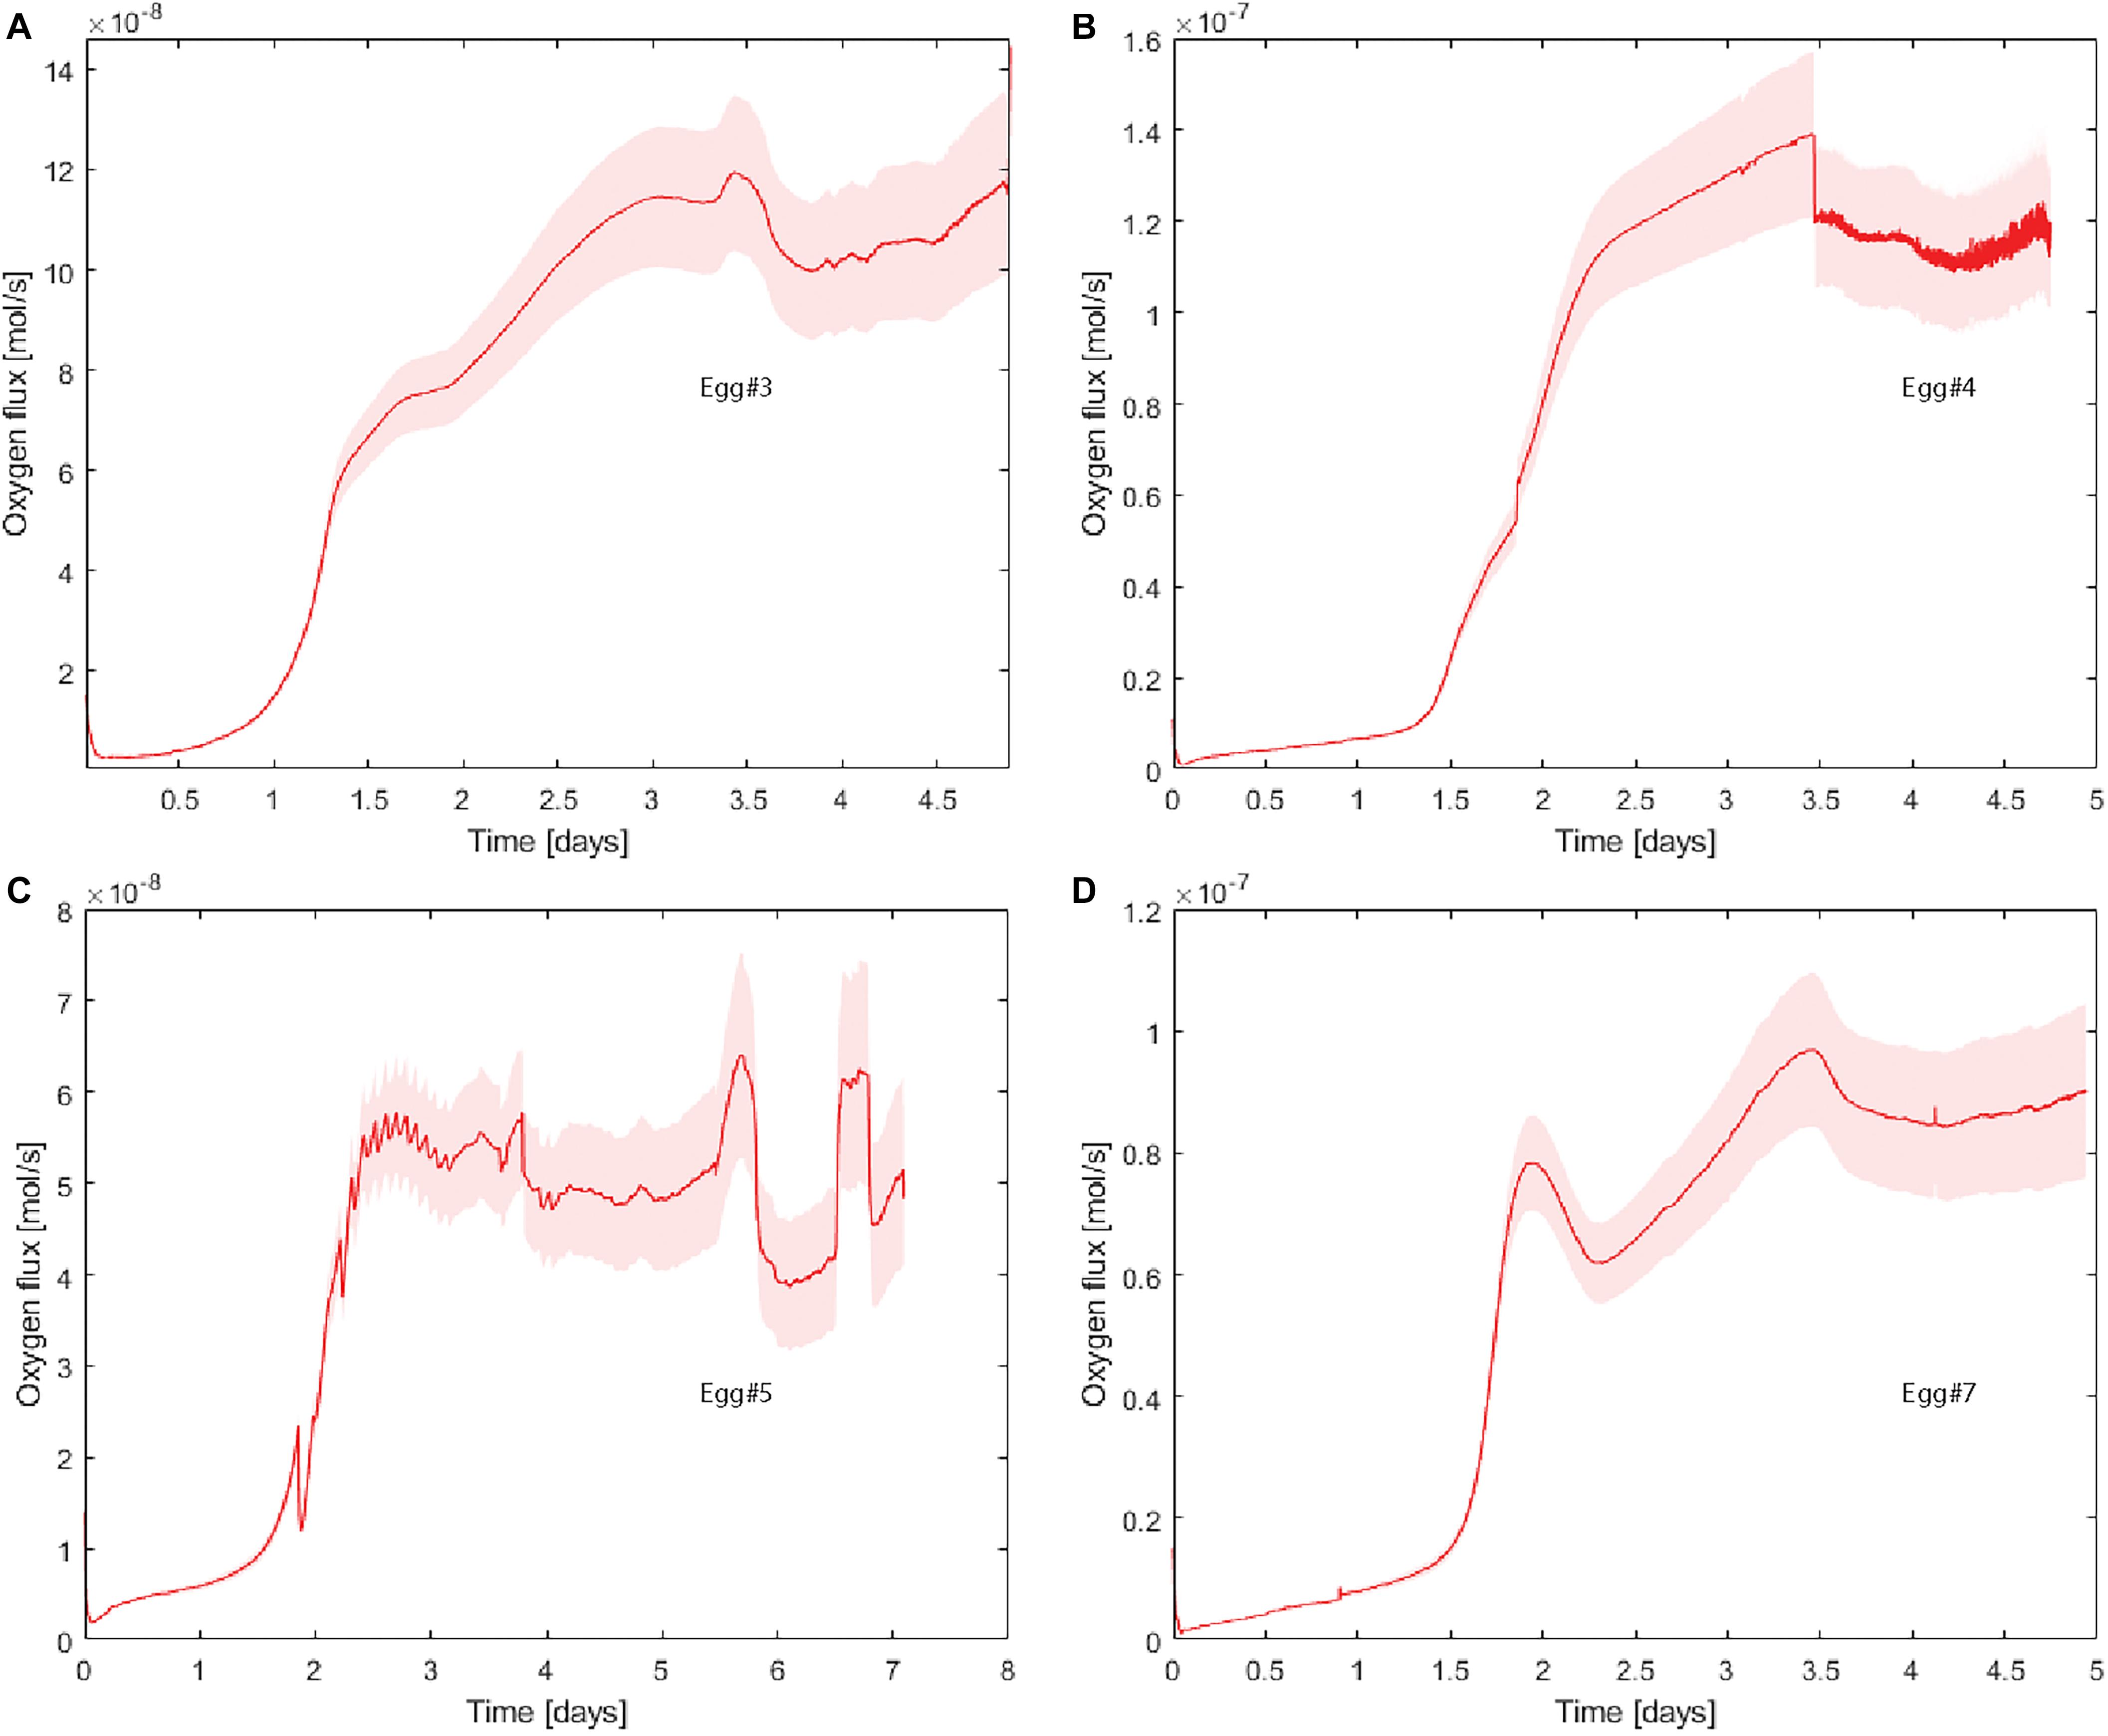
Figure 5. Influx of O2 (mol s–1) during incubation of Eggs #3 (A), #4 (B), #5 (C), and #7 (D). These estimates were based on our indirectly determined DO2 value. The surrounding field (pink) reflects error propagation for our uncertainties (D,A,z, and V).
Discussion
We observed a distinct phase of hypoxia during early chick embryogenesis, despite the eggshell being a membrane permeable to O2. The phase of hypoxia associates with HIF-α stabilization and appears to be important for normal development of the embryo and the vascular system. The fact that the eggshell is permeable, combined with the observed low O2 concentrations within the gas cell, lead us to infer that the hypoxic phase must have resulted from increased O2 consumption rates (VO2). Below, we discuss the estimates of O2 diffusion, the presence and role of a hypoxic phase during early avian development, and the broader implications of our findings.
A Distinct and Critical Phase of Environmental Hypoxia During Avian Embryogenesis
Hypoxia developed in the gas cell during E2-E4, after which O2 levels increased but remained below air saturation (Figure 2A). To our knowledge, the presence of hypoxia in the uppermost liquid of eggs (through embryo, allantois, albumen or yolk) has been measured only once before, at time points during E0-E4 (Lomholt, 1984). After removing the eggshell and outer membrane, these measurements were discrete and blindly aiming through the inner membrane to unknown positions in the liquid. O2 levels were found to decrease when hitting the liquid (and possibly the embryo or allantois), down to 10% of initial levels (Lomholt, 1984). In the tissues of similarly early embryos in our study, oxygen levels follow on the observed phase of hypoxia (Figure 2B). The decrease is notable in vagal and sacral regions, as well as in the heart and head, and is similar to an earlier observation that O2 levels in the trunk region decrease within the same time interval (Niklasson et al., 2020). Previously, O2 levels in both tissue and blood have been measured at E4-E6 and noted to be at 20–30% of full saturation (Meuer et al., 1992). Therefore, our observations of hypoxia in the gas cell and embryonal tissues are consistent with previous observations and add resolution to the first four days of embryogenesis. In the following, we will discuss to what extent the phase of hypoxia matters for embryo development.
Developmental challenges related to hypoxia have been thoroughly investigated, but the focus has generally been on the later stages of development. For example, eggs exposed to hypoxia at E15-E18 (hatching occurs at E21) result in chicks with decreased hatch size (e.g., Visschedijk et al., 1980; Metcalfe et al., 1981). By contrast, observations from early development indicate a different role of hypoxia. Firstly, embryos at E1-E2 have been noted to ‘tolerate’ hypoxia better (measured through survival after exposure to decreasing O2 levels) than those at E3-E4, which has led to the suggestion that the early embryo utilizes anaerobic metabolism (Grabowski and Paar, 1958; Kučera et al., 1984). This would be consistent with observations that mitochondria cristae remain poorly developed at ∼E1.5 (Scully et al., 2016) and agrees with the timing of the hypoxic phase that we observe here. Secondly, the nascent vascular systems in chick embryos younger than ∼E3 and zebra fish embryos younger than ∼E4 do not primarily provide O2 transport, since blocking their hemoglobin (with CO) does not affect development (Cirotto and Arangi, 1989; Pelster and Burggren, 1996). Thirdly, hypoxia and HIF-α are associated with the correct development of organs and vascular systems in e.g., chicken, quail, xenopus, and zebra fish (Naňka et al., 2006; Ota et al., 2007; Barriga et al., 2013; Scully et al., 2016; Niklasson et al., 2020). For example, measurements of O2 levels within early zebra fish embryos (∼26 h after fertilization), right before vascularization, demonstrate hypoxic conditions (<2%) (Kranenbarg et al., 2003), or severely hypoxic, depending on context. By contrast, development in eggs under hyperoxia (100%) leads to an underdeveloped chick embryo vascular system (Höper and Jahn, 1995), similar to what we also note when eggs are opened to normoxia (21%) (Figure 3). That both 21% and 100% O2, in this regard, have similar effects on development suggests that both indeed are hyperoxic compared to a phase of critical hypoxia. Fourthly, the necessity of hypoxia (in the tissue of quail embryos) appears to precede the expression of HIF1A and angiogenesis (Naňka et al., 2006). We note that hypoxia in both the egg gas cell and chick embryo tissue also precedes HIF-α expression in the embryos. Expression of both HIF-1α and HIF-2α proteins increased after the onset of the distinct hypoxic phase (Figure 2C). During the phase of hypoxia, the expression of particularly HIF-1α shifts from being predominantly expressed in the allantois (HH10-HH12) to being predominantly expressed within the tissues (HH14). Previously, HIF-1α has been observed to be expressed primarily in the allantois at E0-E2 and within the embryo tissues during later stages (E4-E6) (Meuer et al., 1992; Ota et al., 2007). Our data therefore complement and corroborate previous studies observing that hypoxia determines the stabilization of HIF-1α in particular, and directs proper chick embryo development in general.
In summary, our results align with earlier work finding that both hypoxia and HIF-α responses are prerequisites for proper development. We furthermore propose that the phase of environmental hypoxia is a prerequisite to kick-start the genetically determined cellular hypoxia-response machineries. Without the initial phase of hypoxia, avian embryos might risk dying from lack of ‘lack of oxygen’.
Increased O2 Consumption Rates (VO2) and Properties of the Eggshell Generate Hypoxia
The phase of hypoxia that we observed in the gas cell is not induced by hypoxia in the external environment. Air and O2 continuously permeate through the porous eggshell. This means that transient hypoxia must be coupled to increased VO2 within the embryo itself. The lower the gas-cell O2 that we measured at E2-3, the higher the embryo’s VO2. That O2 is necessary is indicated by our incubations at 10% O2, where no embryos survive from E1 to E3. That also the biologically induced phase of hypoxia is important is indicated by incubations at hyperoxia (at 21% O2 with perforated eggshells or at 40% O2 with intact eggshells) where death rates are higher and development delayed (most pronounced around E3). To determine how this critical phase of hypoxia is generated, we investigated oxygen diffusion across the eggshell.
The oxygen diffusion coefficient (DO2) of eggshell (and its outer and inner membranes) constitutes a necessary component to calculate the rate by which O2 diffuses into the egg during the phase of hypoxia. Our DO2 values obtained through microelectrodes (directly in ovo) are ∼30% lower than those obtained through water evaporation (indirectly via water vapor) (Figure 4B). This discrepancy could be due to several factors and we start by comparing our values to those reported in previous work. To our knowledge, only two previous investigations using microelectrodes have aimed to directly determine O2 flux across the eggshell. Most other efforts have focused on the evaluation of the conductivity of water, which can be converted to DO2 values (see Table 1, also for references and notes on our conversions).
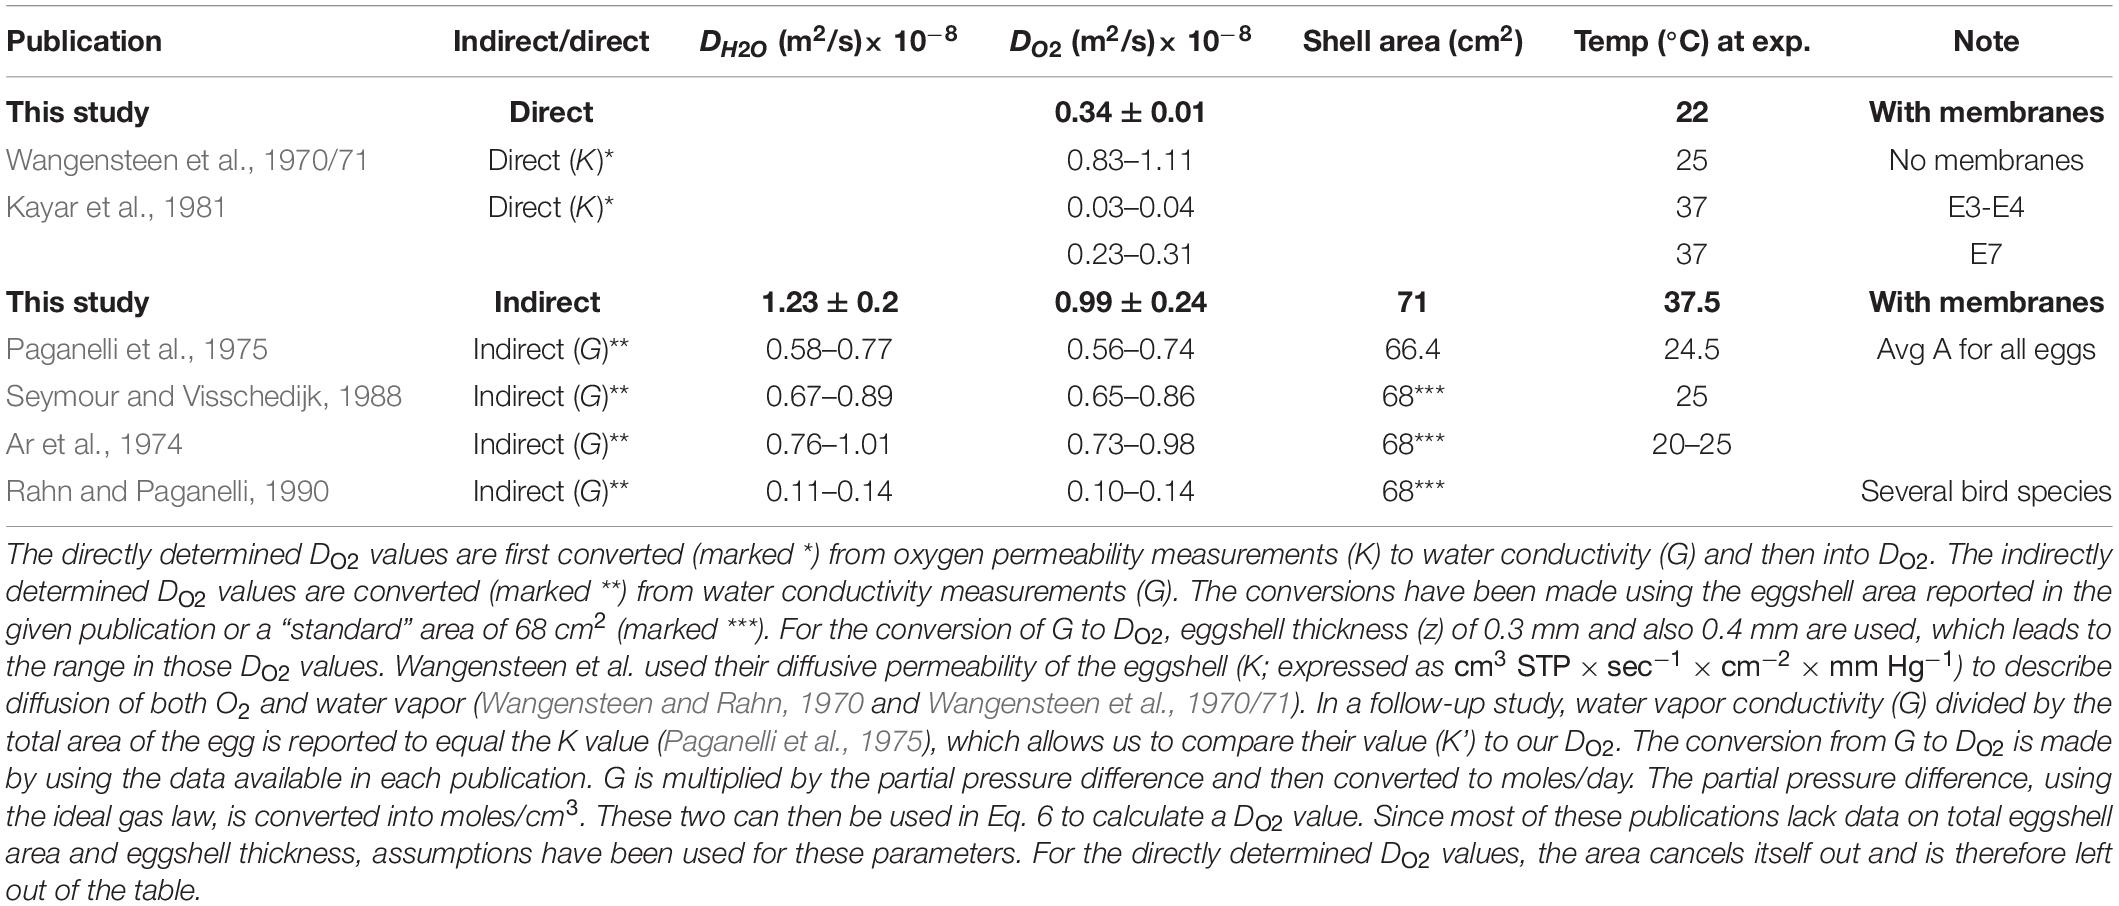
Table 1. Comparison of water and oxygen diffusion coefficients of chicken eggshell.
The directly determined values of DO2 range from 0.03⋅10–8 to 1.11⋅10–8 m2 s–1, our value being in the middle (Wangensteen et al., 1970/71; Kayar et al., 1981). Wangensteen et al. (1970/71) report the highest DO2 value (see SI for conversions), which differs in that it represents flux through the eggshell only. In the given study, a cap of the eggshell was removed, cleaned of its inner and outer membranes, and mounted on a board where gases could be altered and measured on the inside of the cap (Wangensteen et al., 1970/71). Since high DO2 values represent higher permeability, this value can be ascribed to the lack of membranes. Kayar et al. (1981) report the lowest DO2 value, which was also obtained by measuring diffusion across a removed cap of eggshell, fluxing the inside with N2 and then measuring the rate by which O2 concentrations increased on the inside. However, the given study differs from others by (i) how eggs were incubated at 37°C until manipulation and measurements, and (ii) how the inner and outer membranes were removed sequentially to discriminate their and the eggshell’s respective values of DO2 over time. This study concludes that the permeability of the inner membrane increases 10-fold at E4-E6 (Kayar et al., 1981). That inner membrane properties change after the first days of development is supported by how, in quail eggs, the membrane thins from 74 nm at E2 to 35 nm at E10 (Yoshizaki and Saito, 2002). Our directly determined DO2 value is 10 times higher than those determined by Kayar et al. (1981) at E3-E4 and similar to the value they obtained at E7. Part of the difference could be ascribed to a technical challenge in our setup regarding how to precisely determine the geometrical parameters of the gas cell. After drilling holes into the gas cell and calibrating the microelectrode, egg white was prone to exit the egg along the microelectrode. This loss of egg white may have led to an overestimation of the gas-cell volume and the eggshell area covering it, as well as to a lower DO2 value. However, even if we adjust the gas-cell volume to 1/3 of the measured value (and adjust gas-cell area correspondingly), the resulting manipulated DO2 value (∼0.15⋅10–8 m2 s–1, Supplementary Figure 9) is still higher than the DO2 for E3-E4 reported in the study by Kayar et al. (1981). Therefore, it could also be possible that the temperature or the developing embryo influences the properties of the inner membrane during early embryogenesis, and that this influence is reflected in the uniquely low E3-E4 DO2 values of Kayar et al. (1981). Due to the uncertainty as to why these directly determined DO2 values differ, we also determined DO2 indirectly via water vapor.
Most efforts to determine the value of DO2 have been indirect and based on estimated water flux across the eggshell. In these, weight loss over time combined with differences in water vapor pressure over the eggshell is used to calculate water conductivity (G), expressed as e.g., mg × day−1 × torr−1 (Wangensteen and Rahn, 1970; Ar et al., 1974; Paganelli et al., 1975; Rahn et al., 1975; Ar and Rahn, 1985; Seymour and Visschedijk, 1988; Wagner-Amos and Seymour, 2002). To compare available data, we assumed values for the eggshell area and thickness in previous studies (if not stated in the respective publications). Additionally, we converted reported values of DH2O to DO2 to be able to directly compare to our obtained value (Table 1). Although experimental setups differ in terms of temperature and avian species, our indirectly obtained DO2 value is largely consistent with those determined previously based on water evaporation. While the general consistency of the indirectly determined DO2 values is encouraging, the discrepancy in the DO2 values determined directly (by recording O2 flux) and indirectly (based on water evaporation) lingers. It is impossible that this reflects a real difference in the membrane properties, and that water and O2 are being transported through the membrane at different rates during early embryogenesis. The properties of the inner membrane may change through incubation or embryogenesis, and it is known that the permeability of the membrane with respect to O2 changes around E4 (Kutchai and Steen, 1971; Kayar et al., 1981). Thus, our initial assumption that the majority of resistance is in the eggshell proper does not appear to hold. The possibly different and changing diffusive properties of eggshell versus membranes require further studies. Although beyond the scope of this paper, the indication that egg membrane properties may play a discriminatory role for transporting gases (O2 and H2O) at different rates later in embryo development is noteworthy. Nevertheless, because of the consistency between our indirectly determined DO2 value and those reported by others, we use this value when calculating the influx of O2 during early embryogenesis and the hypoxic phase.
Defining the DO2 of eggshell allowed us to estimate the theoretical maximum influx of O2 per time unit (F) at the beginning and end of incubation. At day zero, the eggshell area covering the gas cell (normally at the blunt end of the egg) constitutes ∼5% of the total eggshell area (3.8⋅10–04 m2). At E20, the chick is fully developed and O2 can be transported across the entire eggshell area (7.1⋅10–03 m2). Based on calculation (8) and our indirectly determined value of DO2, the flux of O2 can, theoretically, increase from 0.8⋅10–07 mol s–1 at E1 to 15⋅10–07 mol s–1 at E20. This theoretical 20-fold increase of flux can be compared to empirical data (via e.g., respirometry) reporting a fivefold increase in chick-embryo VO2 between E1 (0.7⋅10–07 mol s–1) and E20 (3.7⋅10–07 mol s–1) just before hatching (Bartels and Baumann, 1972; Mortola, 2009 and references herein). This would support previous observations that, rather than limited O2 supply, late stages of development are sensitive to the build-up of CO2 that also initiates hatching (Tazawa et al., 1988; Mortola, 2009). Here, however, the early and dramatic increase in the chick-embryo VO2 is of particular importance in that it may be facilitating the observed phase of gas-cell hypoxia.
Logging O2 concentrations within the gas cell and estimating the continuous influx of O2 over the porous eggshell allow us to visualize the dramatic increase in VO2 that induces the hypoxic phase at E2 (Figure 5). The magnitude of the increase in VO2 estimated in the present study, based on O2 data from the gas cell, is largely consistent with the VO2 increase observed previously based on respirometry data of the early chick embryos (Bartels and Baumann, 1972). Respirometry data reflect a doubling of VO2 between HH4 or ∼E0.75 (0.7⋅10–07 mol s–1) and HH8 or ∼E1.25 (1.4⋅10–07 mol s–1). Although increased VO2 is detected in the gas cell at ∼E1, the most dramatic increase occurs slightly later. VO2 roughly doubles from about 0.6⋅10–07 mol s–1 at E1-E2 to 1.4⋅10–07 mol s–1 at E2-E3 (Figure 5). That an increase in chick-embryo VO2 precedes the gas-cell O2 dynamics reported here, and both being of a corresponding magnitude, makes us infer that increased cell proliferation in the growing embryo is indeed inducing the observed hypoxic phase. This conclusion is supported by the fact that a fourfold increase in protein synthesis is known to occur between HH4 and HH8 and that neither egg yolk nor white was found to bind O2 to a higher degree during incubation (Kučera et al., 1984). Based on our measurements, hypoxia becomes less pronounced at E3.5 in three out of four experiments and while the onset and degree of hypoxia vary between eggs, the timepoint at which hypoxia lessens does not (Figure 2A). We ascribe the observation that the degree of hypoxia seems to consistently lessen at E3.5 to the previously described change in the properties of the inner membrane at this stage (Kayar et al., 1981; Yoshizaki and Saito, 2002). Thus, membrane properties and gas-cell dimensions, as well as variations in the O2 consumption rates during early incubation, appear to be coupled to the induction of the hypoxic phase.
Hypoxia as a Requirement for Early Vertebrate Development
We report a distinct phase of hypoxia during early avian development that we believe to be generated by a combination of eggshell properties and variations in the embryo’s VO2. This hypoxic phase appears to be critical for normal chick development.
These findings are relevant since they challenge the thinking on the importance of oxygen. In previous studies, it is commonly explored how the embryo is able to access enough oxygen through the eggshell (e.g., Kayar et al., 1981). Indeed, all the while, avian embryogenesis within a porous eggshell posed a conundrum for the exact opposite reason – how to generate sufficiently low O2 concentrations. These findings may also suggest that the timing of the hypoxic phase occurs at a critical transition when the embryo evolves from a planar fetus shape to a 3D form. After this transition, the embryo’s internal cells and chemistry become more sheltered from the immediate impact of the chemistry in the surrounding environment. We suggest that this transition reflects a divide between the first phase of embryogenesis, which is coupled to hypoxia dependency, and a second phase that is somewhat de-coupled from environmental hypoxia (Figure 6).
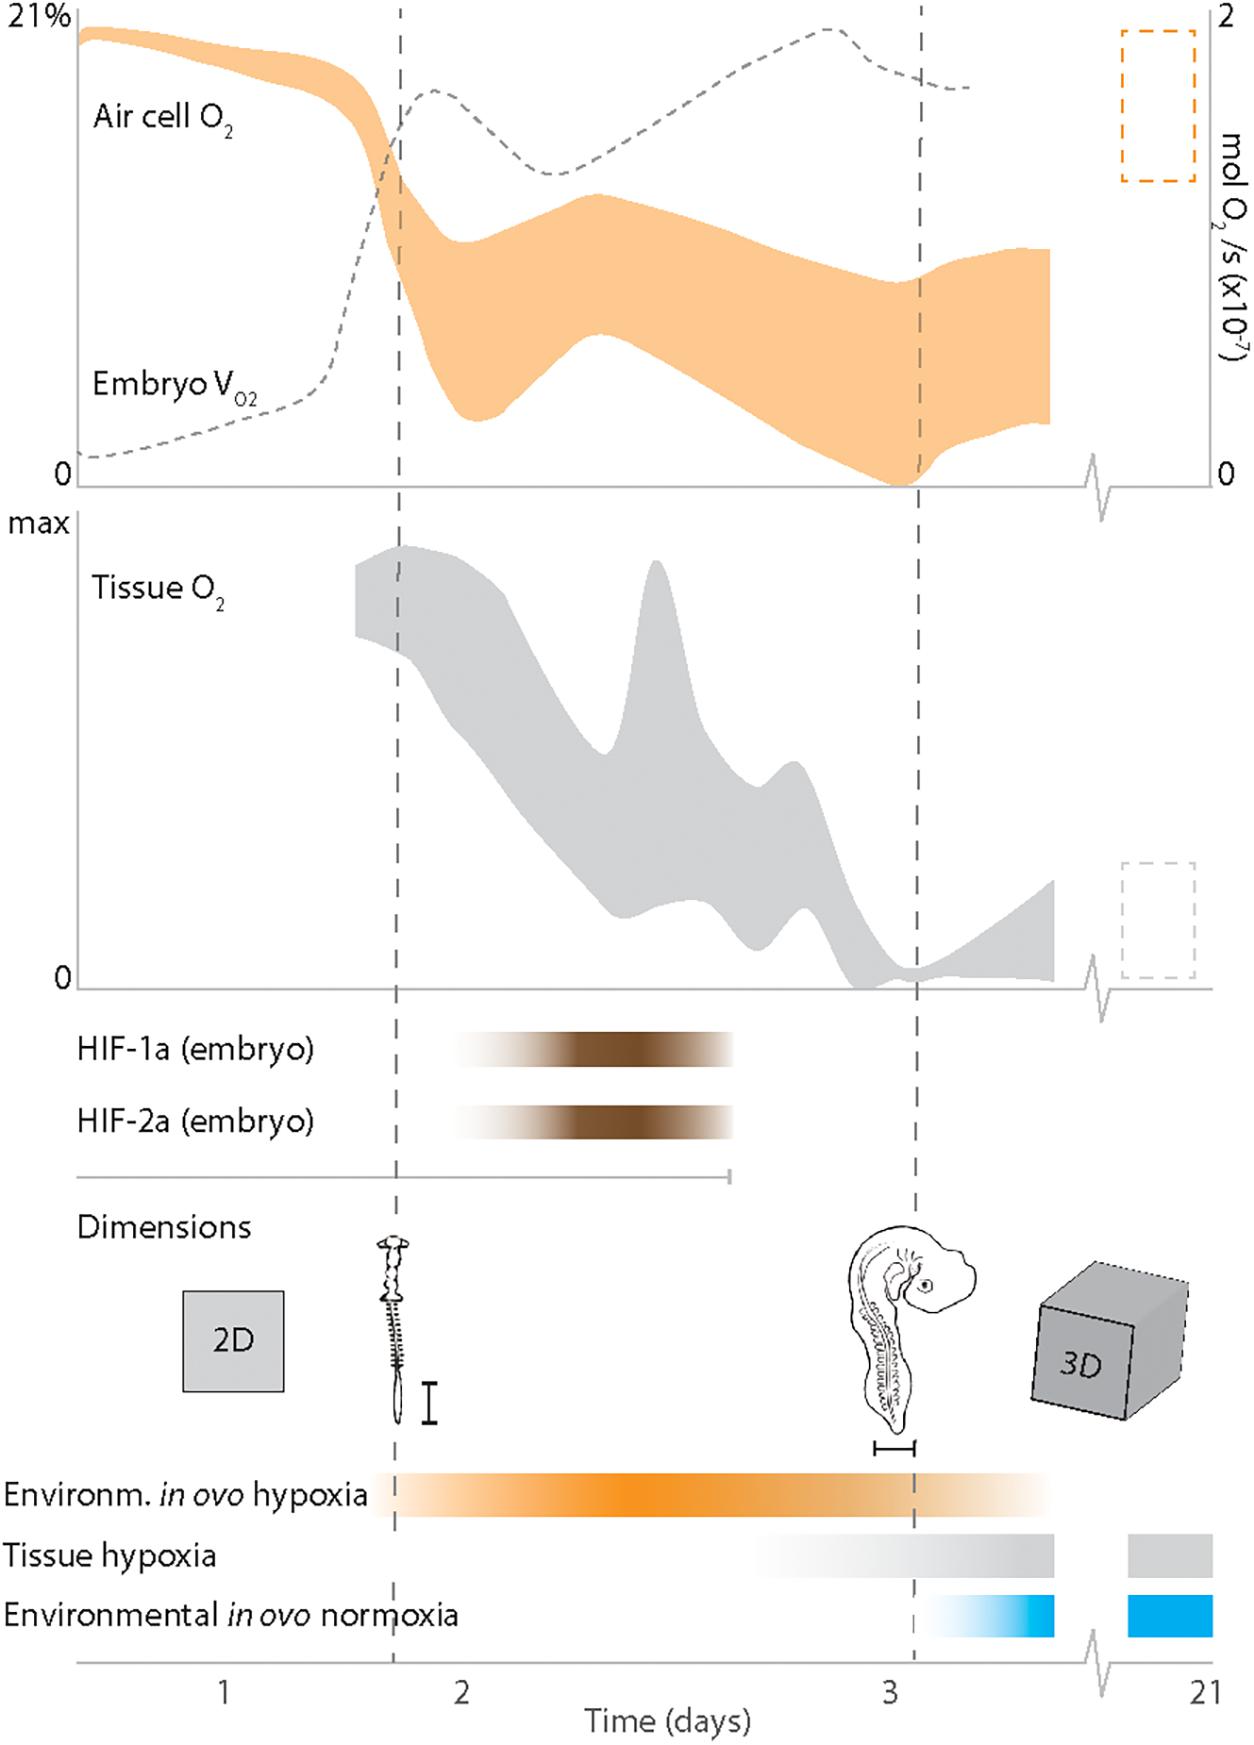
Figure 6. Our interpretation of data presented here and in previous work. Increased oxygen consumption rates within the embryo (VO2) together with physical parameters of the eggshell and gas cell generate a distinct phase of hypoxia in the gas cell and tissues within the first two days of avian development. The presumed O2 status at the end of embryogenesis (E21) is depicted with a box (dashed) that spans over (in the gas cell) normoxic and (in tissue) hypoxic (or physiologically normoxic) conditions. Environmental hypoxia assists the embryo in growing from the 2D shape and enables HIF-driven angiogenesis. The phase of hypoxia-dependent development continues until hypoxia and hypoxia-responses are regulated internally within the embryo’s 3D-shape, and the phase of normoxia-dependent development ensues. The dimension of the embryo at HH10 and HH18 are approximate. Scale bar is 1 mm.
The latter phase of vertebrate development, which requires access to normoxia, accords well with the well-understood relationship between oxygen and animal development (e.g., Künzel et al., 1992). This phase likely comprises most of the development. For example, chicken hatch size has been observed to increase when incubation takes place under hyperoxic conditions (100% O2) – if these are imposed after E3 (Cruz and Romanoff, 1944). This would suggest that the phase of hypoxia observed by us plays its role for the time we observed it (up until E3), after which an excess of O2 can become beneficial for growth. So far, investigations into how vertebrate development requires certain levels of O2 have overshadowed those into hypoxia-dependency. However, many studies have also pointed toward a necessity for an association between environmental hypoxia and the genetically determined hypoxic responses. The necessity of either hypoxia or HIF-α for development is demonstrated during the early stages of bird, fish, reptile, and mammal development (Grabowski and Paar, 1958; Lomholt, 1984; Meuer and Baumann, 1988; Kranenbarg et al., 2003; Niklasson et al., 2020). A full review of the complex impacts of hypoxia during development is beyond the scope of this paper. Here, however, we suggest it plausible that if the combined properties of the membrane and growth rates during avian development generate hypoxia, similar dynamics to govern hypoxia may be operating during the development of other vertebrates as well.
Hypoxia Connects Animal and Tumor Evolution
That hypoxia would be present broadly during animal development resonates with how animals diversified on Earth under an atmosphere that was likely low enough in O2 to be defined as “hypoxic” by modern standards (Hammarlund et al., 2018). The generation of hypoxia during development also resonates with how hypoxia is necessary to the function of cellular mechanisms that sense fluctuations in oxygen. The success of those eukaryotic clades that diversified on Earth’s surface – animals, plants and fungi – has been associated with functionally similar cellular mechanisms for sensing oxygen fluctuations (Hammarlund et al., 2020). Considering this framework, it appears less surprising that cancer cells can use both hypoxia and HIF-mechanisms to their advantage. Indeed, to view hypoxia as a necessity and ancestral norm can challenge how we interrogate the varying roles of oxygen over tumor evolution. While a long-standing focus has been to explore how cancer cells cope with tumor hypoxia, it may be a larger enigma how circulating cancer cells can cope with oxygenated conditions in the blood stream. Future work should further elucidate how, when, and to what extent hypoxia is essential for animal development and health.
Data Availability Statement
The original contributions presented in the study are included in the article/Supplementary Material, further inquiries can be directed to the corresponding author.
Ethics Statement
According to Swedish regulations (Jordbruksverkets föreskrift L150, §5) work on chick embryos younger than embryonic day 13 do not require Institutional Animal Care and Use Committee oversight.
Author Contributions
EUH, SM, PB, and RNG designed the experiments. CC, EUH, PFN, and NE performed the experiments. PFN, NE, PB, RNG, and EUH evaluated physical parameters and statistics. CC, PFN, NE, SM, ERH, PB, RNG, and EUH wrote the manuscript. All authors contributed to the article and approved the submitted version.
Funding
EUH received funding from the ParadOX-ERC Starting Grant (No. 96948) and from the Swedish Research Council (Grant 2019-05254). PB received funding from the National Science Foundation (United States; Grants: OCE-1851424 and OCE-1824144). RNG received funding from HADES-ERC Advanced Grant (No. 669947) and the Danish National Research Foundation through the Danish Center for Hadal Research, HADAL (No. DNRF145).
Conflict of Interest
The authors declare that the research was conducted in the absence of any commercial or financial relationships that could be construed as a potential conflict of interest.
Acknowledgments
We are very grateful to Sara Egemose, Heidi G. Jensen, and Anni Glud for sharing technical expertise and scientific enthusiasm while developing the project. We thank Arne Johansson at Medicon Village for ample supply of eggs and valuable discussions. We also very much appreciate the reliable support from Elinn Johansson, Lucas Ahlm, and Elina Fredlund.
Supplementary Material
The Supplementary Material for this article can be found online at: https://www.frontiersin.org/articles/10.3389/fevo.2021.675800/full#supplementary-material
References
Ar, A., Paganelli, C. V., Reeves, R. B., Greene, D. G., and Rahn, H. (1974). The Avian Egg: Water Vapor Conductance, Shell Thickness, and Functional Pore Area. Condor 76, 153–158. doi: 10.2307/1366725
Ar, A., and Rahn, H. (1985). Pores in avian eggshells: Gas conductance, gas exchange and embryonic growth rate. Respir. Physiol. 61, 1–20. doi: 10.1016/0034-5687(85)90024-6
Barriga, E. H., Maxwell, P. H., Reyes, A. E., and Mayor, R. (2013). The hypoxia factor Hif-1α controls neural crest chemotaxis and epithelial to mesenchymal transition. J. Cell Biol. 201, 759–776. doi: 10.1083/jcb.201212100
Bartels, H., and Baumann, F. (1972). Metabolic rate of early embryos (4–22 somites) at varying oxygen pressures. Respir. Physiol. 16, 1–15. doi: 10.1016/0034-5687(72)90083-7
Cirotto, C., and Arangi, I. (1989). Chick embryo survival under acute carbon monoxide challenges. Comparat. Biochem. Physiol. Part A 94, 117–123. doi: 10.1016/0300-9629(89)90794-9
Cruz, S. R., and Romanoff, A. L. (1944). Effect of Oxygen Concentration on the Development of the Chick Embryo. Physiol. Zool. 17, 184–187. doi: 10.1086/physzool.17.2.30151721
Dunwoodie, S. L. (2009). The Role of Hypoxia in Development of the Mammalian Embryo. Devel. Cell 17, 755–773. doi: 10.1016/j.devcel.2009.11.008
Grabowski, C. T., and Paar, J. A. (1958). The teratogenic effects of graded doses of hypoxia on the chick embryo. Am. J. Anat. 103, 313–347. doi: 10.1002/aja.1001030302
Hamburger, V., and Hamilton, H. L. (1951). A series of normal stages in the development of the chick embryo. J. Morphol. 88, 49–92. doi: 10.1002/jmor.1050880104
Hammarlund, E. (2019). Harnessing hypoxia as an evolutionary driver for complex life. Interf. Focus 10:20190101. doi: 10.1098/rsfs.2019.0101
Hammarlund, E., Stedingk, K., and Påhlman, S. (2018). Refined control of cell stemness allowed animal evolution in the oxic realm. Nat. Ecol. Evol. 2, 220–228. doi: 10.1038/s41559-017-0410-5
Hammarlund, E. U., Flashman, E., Mohlin, S., and Licausi, F. (2020). Oxygen-sensing mechanisms across eukaryotic kingdoms and their roles in complex multicellularity. Science 370:eaba3512. doi: 10.1126/science.aba3512
Higgins, B. G., and Binous, H. (2013). Binary Diffusion Coefficients for Gases in Wolfram Demonstrations Project. URL: http://demonstrations.wolfram.com/BinaryDiffusionCoefficientsForGases/
Hofmann, A., Peltzer, E., Walz, P., and Brewer, P. (2011). Hypoxia by degrees: Establishing definitions for a changing ocean. Oceanogr. Res. Papers 58, 1212–1226. doi: 10.1016/j.dsr.2011.09.004
Höper, J., and Jahn, H. (1995). Influence of Environmental Oxygen Concentration on Growth and Vascular Density of the Area vasculosa in Chick Embryos. Int. J. Microcircul. 15, 186–192. doi: 10.1159/000178974
Iyer, N. V., Kotch, L. E., Agani, F., Leung, S. W., Laughner, E., Wenger, R. H., et al. (1998). Cellular and developmental control of O2 homeostasis by hypoxia-inducible factor 1α. Genes Devel. 12, 149–162. doi: 10.1101/gad.12.2.149
Kayar, S. R., Snyder, G. K., Birchard, G. F., and Black, C. P. (1981). Oxygen permeability of the shell and membranes of chicken eggs during development. Respir. Physiol. 46, 209–221. doi: 10.1016/0034-5687(81)90122-5
Kranenbarg, S., Van Den Boogaart, J. G. M., and Van Leeuwen, J. L. (2003). Oxygen profile in zebra fish embryo (Danio rerio) elucidated by theory and experiment. Anim. Biol. 53, 339–346. doi: 10.1163/157075603322556256
Kučera, P., Raddatz, E., and Baroffio, A. (1984). “Oxygen and glucose uptakes in the early chick embryo,” in Respiration and metabolism of embryonic vertebrates: Satellite Symposium of the 29th International Congress of Physiological Sciences, Sydney, Australia, 1983, ed. R. S. Seymour (Dordrecht: Springer), 299–309. doi: 10.1007/978-94-009-6536-2_21
Künzel, W., Hohmann, M., and Braems, G. (1992). “Oxygen Deficiency During Fetal Development and Delivery — Speculations About Clinical Conditions,” in OXYGEN: Basis of the Regulation of Vital Functions in the Fetus, eds W. Künzel and M. Kirschbaum (Berlin, Heidelberg: Springer), doi: 10.1007/978-3-642-77469-0_4
Kutchai, H., and Steen, J. B. (1971). Permeability of the shell and shell membranes of hens’ eggs during development. Respir. Physiol. 11, 265–278. doi: 10.1016/0034-5687(71)90001-6
Lomholt, J. P. (1984). “A preliminary study of local oxygen tensions inside bird eggs and gas exchange during early stages of embryonic development,” in Respiration and metabolism of embryonic vertebrates: Satellite Symposium of the 29th International Congress of Physiological Sciences, Sydney, Australia, 1983, ed. R. S. Seymour (Dordrecht: Springer), 289–298. doi: 10.1007/978-94-009-6536-2_20
Mantel, C. R., O’Leary, H. A., Chitteti, B. R., Huang, X., Cooper, S., Hangoc, G., et al. (2015). Enhancing Hematopoietic Stem Cell Transplantation Efficacy by Mitigating Oxygen Shock. Cell 161, 1553–1565. doi: 10.1016/j.cell.2015.04.054
Metcalfe, J., Mccutcheon, I. E., Francisco, D. L., Metzenberg, A. B., and Welch, J. E. (1981). Oxygen availability and growth of the chick embryo. Respir. Physiol. 46, 81–88. doi: 10.1016/0034-5687(81)90091-8
Meuer, H. J., and Baumann, R. (1988). Oxygen pressure in intra- and extraembryonic blood vessels of early chick embryo. Respir. Physiol. 71, 331–341. doi: 10.1016/0034-5687(88)90026-6
Meuer, H.-J., Hartmann, V., and Jopp, S. (1992). Tissue PO2 and growth rate in early chick embryos. Respir. Physiol. 90, 227–237. doi: 10.1016/0034-5687(92)90083-9
Mohlin, S., Wigerup, C., Jögi, A., and Påhlman, S. (2017). Hypoxia, pseudohypoxia and cellular differentiation. Exp. Cell Res. 356, 192–196. doi: 10.1016/j.yexcr.2017.03.007
Mortola, J. P. (2009). Gas exchange in avian embryos and hatchlings. Mole. Integr. Physiol. 153, 359–377. doi: 10.1016/j.cbpa.2009.02.041
Naňka, O., Valášek, P., Dvořáková, M., and Grim, M. (2006). Experimental hypoxia and embryonic angiogenesis†. Devel. Dynam. 235, 723–733. doi: 10.1002/dvdy.20689
Niklasson, C. U., Fredlund, E., Monni, E., Lindvall, J. M., Kokaia, Z., Hammarlund, E. U., et al. (2020). Hypoxia inducible factor-2α importance for migration, proliferation, and self-renewal of trunk neural crest cells. Devel. Dynam. 250, 191–236. doi: 10.1002/dvdy.253
Ota, K., Nagai, H., and Sheng, G. (2007). Expression and hypoxic regulation of hif1alpha and hif2alpha during early blood and endothelial cell differentiation in chick. Gene Exp. GEP 7, 761–766. doi: 10.1016/j.modgep.2007.05.007
Paganelli, C. V., Ar, A., Rahn, H., and Wangensteen, O. D. (1975). Diffusion in the gas phase: The effects of ambient pressure and gas composition. Respir. Physiol. 25, 247–258. doi: 10.1016/0034-5687(75)90001-8
Pelster, B., and Burggren, W. W. (1996). Disruption of Hemoglobin Oxygen Transport Does Not Impact Oxygen-Dependent Physiological Processes in Developing Embryos of Zebra Fish (Danio rerio). Circul. Res. 79, 358–362. doi: 10.1161/01.res.79.2.358
Rahn, H., and Paganelli, C. V. (1990). Gas fluxes in avian eggs: driving forces and the pathway for exchange. Comp. Biochem. Physiol. Part A Physiol. 95, 1–15. doi: 10.1016/0300-9629(90)90002-A
Rahn, H., Paganelli, C. V., and Ar, A. (1975). Relation of Avian Egg Weight to Body Weight. Auk 92, 750–765. doi: 10.2307/4084786
Revsbech, N. P. (1989). An oxygen microsensor with a guard cathode. Limnol. Oceanogr. 34, 474–478. doi: 10.4319/lo.1989.34.2.0474
Scully, D., Keane, E., Batt, E., Karunakaran, P., Higgins, D. F., and Itasaki, N. (2016). Hypoxia promotes production of neural crest cells in the embryonic head. Development 143, 1742–1752. doi: 10.1242/dev.131912
Semenza, G. L. (2012). Hypoxia-inducible factors in physiology and medicine. Cell 148, 399–408. doi: 10.1016/j.cell.2012.01.021
Seymour, R. S., and Visschedijk, A. H. J. (1988). Effects of variation in total and regional shell conductance on air cell gas tensions and regional gas exchange in chicken eggs. J. Comp. Physiol. B 158, 229–236. doi: 10.1007/bf01075837
Simon, M. C., and Keith, B. (2008). The role of oxygen availability in embryonic development and stem cell function. Nat. Rev. Mol. Cell Biol. 9, 285–296. doi: 10.1038/nrm2354
Tazawa, H., Wakayama, H., Turner, J. S., and Paganelli, C. V. (1988). Metabolic compensation for gradual cooling in developing chick embryos. Compar. Biochem. Physiol. Part A 89, 125–129. doi: 10.1016/0300-9629(88)91068-7
Tian, H., Hammer, R. E., Matsumoto, A. M., Russell, D. W., and Mcknight, S. L. (1998). The hypoxia-responsive transcription factor EPAS1 is essential for catecholamine homeostasis and protection against heart failure during embryonic development. Genes Devel. 12, 3320–3324. doi: 10.1101/gad.12.21.3320
Vaapil, M., Helczynska, K., Villadsen, R., Petersen, O. W., Johansson, E., Beckman, S., et al. (2012). Hypoxic Conditions Induce a Cancer-Like Phenotype in Human Breast Epithelial Cells. PLoS One 7:e46543. doi: 10.1371/journal.pone.0046543
Visschedijk, A. H. J., Ar, A., Rahn, H., and Piiper, J. (1980). The independent effects of atmospheric pressure and oxygen partial pressure on gas exchange of the chicken embryo. Respir. Physiol. 39, 33–44. doi: 10.1016/0034-5687(80)90012-2
Wagner-Amos, K., and Seymour, R. S. (2002). Effect of regional changes to shell conductance on oxygen consumption and growth of chicken embryos. Respir. Physiol. 129, 385–395. doi: 10.1016/s0034-5687(01)00320-6
Wangensteen, O., Wilson, D., and Rahn, H. (1970/71). Diffusion of gases across the shell of the hen’s egg. Respir. Physiol. 11, 16–30. doi: 10.1016/0034-5687(70)90099-x
Wangensteen, O. D., and Rahn, H. (1970). Respiratory gas exchange by the avian embryo. Respir. Physiol. 11, 31–45. doi: 10.1016/0034-5687(70)90100-3
Keywords: hypoxia, embryogenesis, eggshell membrane, diffusion coefficient, oxygen consumption rates (VO2), evolution, HIF-α, cancer
Citation: Carroll C, Engström N, Nilsson PF, Haxen ER, Mohlin S, Berg P, Glud RN and Hammarlund EU (2021) Hypoxia Generated by Avian Embryo Growth Induces the HIF-α Response and Critical Vascularization. Front. Ecol. Evol. 9:675800. doi: 10.3389/fevo.2021.675800
Received: 03 March 2021; Accepted: 03 May 2021;
Published: 14 June 2021.
Edited by:
Frederick R. Adler, The University of Utah, United StatesReviewed by:
Gerardo Antonio Cordero, University of Tübingen, GermanyJeffrey West, Moffitt Cancer Center, United States
Copyright © 2021 Carroll, Engström, Nilsson, Haxen, Mohlin, Berg, Glud and Hammarlund. This is an open-access article distributed under the terms of the Creative Commons Attribution License (CC BY). The use, distribution or reproduction in other forums is permitted, provided the original author(s) and the copyright owner(s) are credited and that the original publication in this journal is cited, in accordance with accepted academic practice. No use, distribution or reproduction is permitted which does not comply with these terms.
*Correspondence: Emma U. Hammarlund, emma.hammarlund@med.lu.se