Colour Discrimination From Perceived Differences by Birds
 Jair E. Garcia
 Detlef H. Rohr
 Adrian G. Dyer
- 1BIDS Lab, School of Media and Communication, RMIT University, Melbourne, VIC, Australia
- 2Evolution and Ecology Research Centre, University of New South Wales, Sydney, NSW, Australia
The ability of visual generalists to see and perceive displayed colour signals is essential to understanding decision making in natural environments. Whilst modelling approaches have typically considered relatively simple physiological explanations of how colour may be processed, data on key bee species reveals that colour is a complex multistage perception largely generated by opponent neural representations in a brain. Thus, a biologically meaningful unit of colour information must consider the psychophysics responses of an animal engaged in colour decision making. We extracted previously collected psychophysics data for a Violet-Sensitive (VS) bird, the pigeon (Columba livia), and used a non-linear function that reliably represents the behavioural choices of hymenopteran and dipteran pollinators to produce the first behaviourally validated and biologically meaningful representation of how VS birds use colour information in a probabilistic way. The function describes how similar or dis-similar spectral information can lead to different choice behaviours in birds, even though all such spectral information is above discrimination threshold. This new representation of bird vision will enable enhanced modelling representations of how bird vision can sense and use colour information in complex environments.
1. Introduction
Many animals process visual information to inform decisions that result in fitness benefits to various species. Birds, for example, may first use their vision for locating a target of interest, and then for confirming correct identification (Troscianko et al., 2009). Whilst recognition of shape and texture is likely driven by achromatic processing in birds, discriminating the spectral component of a colour signal describing the quality of a stimulus is mainly driven by colour vision (Osorio et al., 1999).
Model bird species for studying evolution such as pigeons (Darwin, 1859, 1868) are known to be omnivorous, feeding on a wide variety of fruits, seeds, insects, flowers (Murton and Westwood, 1966; Crome, 1975; Innis, 1989; Baptista et al., 2009), and sometimes acting as pollinators when opportunistically feeding on nectar (Dalsgaard et al., 2016). In all these instances birds will likely use their colour vision to process information allowing for the initial detection of targets, and to subsequently discriminate a preferred option from sub-optimal alternatives simultaneously available.
When colour differences between stimuli are large, take for example preferred and opposing teams in a sport match dressed in yellow or blue, discrimination is both rapid and accurate. However, if respective teams were garbed in similar colours such as green and turquoise, both accuracy and speed of discrimination would likely be impaired leading to a less accurate and slower response (Chittka and Osorio, 2007). Thus, well-beyond any theoretical discrimination limit to colour vision imposed by physiological aspects, colour similarity affects performance as it has been demonstrated on important pollinators like bees (Dyer and Chittka, 2004) and hoverflies (Hannah et al., 2019). Indeed, classic colour discrimination experiments with humans (MacAdam, 1942) show that accuracy diminishes with similarity up to a point where target and distracter become indistinguishable from each other and the observer chooses randomly between them; by the same token, increasing colour differences facilitate detection of targets concealed by background matching in real scenarios (Niu et al., 2020; Dyer and Garcia, 2021). Olsson et al. (2015) showed that accuracy of discrimination by chickens also increases with colour dissimilarity from chance level, to a range between 80 and 100% in a non-linear but continuous fashion. Such psychophysics evidence is likely to be mediated by the probabilistic way in which neurons can code and respond to the salience of different colour signals (Komatsu and Ideura, 1993).
The ability to predict the likely outcome of a colour discrimination event from physiological and physical properties of both observer and stimuli is fundamental for plant-animal interaction studies. For example, one could measure the reflectance spectra from flowers of different species and use a model for formulating testable hypothesis on the effect of colour signalling as means to establish relationships between plant and animal which are evolutionary meaningful (Pauw, 2019). Whilst such models are now available for hymenopteran pollinators such as honeybees and bumblebees (Garcia et al., 2017), and have been applied to mapping plant-pollinator interactions (Shrestha et al., 2019; Garcia et al., 2020), currently there is no model which allows for an accurate and unbiased prediction of animal responses considering (dis)similar colours as those likely to be encountered by a bird observer. The development of such models likely serves to improve our understanding of the processing for visual information produced by stimuli like fruits (Schaefer et al., 2008), egg shells (Hanley et al., 2019), or mating partners and nesting choices (Endler and Day, 2006).
Most models currently employed to understand colour discrimination by birds are based on purely physiological data at photoreceptor level, and specifically ignore the effects of neural processing by the brain of colour information (Avilés, 2020). This position of physiologically mediated colour discrimination does not fit evidence from primates showing that processing of such signals is a multistage process involving different brain regions with various degrees of specialisation (Solomon and Lennie, 2007). Furthermore there is strong evidence in invertebrates that colour processing is mediated a high levels of the insect brain (Paulk et al., 2009; Mota et al., 2013; Lin et al., 2016), strongly suggesting that colour information processing requires higher level structures in a wide range of animals.
Considering the current use of colour models for birds, the receptor noise (RN) model (Vorobyev and Osorio, 1998) has been proposed to be a solution for predicting the minimum colour difference of two stimuli required by a bird observer to discriminate between them, the so called just noticeable difference (JND). Interestingly, and in spite of its wide implementation for avian studies, the RN model assumptions are built on noise receptor data and behavioural responses from an invertebrate model: the European honeybee (Apis mellifera; Vorobyev et al., 2001). In the RN model, the difference between two coloured stimuli is not expressed in a colour space but is equated with a perceived difference expressed in JND (Pike, 2012). Whilst this model is proposed to be useful for both invertebrate and vertebrate observers, behavioural validation of the RN model predictions with avian observers has provided mixed results (Lind and Kelber, 2009).
Currently, it is accepted that validation of RN's predictions is subject to the appropriate choice of parameters, particularly, the noise level within photoreceptors (Olsson et al., 2015; Avilés, 2020). Regrettably, these measurements remain outstanding for any bird species, and approximations for the real values for these parameters based on purely theoretical assumptions are used instead (Olsson et al., 2018). Even for the two key model species for which photoreceptor noise values are available, the honeybee (Vorobyev et al., 2001) and the bumblebee (Skorupski et al., 2007), RN fails to predict discrimination accuracy observed in behavioural experiments when considering experimentally measured noise values (Vorobyev et al., 2001; Avarguès-Weber et al., 2010; Garcia et al., 2017, 2018).
An alternative formulation for predicting colour discrimination in animals was proposed by von Helversen (1972a). His approach aims to formulate a monotonic function linking a physical measure of colour dissimilarity, as for example the distance of two stimuli in a colour space, to a measure of the accuracy achieved by an observer when discriminating between these stimuli. This monotonic function approach proposed by von Helversen (1972a) contrasts starkly with the position of producing a single metric predicting perceptual difference proposed by the RN model.
A monotonic function describing the accuracy of colour discrimination task from a subject-independent measurement of (dis)similarity constitutes a representation of the psychophysical law (Norwich, 1987). More specifically, a colour discrimination function links an objective measurement of dissimilarity, distance in colour space (ΔC), with the subjective perception of colour dissimilarity experienced by an observer. Implementation of the psychophysical law for describing the relationship between objective and perceived differences in magnitude of stimuli such as heaviness, loudness, taste, and other stimuli (Stevens, 1957) suggests that this relationship is non-linear, and can described by either a logarithmic or power function depending on conditions (Norwich, 1987). Thus, a relationship informed by physchophysical data more fully represents the complete perceptual processing by the sensory system of the animal, which is the essential driver of observed behaviour.
Recently, such a psyschophysical approach has been proposed for predicting colour discrimination in hymenopteran pollinators based on non-linear, sigmoidal functions rather than JND magnitudes. These models predict changes in the probability of discrimination with colour distance based on the result of psychophysics experiments (Garcia et al., 2017), rather than just predicting if the considered colour distance is either below or above a single theoretical JND discrimination threshold. In other words, models based on monotonic functions help assessing the uncertainty around an animal choice based on colour difference rather than just predicting if the animal can perceive, or not, the dissimilarity between two stimuli. The specific shape a colour discrimination function is given by the interaction between physiological aspects of colour vision for a given observer and the processing of such signals by the animal's brain as predicted by von Helversen (1972a).
In the present manuscript we develop a new framework for a colour discrimination function for a violet sensitive bird based on behavioural responses of the pigeon Columba livia. Importantly, pigeons are generalist foragers (Baptista et al., 2009; Dalsgaard et al., 2016) and a behaviourally accessible avian species for which it has been possible to collect precise psychophysics data on colour discrimination tasks (Wright, 1972). Our proposed model predicts the sensitivity index of colour discrimination, a more comprehensive measure of accuracy based on signal detection theory (see section 2 below), using a monotonic function described by a simple algebraic expression. We enable this solution without making assumptions about currently unknown photoreceptor noise parameters of a bird observer, thus overcoming one of the principal limitations of current modelling efforts. The function's accuracy to predict observed discrimination behaviour by the pigeon is then compared to that of the RN model for the same set of stimuli.
2. Materials and Methods
2.1. Sensitivity Index of Colour Discrimination
In a dual choice experiment, for example a colour discrimination test, the response of a subject can be coded as the proportion of correct choices p(c), expressed as the number of hits (n) obtained out of N trials (p(c) = n/N), and the proportion of incorrect choices q(c) = 1 − p. It is possible to obtain a deeper insight into the decision making process by coding two more variables representing the proportion of false alarms, mistakenly recognising the alternative choice as the reference; and, the proportion of correct rejections for the alternative choice (MacMillan and Creelman, 2005). These measurements can then be used to obtain a single measurement of sensitivity d′ describing the ability of an observer to discriminate between stimuli of varying similarity (MacMillan and Creelman, 1990).
A subject with high sensitivity for a colour discrimination task is expected to have a relatively high hit rate relative to the false alarm rate even if its performance is not perfect. The magnitude of d′ will generally increase with the proportion of correct choices or the decrease of false alarms; however, different hit/false ratios can be obtained for the same magnitude of d′ (MacMillan and Creelman, 2005). This relationship is graphically depicted by a relative operating characteristic (ROC) curve (MacMillan and Creelman, 2005), as the one presented in Figure 1.
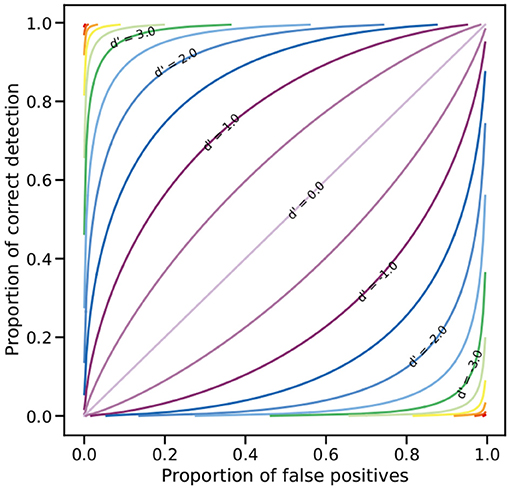
Figure 1. Relative operating characteristic (ROC) on linear coordinates. Any point on a line represents the different combinations of hit rates and false positive rates leading to the same sensitivity index value (d′). The diagonal (d′ = 0) represents the chance line where the hit and false positives rates are equal; as sensitivity increases, i.e., d′ > 0, the slope of the lines also increase. Negative d′ values are obtained when sensitivity decreases from chance level as a result of a higher proportion of false positive relative to the hit rate.
2.2. Colour Discrimination Experiment
In his discrimination experiment, Wright (1972) trained 4 pigeons (C. livia) to associate a set of 20 different quasi-monochromatic stimuli ranging from about 470 to 660 nm at 10nm intervals, with a food reward. Once the subjects had learned to associate a reference stimulus with the reward, pigeons were subsequently asked to discriminate the reference from a set of novel stimuli increasing in colour dissimilarity relative to the reference by having their peak transmission value shifted toward wavelengths shorter than that of the reference.
Experimental stimuli consisted of quasi monochromatic signals produced by passing a light source through a set of interference filters, each producing a quasi-monochromatic stimulus very similar to those presented in Figure 2. During the discrimination experiments, novel and reference stimuli were presented simultaneously in a bipartite screen thus ensuring a simultaneous viewing condition, which is essential for measuring colour discrimination for small differences (Wyszecki and Stiles, 1982; Kulikowski et al., 1991; Dyer and Neumeyer, 2005). The order of stimuli presentation was randomly determined for each one of the test subjects. Hit and false alarm rates produced by each subject where then used to calculate the sensitivity index (d′) for the each tested colour. For any given subject, higher d′ values are produced when the rate of hits is higher than false alarms, resulting from a lower number of errors.
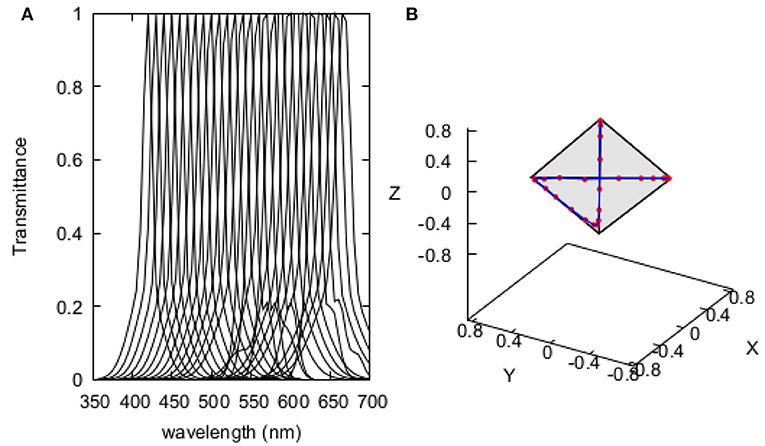
Figure 2. Recovered spectral profiles of the 20 quasi-monochromatic stimuli used by Wright (1972) for determining the colour discrimination sensitivity index of the pigeon Columba livia (A); and, their representation in the tetrahedron space (B). Spectral profiles were obtained by implementing Equation (2) using coefficients in Supplementary Table 1.
We began constructing our discrimination model by recovering the d′ values corresponding to each of the 20 reference stimuli tested by Wright (1972) using the expression:
where m is the slope of a simple, linear psychometric function describing change in sensitivity as a function of spectral difference between the reference and the stimuli (Δλ). We used the values of m reported in Table 1 of Wright (1972) for the calculations.
Similarly to models developed for hymenopteran pollinators (Garcia et al., 2017), our avian discrimination function uses colour difference between two stimuli ΔC as independent variable. We thus converted Wright's original Δλ into ΔC values by calculating the Euclidean colour distance corresponding to each pair of the quasi monochromatic stimuli used in the experiment modelled in a tetrahedron colour space suitable for modelling bird vision (Endler and Mielke, 2005). Stimuli were characterised by means of the spectral transmittance profile of the interference filters used to produce them, modelled by a Gaussian function with three terms (Equation 2) fitted to the spectral transmittance chart of one of the Baush and Lomb interference filters originally used for the behavioural experiment.
Each transmittance function was evaluated from 300 to 700 nm at 5nm intervals. The λ coefficient in Equation (2) indicates the position of peak transmittance, so this term was systematically varied within the tested spectral range to recover the transmittance function of the different reference and test stimuli used in the behavioural experiment. Modelled spectra corresponding to the different stimuli are presented in Figure 2 along with their representation in the tetrahedron colour space. Coefficients determining the various transmittance curves used as stimuli are provided in Supplementary Table 1.
2.3. Colour Modelling
There are currently three models suitable for modelling colour stimuli for avian vision (Goldsmith, 1991; Vorobyev and Osorio, 1998; Endler and Mielke, 2005). Of these, only models by Endler and Mielke (2005) and the RN model (Vorobyev and Osorio, 1998) account for light adaptation and colour constancy through the implementation of a von Kries-type scaling of photoreceptor sensitivity to match the spectral properties of the illumination and background (Vorobyev and Osorio, 1998; Endler and Mielke, 2005; Renoult et al., 2017). Only the model proposed by Endler and Mielke (2005) allows for a representation of colour stimuli independent from perceptual assumptions of the observer (Pike, 2012) by expressing colour samples as three-dimensional loci in the volume of a tetrahedron (Endler and Mielke, 2005). Even though the scaling of this colour space axis is arbitrary, and purely based on geometrical principles, its use permits current best practice for expressing colour dissimilarity by means of the Euclidean distance between loci.
We used the nomogram proposed by Stavenga et al. (1993) to model the spectral transmission of the photoreceptors present in the single cones of the pigeon (C. livia). For our modelling we used peak absorption of values of 404, 452, 506, 566 nm for the violet, short, medium, and long photoreceptors, respectively (Hart and Vorobyev, 2005). Spectral transmission profiles of the oil droplets of the pigeon were modelled using the methods and parameters reported by Hart and Vorobyev (2005) with half maximum absorptance values of (λmid) of 470, 542, 613 nm for the clear, yellow and red types, respectively with a λT0.5= 338nm as suggested by Hart and Vorobyev (2005). Ocular transmittance was modelled using the average function for violet sensitive birds by Endler and Mielke (2005) by evaluating the function:
and subsequently shifting the resulting function along the x-axis by (λ50 − 335.2) with a λ50 = 362 as suggested for modelling violet-sensitive bird vision (Endler and Mielke, 2005). For our calculations we assumed a daylight illumination typical of an open sky during midday (CIE D6500) (Judd et al., 1964) expressed as quantum flux, and a background reflecting 25% of all incident radiation between 300 and 700 nm.
2.4. Curve Fitting and Statistical Analysis
Initial plots corresponding to the observed d′ values for each of the tested reference stimuli showed a non-linear relationship between sensitivity index and the various colour differences tested. Pilot curve fitting trials suggested that a power function with general form:
fitted the data better than other functions involving logarithms or exponential terms.
Power functions, producing a monotonic curve, have a long tradition in psychophysical studies having been used to describe the relationship between perceived difference and magnitude of stimuli such as loudness, brightness, heaviness, and taste in experiments using human subjects (Stevens, 1957).
The function described by Equation (4) may take either a convex or concave shape depending on the magnitude of m (Figure 3): when the function takes a convex shape, initial small changes in the stimulus magnitude lead to large perceptual differences. On the other hand, when the function is concave large changes in the stimulus magnitude are required to drive small differences in perception. The parameter a defines the function slope: large magnitudes result in steeper functions whilst a = 0 produces a straight line where perceived magnitude would remain constant in spite of any changes to the stimulus magnitude (Figure 3).
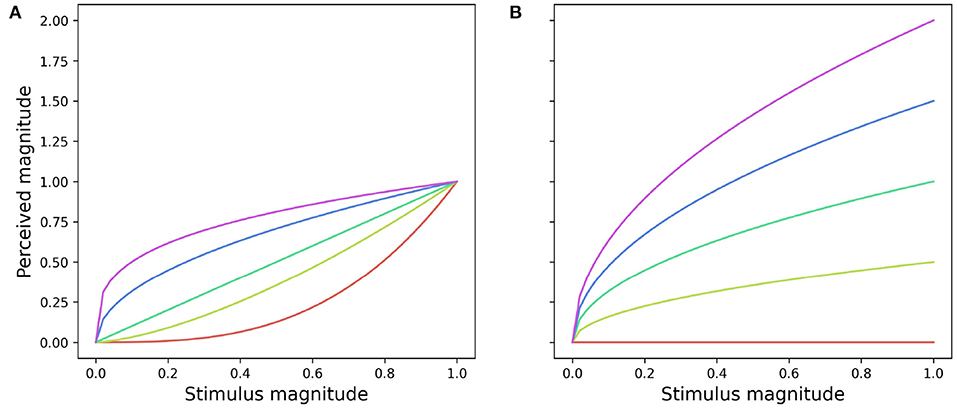
Figure 3. Effect of coefficients a and m on the shape (A) and slope (B) of a power function (Equation 4) describing the magnitude of perceived change. (A) Effect of changing the value of m from 0.3 (red line) to 3 (purple line) for a = 1.0. (B) Changes in the slope of a power function resulting from increasing the value of a from 0 (red line) to 2 (purple line) for m = 0.5.
We built an initial model based on Equation (4). The independent variable was the colour distance (ΔC) between each one of the 20 references, and their respective five test stimuli. The response variable was the observed d′, corresponding to the ratio of hits and false alarm. The initial model included random terms for the a and m parameters to account for any potential differences in the shape or slope of the discrimination function with reference wavelength.
The initial non-linear model was fitted using the nlme package (Pinheiro and Bates, 2000) for R statistical language (R core). Significance of the random terms was tested by means of likelihood ratio tests (LRT) between the initial full model and reduced versions excluding the random terms for the a and m variables (Pinheiro and Bates, 2000). Once significant random terms were identified, we proceeded to evaluate the final model using Bayesian modelling techniques employing the package brms (Bürkner, 2017) v 2.13.5 for R. The Bayesian model was initialised assuming diffuse, normally distributed priors for the a and m parameters, and a half Cauchy distribution for the random terms (Zuur et al., 2013). The final model was fitted with 4 chains, each consisting of 100,000 iterations with a burn-in of 50,000 and thinning rate of 10. The data set consisted on 100 observations corresponding to five d′ values for each of the 20 stimuli used as reference.
2.5. Receptor Noise Modelling and Model Comparison
We calculated colour difference (ΔS) between each of the 20 reference stimuli and their respective test signals. Differences were calculated implementing the receptor noise model for colour threshold (Vorobyev and Osorio, 1998; Vorobyev et al., 2001) given by:
where Δq denotes the difference in photon captured by qi photoreceptors of spectral radiation reflected or emitted by two stimuli, after correcting for light adaptation using a von Kries transformation (Vorobyev and Osorio, 1998). Coefficients e denote the noise amount limiting colour discrimination in photoreceptor i. As noise values ei have only been measured for two hymenopteran species (Vorobyev et al., 2001; Skorupski and Chittka, 2010), ei values for the pigeon where estimated by means of where νi denotes Weber fraction and ηi is the relative abundance of each of the i photoreceptor classes in the observer's retina (Vorobyev and Osorio, 1998). In our calculations we used ν = 0.05, a value typically assumed for a wide range of vertebrate observers (Endler and Mielke, 2005; Santiago et al., 2020), and density ratios for the violet, short, medium, and long wavelength photoreceptors V:S:M:L of 1:1:1:2 as reported by Vorobyev and Osorio (1998). However here we explicitly state that the assumed value of ν = 0.05 is used for convenience of modelling and currently no empirical data exists to support this value (Kemp et al., 2015).
Classically, the threshold for a colour discrimination experiment is set to p(c) = 0.75, or a 75% of correct choices (von Helversen, 1972b; Kelber et al., 2003). In its original formulation, the receptor noise model set ΔS to this value (Vorobyev and Osorio, 1998) which is approximately equivalent to a d′ = 1 where 75% of correct choices correspond to a proportion of false positives of 0.25 (Figure 1). Endler and Mielke (2005) propose that ΔS = 2 corresponds to a colour difference that can be distinguishable by a bird with an accuracy of 95%, equivalent to about d′ = 2 with an increase in the proportion of false positives to a little more than 0.3, or to d′ = 2.5 with a reduction in the proportion of false positives to about 0.25 (Figure 1). These relationships suggest that predictions from the RN model should be directly comparable with d′ values thus allowing for a comparison of the goodness of fit of the RN model and the colour discrimination function to the described by Equation (4) to the behavioural data available.
Various Weber fraction values (ν) for the RN model and posterior distributions of the parameters a and m for the CDSF function, were used to measure effect of the respective parameter(s) value on the predictive power of each model. For the RN model, we sampled 100,000 pseudo-random ν-values from an uniform distribution ranging from ν = 0.05 to ν = 0.10, and used these to calculate ΔS corresponding to the outcome of Wright (1972) discrimination experiments. This range of the used ν-values encompasses the different magnitudes of Weber fraction reported by previous authors when validating the RN model as a method for predicting colour discrimination thresholds for bird vision (Olsson et al., 2018): ν = 0.05 (Endler and Mielke, 2005), ν = 0.06 (Olsson et al., 2015), and ν = 0.10 (Vorobyev and Osorio, 1998; Lind et al., 2014). We calculated the root mean square error (RMSE) for predictions obtained from each ν-value to obtain an effect measurement of Weber fraction value on the predictive power of the RN model. Likewise, we evaluated the 100,000 a and m values making up the posterior distribution of these parameters to predict d′ using the formulation of the CDSF function only including fixed-terms (Equation 4) and calculated respective RMSE values.
3. Results
3.1. Colour Discrimination Sensitivity Function (CDSF)
Likelihood ratio tests evidence that the slope () of CDSF changes significantly with wavelength of the reference stimuli so a random term was included for the shape parameter (a in Equation 4). We found that the parameter defining the shape of the function changed significantly with reference wavelength (). Pilot modelling using a green adaptation background revealed a non significant variation of the function shape with wavelength of the reference stimuli (); therefore we did not include a random term for shape in the final model.
The CDSF (Figure 4) describes changes in sensitivity of a VS bird when discriminating coloured stimuli from 470 to 660nm. The model allows predicting discrimination accuracy in terms changes of sensitivity index (d′) for colour differences ranging from ΔC = 0 to ΔC = 1 between 470 and 660 nm, and is mathematically described by:
where the fixed terms a and m describe the slope and shape of the function, respectively, whilst the α coefficient describes random variation in the function slope at each one of the i = 20 reference wavelengths tested. Median and 95% credibility intervals for the posterior distributions of the fixed parameters of the model are provided in Table 1. Details on the posterior distributions of random terms are available as Supplementary Material 2.
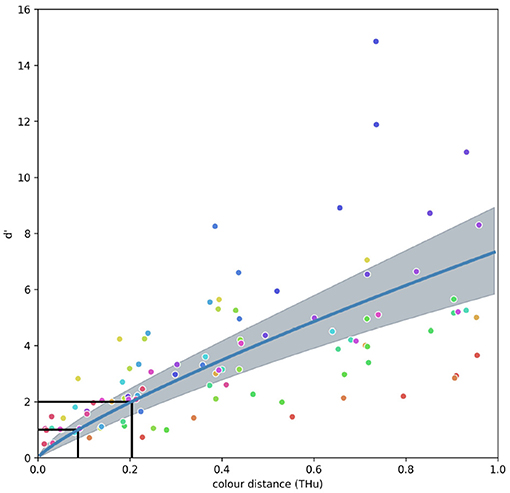
Figure 4. Fixed terms model representing the colour discrimination sensitivity function (CDSF) and associated 95 % credibility intervals for a violet-sensitive bird observer predicting the sensitivity index (d′) for a discrimination task between stimuli of increasing colour dissimilarity (ΔC). Sensitivity index is related to the ratio of hits to false positives with d′ ≥ 1 representing a proportion of hits above 75% with ratio of false positives <30% as illustrated by the ROC curve in Figure 1. Colour circles represent the 20 different reference wavelengths tested by Wright (1972), colour code is the same as in Figure 5. Black lines indicate the ΔC values of 0.088 and 0.204 THu required to attain d′ = 1 and d′ = 2, respectively.
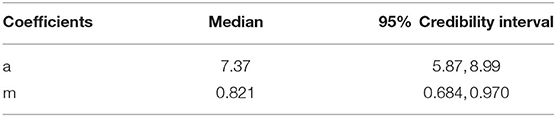
Table 1. Median and 95% credibility intervals of the a and m parameters describing the colour discrimination function of a violet sensitive bird to a set of 20 different quasi monochromatic stimuli from 470 to 670 nm.
The shape of the CDSF suggests that small changes in colour distance rapidly increment the sensitivity index thus increasing the probability of accurate discrimination whilst diminishing the likelihood of false positives (Figure 4). Indeed, the function predicts that a change from about ΔC = 0.1 between similar colours lead to a change in sensitivity values of about one d′ unit.
The colour discrimination sensitivity model for a VS bird predicts that differences of about ΔC = 0.204 tetrahedron units (THu) can be discriminated with a sensitivity of d′ = 2.0, which is approximately equivalent to a correct discrimination of about 80% with a false alarm rate of <20% (Figure 1). Likewise, colour differences of about ΔC = 0.144 THu yield a d′ = 1.5 equivalent to about the same proportion of correct choices, but with a higher false alarm rate. Finally, colour differences ΔC = 0.088 THu are predicted to be correctly discriminated about 75% of the time with a false alarm rate of about 25% (d′ = 1.0), whilst colour differences ΔC ≈ 0 THu will fall very close to chance level (d′ = 0). Values of ΔC corresponding to any d′ of interest can be obtained by inverting Equation (4) and using values reported in Table 1 for the fixed terms a and m. Random terms αi corresponding to each of the i = 20 reference stimuli are presented in Supplementary Table 2. These calculations can be easily performed using any spreadsheet program, or coded into functions for programming languages such as R or Python.
When considering the random effects for each tested wavelength (Figure 5), the CDSF predicts the greatest sensitivity index for spectral radiation of 600 and 500 nm, indicating that birds can best discriminate colour signals rich in long wavelength radiation.
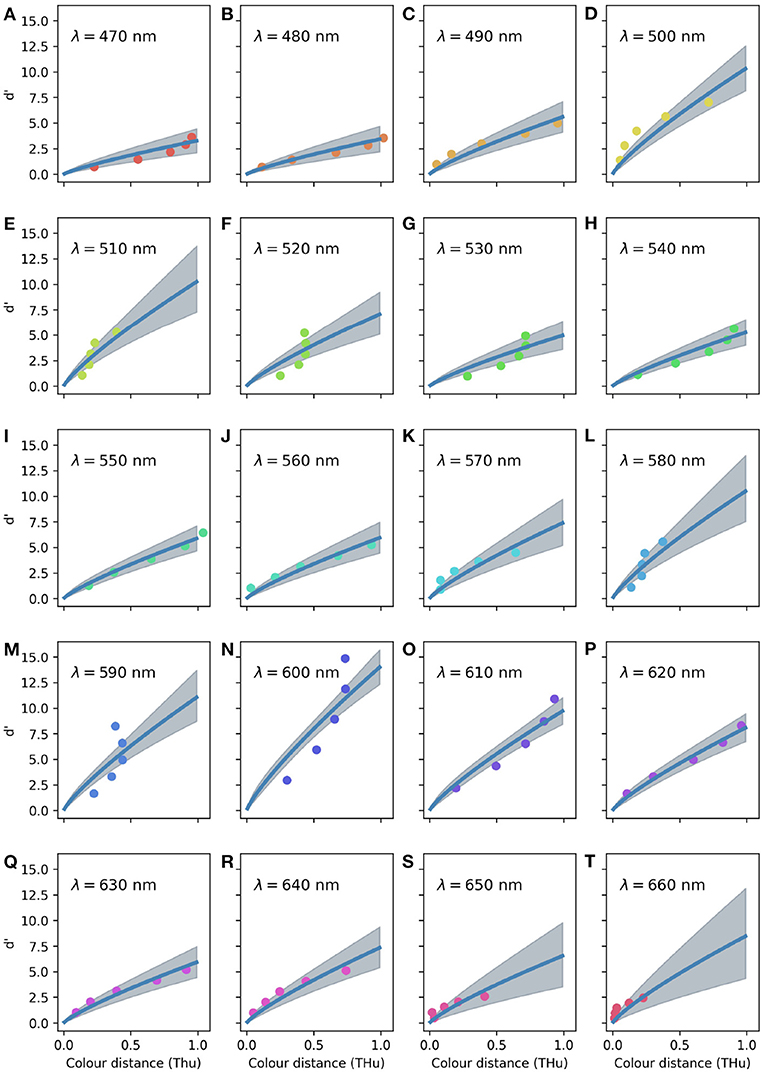
Figure 5. Colour discrimination sensitivity model for a violet sensitive bird accounting for fixed and random terms for of the 20 reference wavelengths tested by Wright (1972) as indicated on the legend for (A–T). Circles indicate observations corresponding to the five different stimuli tested for each reference wavelength. Marker colours have no relationship with the visual appearance of the stimuli, hues were selected to ease visual interpretation.
3.2. Model Evaluation
Mean RMSE value for the RN model was of 11.6 (95% confidence intervals (CI) 7.48–17.8). The minimum RMSE value of 7.33 was obtained when ν = 0.10, whilst the maximum RMSE of 18.31 corresponds to ν = 0.05, the value often recommended as the best approximation for the unknown Weber fraction for birds. On the other hand, the mean RMSE value for the fixed-term only CDSF function (Equation 4) was of 2.04 (95% CI 1.95–2.27). Minimum RMSE for the CDSF function was of 1.92 with a maximum value of 4.40. The RMSE value for the CDSF function is further reduced to 0.927 when considering the random terms corresponding to each one of the stimuli tested by Wright (Equation 6).
When only considering predictions of the RN model within a discrimination threshold ΔS = 1−2, corresponding to a probability of correct choices between 75 and 95%, we obtained a mean RMSE of 6.02 (95% CI 4.07–8.97). For this subset, the minimum RMSE was also obtained when ν = 0.10. On the other hand, mean RMSE for the CDSF function for d′ values between 1 and 2 was of 1.12 (95% CI 0.882–1.40). A graphical summary of these results are provided in Figure 6.
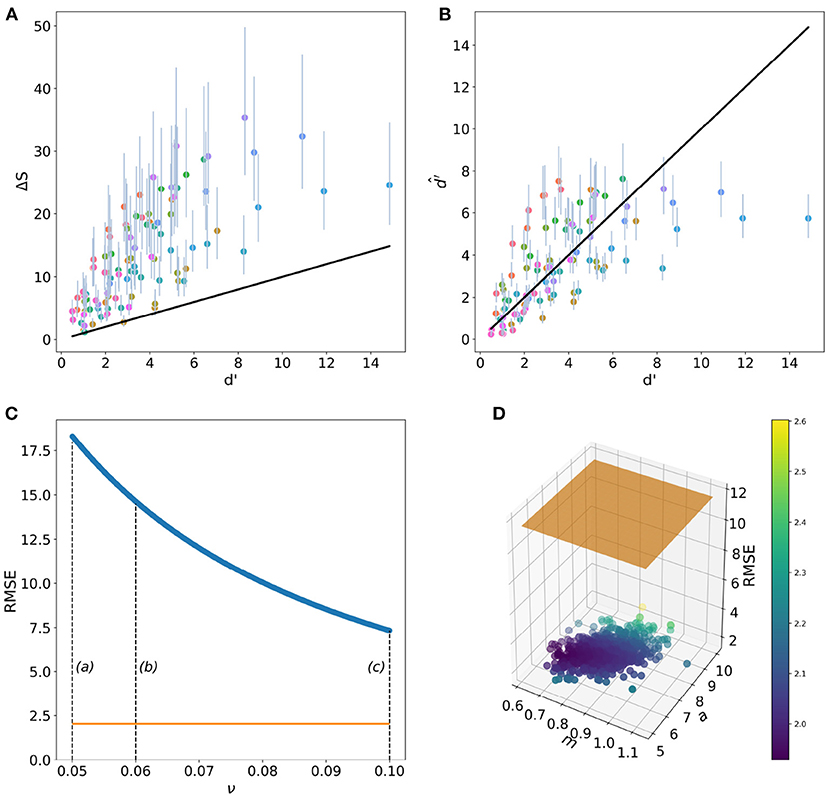
Figure 6. Performance of the receptor-noise (RN) limited model (A) and the CDSF model (B) when predicting the outcome of Wright's (1972) colour discrimination experiment (solid lines). Circular markers and vertical lines in panel A represent the mean and 95 % confidence intervals (CI) of ΔS values from 100,000 predictions of the colour discrimination experiments by Wright (1972) using Weber fraction values (ν) ranging from 0.05 to 0.1. Markers and vertical lines in (B) represent mean and 95 % CI d′ values predicted by the CDSF model () after evaluating the 100,000 coefficients present in the posterior distributions for the fixed terms a and m in Equation (4) for the same stimuli. Root mean square error (RMSE) for the predictions of the RN (C) and CDSF (D) discrimination functions. (C) Shows how the RMSE for RN diminishes as the noise parameter departs from ν = 0.05. Dashed lines in (C) indicate the magnitude of Weber fraction values typically reported in the literature: (a) ν = 0.05 (Endler and Mielke, 2005), (b) ν = 0.06 (Olsson et al., 2015), and (c) ν = 0.1 (Vorobyev and Osorio, 1998; Lind et al., 2014). The orange line indicates the mean RMSE value corresponding to the CDSF function for the same colour differences. (D) Shows a 1,000 RMSE values sub sample out of the total 100,000 RMSE values obtained after evaluating the CDSF function with all the a and m parameters making up the posterior distributions recovered from the Bayesian fitting procedure. Marker colour represents RMSE value as indicated by the colour bar. Orange plane represents the mean RMSE value for the RN model for the same set of stimuli.
Discussion
In the current study we consider if psychometric functions may offer a holistic modelling solution for understanding VS-sensitive, avian decision making considering (dis)similar colours when compared to the noise-limited colour discrimination model (RN).
Predictions from RN depend on the precise value of its various parameters, and in particular, on the magnitude of noise coefficients (ei) assigned to the different photoreceptors (Lind and Kelber, 2009). In spite of the wide use of the RN model for answering questions regarding avian visual ecology such as: discrimination of parasitic eggs by hosts (Hanley et al., 2019), camouflage by female birds (Cain et al., 2019), and perceived flower colour variation by pollinating species at population level (Whitney et al., 2020); to cite just a few recent examples, no noise measurement data currently exist for any avian species. In most cases, the unknown but essential noise values are derived from applying theoretical assumptions of signal detection theory to photoreceptor density data (Vorobyev and Osorio, 1998), although it still remains unclear how neural processing by the brain may affect these assumptions. This is important as birds and other animals are known to use various strategies to counteract limitations imposed to vision by the physiological properties of their visual system. For example, spatial pooling for increasing signal-to-noise ratio under dim illumination (Warrant, 1999) is likely to occur in some species of owls (Orlowski et al., 2012) and nocturnal parrots (Corfield et al., 2011; Iwaniuk et al., 2020). Likewise, it remains largely unknown how external factors such as temperature and light intensity may affect photoreceptor noise values, and how neural processing may compensate for such fluctuations. Indeed, experiments on frogs under laboratory controlled conditions (Aho et al., 1988) suggest that visual performance could be affected by temperature if receptor noise were the only or primary factor mediating colour discrimination. Such basic physiological limitations would likely apply to many animals unless neural corrections resolve how colour can be reliably perceived in naturally occurring visual conditions.
The colour discrimination sensitivity function (CDSF) for a violet-sensitive bird observer (Figure 4), takes as input a measurement of colour dissimilarity and returns the likely outcome of the discrimination process expressed as a sensitivity index (d′). Through this approach CDSF accounts for the “inner-conditions” driving animal behaviour as originally hypothesised by von Helversen (1972a). Our function thus represents an application of the psychophysics law where the relationship between objective and perceived colour difference is modelled by a power function (Equation 6) as experimentally obtained for modelling perceived changes in the magnitude of stimuli such as heaviness and loudness (Stevens, 1957).
An additional advantage of the CDSF function is that it allows for a precise definition of the just noticeable difference for colour discrimination by means of the Weber fraction. The Weber fraction describes the difference in stimulus magnitude that is just noticeable by an observer (Debats et al., 2012), quantitatively expressed as a derivative of the psychophysics law (Norwich, 1987). By differentiating Equation (6) (Supplementary Figure 1), and evaluating the resulting function for a range of colour differences, we can see how for bird vision large Weber fraction values are initially obtained for small colour differences and subsequently falling with increasing stimuli dissimilarity into a plateau region, as observed for other perceptual tasks such as taste and brightness (Norwich, 1987). This approach allows for a more precise definition of the just noticeable colour differences perceivable by a bird observer, representing an improvement over the extrapolation of the behavioural and physiological results obtained from observations on the insect model species used for validating the RN assumptions (Vorobyev et al., 2001). Indeed, previous behavioural validation of RN assumptions for bird colour discrimination have provided inconclusive results on the predictive accuracy of this model in the absence of measured noise data. For example, in their experiment with domestic chicks, Olsson et al. (2015) found that a Weber fraction ν = 0.06 provided a good fit for observed behavioural data on a two option colour discrimination task under bright light conditions. This value is 40% smaller than the ν = 0.1 sometimes suggested as noise parameter for modelling bird vision (Vorobyev and Osorio, 1998; Lind et al., 2014), evidencing the susceptibility of RN predictions to errors when assumptions of their parameters are made (Lind and Kelber, 2009; Bitton et al., 2017).
In spite of its algebraic simplicity (Equation 1), the CDSF is flexible enough as to accommodate for potential changes in sensitivity produced by stimuli of different hue (Figure 5). Indeed, the statistical significance of the random term αi in Equation (6) suggests that the magnitude of colour dissimilarity required to perceive two loci as being different changes with the spectral position of the transmittance peak of the stimuli (Figure 5); in other words, birds likely discriminate some colours better than others. Asymmetries in the ability to discriminate colour stimuli depending on hue have also been reported for human observers (Wyszecki and Stiles, 1982), macaque monkeys (Komatsu and Ideura, 1993), honeybees (von Helversen, 1972b; Dyer and Neumeyer, 2005), bumblebees (Dyer et al., 2008), stingless bees (Spaethe et al., 2014), Drosophila flies (de Salomon and Spatz, 1983), hoverflies (Hannah et al., 2019), and domestic chicks (Gallus gallus) following associative training (Olsson et al., 2015). Moreover, by using two coefficients the colour discrimination sensitivity function can take different shapes (Figure 3) potentially describing the effect of other cognitive-like processes affecting colour discrimination such as memory and conditioning as reported for some hymenopteran species (Dyer and Chittka, 2004; Giurfa, 2004; Avarguès-Weber et al., 2010; Dyer et al., 2011; Garcia et al., 2020).
Our data shows that modelling colour discrimination by means of the purely physiologically informed RN model (Figure 6A) leads to a greater RMSE, and thus poorer predictive power, than the CDSF either including or excluding the wavelength-specific random terms (Figure 6). For the empirical colour discrimination data for pigeons, RN predictions for the typically assumed ν = 0.05 value for modelling photoereceptor noise in birds, we obtained an RMSE error 95 % higher than the one resulting from implementing the discrimination function only including fixed terms (Figure 6C). This result is consistent with previous studies reporting that RN is not well suited for modelling perceptual colour distances of 1–3 jnd which are beyond the discrimination threshold (Bitton et al., 2017; Marshall, 2018; Olsson et al., 2018). Whilst an improvement of the RN model predictions was obtained when using a ν = 0.1, RMSE for this value was still 28% higher than the mean RMSE value for the CDSF. The CFSD model still provides a better estimate of colour discrimination by birds than the RN alternative when considering the 75–95% discrimination threshold range for which the RN was originally calibrated using an insect model (Vorobyev et al., 2001).
The CDFS function accurately predicts bird discrimination for colour differences between 0.25 < ΔC ≤ 0.5 THu for which pigeons show a sensitivity d′ > 2 (Figures 4, 5). Colour differences of this magnitude are large enough as to be discriminable with an accuracy of about 90 % with a false positive proportion of <10% (Figure 1) indicating that they are easily distinguishable by a violet sensitive bird. Such salient and robust colour signals are likely to be produced during plant pollinator interactions to attract animal pollination vectors like birds or bees (Lunau et al., 2011) as a solution to overcome the “colour noise” produced by natural variability of flower pigmentation that might confuse decision making (Dyer et al., 2012; Garcia et al., 2018; van der Kooi et al., 2019; Garcia et al., 2020).
Perceptual effects of colour differences ΔC > 6.0 are poorly predicted by the CDSF model. This result may be interpreted as the effect of processes such as categorisation when judging large colour differences as suggested by early experiments on this species (Wright and Cumming, 1971). Furthermore, a large colour difference between target and background increases salience of the signal attracting gaze and attention (Siuda-Krzywicka et al., 2019), which may have an effect on colour discrimination accuracy as suggested by experiments on honeybees (Giurfa, 2004; Avarguès-Weber et al., 2010). Another limitation of the CDSF model is that its predictions are currently based on pigeon responses to monochromatic stimuli. The intensity and purity of these signals may have an effect on the photoreceptor adaptation process potentially affecting discrimination accuracy when compared to responses obtainable from broad-band, colour stimuli as those typically produced by organic pigments. Nevertheless, the methodology we present can be used to re-calibrate the CDSF function to account for animal responses, which may even exist within subjects (Giurfa, 2004), to these type of stimuli once they become available. Indeed, such functions have already been derived for predicting the accuracy of colour discrimination by four hymenopteran species when observing broad-band stimuli (Garcia et al., 2017).
Pigeons have many feral and domestic breeds around the world and a demonstrated capacity to forage on a wide variety of foods including: flowers, insects, fruits, and seeds (Darwin, 1859, 1868; Murton and Westwood, 1966; Baptista et al., 2009). On the island of Cuba pigeons have been observed to feed from nectar rich flowers (Dalsgaard et al., 2016), and in Queensland, Australia, fruit pigeons were observed in a 5-year study to feed from 89 different species of plants and have diets including a variety of fruits and flowers (Innis, 1989). This suggests that pigeons require a good capacity to generalise information. Our findings that pigeons have a colour visual system that is more fully explained by a continuous discrimination function (Figures 4, 6) suggests that for other animals that have a requirement for foraging on a variety of colour stimuli it will be of value to consider this model of colour processing.
Psychometric functions linking objective measurements of dissimilarity, expressed as distance in a colour space, with perceived difference, measured as discrimination accuracy can easily accommodate a more holistic understanding of cognitive aspects of colour vision including memory, individual experience (Skorupski and Chittka, 2011), and effects of colour variability which cannot be accurately modelled by purely physiologically informed colour models (Garcia et al., 2020). This new generation of analytical tools open the door for testing interesting hypothesis about the perceptual effect of colour signalling such as flower display and plant—animal interactions with new, fresh eyes.
Data Availability Statement
The datasets corresponding to posterior distributions of the CDSF coefficients, ΔS values for the various Weber fractions simulated and their specific values presented in this study can be found in Figshare data depository (doi: 10.6084/m9.figshare.13350926).
Author Contributions
JG and AD designed the experiments. JG analysed the data and performed the statistical analyses. All authors wrote and edited the manuscript.
Funding
AD was supported by the Australian Research Council Discovery Project DP160100161.
Conflict of Interest
The authors declare that the research was conducted in the absence of any commercial or financial relationships that could be construed as a potential conflict of interest.
Supplementary Material
The Supplementary Material for this article can be found online at: https://www.frontiersin.org/articles/10.3389/fevo.2021.639513/full#supplementary-material
Supplemental data for this submission includes Supplementary Tables 1, 2 containing coefficients used for producing the Gaussian functions modelling transmittance of the interference filters used for the behavioural experiment, and median and 95% credibility intervals for the αi parameters corresponding to the random term in Equation (4), respectively.
References
Aho, A. C., Donner, K., Hyden, C., Larsen, L. O., and Reuter, T. (1988). Low retinal noise in animals with low body temperature allows high visual sensitivity. Nature 334, 348–350. doi: 10.1038/334348a0
Avargués-Weber, A., de Brito Sanchez, M. G., Giurfa, M., and Dyer, A. G. (2010). Aversive reinforcement improves visual discrimination learning in free-flying honeybees. PLoS ONE 5:e15370. doi: 10.1371/journal.pone.0015370
Avilés, J. M. (2020). Avian egg and nestling detection in the wild: should we rely on visual models or behavioural experiments? Philos. Trans. R. Soc. B Biol. Sci. 375:20190485. doi: 10.1098/rstb.2019.0485
Baptista, L. F., Martínez Gómez, J. E., and Horblit, H. M. (2009). Darwin's pigeons and the evolution of the columbiforms: recapitulation of ancient genes. Acta Zool. Mex. 25, 719–741. doi: 10.21829/azm.2009.253674
Bitton, P. P., Janisse, K., and Doucet, S. M. (2017). Assessing sexual dicromatism: The importance of proper parameterization in tetrachromatic visual models. PLoS ONE 12:e169810. doi: 10.1371/journal.pone.0169810
Bürkner, P.-C. (2017). BRMS: an R package for Bayesian multilevel models using stan. J. Stat. Softw. 80:32916. doi: 10.18637/jss.v080.i01
Cain, K. E., Hall, M. L., Medina, I., Leitao, A. V., Delhey, K., Brouwer, L., et al. (2019). Conspicuous plumage does not increase predation risk: a continent-wide test using model songbirds. Am. Nat. 193, 359–372. doi: 10.1086/701632
Chittka, L., and Osorio, D. (2007). Cognitive dimensions of predator responses to imperfect mimicry. PLoS Biol. 5:e339. doi: 10.1371/journal.pbio.0050339
Corfield, J. R., Gsell, A. C., Brunton, D., Heesy, C. P., Hall, M. I., Acosta, M. L., et al. (2011). Anatomical specializations for nocturnality in a critically endangered parrot, the kakapo (Strigops habroptilus). PLoS ONE 6:e22945. doi: 10.1371/journal.pone.0022945
Crome, F. H. (1975). The ecology of fruit pigeons in tropical Northern Queensland. Wildl. Res. 2, 93–101. doi: 10.1071/WR9750155
Dalsgaard, B., Baquero, A. C., Rahbek, C., Olesen, J. M., and Wiley, J. W. (2016). Speciose opportunistic nectar-feeding avifauna in Cuba and its association to hummingbird island biogeography. J. Ornithol. 157, 627–634. doi: 10.1007/s10336-016-1326-6
Darwin, C. (1859). On the Origin of Species by Means of Natural Selection or the Preservation of Favored Races in the Struggle for Life. London: John Murray. doi: 10.5962/bhl.title.68064
de Salomon, H. C., and Spatz, H.-C. (1983). Colour vision in Drosophila melanogaster: wavelength discrimination. J. Comp. Physiol. A 150, 31–37. doi: 10.1007/BF00605285
Debats, N., Kingma, I., Beek, P. J., and Smeets, J. B. J. (2012). Moving the weber fraction: the perceptual precision for moment of inertia increases with exploration force. PLoS ONE 7:e42941. doi: 10.1371/journal.pone.0042941
Dyer, A. G., Boyd-Gerny, S., McLoughlin, S., Rosa, M. G. P., Simonov, V., and Wong, B. B. M. (2012). Parallel evolution of angiosperm colour signals: common evolutionary pressures linked to hymenopteran vision. Proc. R. Soc. B Biol. Sci. 279, 3606–3615. doi: 10.1098/rspb.2012.0827
Dyer, A. G., and Chittka, L. (2004). Biological significance of distinguishing between similar colours in spectrally variable illumination: bumblebees (Bombus terrestris) as a case study. J. Comp. Physiol. 190, 105–114. doi: 10.1007/s00359-003-0475-2
Dyer, A. G., and Garcia, J. E. (2021). Plant camouflage: fade to grey. Curr. Biol. 31, R78–R80. doi: 10.1016/j.cub.2020.11.061
Dyer, A. G., and Neumeyer, C. (2005). Simultaneous and successive colour discrimination in the honeybee (Apis mellifera). J. Comp. Physiol. A 191, 547–557. doi: 10.1007/s00359-005-0622-z
Dyer, A. G., Paulk, A. C., and Reser, D. H. (2011). Colour processing in complex environments: insights from the visual system of bees. Proc. R. Soc. B Biol. Sci. 278, 952–959. doi: 10.1098/rspb.2010.2412
Dyer, A. G., Spaethe, J., and Prack, S. (2008). Comparative psychophysics of bumblebee and honeybee colour discrimination and object detection. J. Comp. Physiol. A 194, 617–627. doi: 10.1007/s00359-008-0335-1
Endler, J. A., and Day, L. B. (2006). Ornament colour selection, visual contrast and the shape of colour preference functions in great bowerbirds, Chlamydera nuchalis. Anim. Behav. 72, 1405–1416. doi: 10.1016/j.anbehav.2006.05.005
Endler, J. A., and Mielke, P. W. (2005). Comparing entire colour patterns as birds see them. Biol. J. Linn. Soc. 86, 405–431. doi: 10.1111/j.1095-8312.2005.00540.x
Garcia, J. E., Phillips, R., Peter, C. I., and Dyer, A. G. (2020). Changing how biologists view flowers - color as a perception not a trait. Front. Plant Sci. 11:1775. doi: 10.3389/fpls.2020.601700
Garcia, J. E., Shrestha, M., and Dyer, A. G. (2018). Flower signal variability overwhelms receptor-noise and requires plastic color learning in bees. Behav. Ecol. 29, 1286–1297. doi: 10.1093/beheco/ary127
Garcia, J. E., Spaethe, J., and Dyer, A. G. (2017). The path to colour discrimination is S-shaped: behaviour determines the interpretation of colour models. J. Comp. Physiol. A 203, 983–997. doi: 10.1007/s00359-017-1208-2
Giurfa, M. (2004). Conditioning procedure and color discrimination in the honeybee Apis mellifera. Naturwissenschaften 91, 228–231. doi: 10.1007/s00114-004-0530-z
Goldsmith, T. H. (1991). “Chapter 5: The evolution of visual pigments and colour vision,” in The Perception of Color, ed P. Gouras (London: MaxMillan), 62–89.
Hanley, D., López, A. V., Fiorini, V. D., Reboreda, J. C., Grim, T., and Hauber, M. E. (2019). Variation in multicomponent recognition cues alters egg rejection decisions: a test of the optimal acceptance threshold hypothesis. Philos. Trans. R. Soc. B Biol. Sci. 374:1769. doi: 10.1098/rstb.2018.0195
Hannah, L., Dyer, A. G., Garcia, J. E., Dorin, A., and Burd, M. (2019). Psychophysics of the hoverfly: categorical or continuous color discrimination? Curr. Zool. 65, 483–492. doi: 10.1093/cz/zoz008
Hart, N. S., and Vorobyev, M. (2005). Modelling oil droplet absorption spectra and spectral sensitivities of bird cone photoreceptors. J. Comp. Physiol. 191, 381–392. doi: 10.1007/s00359-004-0595-3
Innis, G. J. (1989). Feeding ecology of fruit pigeons in subtropical rainforests of South-Eastern Queensland. Wildl. Res. 16, 365–394. doi: 10.1071/WR9890365
Iwaniuk, A. N., Keirnan, A. R., Janetzki, H., Mardon, K., Murphy, S., Leseberg, N. P., et al. (2020). The endocast of the Night Parrot (Pezoporus occidentalis) reveals insights into its sensory ecology and the evolution of nocturnality in birds. Sci. Rep. 10, 1–9. doi: 10.1038/s41598-020-70122-x
Judd, D. B., MacAdam, D. L., Wyszecki, G., Budde, H. W., Condit, H. R., Henderson, S. T., et al. (1964). Spectral distribution of typical daylight as a function of correlated color temperature. J. Opt. Soc. Am. 54:1031. doi: 10.1364/JOSA.54.001031
Kelber, A., Vorobyev, M., and Osorio, D. (2003). Animal colour vision - behavioural test and physiological concepts. Biol. Rev. 78, 81–118. doi: 10.1017/S1464793102005985
Kemp, D. J., Herberstein, M. E., Fleishman, L. J., Endler, J. A., Bennett, A. T. D., Dyer, A. G., et al. (2015). An integrative framework for the appraisal of coloration in nature. Am. Nat. 185, 705–724. doi: 10.1086/681021
Komatsu, H., and Ideura, Y. (1993). Relationships between color, shape, and pattern selectivities of neurons in the inferior temporal cortex of the monkey. J. Neurophysiol. 70, 677–694. doi: 10.1152/jn.1993.70.2.677
Kulikowski, J. J., Walsh, V., and Murray, I. J. (1991). “Chapter 5: On the limits of colour detection and discrimination,” in Limits of Vision, eds J. J. Kulikowski, V. Walsh, I. J. Murray, and J. Cronly-Dillon (London: MacMillan Press), 202–220.
Lin, T.-Y., Luo, J., Shinomiya, K., Ting, C.-Y., Lu, Z., Meinertzhagen, I. A., et al. (2016). Mapping chromatic pathways in the drosophila visual system. J. Comp. Neurol. 524, 213–227. doi: 10.1002/cne.23857
Lind, O., Chavez, J., and Kelber, A. (2014). The contribution of single and double cones to spectral sensitivity in budgerigars during changing light conditions. J. Comp. Physiol. A Neuroethol. Sens. Neural Behav. Physiol. 200, 197–207. doi: 10.1007/s00359-013-0878-7
Lind, O., and Kelber, A. (2009). Avian colour vision: effects of variation in receptor sensitivity and noise data on model predictions as compared to behavioural results. Vis. Res. 49, 1939–1947. doi: 10.1016/j.visres.2009.05.003
Lunau, K., Papiorek, S., Eltz, T., and Sazima, M. (2011). Avoidance of achromatic colours by bees provides a private niche for hummingbirds. J. Exp. Biol. 214, 1607–1612. doi: 10.1242/jeb.052688
MacAdam, D. L. (1942). Visual sensitivities to color differences in daylight. J. Opt. Soc. Am. 32:247. doi: 10.1364/JOSA.32.000247
MacMillan, N. A., and Creelman, C. D. (1990). Response bias: characteristics of detection theory, threshold theory, and 'nonparametric' indexes. Psychol. Bull. 107, 401–413. doi: 10.1037/0033-2909.107.3.401
MacMillan, N. A., and Creelman, C. D. (2005). Detection Theory, 2nd Edn. New York, NY: Psychology Press. doi: 10.4324/9781410611147
Marshall, J. (2018). Do not be distracted by pretty colors: a comment on Olsson et al. Behav. Ecol. 29, 286–287. doi: 10.1093/beheco/arx164
Mota, T., Gronenberg, W., Giurfa, M., and Sandoz, J.-C. (2013). Chromatic processing in the anterior optic tubercle of the honey bee brain. J. Neurosci. 33, 4–16. doi: 10.1523/JNEUROSCI.1412-12.2013
Murton, R. K., and Westwood, N. J. (1966). The foods of the Rock Dove and Feral Pigeon. Bird Study 13, 130–146. doi: 10.1080/00063656609476116
Niu, Y., Stevens, M., and Sun, H. (2020). Commercial harvesting has driven the evolution of camouflage in an alpine plant. Curr. Biol. 31, 446–449.e4. doi: 10.1016/j.cub.2020.10.078
Norwich, K. H. (1987). On the theory of weber fractions. Percept. Psychophys. 42, 286–298. doi: 10.3758/BF03203081
Olsson, P., Lind, O., and Kelber, A. (2015). Bird colour vision: behavioural thresholds reveal receptor noise. J. Exp. Biol. 218, 184–193. doi: 10.1242/jeb.111187
Olsson, P., Lind, O., and Kelber, A. (2018). Chromatic and achromatic vision: parameter choice and limitations for reliable model predictions. Behav. Ecol. 29, 273–282. doi: 10.1093/beheco/arx133
Orlowski, J., Harmening, W., and Wagner, H. (2012). Night vision in barn owls: visual acuity and contrast sensitivity under dark adaptation. J. Vis. 12, 1–8. doi: 10.1167/12.13.4
Osorio, D., Mikló, A., and Gonda, Z. (1999). Visual ecology and perception of coloration patterns by domestic chicks. Evol. Ecol. 13, 673–689. doi: 10.1023/A:1011059715610
Paulk, A. C., Dacks, A. M., and Gronenberg, W. (2009). Color processing in the medulla of the bumblebee (Apidae: Bombus impatiens). J. Comp. Neurol. 513, 441–456. doi: 10.1002/cne.21993
Pauw, A. (2019). A bird's-eye view of pollination: biotic interactions as drivers of adaptation and community change. Annu. Rev. Ecol. Evol. Syst. 50, 477–502. doi: 10.1146/annurev-ecolsys-110218-024845
Pike, T. (2012). Preserving perceptual distances in chromaticity diagrams. Behav. Ecol. 23, 723–728. doi: 10.1093/beheco/ars018
Pinheiro, J. C., and Bates, D. M. (2000). Mixed-Effects Models in S and S-PLUS. New York, NY: Springer New York. doi: 10.1007/978-1-4419-0318-1
Renoult, J., Kelber, A., and Schaefer, M. H. (2017). Colour spaces in ecology and evolutionary biology. Biol. Rev. 92, 292–315. doi: 10.1111/brv.12230
Santiago, C., Green, N. F., Hamilton, N., Endler, J. A., Osorio, D. C., Marshall, N. J., et al. (2020). Does conspicuousness scale linearly with colour distance? A test using reef fish. Proc. R. Soc. B Biol. Sci. 287:20201456. doi: 10.1098/rspb.2020.1456
Schaefer, H. M., McGraw, K., and Catoni, C. (2008). Birds use fruit colour as honest signal of dietary antioxidant rewards. Funct. Ecol. 22, 303–310. doi: 10.1111/j.1365-2435.2007.01363.x
Shrestha, M., Dyer, A. G., Garcia, J. E., and Burd, M. (2019). Floral colour structure in two Australian herbaceous communities: it depends on who is looking. Ann. Bot. 124, 221–232. doi: 10.1093/aob/mcz043
Siuda-Krzywicka, K., Boros, M., Bartolomeo, P., and Witzel, C. (2019). The biological bases of colour categorisation: from goldfish to the human brain. Cortex 118, 82–106. doi: 10.1016/j.cortex.2019.04.010
Skorupski, P., and Chittka, L. (2010). Differences in photoreceptor processing speed for chromatic and achromatic vision in the bumblebee, Bombus terrestris. J. Neurosci. 30, 3896–3903. doi: 10.1523/JNEUROSCI.5700-09.2010
Skorupski, P., and Chittka, L. (2011). Is colour cognitive? Opt. Laser Technol. 43, 251–260. doi: 10.1016/j.optlastec.2008.12.015
Skorupski, P., Döring, T. F., and Chittka, L. (2007). Photoreceptor spectral sensitivity in island and mainland populations of the bumblebee, Bombus terrestris. J. Comp. Physiol. A 193, 485–494. doi: 10.1007/s00359-006-0206-6
Solomon, S. G., and Lennie, P. (2007). The machinery of colour vision. Nat. Rev. Neurosci. 8, 276–286. doi: 10.1038/nrn2094
Spaethe, J., Streinzer, M., Eckert, J., May, S., and Dyer, A. G. (2014). Behavioural evidence of colour vision in free flying stingless bees. J. Comp. Physiol. A 200, 485–486. doi: 10.1007/s00359-014-0886-2
Stavenga, D., Smits, R., and Hoenders, B. (1993). Simple exponential functions describing the absorbance bands of visual pigment spectra. Vis. Res. 33, 1011–1017. doi: 10.1016/0042-6989(93)90237-Q
Troscianko, T., Benton, C. P., Lovell, P. G., Tolhurst, D. J., and Pizlo, Z. (2009). Camouflage and visual perception. Philos. Trans. R. Soc. London Ser. B- Biol. Sci. 364, 449–461. doi: 10.1098/rstb.2008.0218
van der Kooi, C. J., Dyer, A. G., Kevan, P. G., and Lunau, K. (2019). Functional significance of the optical properties of flowers for visual signalling. Ann. Bot. 123, 263–276. doi: 10.1093/aob/mcy119
von Helversen, O. (1972a). “Chapter 9: The relationship between difference in stimuli and choice frequency in training experiments with the honeybee,” in Inf. Process. Vis. Syst. Anthr, ed R. Wehner (Berlin; Heidelberg: Springer), 323–334. doi: 10.1007/978-3-642-65477-0_46
von Helversen, O. (1972b). Zur spektralen unterschiedsempfindlichkeit der honigbiene. J. Comp. Physiol. 80, 439–472. doi: 10.1007/BF00696438
Vorobyev, M., Brandt, R., Peitsch, D., Laughlin, S. B., and Menzel, R. (2001). Colour thresholds and receptor noise: behaviour and physiology compared. Vis. Res. 41, 639–653. doi: 10.1016/S0042-6989(00)00288-1
Vorobyev, M., and Osorio, D. (1998). Receptor noise as a determinant of colour thresholds. Proc. R. Soc. Lond. Ser. B Biol. Sci. 265, 351–358. doi: 10.1098/rspb.1998.0302
Warrant, E. J. (1999). Seeing better at night: life style, eye design and the optimum strategy of spatial and temporal summation. Vis. Res. 39, 1611–1630. doi: 10.1016/S0042-6989(98)00262-4
Whitney, K. D., Smith, A. K., Williams, C., and White, T. E. (2020). Birds perceive more intraspecific color variation in bird-pollinated than bee-pollinated flowers. Front. Plant Sci. 11:1806. doi: 10.3389/fpls.2020.590347
Wright, A. A. (1972). Psychometric and psychophysical hue discrimination functions for the pigeon. Vis. Res. 12, 1447–1464. doi: 10.1016/0042-6989(72)90171-X
Wright, A. A., and Cumming, W. W. (1971). Color-naming functions for the pigeon. J. Exp. Anal. Behav. 15, 7–17. doi: 10.1901/jeab.1971.15-7
Wyszecki, G., and Stiles, W. S. (1982). Color Science Concepts and Methods, Quantitative Data and Formulae, 2nd Edn. New York, NY: John Wiley & Sons, Inc.
Keywords: colour, sigmoid, pigeon, power function, violet-sensitive, flower-signal, vision, just-noticeable-difference
Citation: Garcia JE, Rohr DH and Dyer AG (2021) Colour Discrimination From Perceived Differences by Birds. Front. Ecol. Evol. 9:639513. doi: 10.3389/fevo.2021.639513
Received: 09 December 2020; Accepted: 03 May 2021;
Published: 01 June 2021.
Edited by:
Sara Diana Leonhardt, Technical University of Munich, GermanyReviewed by:
Daniel Osorio, University of Sussex, United KingdomThomas Pike, University of Lincoln, United Kingdom
Copyright © 2021 Garcia, Rohr and Dyer. This is an open-access article distributed under the terms of the Creative Commons Attribution License (CC BY). The use, distribution or reproduction in other forums is permitted, provided the original author(s) and the copyright owner(s) are credited and that the original publication in this journal is cited, in accordance with accepted academic practice. No use, distribution or reproduction is permitted which does not comply with these terms.
*Correspondence: Jair E. Garcia, jair.garcia@rmit.edu.au