
Multi-Objective Dispatching Optimization of an Island Microgrid Integrated with Desalination Units and Electric Vehicles

1
School of Power and Mechanical Engineering, Wuhan University, Wuhan 430072, China
2
Intelligent Power Equipment Technology Research Center, Wuhan University, Wuhan 430072, China
3
School of Electrical and Electronic Engineering, Hubei University of Technology, Wuhan 430068, China
*
Author to whom correspondence should be addressed.
Processes 2021, 9(5), 798; https://doi.org/10.3390/pr9050798
Submission received: 13 April 2021
/
Revised: 28 April 2021
/
Accepted: 29 April 2021
/
Published: 1 May 2021
(This article belongs to the Section Energy Systems)
Abstract
:The renewable energy microgrid is an effective solution for island energy supply with the advantages of low energy cost, environmental protection, and reliability. In this paper, an island renewable energy microgrid integrated with desalination units and electric vehicles is established to meet the self-satisfaction of the island’s sustainable electricity, fresh water, and transportation. The source side components of the system include photovoltaic cells, wind turbines, diesel generators, battery energy storage systems. A multi-objective dispatching optimization method based on the flexibility of electric vehicles and desalination units is proposed comprehensively considering the economy and renewable energy penetration indexes. The optimization objectives are minimizing the comprehensive operating cost, and the net load fluctuation. An improved multi-objective grey wolf optimizer is adopted to solve the dispatching problem. The system is modeled and simulated by MATLAB software. The feasibility of the proposed dispatching optimization method is verified by case studies and operation simulation. Four different cases are compared and analyzed to study the impact of EVs and DES on dispatching optimization.
1. Introduction
More than fifty thousand islands are present on the Earth, with a total area of over one-sixth of the global land area and hosting more than 740 million people. For most islands, it is difficult to achieve a fully sustainable supply of electricity and fresh water. The shortage of electricity and fresh water are the two most serious problems that hinder the development of remote island areas [1]. Numerous islands have long offshore distance and low load level. Limited by the huge cost and difficulty of access to the main power grid, the island’s power supply, desalination, and transportation are heavily dependent on fossil energy. This energy mode has problems such as high energy cost, fuel supply vulnerable to extreme weather conditions, and serious pollutant emissions. For the special scenario of isolated islands, extensive research and experimental projects have been carried out in the field of renewable energy microgrids in recent years in order to reduce energy pressure and promote eco-friendly development [2]. With the rapid development of energy storage and marine power generation technology, as well as the irresistible commercial use of electric vehicles, the establishment of island energy systems ushers in a new prospect [3].
The renewable energy microgrid integrated with desalination units (DES) and electric vehicles (EVs) is a solution with the advantages of low energy cost, environmental protection, and reliability, which can meet the self-satisfaction of island’s sustainable electricity, fresh water, and transportation. Smart grid promotes the rapid development and application of demand response technology, load side dispatching technology and vehicle-to-grid (V2G) technology [4]. As demand side response resources, the controllability of desalination units and the “energy storage-load” dual characteristic of electric vehicles provide advantages for their flexible integration into the microgrid. Extensive research focuses on the dispatching optimization of microgrids integrated with desalination units or electric vehicles and explores their ability to improve the economy, reliability, and sustainability of microgrids.
The integration of different renewable energy generation technologies and desalination technologies has been widely studied and applied all over the world. Among the possible combinations, solar and wind energy have been widely developed, and are considered to be more promising in terms of economic and technical feasibility [5]. Literature [6] took India as an example to describe the great potential of the collaborative operation of renewable energy and seawater desalination units. Literature [7] proposed a coordinated operation method of microgrid system including reverse osmosis desalination unit, photovoltaic, wind turbine and battery energy storage. Demand side load control was incorporated into the optimization process to determine the optimal flexible operation. Literature [8] proposed a 100% renewable energy system based on the integration of wind turbine, concentrating solar power plant and seawater desalination unit to realize the minimum total operation cost. Literature [9] studied the optimal combination scheme of hybrid microgrid and desalination unit to meet the daily water demand and discussed its technical and economic advantages.
The application of V2G can help to increase the performance of a microgrid in terms of system efficiency, reliability, stability, and dispatch [10]. EVs can serve as a load or act as a distributed storage device in the microgrid. Literature [11] proposed a coordinated control strategy for photovoltaic integrated electric vehicle charging, which can effectively reduce the fluctuation of photovoltaic output power and the charging cost of electric vehicles. In literature [12], a dynamic load dispatch strategy with the integration of large-scale plug-in electric vehicles is proposed, which can bring considerable economic and environmental benefits to power system operators. Literature [13] simulated the random operation of a renewable energy microgrid with 30 plug-in electric vehicles and evaluated the impact of electric vehicle charging on the operating cost. Literature [14] studied the reliable operation of an island microgrid by controlling the EVs charging and discharging and verified that the electric vehicles can provide the ability of load adjustment as a distributed energy storage device. In literature [15], a multi-objective optimal load dispatching model of hybrid energy microgrid with random access of electric vehicles is proposed, which can effectively reduce the daily cost and improve the stability of system operation.
The existing research on dispatching optimization of renewable energy microgrid integrated with desalination units or electric vehicles has made certain achievements but still shows some limitations. Some research has been carried out on grid-connected microgrids, which is not suitable for the actual isolated island context, because there will be no shortage of energy. Most of the studies focus on a single type of load with a relatively simple dispatching strategy. Few studies simultaneously combine the actual electricity, water and transportation demands of the island, taking desalination units and electric vehicles into the optimization objects for comprehensive dispatching. Most of the studies are single objective optimization problems with a single economic index, such as the cost of electric vehicles or the cost of fresh water production. Some studies have set up multiple optimization objectives, but used a weight coefficient to transform multi-objective optimization into single objective optimization. The weight coefficient directly affects the optimization results, and cannot take all the objectives into account in a real sense. Dispatching optimization is an extremely complex problem, which needs to consider a variety of factors in order to get the appropriate optimal solution. In this paper, a dispatching optimization method of island microgrid integrated desalination units and electric vehicles as flexible loads are proposed. A multi-objective dispatching optimization model with economy and renewable energy penetration as the core indexes is established, in which the economy objective is the optimal comprehensive operation cost and the renewable energy penetration objective is the optimal net load fluctuation. An improved multi-objective grey wolf optimizer (IMOGWO) is used to solve the problem. The feasibility of the proposed dispatching optimization method is verified by case studies and operation simulation. Four different cases are compared and analyzed to study the impact of EVs and DES on dispatching optimization.
The rest of this paper is organized as follows. Section 2 describes the mathematical models of the components in the energy system. The dispatching optimization strategy, description of objective functions and constraints, modeling of optimization problems, and solution method are presented in Section 3. In Section 4, case studies are presented, the simulation results are discussed to illustrate the performance of the proposed method, and the comparative analysis of four cases is carried out. The conclusion is presented in Section 5.
2. Models of the Hybrid System Components
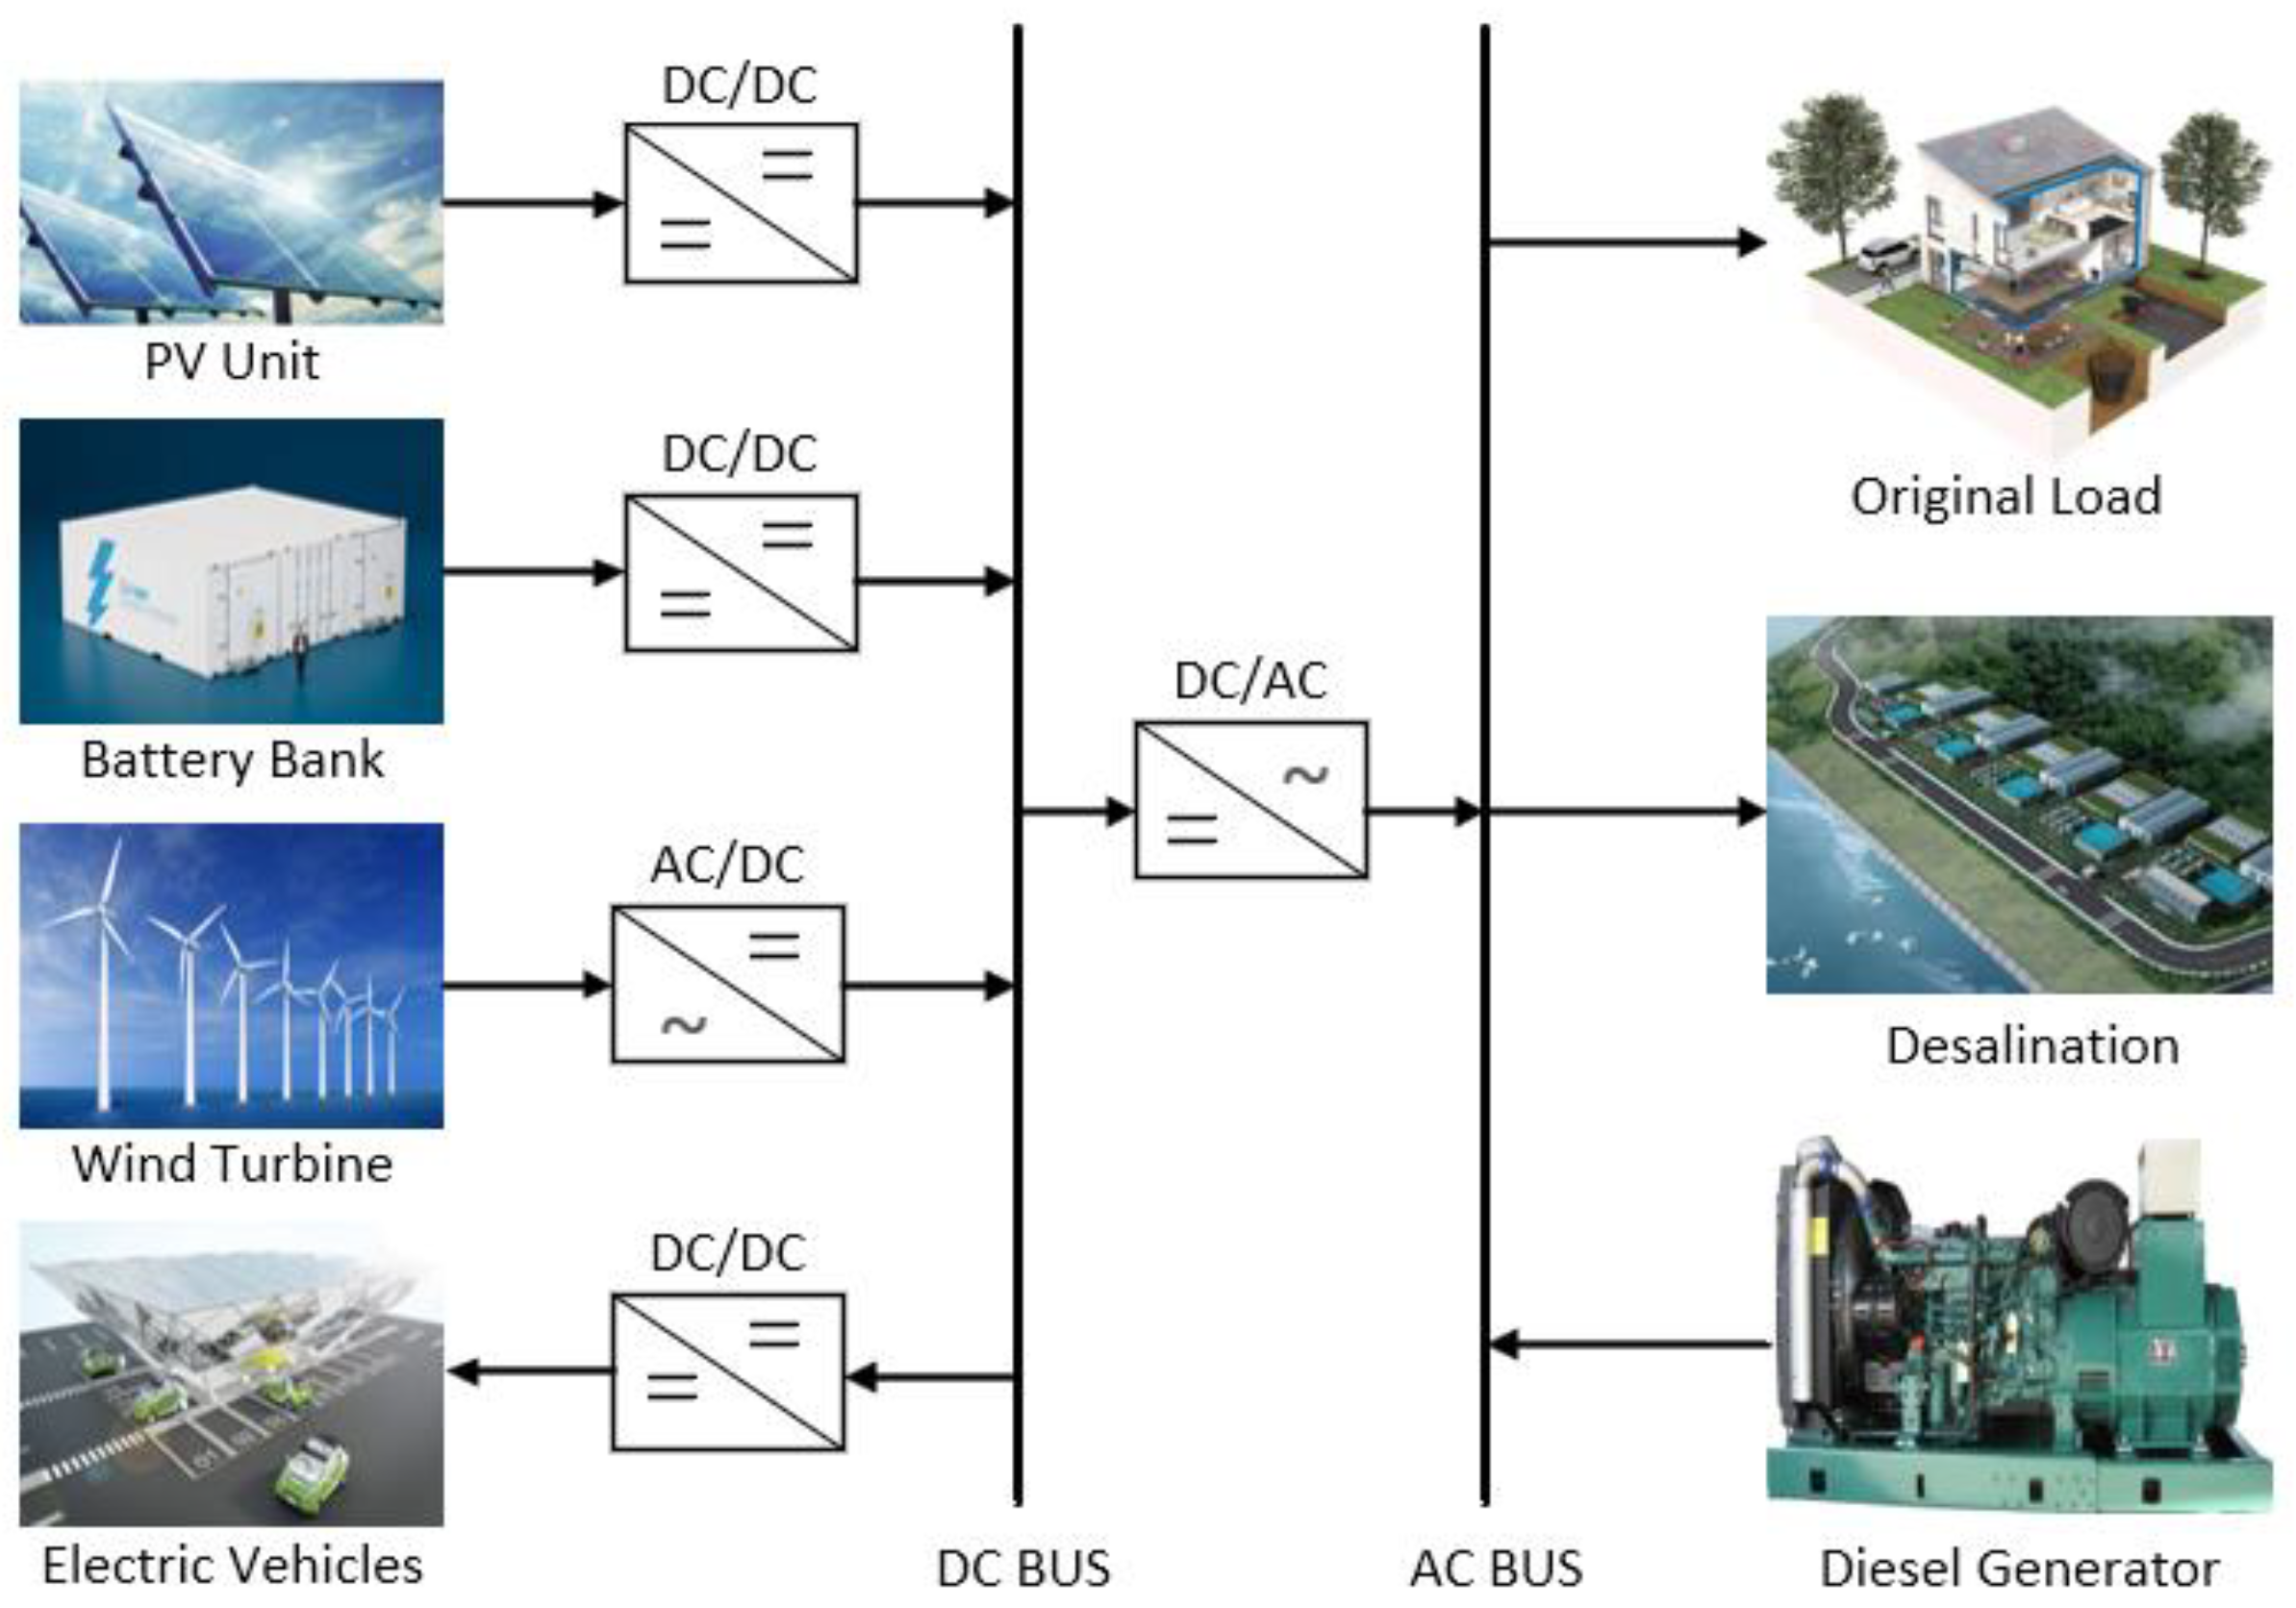
The hybrid microgrid studied in this paper is shown in Figure 1. The source side components of the system include photovoltaic cells (PV), wind turbines (WT), diesel generators (DG), battery energy storage system (BSS), inverters, controllers, and other independent devices. Load side components include original load, desalination units, and electric vehicles. The purpose of microgrid dispatching is to economically provide electricity, fresh water, transportation for island residents, and maximize the local consumption of renewable energy. The detailed modeling of the major system components is presented hereafter.
2.1. Photovoltaic Unit Model
The output of photovoltaic panels depends on the solar irradiation energy received by the module plane, which depends on the local climate conditions, installation method, module type, etc. [16]. The output of PV can be estimated by rated power, actual irradiance, and ambient temperature as below [17]:
where is the output power of the PV module, is the rated power of the PV module at standard test condition, is the real solar irradiance at the tilted surface of PV panels (), is the standard solar irradiance (), is the standard temperature (), is the temperature coefficient, defined by is the ambient temperature .
2.2. Wind Turbine Model
The output model of a wind turbine is a piecewise function, which is determined by different wind speed intervals. When the cut-in speed is reached, the wind turbine starts to rotate and generate electricity. The output of wind turbine is the product of wind density, blade swept area, and efficiency coefficient. When the rated speed is reached, the wind turbine outputs the rated power. When the cut-out speed is reached, the turbine will be terminated for self-protection [18]. The model of power output generated by the wind turbine is given by the following equation:
where is the wind speed, , and are the cut-in wind speed, rated wind speed, and cut-out wind speed, is the rated electrical power, is the wind speed coefficient. When the wind speed is between and , can be approximately denoted as a linear function of wind speed as shown in the following equation.
2.3. Battery Storage Model
Battery storage system is a very important part of a hybrid energy system, which can smooth the fluctuation of distributed generation, improve the schedulability and reliability of the system [19]. BSS is the most flexible, reliable, and responsive system among various storage technologies because of its high cycle efficiency, low cost, and long cycle life. State of charge (SOC) is usually used to indicate the remaining capacity of the battery, which is a crucial variable in the optimization of microgrid operation [20]. The at time is given by:
where is the self-discharge rate, and and are the charging and discharging efficiencies, respectively. is the power output of BSS, is the capacity of BSS.
If , the BSS is charged. If , the BSS is discharged. In the dispatching process, BSS will cause operation and maintenance cost and cycle loss cost , which are calculated by the following equations [21]:
where is the operation cost coefficient of the BSS, is the replacement cost of the BSS, is the charge and discharge times in an operation cycle, is the charge and discharge times in the lifespan. and are the maximum and minimum values of SOC.
2.4. Diesel Generator Model
A diesel generator is used as the backup power supply to make up for the power shortage of the system. Diesel generator should be operated at a suitable power level, otherwise, its economy and lifespan will be influenced. DG is modeled based on the fuel consumption and efficiency which can be simplified as the following equation [22]:
where is the DG’s fuel consumption, is DG’s actual output power, is DG’s rated output power, and are and , respectively. DG’s comprehensive operating cost includes fuel cost , operation and maintenance cost , pollution control cost and start-up cost , which are expressed as follows:
where is fuel cost per liter, is the operation cost coefficient, is the cost for dealing with type pollutants, is the emissions of type pollutants generated by the operation of DG, is the cost of DG’s start-up, and is the times of start-up.
2.5. Electric Vehicle Model
An electric vehicle has two properties of load and power source. The dispatching optimization of electric vehicles can improve the penetration of renewable energy in isolated microgrids, and change the load curve. EVs dispatching has a great contribution to stabilizing load demand and improving microgrid stability [23].
2.5.1. Modeling of Random Charging for EVs
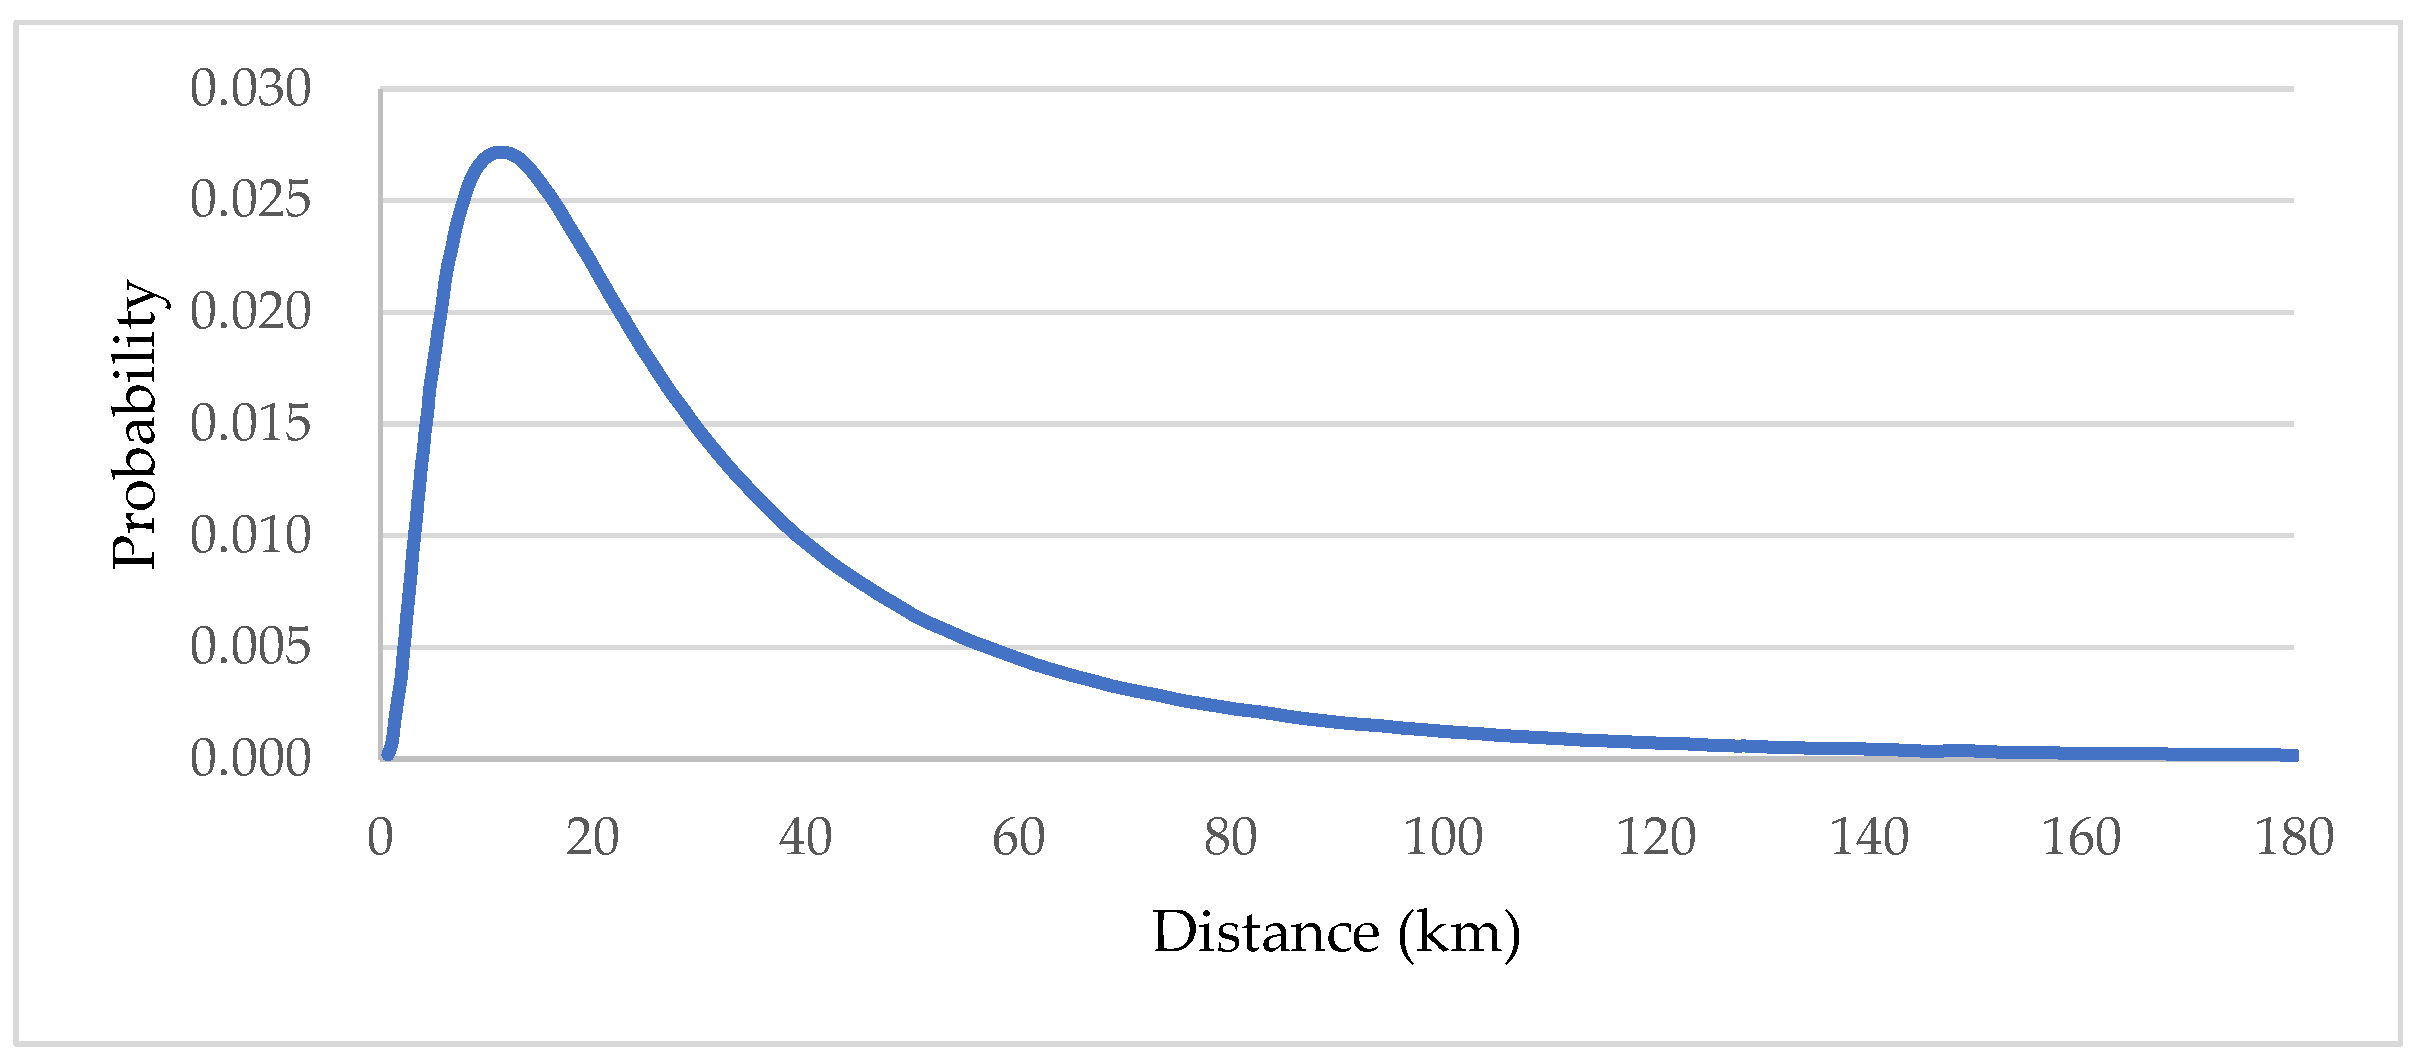
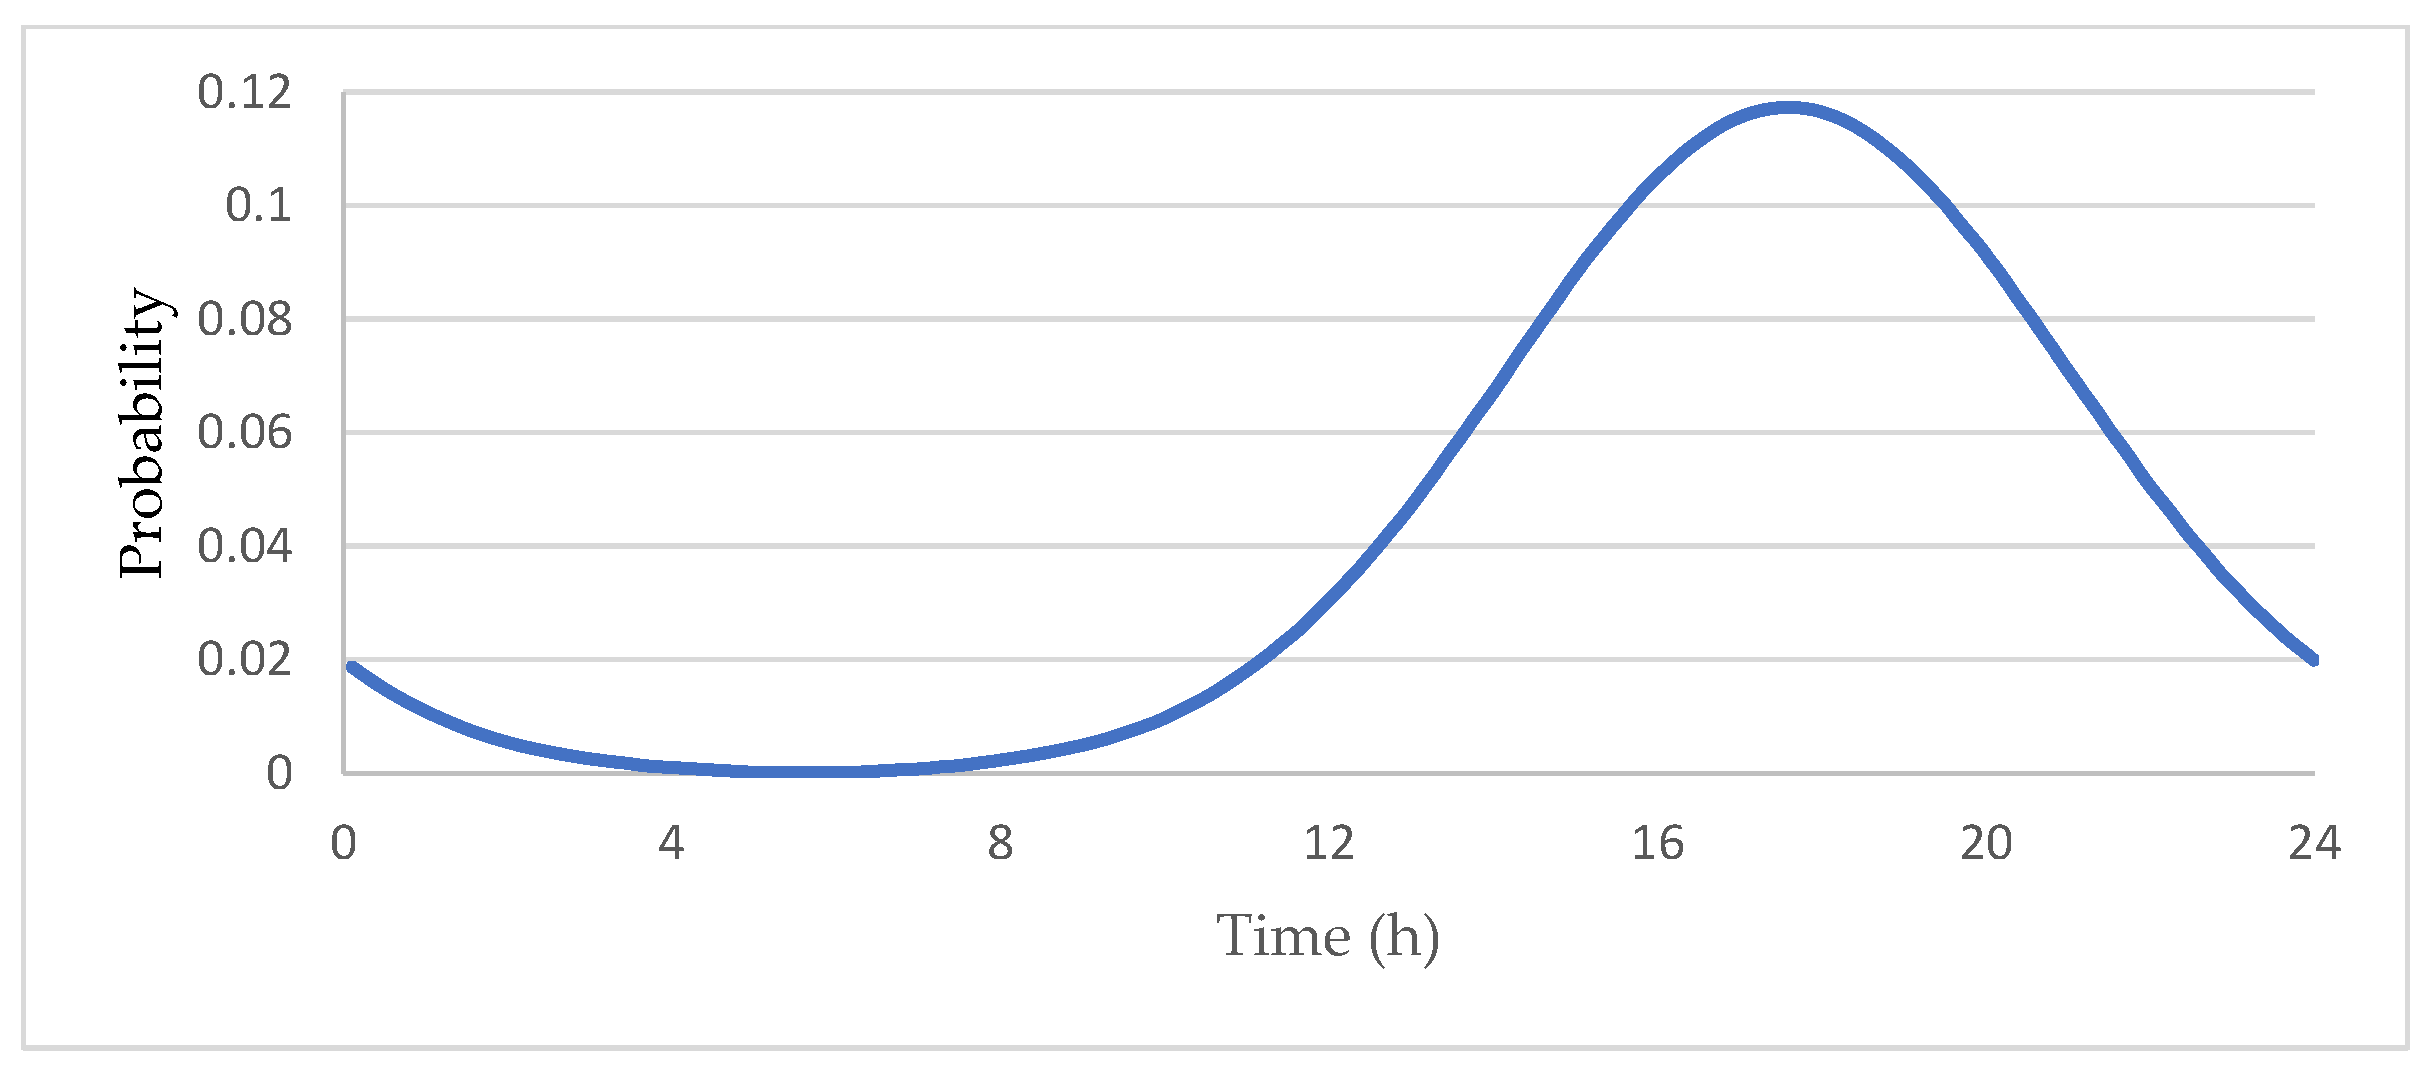
In this paper, it is assumed that the travel behavior of EVs is similar to that of traditional fuel vehicles. The randomly charging behavior of EVs follows the owners’ travel rule. An EV will be charged immediately once arrives at the destination or a day’s journey ends. It depends on whether there is a charging station at the destination and the owner’s option. According to the survey statistics of vehicle owners’ travel data [24], the daily travel distance of EVs approximately obeys the lognormal distribution, and the return time of EVs approximately obeys the normal distribution, as shown below.
where is the EV’s daily travel distance, is the expectation of the EV’s daily travel distance, is the standard deviation of the EV’s daily travel distance. Figure 2 shows the probability distribution of the daily travel distance of the EVs.
where is the EV’s return time, is the expectation of the EV’s return time, is the standard deviation of the EV’s return time. Figure 3 shows the probability distribution of the return time of the EVs.
The daily travel distance and charging start time of EVs are independent of each other. Based on the proposed probability distribution, Monte Carlo simulation method is used to calculate the random charging load of EVs [25]. The charging start time and travel distance of each EV are generated randomly, and the total charging load distribution of all EVs is obtained by superposition of each EV. The simulation results of 100 EVs and 200 EVs are shown in Figure 4.
2.5.2. Modeling of Dispatching Optimization for EVs
The basic principle of EVs dispatching is to use EVs’ flexibility to stabilize the load curve of microgrid by peak shaving and valley filling. The start time of EVs charging or discharging is determined by the comparison between EVs return time and the start time of morning peak, evening peak of original load. The start time of EVs discharging should not be earlier than the start time of evening peak, and the start time of EVs charging should not be later than the starting time of morning peak. The discharge capacity of EV should not exceed the maximum discharge depth . The discharge duration and charge duration of EV , the superimposed charge and discharge load of EVs are calculated as follows:
where is EV’s SOC at the return time, is EV’s minimum SOC, is the rated capacity of EV’s battery, is EV’s travel distance, is EV’s energy consumption per kilometer, and are EV’s hourly discharge power and charge power, and are the charging and discharging states coefficients of EV at time , respectively. When belongs to the charging duration, , otherwise, . When belongs to the discharging duration, , otherwise, .
It should be pointed out that charging and discharging will cause battery aging of EVs. The dispatching participation of EVs will only be considered when the incentives received as reserve providers are greater than the battery aging costs [26]. In order to minimize battery aging of EVs and simplify the calculation, this paper assumes that the EV’s charging or discharging is a continuous process, each EV can charge and discharge at most once a day, and the subsidy provided to the owner is invariable.
2.6. Desalination Model
Reverse osmosis (RO) has become the most widely used seawater desalination technology because of its maturity, cost, expansion, and other advantages [27]. The desalination unit needs to consume plenty of electricity to provide the pressure required by RO process and maintain the operation of each subsystem. Different from the general translatable load, DES is a controllable load with a “power-efficiency” characteristic. The operating power , water production quantity , and efficiency of DES approximately follow the equations below [28]:
where ,, are the fitted production factors, is the initial power of DES, is the rated power of DES.
Usually, desalination units produce fresh water according to the hourly water demand of the island. The reservoir can provide flexibility for the water production process and guarantee the short-term water demand of residents in case of emergency. The dynamic balance of the reservoir’s storage is expressed by the following equations [29]:
where is the storage of the reservoir, is the water produced by DES and is the release from the reservoir, is the water demand of the island.
The operation cost of DES can be simply described as the sum of the operation and maintenance cost and electricity cost , which is expressed as follows.
where is the operation cost coefficient, is the electricity price under time-of-use (TOU) mode.
For the residents on isolated islands, fresh water is the most basic guarantee for life and health. The importance of fresh water is higher than that of electricity, and the priority of electricity for water production is higher than that of ordinary load. It is agreed in this paper that microgrid power supply should give priority to meet the minimum water demand, which means that water shortage is not allowed on the island, while the general power shortage may occur.
3. Dispatching Optimization Model and Solution
This paper aims to establish a multi-objective dispatching optimization model of island renewable energy system integrated with electric vehicles and desalination units. The purpose is to use renewable energy to provide green and sustainable electricity, fresh water, and transportation for an isolated island, and to improve the economy, stability, and renewable energy penetration of the system. In this paper, two optimization objectives are proposed: minimum comprehensive operation cost (COC) and minimum net load fluctuation (NLF). An improved multi-objective grey wolf optimization algorithm is used to solve the proposed problem, and the fuzzy membership function is used to select the optimal solution.
3.1. Dispatching Optimization Objectives
3.1.1. Comprehensive Operation Cost
The comprehensive operation cost includes the operation cost of BSS, the operation cost of DG, the operation cost of desalination units, the subsidy cost of electric vehicles, the punishment cost of renewable energy dumping, the punishment cost of power loss. can comprehensively reflect the economic dispatching status of the system, in which the system reliability and pollutant emissions (mainly from DG) are considered as punishment items.
where is the EV’s discharging unified subsidy price, and are the unit punishment cost for the dump power of renewable energy and the power loss, respectively.
3.1.2. Net Load Fluctuation
The optimal net load fluctuation of microgrids should be pursued in order to maximize the penetration of renewable energy, avoid the increase of operation cost and pollutant emissions caused by the excessive use of BSS and DG [30]. Define as the original load of the microgrid at time , as the net load of the microgrid at time . is determined by the total output of renewable energy and the total load of the microgrid. The net load fluctuation of the microgrid is expressed as follows:
3.2. Objective Function and Constraints
Based on the above discussions, the objective function of renewable energy microgrids dispatching optimization based on minimum and minimum is as follows:
The variables to be optimized in the dispatching optimization process include:
- The charging and discharging power of the BSS .
- The output power of DGs .
- The operation power of DES .
- The charging start time of EVs .
- The discharging start time of EVs .
The constraints of dispatching optimization include:
- SOC and output power constraints of BSS:where and are the maximum and minimum SOC of the BSS respectively. and are the maximum hourly charge and discharge power of the BSS respectively.
- Output power and climbing power constraints of DG:where and are the maximum and minimum power output of a DG unit respectively, and are the maximum and minimum climbing power of a DG unit respectively.
- Output power constraints of DES:where and are the maximum and minimum power output of a DES.
- SOC and charge, discharge power constraints of EV:where and are the maximum and minimum SOC of an EV respectively. and are the maximum hourly charge and discharge power of an EV respectively.
- System power balance constraints:
3.3. Dispatching Optimization Strategy
For isolated island microgrids, the inevitable intermittence of renewable energy leads to the mismatch between generation and load. Load side dispatching optimization can avoid the peak-to-peak superposition between different load types or the waste of renewable energy through peak load shaving and valley filling. In the dispatching optimization strategy proposed in this paper, EVs and DES units directly participate in the load side dispatching, to ensure the economy, sustainability, and reliability of island power supply, fresh water supply, and transportation.
3.3.1. Dispatching Strategy of EVs
EVs discharge orderly in the peak load duration to supplement power generation, and charge orderly in valley load duration to absorb renewable energy generation. In this way, the load curve can be adjusted to a smooth state. The maximum discharge capacity of an EV must ensure that the residual power is sufficient for the owner’s daily travel, while not exceeding the EV’s maximum discharge depth (DOD). Assuming that the EV’s return time is , the morning peak starting time is , and the evening peak starting time is , the dispatching strategy of EV is as follows:
- When , the start-charging time .
- When , the start-discharging time .
- When , the start-discharging time .
3.3.2. Dispatching Strategy of DES
When the wind and solar resources are abundant, DES operation load should be as much as possible to absorb the redundant renewable energy. When the wind and solar resources are scarce, DES operation load should be as little as possible to provide a buffer for batteries and diesel generators [31]. The difference between the total output power of renewable energy and the total load except DES is defined as . The upper power limit and the lower power limit of DES can be calculated according to hourly water storage and water demand. Then the dispatching optimization strategy of DES is as follows:
- When , the basic water demand of residents must be guaranteed first, .
- When , the power of DES should be taken as a variable to participate in optimization, .
- When , the DES should operate at rated power to absorb renewable energy, .
3.3.3. Dispatching Strategy of BSS and DG
Dispatching strategy of BSS and DG is the basic guarantee for economical operation. BSS can store the surplus energy when the power supply is excessive, and timely supplement the power shortage when the power supply is insufficient. DG, as a standby power supply, ensures the operation of important loads in case of power shortage. The dispatching optimization strategy of BSS and DG proposed in this paper is as follows:
- Renewable energy power generation is enough to match the load demand.
- If the BSS is not fully charged at this time, the excess power generation will charge the BSS.
- If the BSS is fully charged at this time, the renewable energy output will be reduced to match the load. Record the dump energy.
- Renewable energy power generation is not enough to match the load demand.
- If the BSS is available at this time, the BSS will discharge to match the load demand.
- If the BSS is not available at this time, DG will be operated to supplement generation.
- If the DG is not enough to supplement generation, the unsatisfiable load will be cut off. Record the failure time and the power shortage.
3.4. Improved Multi-Objective Grey Wolf Optimizer
Mutually exclusive optimization objectives, multiple variables and constraints exist in the studied system. An improved multi-objective grey wolf optimizer (IMOGWO) is used to solve the dispatching optimization problem of the system. Multi-objective grey wolf optimizer (MOGWO) is a powerful meta-heuristic algorithm [32,33], which has competitiveness in terms of solution accuracy, minimum computational effort, and aversion of premature convergence. The global optimization is realized by imitating the predatory behaviors of grey wolves such as searching, tracking, encircling, chasing, and attacking to obtain the Pareto optimal front (non-dominated solutions set). Literature [34] proposed an improved multi-objective grey wolf optimizer by adjusting the convergence factor and the updating strategy of the wolf swarm position. Compared with standard MOGWO and multi-objective particle swarm optimization (MOPSO), IMOGWO shows better convergence, coverage, and global optimization ability in multiple standard test problems. The mathematical model of predatory behaviors is expressed as follows:
where is number of iterations, and are the coefficient vectors, is the position vector of the prey, is the position vector of the wolf, is the total number of iterations allowed for the optimization, and are the random vector in , is the dominance coefficient of differential mechanism, generally valued around 1, is the perturbation coefficient of differential mechanism, which is inversely adjusted according to the difference between individuals. The detailed optimization process is as follows:
- Input the load, irradiance, wind speed, water demand, and other basic data of the studied case. Input the economic and technical parameters of the system components.
- Determine the system optimization objectives and constraints. Determine the system variables and boundaries.
- Initialize the algorithm, set the external archive, configure the algorithm parameters and the maximum number of iterations.
- Calculate the non-dominated solution of the contemporary population, and update the external archive.
- Calculate the convergence factor according to Equation (44), and select three leaders from the external archive by roulette method.
- Calculate four candidate solutions of the current individual wolf using Equations (40)–(43) and Equations (45)–(48).
- Select all the non-dominated solutions. Select the optimal update position of the current individual wolf by elite strategy.
- Add the non-dominated solutions to the archive according to the archiving rules, and remove the dominated solutions. Remove the excess solutions when the population of external archive is full.
- Use to judge whether the algorithm should be terminated. The algorithm ends and all the non-dominated solutions are output if is reached. Conversely, return to Step 5.
The solution set of multi-objective optimization problems can be represented by Pareto optimal front, which is a set containing the corresponding objective values of Pareto optimal solutions. The optimal equilibrium solution is the solution with the minimum value after normalizing all the non-dominated solutions, which is calculated by the following equation [35]:
where is the normalized value of solution , is the function value of objective of solution , denotes the minimum function value of objective , denotes the maximum function value of objective .
4. Simulation Results and Discussion
4.1. Case Studies
The proposed dispatching optimization method has been applied to a hybrid renewable energy system of an island in the East China Sea. The microgrid contains PV units, WTs, BSS, and DGs, and integrates EVs and a desalination plant as flexible loads to participate in dispatch progress. The sizes of PV, WTs, BSS, and DGs are 800 kW, 840 kW, 900 kW, and 600 kW, respectively. The microgrid contains 100 controllable EVs with the same capacity of 24 kWh. The average original load of the island microgrid is about , and the peak load is about . The daily water demand of residents on the island is about 500 tons. The desalination plant is composed of three DES units with rated operating power of 100 kW and daily water production of 400 tons. The capacity of the reservoir is 200 tons and the minimum water storage requirement is 50 tons. The major operation and technical parameters of BSS, DG, EV, and DES are listed in Table 1 [28,34,36,37]. Various types of pollutants produced in DG’s operation and the pollutant control cost are listed in Table 2 [38].
A day-ahead dispatch with an interval of one hour is adopted for the dispatching optimization. The grid price adopts the time-of-use (TOU) method which is shown in Figure 5. It is necessary to point out that the PV units and WTs are assumed as clean energy and will not incur additional costs or pollutions in operation once they have been installed. The uncertainty of renewable energy and load on the day-ahead dispatching optimization are considered in this study by using Monte Carlo simulation and relevant historical data [39].
4.2. Optimization Results
The dispatching optimization of island renewable energy system based on IMOGWO has been implemented by the MATLAB (R2018b, MathWorks, Natick, MA, USA) simulation platform on an 8-core Lenovo computer (T490, Lenovo, Beijing, China) with 16 GB memory and 3.4 GHz CPU clock speed, running Windows 10 enterprise operating system (64-bit). The parameters of IMOGWO are shown in Table 3.
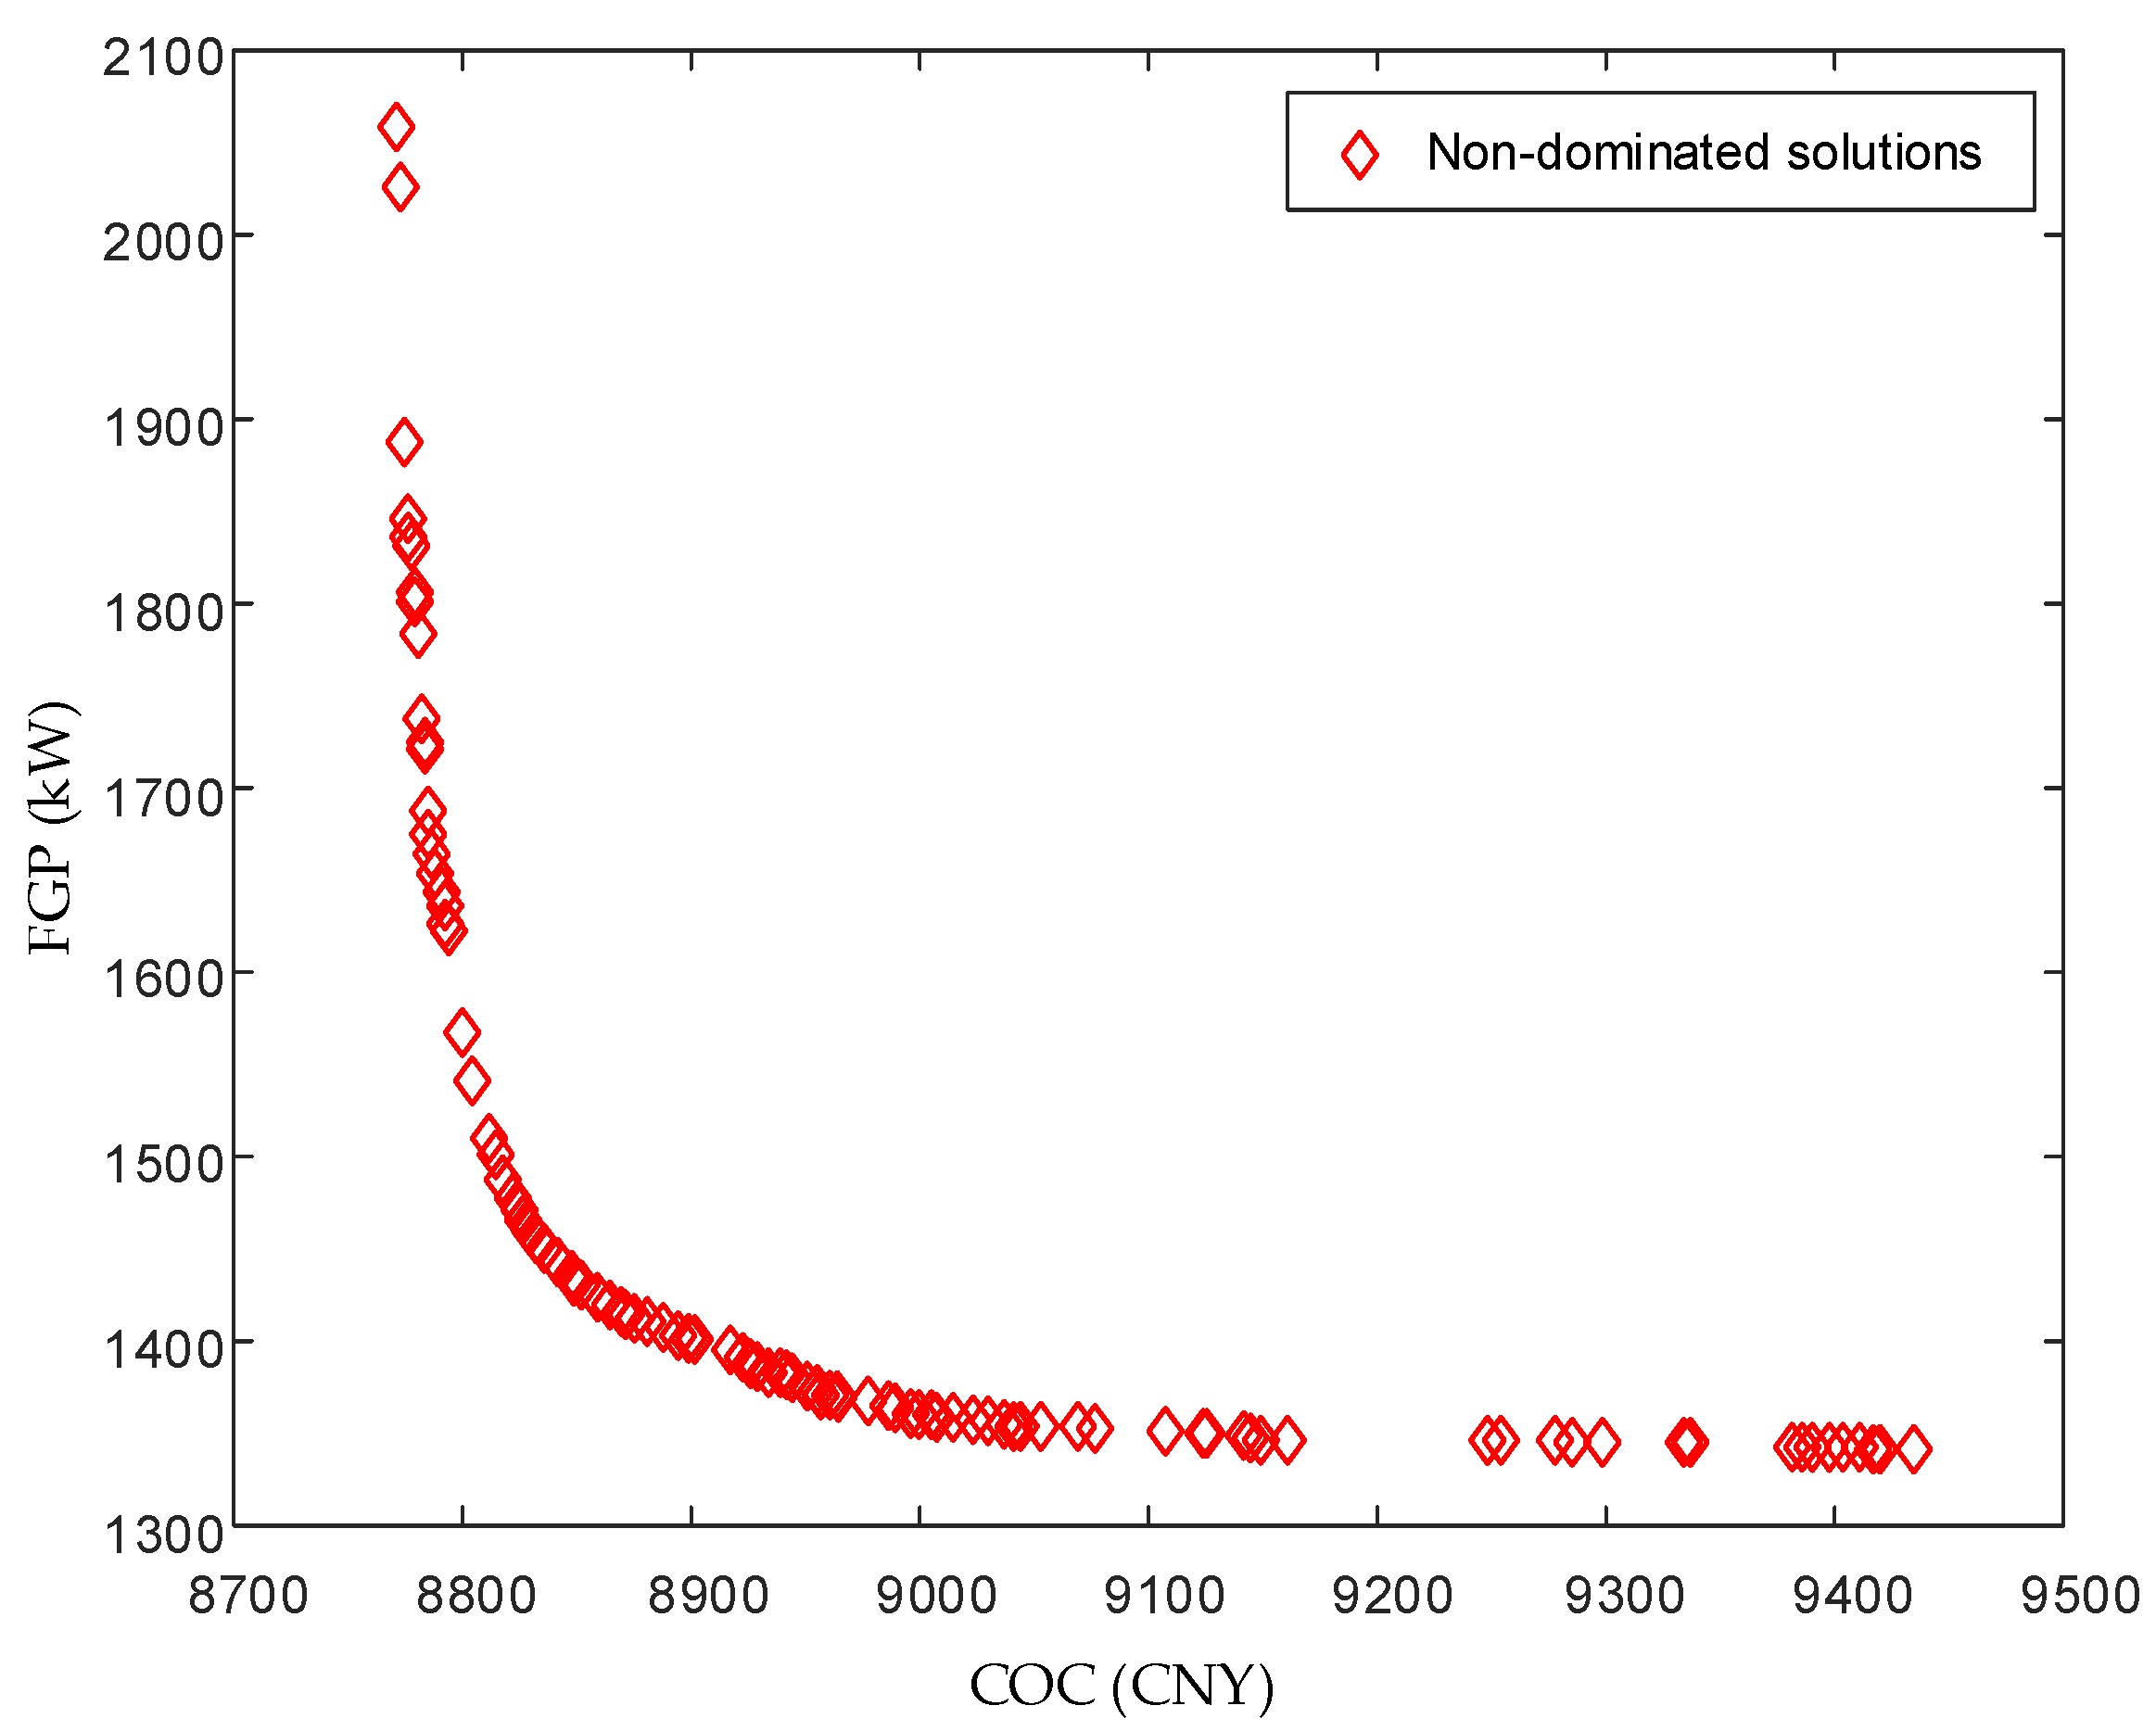
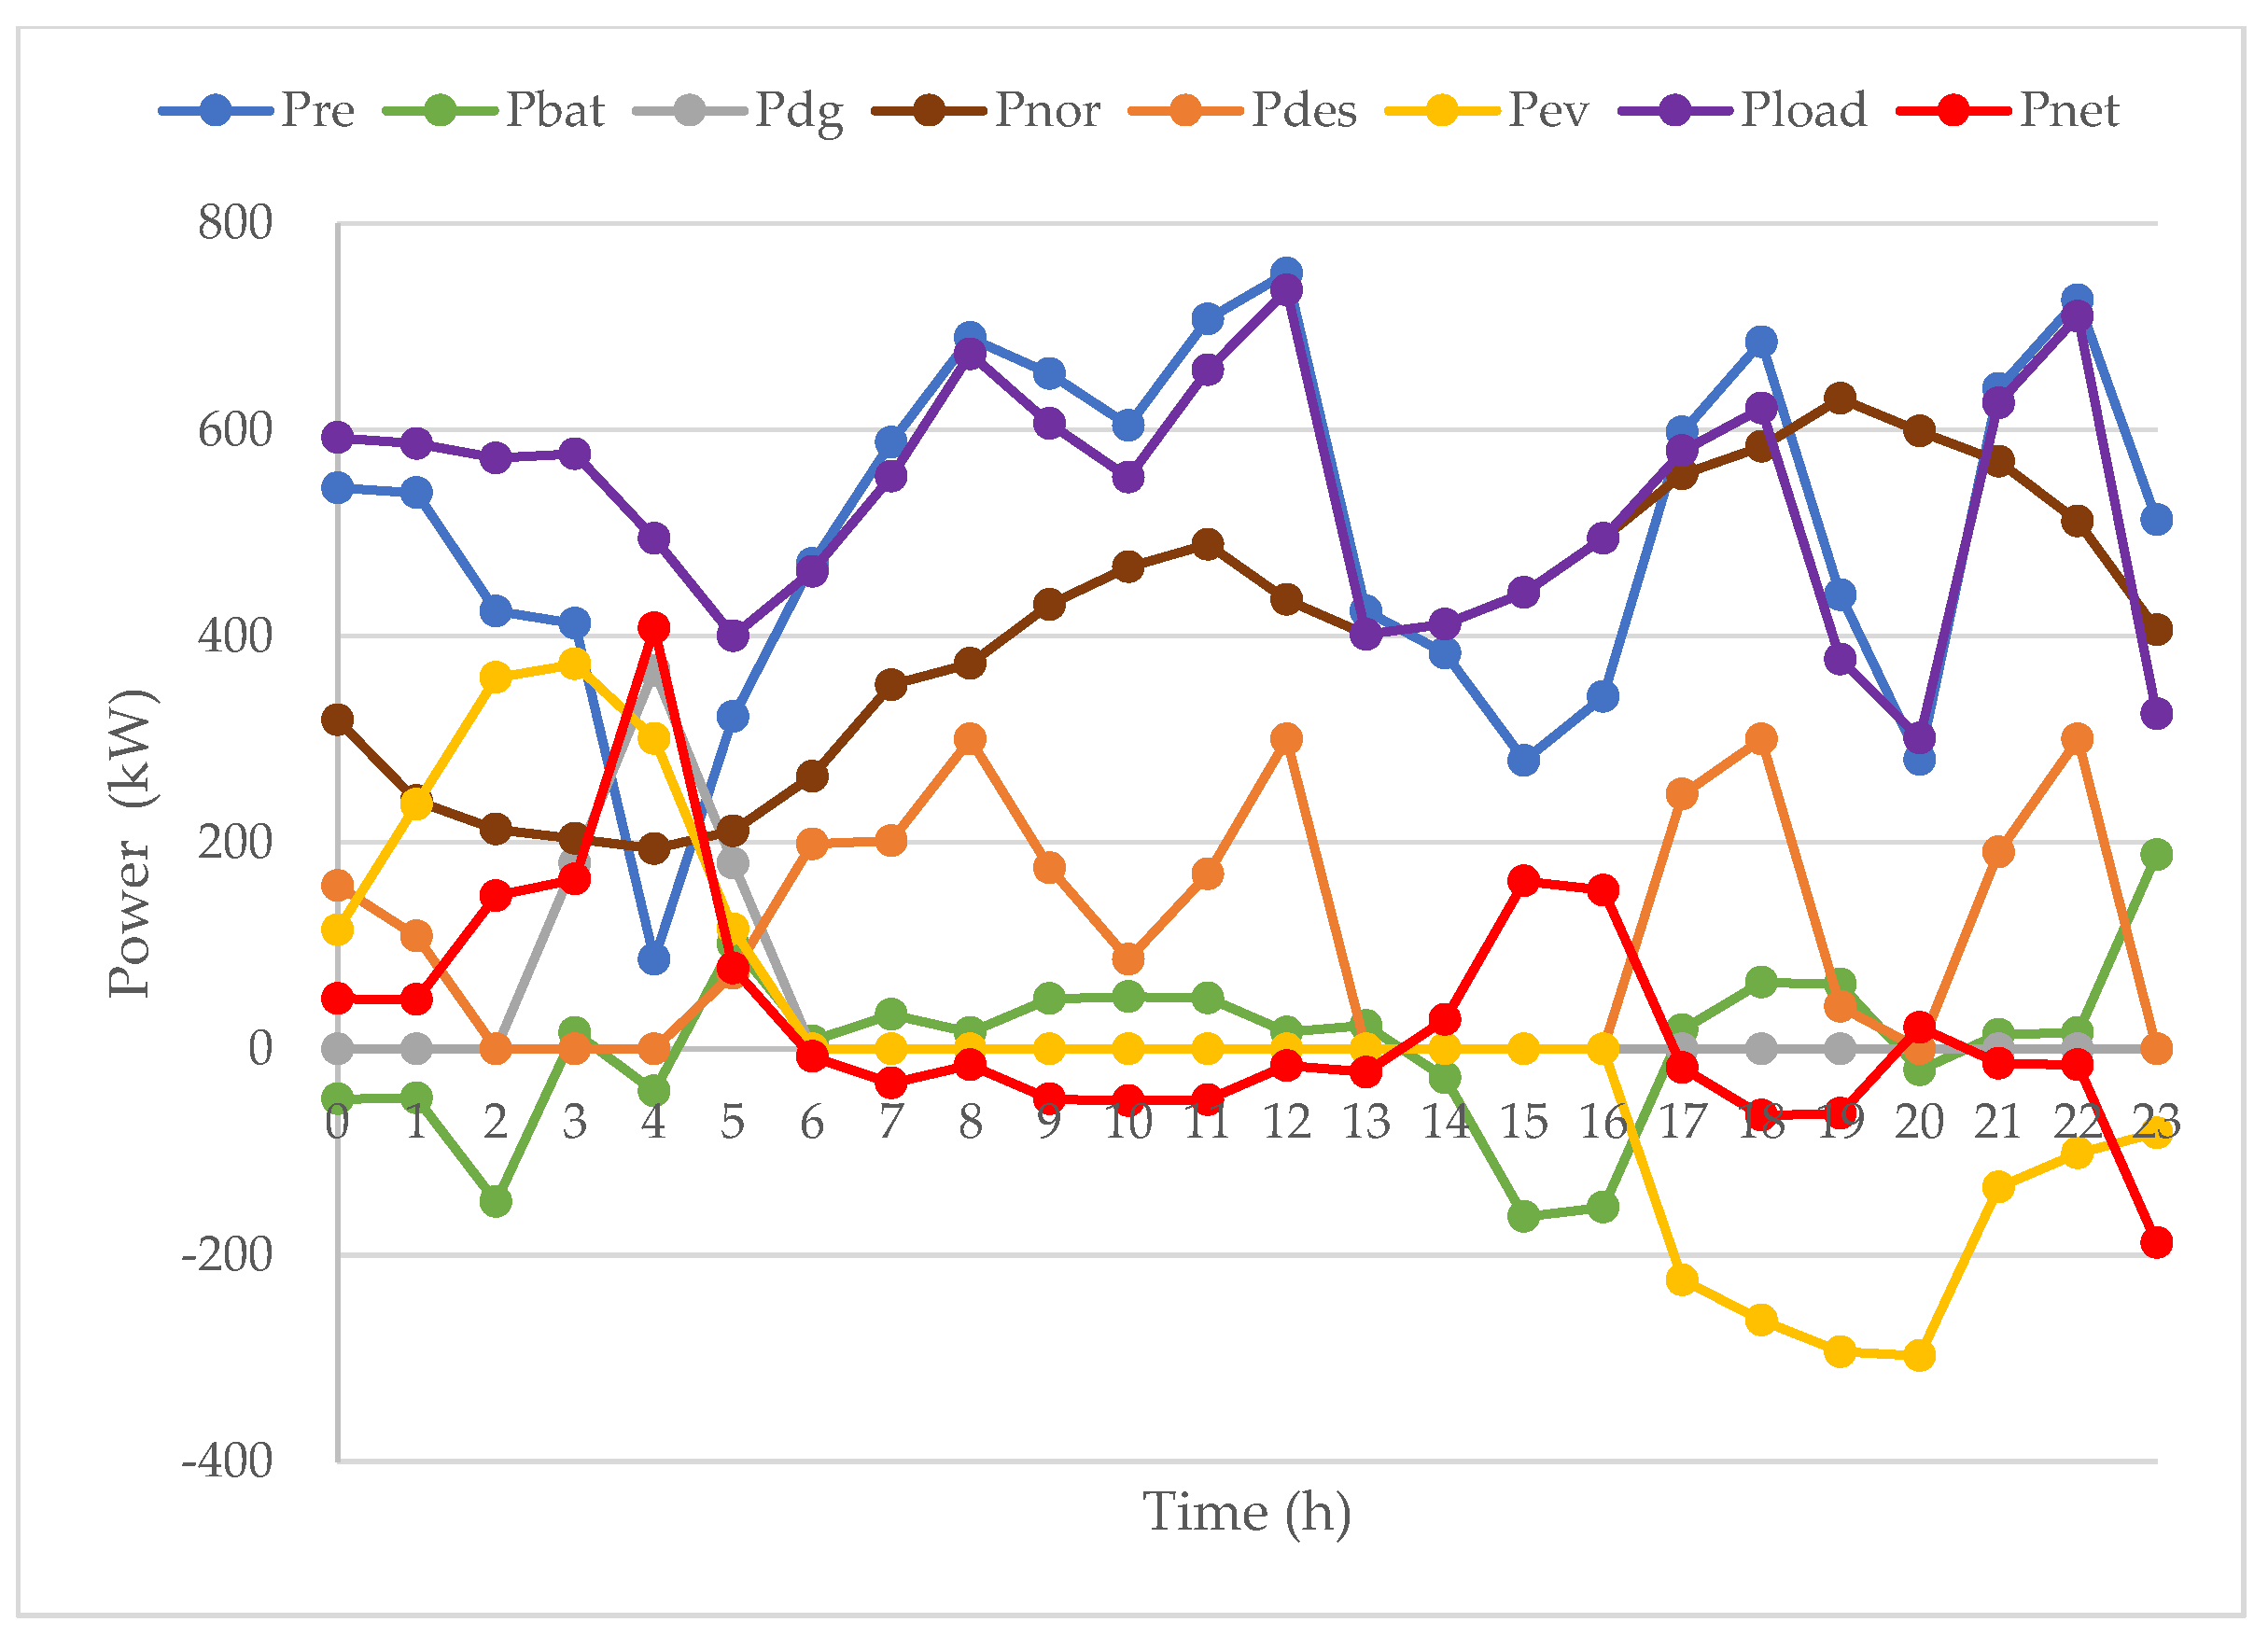
Figure 6 shows the Pareto Front of the dispatching optimization, the relationship between and is mutually exclusive. decreases with the increase of . The compromised optimal solution of the studied case is obtained by the fuzzy membership function. The comprehensive operating cost and the net load fluctuation are and . Figure 7 shows the 24-h operation of microgrid components simulated by the optimal dispatching solution. The negative value of indicates that the renewable energy output meets the total load demand and the positive value of indicates that the renewable energy output does not meet the total load demand. The negative value of indicates that EV is in the state of discharge as energy storage; the positive value of indicates that EV is in the state of charge as load. The negative value of indicates that the BSS is in the state of discharge, and the positive value of indicates that the BSS is in the state of charge.
From the operation results of 24-h simulation, it can be seen that the optimized total load curve closely follows the curve of renewable energy output , and the shape is smooth. The peak of the original load has been shaved while the valley has been filled. The new peak and valley of total load after dispatching are completely guided by renewable energy generation, which verifies the contribution of dispatching optimization to load curve adjustment and maximum absorption of renewable energy in the island microgrid system. is the difference between the total load and the power generated by renewable energy. Its shape is very smooth and the fluctuation is small, which is attributed to the participation of EVs and DES in dispatching optimization.
During the valley duration (1:00–6:00 in the morning), EVs orderly participate in charging dispatch to avoid the conflict with original load, and end charging before the morning peak. After 6:00, all EVs leave the microgrid, travel and return independently according to the owners’ inherent driving needs. During this period, all EVs do not charge or discharge. During the peak duration (16:00–22:00 in the evening), EVs orderly participate in discharging dispatch to supplement the shortage of renewable energy. The participation of EVs in load side dispatching optimization has a direct effect on the load adjustment of the microgrid. DES cooperates with EVs to participate in dispatching optimization. DES operates at high power level in the period of sufficient power supply (e.g., 6:00–13:00) to match renewable energy generation to the greatest extent, and quits operation in the period of insufficient power supply (e.g., 13:00–16:00) to reduce system total load.
The dispatching optimization strategy includes the energy management of BSS and DG. The renewable energy generation in the system is firstly consumed by load, then the excess or deficiency part (i.e., ) is responded by BSS and DG. When is negative, BSS charges to avoid the dumping of renewable energy. When is positive, BSS discharges preferentially to fill the shortage. As backup power supply, DG only operates when the BSS discharge capacity is insufficient to make up for the shortage, thus reducing the operation cost and pollutant emissions.
To sum up, for the relatively fragile island isolated microgrid with intermittent renewable energy generation, EVs and DES, as demand side response resources, can effectively reduce the comprehensive operation cost, improve the penetration of renewable energy, and reduce pollutant emissions through the participation in load side dispatching.
4.3. Comparative Analysis of Different Cases
In order to further study the influence of dispatching optimization of EVs and DES on system operation, the following four different dispatch cases are proposed. In case 1, both EVs and DES participate in dispatching optimization. In case 2, EVs are randomly charged and DES participates in dispatching optimization. In case 3, EVs participate in dispatching optimization, while DES does not. In case 4, EVs and DES all do not participate in dispatching optimization. The compromised optimal solutions of four cases obtained by IMOGWO and the fuzzy membership function are listed in Table 4.
The results show that Case 1 obtains the optimal and in four cases. Case 2 and Case 3 are superior in and of each other. The dispatching result of Case 4 is the worst. In detail, compared with Case 1, Case 2’s and exceeded by 49.2% and 50.8%, Case 3’s and exceeded by 19.7% and 135.0%, Case 4’s and exceeded by 71.6% and 114.9%, respectively. It can be concluded that the joint participation of EVs and DES makes the optimal dispatching benefit. The dispatching of EVs contributes more to , while the dispatching of DES contributes more to . The following will be a detailed comparative analysis of all cases.
4.3.1. Load Curves Analysis
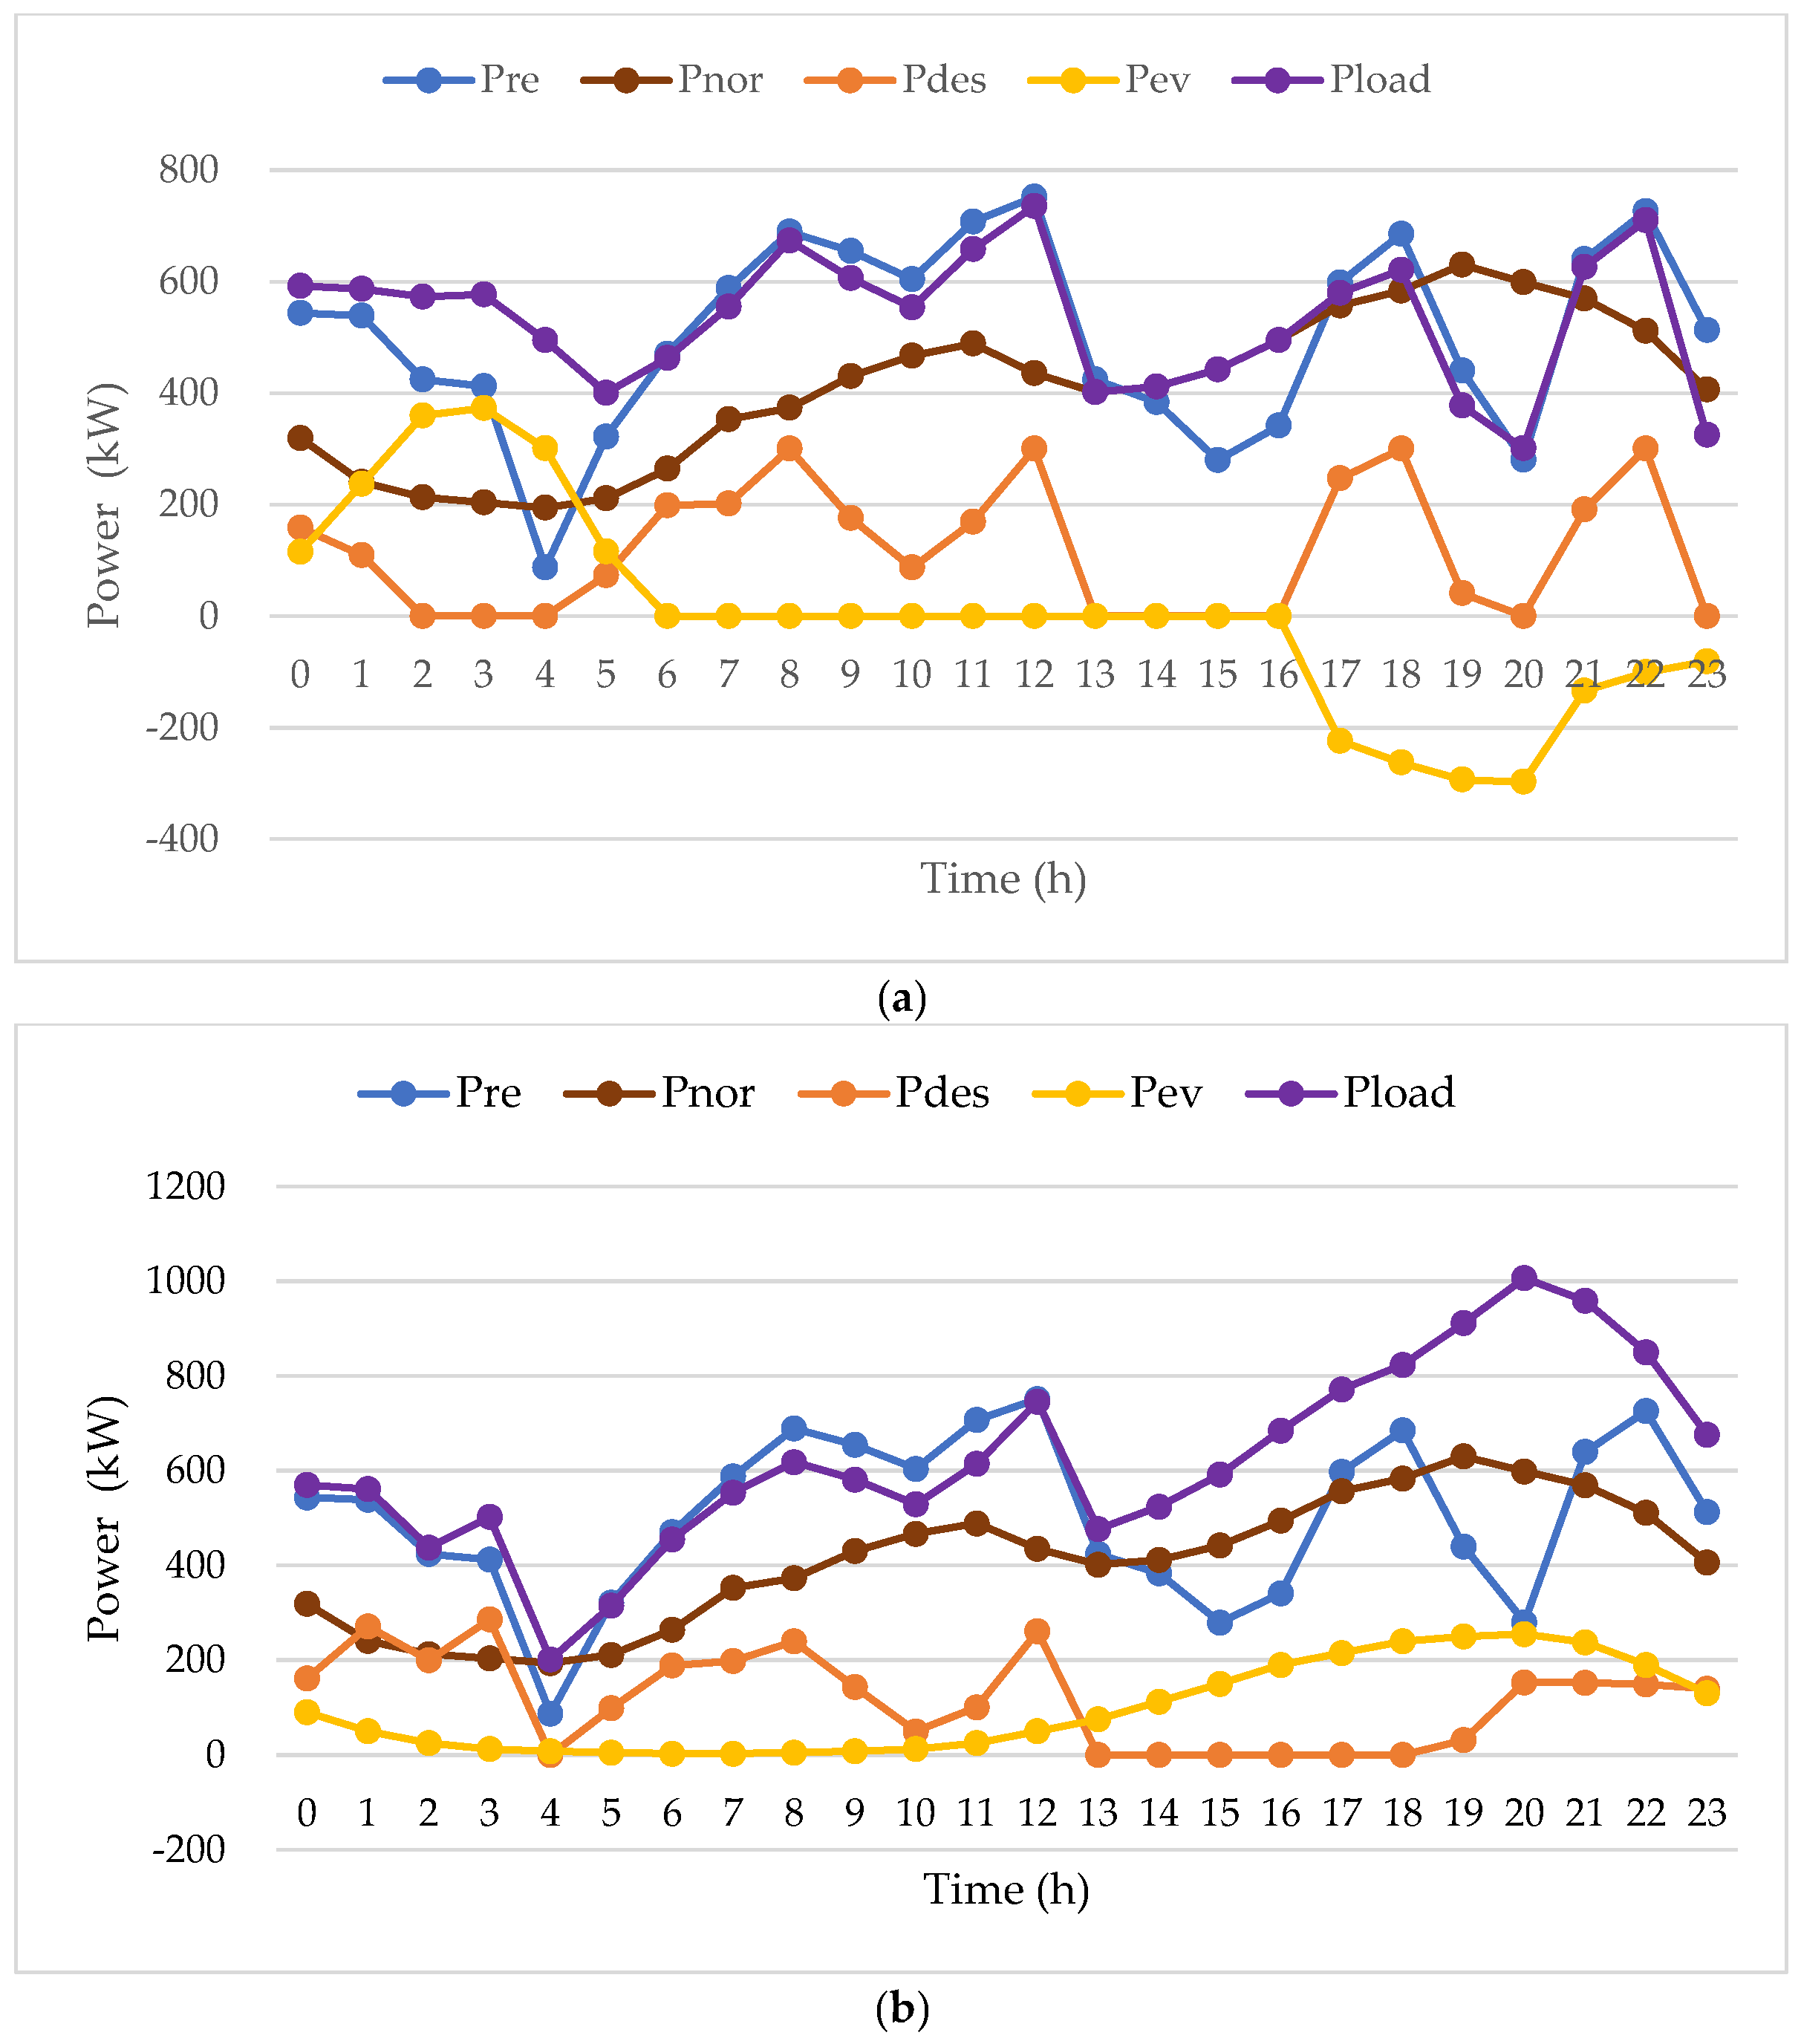
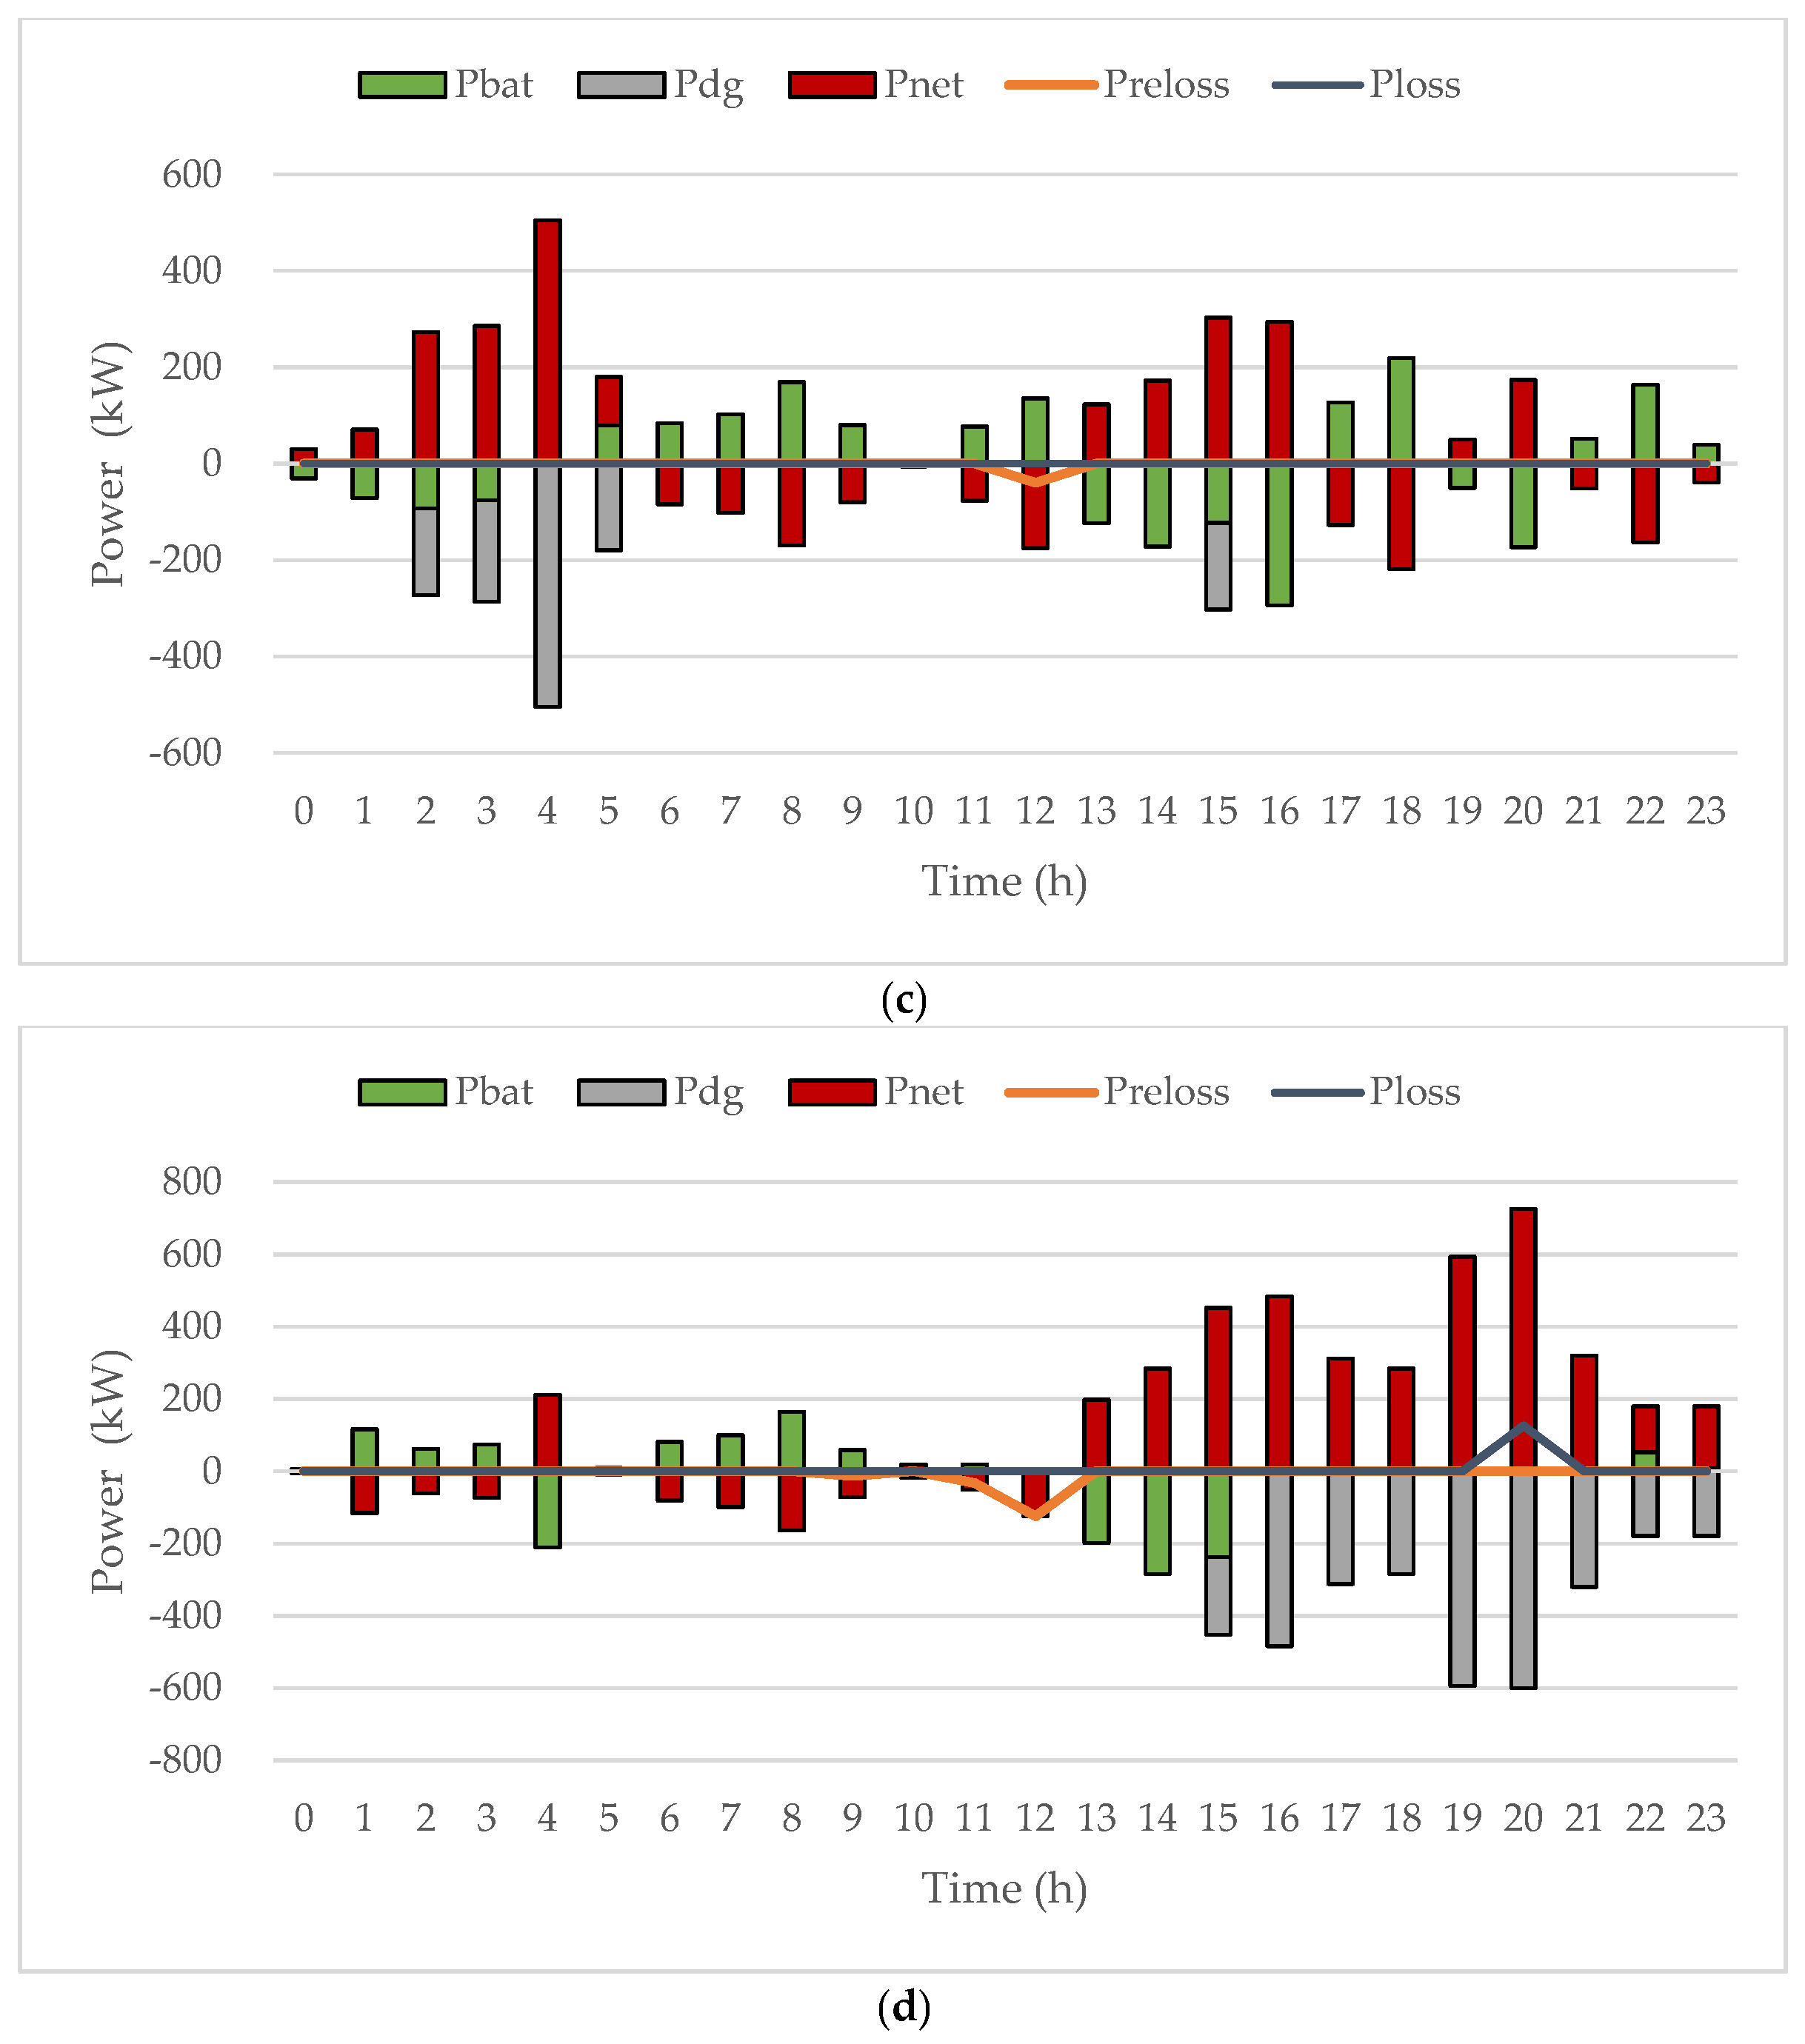
Figure 8a–d illustrates the various load curves corresponding to the 24-h operation of four cases in the microgrid, respectively. Compared with Case 1, the peak-to-peak curve is formed in Case 2 by the superposition of the randomly charging load and the conventional load, resulting in a significant increase of peak load. DES flexibly adjusts the operating power following the curve of renewable energy output, and greatly absorbs renewable energy power generation. In Case 3, EVs participate in dispatching optimization through orderly charging and discharging, and effectively adjust the load of the microgrid, which can be seen from the smoothness of the total load curve. DES is in the normal operation mode, and its power changes not much with time, which is related to water demand and has little contribution to the improvement of system load curve. Compared with the first three cases, the randomly charging of EVs and conventional operation of DES in Case 4 lead to the underutilization of renewable resources and excessive power shortage, resulting in the maximum comprehensive operation cost.
The emphasis of EVs and DES in dispatching optimization is different, which is directly related to the control strategy. EVs contribute more to peak shaving and valley filling, which has a greater impact on the comprehensive operating cost. DES contributes more to renewable energy consumption and has a greater impact on net load fluctuation. The comprehensive operation cost and renewable energy penetration of Case 2 and Case 3 are not as good as Case 1, which proves that only EVs and DES jointly participate in dispatching optimization can the optimal operation be carried out and the comprehensive benefits can be maximized. The feasibility and superiority of Case 1 are verified by comparing with cases 2, 3 and 4.
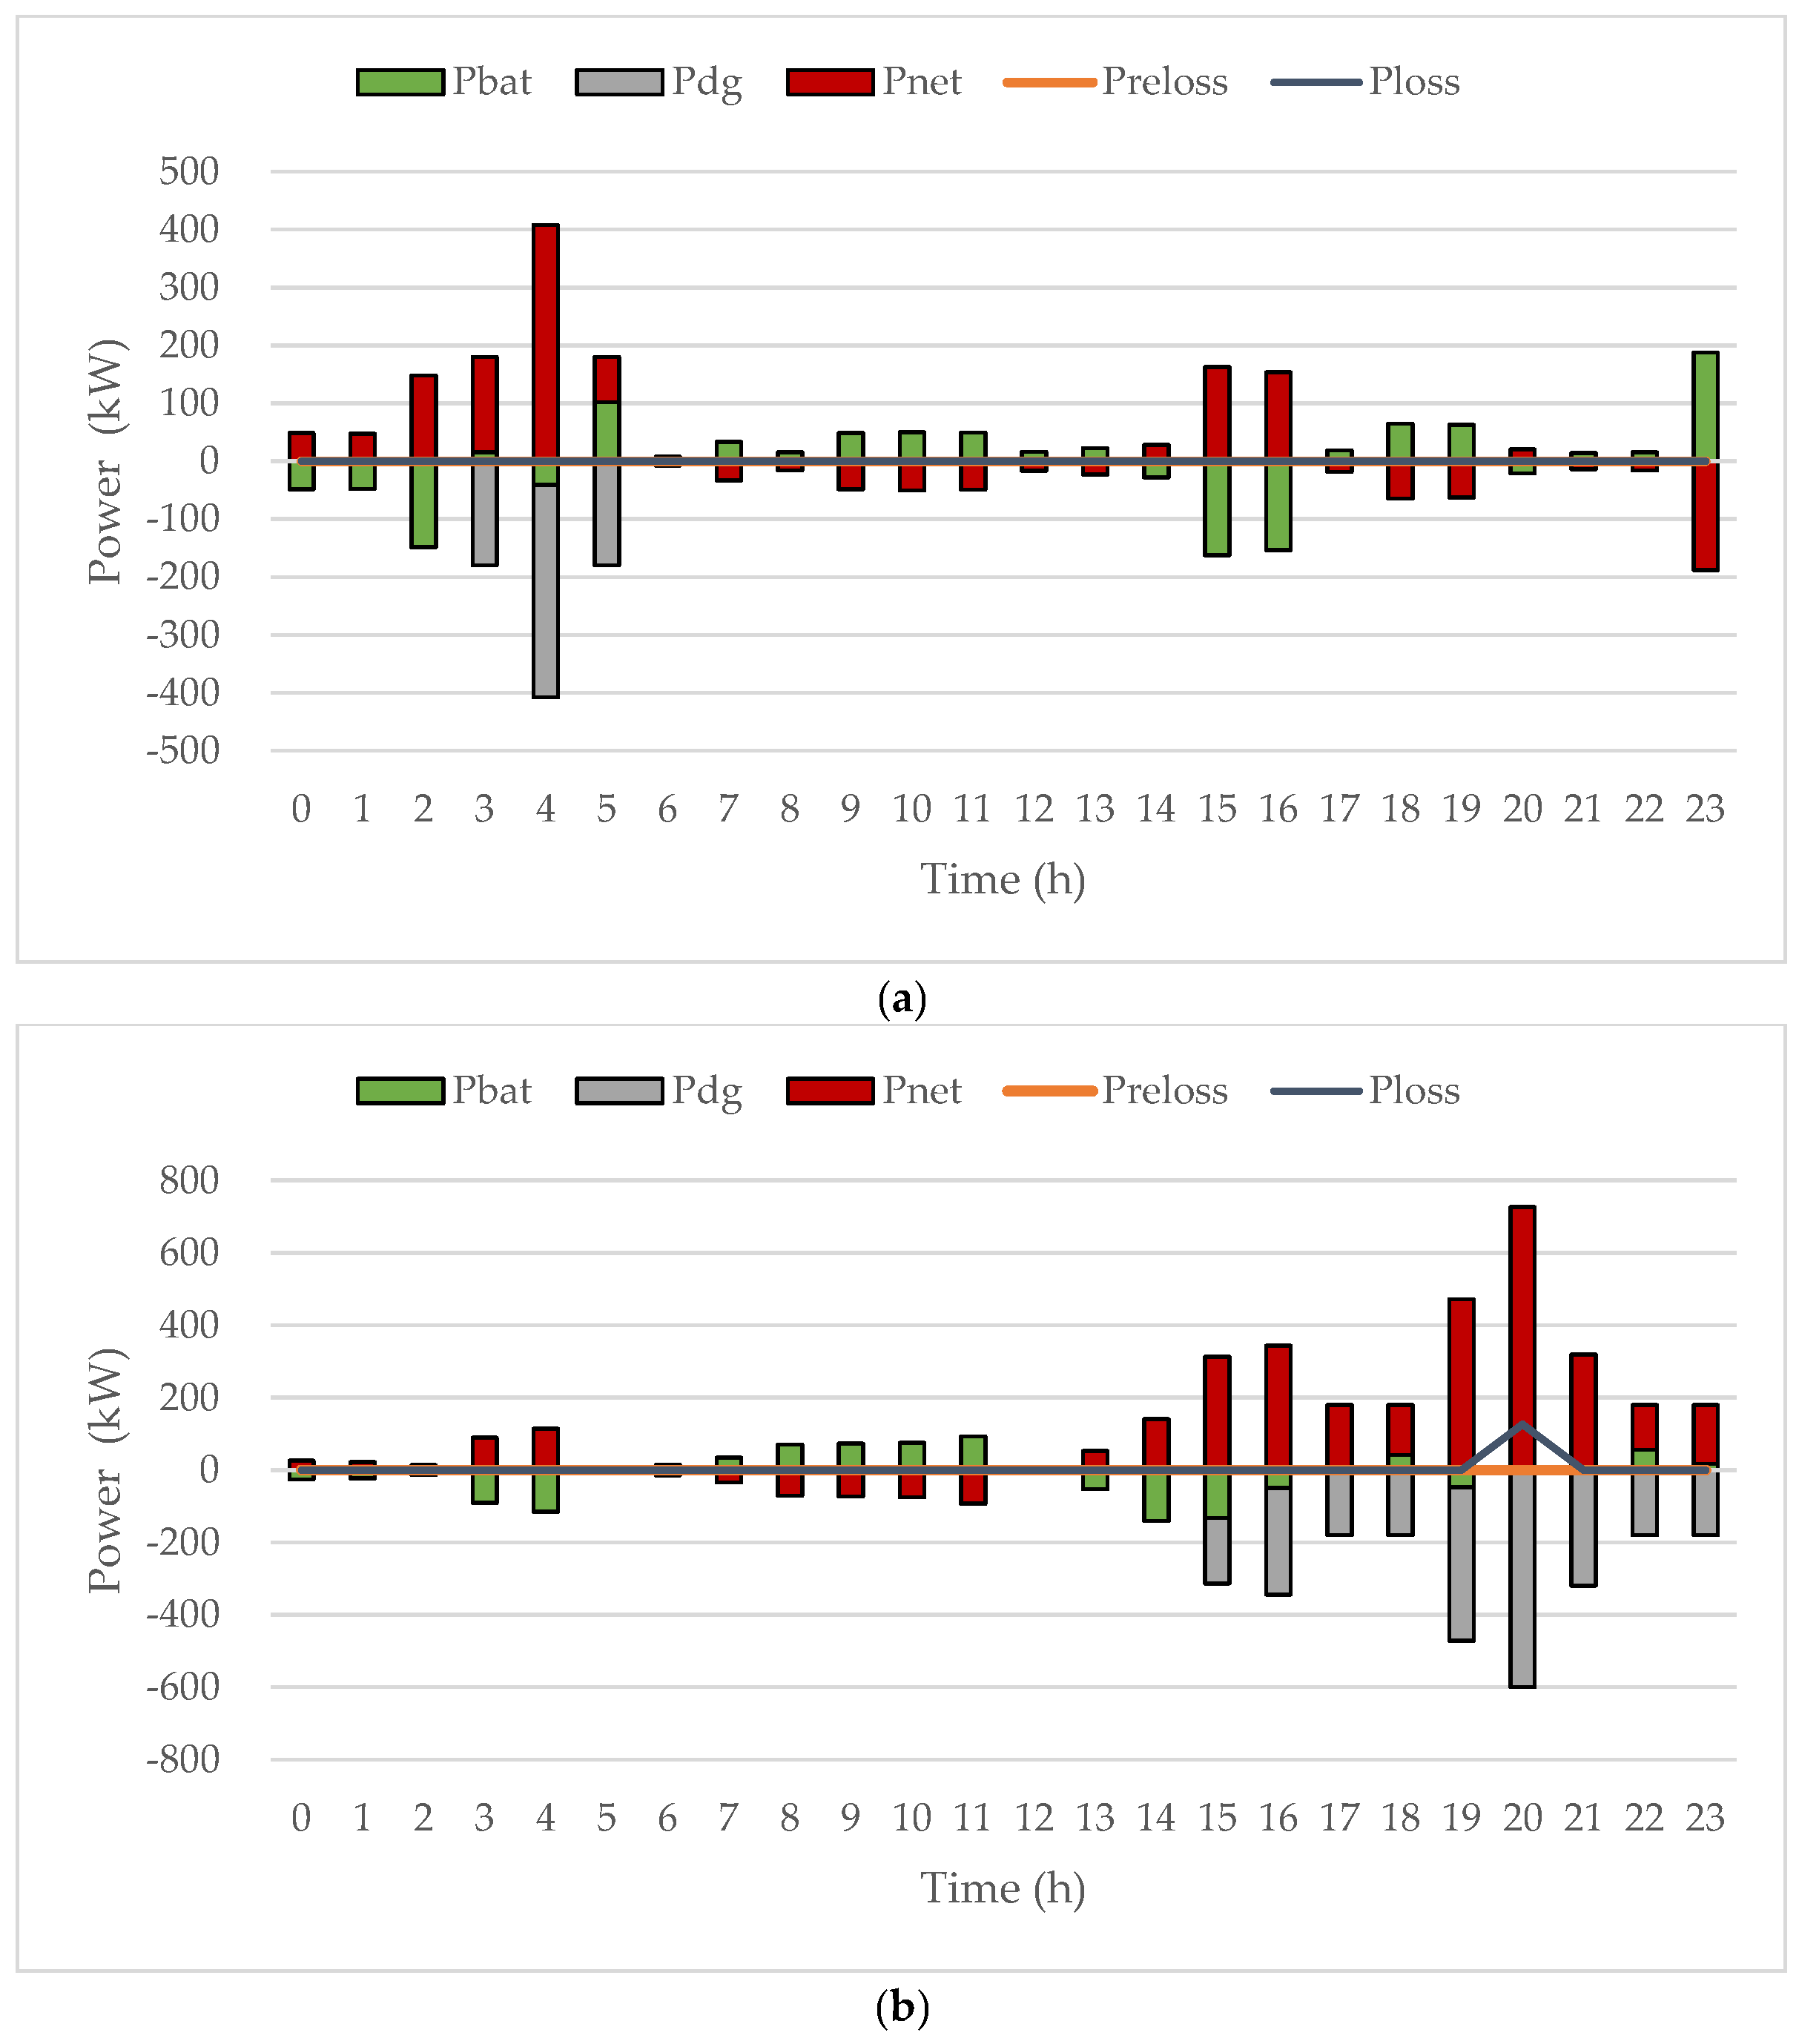
4.3.2. Power Balance Analysis
Figure 9a–d illustrates the power balance curves corresponding to the 24-h operation of four cases in the microgrid, respectively. The negative value represents power generation and the positive value represents power consumption. It is obvious that BSS takes advantage of the source and load characteristics to provide a basic opportunity for microgrid dispatching. DG, as a standby power supply, guarantees the normal operation of the grid in case of power shortage. In Case 1, the optimized net load peak is the shortest, the curve shape is stable. BSS matches the net load best, and can respond to the change of quickly at every moment. The operation time and output power of DG are the least, and there is no power abandonment or power shortage, which leads to the lowest comprehensive cost.
Case 2, 3, and 4 are all uneconomic and unstable compared with Case 1. In Case 2, the power curve of BSS does not match well with the net load curve. Due to the existence of high load peak, the discharge of BSS exceeds the charge too much, which leads to excessive use of DG and power shortage () at the peak time. In Case 3, although the EVs dispatching shaved the peak and filled the valley, it was not committed to the effective consumption of renewable energy, resulting in small peak load with large net load fluctuation. The running time of DG is not too long, but the system has the situation of power abandonment (). In Case 4, the extreme net load average value brings poor operating results. BSS can not effectively match the net load, DG operates too frequently, situations of power abandonment and power shortage exist, and the system has no economy to speak of. Power balance curves analysis further verifies the feasibility and superiority of the dispatching optimization strategy proposed in this paper.
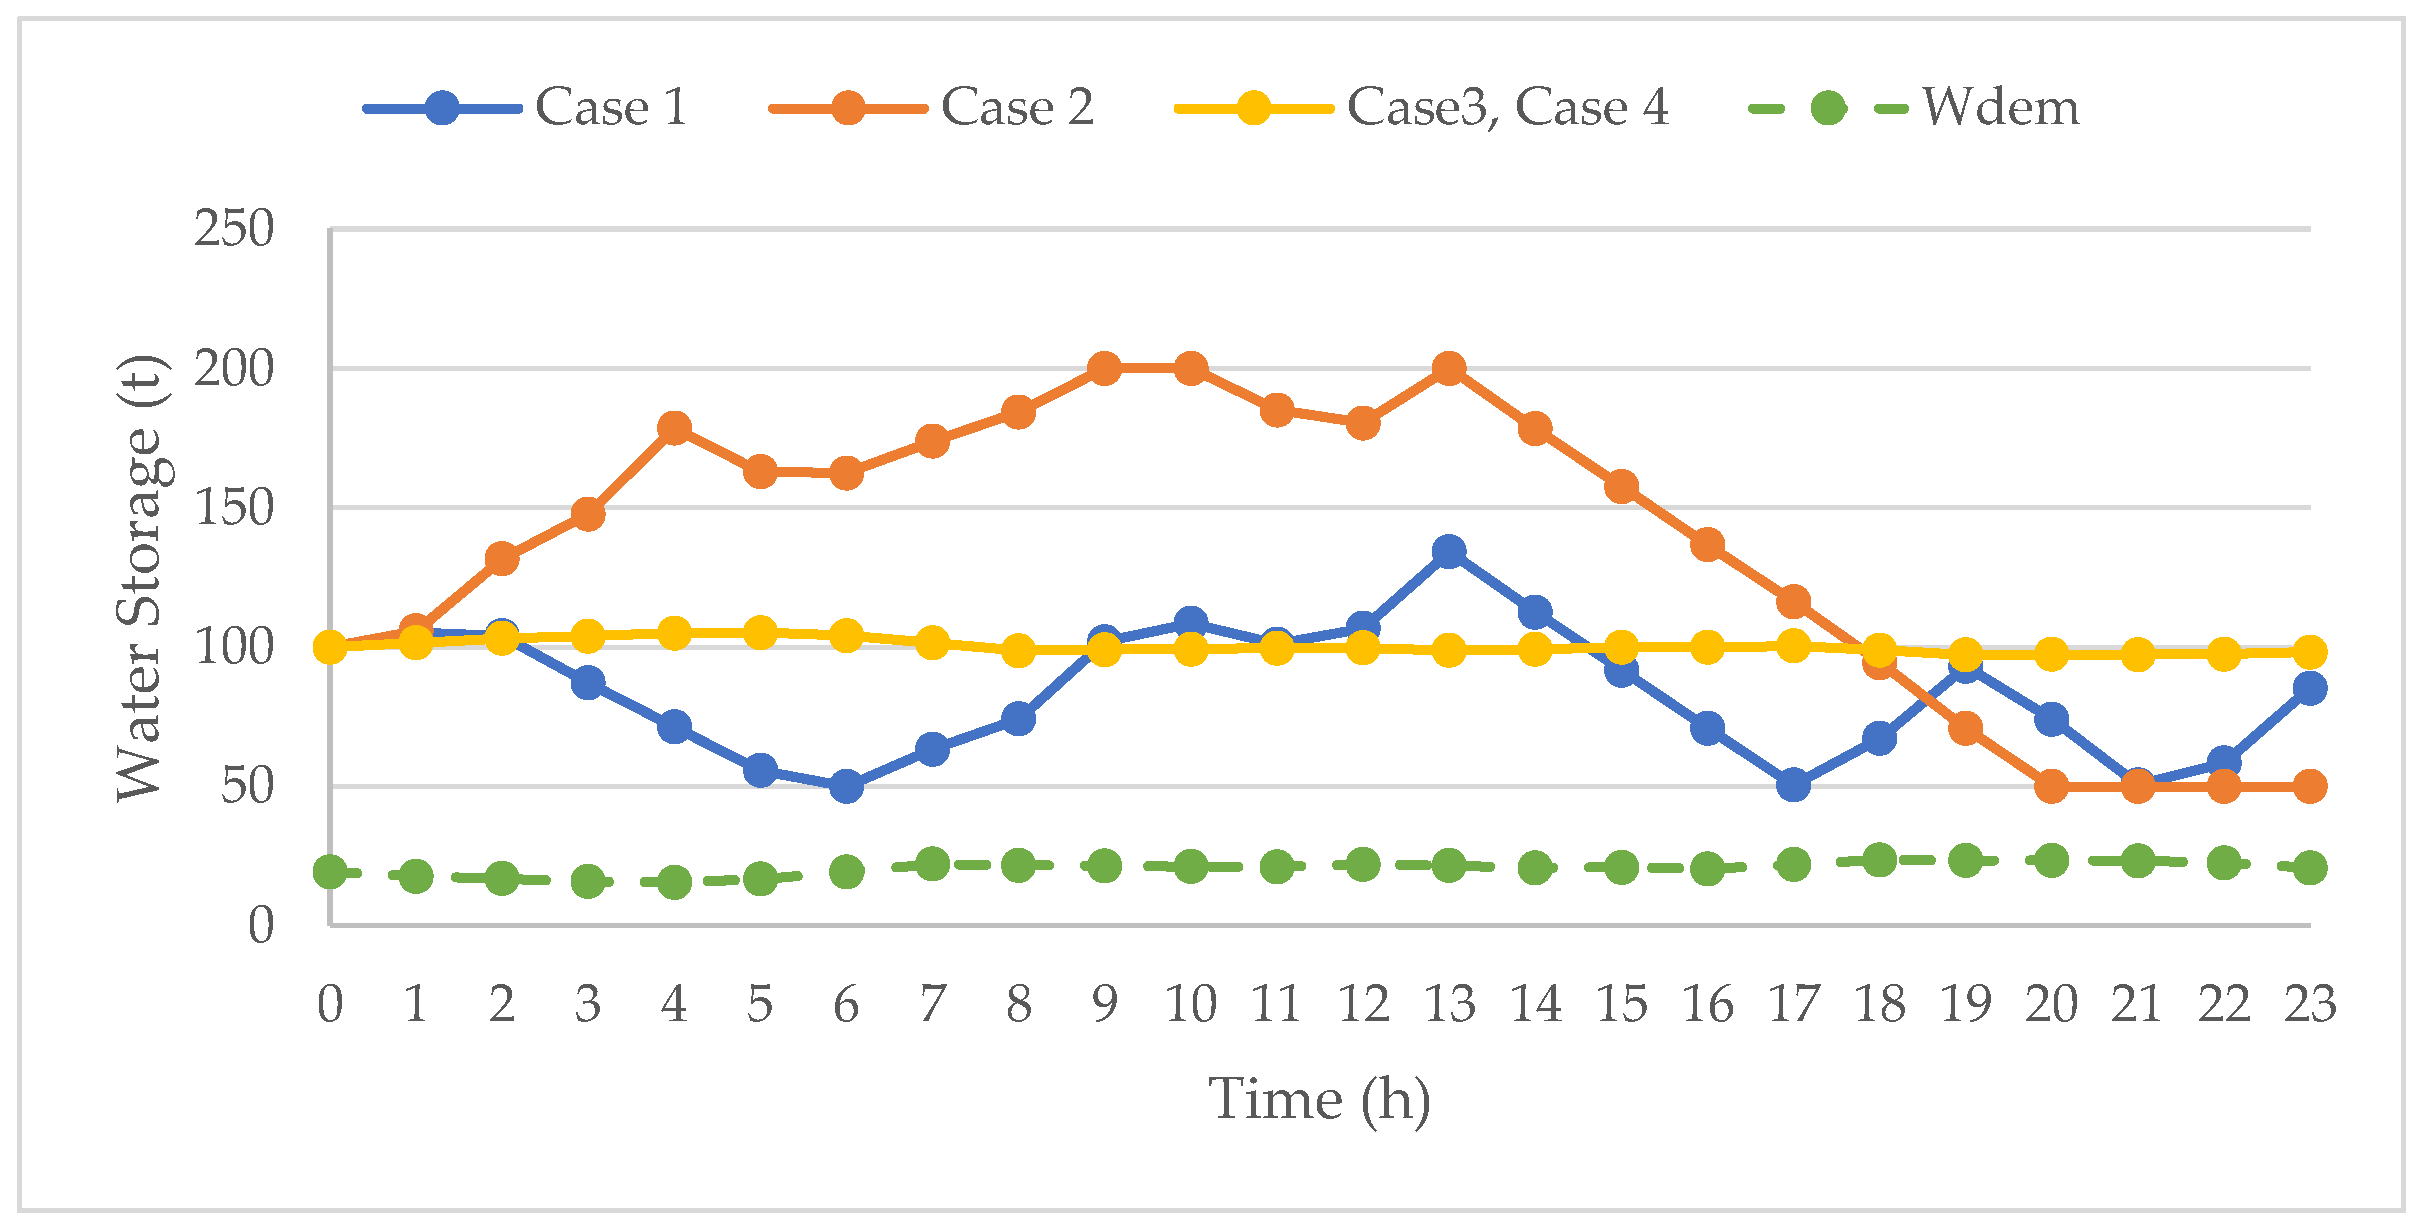
4.3.3. Water Production Analysis
Figure 10 illustrates the water storage curves corresponding to the 24-h operation of the four cases, respectively. Considering the basic life guarantee of island residents in extreme cases, the minimum water storage is set to be twice the hourly water demand. In Case 3 and Case 4, the water storage of the reservoir is maintained at a median value, and the operation power of DES is adjusted in response to the hourly water demand without using its flexibility. In Case 1 and Case 2, under the premise of ensuring the water demand, the participation of DES in dispatching optimization does play a role in adjusting the load curve and increasing the consumption of renewable energy. During the period of abundant renewable energy (e.g., 6:00–13:00), the water level of the reservoir keeps increasing. During the period of insufficient renewable energy (e.g., 14:00–17:00), the water level of the reservoir decreases continuously. This is the result of DES participating in dispatching.
In Case 1, the change of water storage is more stable and fluctuates in a small range along the median value, which is caused by the EVs peak shaving effect sharing the dispatch pressure with DES. In Case 2, DES bears all the dispatch pressure, so the water storage varies widely. The reservoir appears full water state in the middle dispatching period and dead water state in the later dispatching period, which results in the loss of flexibility. This further proves that the dispatching optimization needs the joint participation of EVs and DES.
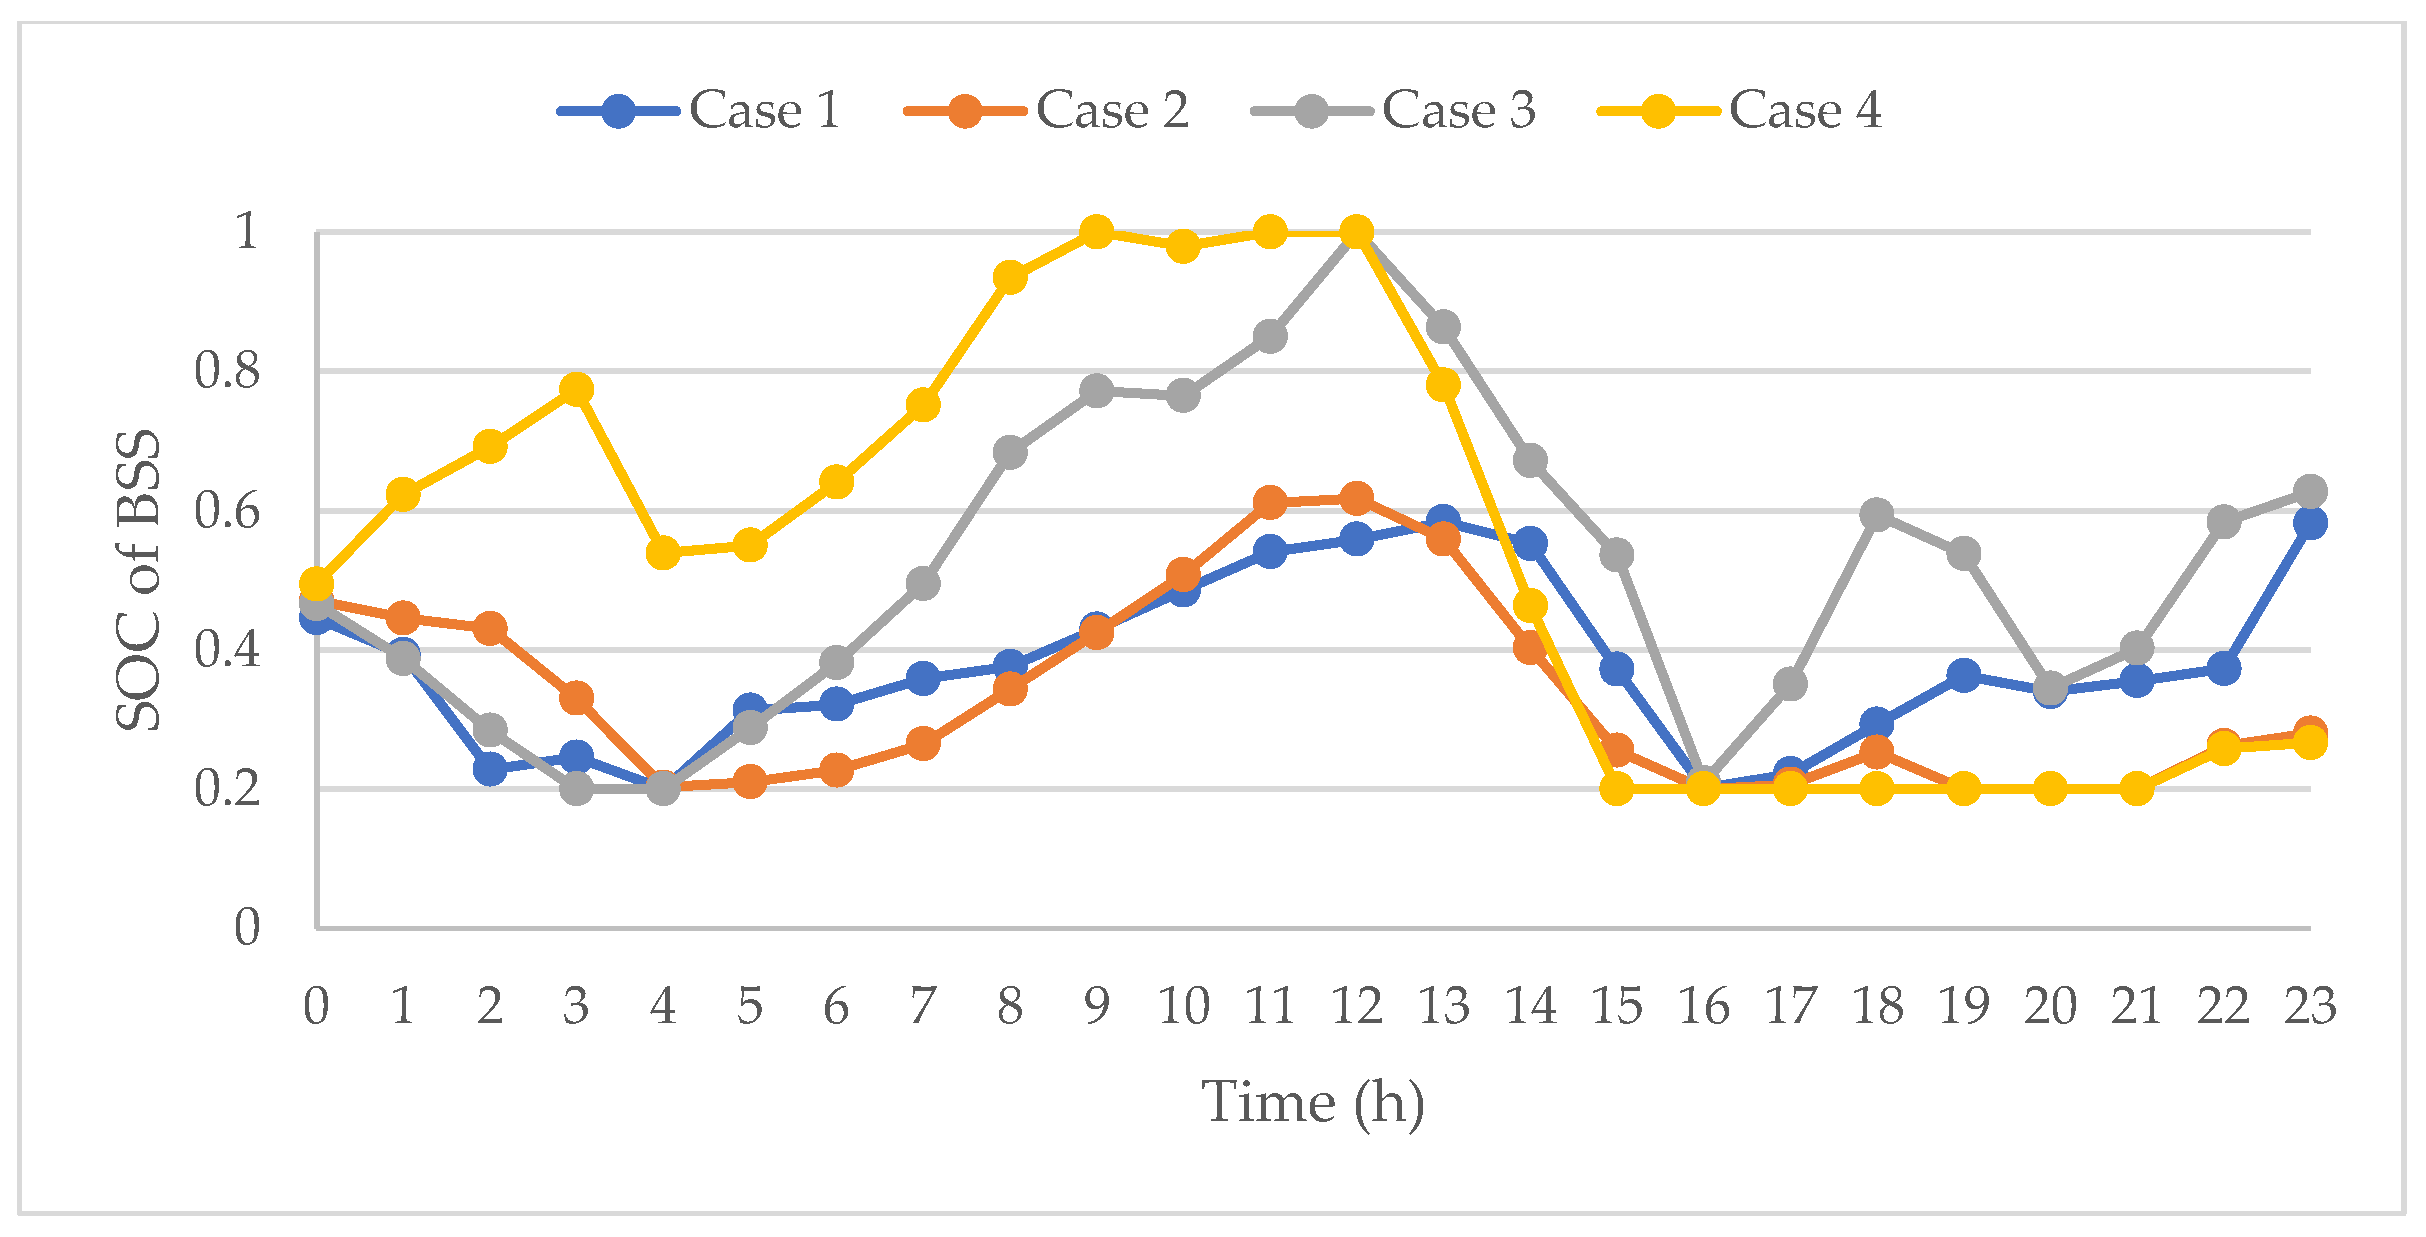
4.3.4. BSS SOC Analysis
Figure 11 illustrates the SOC curves of BSS corresponding to the 24-h operation of the four cases, respectively. In Case 1, the SOC curve is stable with less fluctuation, and no overcharge or overdischarge occurs. In Case 2 of EVs randomly charging, the evening peak is further increased, during which the BSS is empty. In Case 3 of DES normally operating, the consumption of renewable energy cannot be maximized, which can be seen from the full state of BSS at 12:00. In Case 4 of EVs randomly charging and DES normally operating, BSS appears full state and empty state for several hours, both of which lose the function of energy management. It can be verified that the dispatching optimization of EVs and DES provides an excellent net load base and buffer for the operation of BSS and DG, and makes a great contribution to the limitation of BSS’s operation aging and DG‘s pollutant emissions.
5. Conclusions
In this paper, a multi-objective dispatching optimization method of an island hybrid renewable energy microgrid integrated with EVs and DES is proposed comprehensively considering the economy and renewable energy penetration indexes. Two optimization objectives are presented: minimizing the comprehensive operating cost and the net load fluctuation. An improved multi-objective grey wolf optimizer is proposed to solve the dispatching problem. The system is modeled and simulated by MATLAB software. The major conclusions in this paper are listed as follows:
- The simulation results verify the feasibility of the proposed optimization method. The optimal dispatching solution is obtained. EVs, DES, BBS, and DG are closely complementary base on an economic, effective, and reliable dispatching strategy.
- Four different dispatching cases are proposed and verify that the participation of EVs and DES in load side dispatching can make a great contribution to effectively reduce the comprehensive operation cost and net load fluctuation, and is conducive to the efficient utilization of renewable energy.
- The comparative analysis results also show that the optimal dispatching of EVs has a greater impact on the comprehensive operation cost than DES, and the optimal dispatching of DES has a greater impact on the net load fluctuation than EVs. Therefore, the microgrid will benefit more when they participate in the dispatching together.
The dispatching optimization method of hybrid energy system proposed in this paper is also applied to other similar optimization problems of isolated microgrids. It should be noted that the output of renewable energy and the original load in this study are randomly simulated by the historical data and corresponding mathematical models, the hourly water demand is simply simulated by the historical data of a given day at a given place. The frequency control of EVs and DES integrated into microgrids is not considered in this paper. In an actual operation process, the frequency deviation and regulation caused by load connection must be considered. Therefore, further studies should focus on the impact of uncertainty and the implementation of effective frequency control while considering demand side response in microgrid operation.
Author Contributions
Conceptualization, W.Z. and G.Z.; methodology, W.Z. and G.Z.; software, W.Z.; validation, W.Z.; investigation, W.Z.; resources, W.Z.; data curation, W.Z.; writing—original draft preparation, W.Z.; writing—review and editing, W.Z. and J.G. All authors have read and agreed to the published version of the manuscript.
Funding
Research received no external fund.
Institutional Review Board Statement
Not applicable.
Informed Consent Statement
Not applicable.
Data Availability Statement
The data presented in this study are available on request from the corresponding author. The data are not publicly available due to the confidentiality of involved data.
Conflicts of Interest
The authors declare no conflict of interest.
References
- Croce, D.; Giuliano, F.; Bonomolo, M.; Leone, G. A decentralized load control architecture for smart energy consumption in small islands. Sustain. Cities Soc. 2019, 53, 101902. [Google Scholar] [CrossRef]
- Yang, H.; Zhao, R.; Xin, H. Development and Research Status of Island Power Systems. Trans. China Electrotech. Soc. 2013, 28, 95–105. [Google Scholar]
- Kuang, Y.; Zhang, Y.; Zhou, B.; Li, C.; Cao, Y.; Li, L.; Zeng, L. A review of renewable energy utilization in islands. Renew. Sustain. Energy Rev. 2016, 59, 504–513. [Google Scholar] [CrossRef]
- Shariatzadeh, F.; Mandal, P.; Srivastava, A.K. Demand response for sustainable energy systems: A review, application and implementation strategy. Renew. Sustain. Energy Rev. 2015, 45, 343–350. [Google Scholar] [CrossRef]
- Pinto, F.S.; Marques, R.C. Desalination projects economic feasibility: A standardization of cost determinants. Renew. Sustain. Energy Rev. 2017, 78, 904–915. [Google Scholar] [CrossRef]
- Manju, S.; Sagar, N. Renewable energy integrated desalination: A sustainable solution to overcome future fresh-water scarcity in India. Renew. Sustain. Energy Rev. 2017, 73, 594–609. [Google Scholar] [CrossRef]
- Prathapaneni, D.R.; Detroja, K. Optimal design of energy sources and reverse osmosis desalination plant with demand side management for cost-effective freshwater production. Desalination 2020, 496, 114741. [Google Scholar] [CrossRef]
- Wang, Z.; Lin, X.; Tong, N.; Li, Z.; Sun, S.; Liu, C. Optimal planning of a 100% renewable energy island supply system based on the integration of a concentrating solar power plant and desalination units. Int. J. Electr. Power Energy Syst. 2020, 117, 105707. [Google Scholar] [CrossRef]
- Padrón, I.; Avila, D.; Marichal, G.N.; Rodríguez, J.A. Assessment of hybrid renewable energy systems to supplied energy to autonomous desalination systems in two islands of the Canary Archipelago. Renew. Sustain. Energy Rev. 2019, 101, 221–230. [Google Scholar] [CrossRef]
- Habib, S.; Kamran, M.; Rashid, U. Impact analysis of vehicle-to-grid technology and charging strategies of electric vehicles on distribution networks—A review. J. Power Sources 2015, 277, 205–214. [Google Scholar] [CrossRef]
- Zhao, G.; Huang, X.; Qiang, H. Coordinated control of PV generation and EVs charging based on improved DECell algorithm. Int. J. Photoenergy 2015, 2015, 1–13. [Google Scholar] [CrossRef] [Green Version]
- Ma, H.; Yang, Z.; You, P.; Fei, M. Multi-objective biogeography-based optimization for dynamic economic emission load dispatch considering plug-in electric vehicles charging. Energy 2017, 135, 101–111. [Google Scholar] [CrossRef]
- Anastasiadis, A.G.; Konstantinopoulos, S.; Kondylis, G.P.; Vokas, G.A. Electric vehicle charging in stochastic smart microgrid operation with fuel cell and RES units. Int. J. Hydrogen Energy 2017, 42, 8242–8254. [Google Scholar] [CrossRef]
- Shakti, S.; Shubhangi, J.; Mukesh, S. Energy management and voltage stabilization in an islanded microgrid through an electric vehicle charging station. Sustain. Cities Soc. 2018, 41, 679–694. [Google Scholar]
- Xinhui, L.; Kaile, Z.; Shanlin, Y. Multi-objective optimal load dispatch of microgrid with stochastic access of electric vehicles. J. Clean. Prod. 2018, 195, 187–199. [Google Scholar]
- Razman, A.; Chee, W.T. A comprehensive review on photovoltaic emulator. Renew. Sustain. Energy Rev. 2017, 80, 430–452. [Google Scholar]
- Hanieh, B.; Saad, M.; Velappa, G. Optimization of micro-grid system using MOPSO. Renew. Energy 2014, 71, 295–306. [Google Scholar]
- Shin, J.; Lee, J.H.; Realff, M.J. Operational planning and optimal sizing of microgrid considering multi-scale wind uncertainty. Appl. Energy 2017, 195, 616–633. [Google Scholar] [CrossRef]
- Zhang, Y.; Lundblad, A.; Campana, P.E.; Benavente, F.; Yan, J. Battery sizing and rule-based operation of grid-connected photovoltaic-battery system: A case study in Sweden. Energy Convers. Manag. 2017, 133, 249–263. [Google Scholar] [CrossRef]
- Ogunjuyigbe, A.S.O.; Ayodele, T.R.; Akinola, O.A. Optimal allocation and sizing of PV/wind/split-diesel/battery hybrid energy system for minimizing life cycle cost, carbon emission and dump energy of remote residential building. Appl. Energy 2016, 171, 153–171. [Google Scholar] [CrossRef]
- Leou, R. Optimal Charging/Discharging Control for electric vehicles considering power system constraints and operation costs. IEEE Trans. Power Syst. 2016, 31, 1854–1860. [Google Scholar] [CrossRef]
- Bukar, A.L.; Tan, C.W.; Lau, K.Y. Optimal sizing of an autonomous photovoltaic/wind/battery/diesel generator microgrid using grasshopper optimization algorithm. Sol. Energy 2019, 188, 685–696. [Google Scholar] [CrossRef]
- Khooban, M. Secondary Load Frequency control of time-delay stand-alone microgrids with electric vehicles. IEEE Trans. Ind. Electron. 2018, 65, 7416–7422. [Google Scholar] [CrossRef]
- U.S.D.O.T. 2017 National Household Travel Survey. Available online: https://nhts.ornl.gov/ (accessed on 20 December 2020).
- Xiao, H.; Pei, W.; Kong, L. Multi-objective optimization scheduling method for active distribution network with large scale electric vehicles. Trans. China Electrotech. Soc. 2017, 32, 179–189. [Google Scholar]
- Recalde Melo, D.F.; Trippe, A.; Gooi, H.B.; Massier, T. Robust electric vehicle aggregation for ancillary service provision considering battery aging. IEEE Trans. Smart Grid 2018, 9, 1728–1738. [Google Scholar] [CrossRef]
- Brendel, L.P.M.; Shah, V.M.; Groll, E.A.; Braun, J.E. A methodology for analyzing renewable energy opportunities for desalination and its application to Aruba. Desalination 2020, 493, 114613. [Google Scholar] [CrossRef]
- Sui, Q.; Lin, X.N.; Tong, N. A Novel Dispatching Strategy for isolated microgrid based on controllable load efficiency control. Proc. CSEE 2019, 39, 7168–7178. [Google Scholar]
- Giudici, F.; Castelletti, A.; Garofalo, E.; Giuliani, M.; Maier, H.R. Dynamic, multi-objective optimal design and operation of water-energy systems for small, off-grid islands. Appl. Energy 2019, 250, 605–616. [Google Scholar] [CrossRef]
- Wu, H.; Wang, Y.S. Economic dispatch of microgrid using intelligent single particle optimizer algorithm. Power Syst. Prot. Control. 2016, 44, 43–49. [Google Scholar]
- Zhang, J.H.; Yu, L.; Liu, N.; Xiao, R. Capacity configuration optimization for island microgrid with wind/photovoltaic/diesel/storage and seawater desalination load. Trans. China Electrotech. Soc. 2014, 2, 102–112. [Google Scholar]
- Mirjalili, S.; Lewis, A. Grey wolf optimizer. Adv. Eng. Softw. 2014, 69, 46–61. [Google Scholar] [CrossRef] [Green Version]
- Mirjalili, S.; Saremi, S.; Coelho, L. Multi-objective grey wolf optimizer: A novel algorithm for multi-criterion optimization. Expert Syst. Appl. 2016, 47, 106–119. [Google Scholar] [CrossRef]
- Zhu, W.; Guo, J.; Zhao, G.; Zeng, B. Optimal sizing of an island hybrid microgrid based on improved multi-objective grey wolf optimizer. Processes 2020, 8, 1581. [Google Scholar] [CrossRef]
- Zhu, W.; Guo, J.; Zhao, G. Multi-objective sizing optimization of hybrid renewable energy microgrid in a stand-alone marine context. Electronics 2021, 10, 174. [Google Scholar] [CrossRef]
- Xu, S.; Zhang, H.; Shi, D.; Guo, X.; Lin, X.; Li, Z. Setting strategy of charging service fee for fast charging load of smart cities. Proc. CSEE 2020, 40, 3187–3201. [Google Scholar]
- Wei, F.; Sui, Q.; Lin, X.; Li, Z.; Chen, L. Optimized energy control strategy about daily operation of islanded microgrid with wind/photovoltaic/diesel/battery under consideration of transferable load efficiency. Proc. CSEE 2018, 38, 1045–1053. [Google Scholar]
- Liu, H.; Ji, Y.; Zhuang, H.; Wu, H. Multi-objective dynamic economic dispatch of microgrid systems including vehicle-to-grid. Energies 2015, 8, 4476–4495. [Google Scholar] [CrossRef]
- N.O.A.A. Data Access of National Centers for Environmental Information. Available online: https://www.ncei.noaa.gov/ (accessed on 12 December 2020).
Figure 1.
Hybrid energy system configuration.

Figure 2.
The probability distribution of the daily travel distance of the EVs.

Figure 3.
The probability distribution of the return time of the EVs.

Figure 4.
The charging load simulation of 100 EVs and 200 EVs.

Figure 5.
The grid TOU price.

Figure 6.
The Pareto Front of the dispatching optimization.

Figure 7.
The 24-h operation simulated by the optimal dispatching solution.

Figure 8.
(a) The various load curves of Case 1. (b) The various load curves of Case 2. (c) The various load curves of Case 3. (d) The various load curves of Case 4.
Figure 8.
(a) The various load curves of Case 1. (b) The various load curves of Case 2. (c) The various load curves of Case 3. (d) The various load curves of Case 4.


Figure 9.
(a) The power balance curves of Case 1. (b) The power balance curves of Case 2. (c) The power balance curves of Case 3. (d) The power balance curves of Case 4.
Figure 9.
(a) The power balance curves of Case 1. (b) The power balance curves of Case 2. (c) The power balance curves of Case 3. (d) The power balance curves of Case 4.


Figure 10.
The water storage curves of four cases.

Figure 11.
The SOC curves of BSS of four cases.


Table 1.
The major operation and technical parameters of BSS, DG, EV, and DES.
| Sources | Parameters | Values | Units |
|---|---|---|---|
| BSS | 5000 | Times | |
| 1000 | CNY/kW | ||
| 95 | % | ||
| 95 | % | ||
| 300 | kW | ||
| −300 | kW | ||
| 0.95 | \ | ||
| 0.2 | \ | ||
| 0.104 | CNY/kW | ||
| DG | 300 | kW | |
| 90 | kW | ||
| 0.98 | CNY/kW | ||
| 0.236 | CNY/kW | ||
| EV | 24 | kWh | |
| 0.12 | kWh/km | ||
| 4 | kW | ||
| −4 | kW | ||
| 0.9 | \ | ||
| 0.2 | \ | ||
| 0.4 | CNY/kW | ||
| DES | 100 | kW | |
| 22 | kW | ||
| a | −0.0032 | \ | |
| b | 0.7550 | \ | |
| c | −13.8333 | \ | |
| 0.221 | CNY/kW |
Table 2.
Types of pollutants produced in DG’s operation and the pollutant control cost.
| Pollutants Types | Units | |||
|---|---|---|---|---|
| Control Cost | 0.21 | 14.842 | 62.964 | CNY/kg |
| Emission Parameter | 649 | 0.206 | 9.89 | g/kWh |
Table 3.
IMOGWO Parameters.
| Parameters | Values | Parameters | Values | Parameters | Values |
|---|---|---|---|---|---|
| GreyWolves_num | 200 | alpha | 0.1 | nGrid | 10 |
| MaxIt | 1000 | beta | 4 | u | 0.88 |
| Archive_size | 100 | gamma | 2 | k | 0.08 |
Table 4.
The compromised optimal solutions of four cases.
| Cases | Participant | ||
|---|---|---|---|
| 1 | EVs, DES | 8855.96 | 1428.69 |
| 2 | DES | 13,217.11 | 2153.78 |
| 3 | EVs | 10,604.42 | 3357.48 |
| 4 | none | 15,200.02 | 3069.83 |
Publisher’s Note: MDPI stays neutral with regard to jurisdictional claims in published maps and institutional affiliations. |
© 2021 by the authors. Licensee MDPI, Basel, Switzerland. This article is an open access article distributed under the terms and conditions of the Creative Commons Attribution (CC BY) license (https://creativecommons.org/licenses/by/4.0/).
Share and Cite
MDPI and ACS Style
Zhu, W.; Guo, J.; Zhao, G. Multi-Objective Dispatching Optimization of an Island Microgrid Integrated with Desalination Units and Electric Vehicles. Processes 2021, 9, 798. https://doi.org/10.3390/pr9050798
AMA Style
Zhu W, Guo J, Zhao G. Multi-Objective Dispatching Optimization of an Island Microgrid Integrated with Desalination Units and Electric Vehicles. Processes. 2021; 9(5):798. https://doi.org/10.3390/pr9050798
Chicago/Turabian StyleZhu, Wenqiang, Jiang Guo, and Guo Zhao. 2021. "Multi-Objective Dispatching Optimization of an Island Microgrid Integrated with Desalination Units and Electric Vehicles" Processes 9, no. 5: 798. https://doi.org/10.3390/pr9050798
Note that from the first issue of 2016, this journal uses article numbers instead of page numbers. See further details here.