
Recovery and Enhanced Upgrading of Rare Earth Elements from Coal-Based Resources: Bioleaching and Precipitation


Department of Materials Science and Engineering, University of Utah, Salt Lake City, UT 84112, USA
*
Author to whom correspondence should be addressed.
Minerals 2021, 11(5), 484; https://doi.org/10.3390/min11050484
Submission received: 30 March 2021
/
Revised: 22 April 2021
/
Accepted: 25 April 2021
/
Published: 1 May 2021
(This article belongs to the Special Issue Leaching and Solution Treatments of Rare Earth Elements from Various Sources, Volume II)
Abstract
:Rare earth elements (REEs) are of great importance to modern society and their reliable supply is a major concern of many industries that utilize them in metal alloys, semiconductors, electrical equipment, and defense equipment. REEs in the coal waste have been revealed to be an alternative resource for REEs production. In this study, the extraction, recovery, and upgrading of the REEs from coal waste has been realized with the bioleaching and precipitation processes. Reliable and sustainable acid and oxidant production from the oxidation of the pyrite with Acidithiobacillus ferrooxidans to generate acid for leaching were realized in this research. The acidified bioleaching solution was used to extract REEs from coal waste, with 13–14% yields for most REE elements (~72 h of leaching). However, recovery for longer duration tests was significant higher (varies from 40–60% for individual REEs). After extraction, precipitation and separation processes were designed with the aid of Visual Minteq calculations and modeling to concentrate the REEs. With the procedures designed in this research, a final REEs precipitate product containing 36.7% REEs was produced.
1. Introduction
The rare earth elements (REEs) are a group of 17 elements in the periodic table that have very similar properties. REEs are exceptionally helpful in engineering and technology applications, for example in gas sensors, hybrid vehicles, metal alloys, semiconductors, resistance hardware, fluorescent lights, and LED lights, as well as in the fabrication of electrical equipment and related magnets [1]. The 4f electrons’ energy of lanthanides is not as high as that of valence electrons in the outer shell [1]. These electrons are confined and part of the ionic center. Moreover, these 4f electrons do not legitimately participate in the compound formation [1]. This is a primary driver for the difficulty in isolating similar REEs.
The most common minerals that are major sources of REEs include monazite, bastnasite, and xenotime as well as certain ore materials, clays, and carbonatite minerals [2]. Frequently, ores that are rich in REEs, such as monazite or bastnasite, are subject to mineral concentration methods, for example, gravity separation, flotation, and magnetic separation prior to chemical processing. The recovery of REEs from monazite or bastnasite concentrates can be accomplished in either acidic or other chemically aggressive media. Bastnasite is commonly exposed to air roasting or sulfuric acid at raised temperatures to eliminate carbon dioxide and oxidize cerium. The resulting product after roasting is processed in hydrochloric acid or water to solubilize REEs with the exception of cerium. The cerium oxide buildup is reduced with sodium hydroxide at that point, then processed in hydrochloric acid before being extracted. Apart from mineral or related parent resources, REEs can also be recovered from secondary sources through recycling [3].
REEs and related reserves in coal-related materials are substantial [2]. Under an assumption of typical USA production of coal of ~600 million short tons per year with an average REE concentration of ~200 ppm, the potential REE asset is 120,000 tons per year [2]. This is similar to the yearly worldwide REEs production. The majority of such REEs are present in coal-related materials such as ash or gangue [2]. XRD (X-ray diffraction) analysis of coal refuse indicates the presence of various phases such as quartz, iwakiite, brindleyite, dysprosium silicon oxide nitride, kaolinite, nimesite, and calcium yttrium silicate. Note that because of very low concentrations, the phase and crystal structure of some of the REE salts/mineral are often difficult to detect. REEs often end up in reject heaps or tailings impoundments during normal coal plant operations. By and large, a variety of REEs can be recovered with ease utilizing suitable coal processing steps as discussed in previous reports [2]. In the current exploration, the processing approach utilizes a characteristic pyrite enhanced coal waste source.
Biooxidation was applied to coal-based materials in this and other projects [4,5]. Three forms or strains, namely Acidithiobacillus ferrooxidans (origin: coal waste), Acidithiobacillus caldus (origin: coal waste) and Acidithiobacillus thiooxidans (origin: Kimmeridge clay), are considered to be major species associated with bioleaching; and some of the more advanced genetic and metabolic prediction models have been developed by their genomic analyses. There are 157 genomes of acidophils stored in public repositories as of March 2016. Among these, 29 come from micro-organisms associated with heaps among bioleaching or similar biomining conditions [6,7]. Genomics has provided unparalleled insight into the genetic and metabolic ability of bioleaching microorganisms acidophiles and their immediate relatives. Many of these microorganisms are obstinate to genetic engineering and a big route for gaining insight into their biology is related to the bioinformatic analysis of genome details.
The genome related information about A. ferrooxidans and associated comparative genomics were useful to understand the variety of mechanisms, processes, and various other aspects of metabolism. Some of those include iron and sulfur oxidation, sulfur assimilation, extracellular polysaccharide formation, CO2 fixation, nitrogen metabolism, ecophysiology, and homeostasis. A. ferrooxidans has been the top priority as a model bacterium for the study of bioleaching microorganism [6]. Nonetheless, it was recognized that A. ferrooxidans was just one of a group of bioleaching microorganisms, and since 2008 genomes from other microbes have become more accessible, expanding the ability to evaluate and characterize microorganisms’ genetic and metabolic ability.
Since the ore deposited in bioleaching heaps is depleted in organic matter and poor in fixed nitrogen, the microorganism consortia often need nutrient enrichment. However, these chemolithoautotrophs use iron and sulfur as energy sources and can grow symbiotically with diazotrophs (a diazotroph is a microorganism that is able to grow without external sources of fixed nitrogen). A. ferrooxidans meets desired criteria and is well-suited for typical leaching environments, which helps to explain why it is an early major bioleaching heap colonizer.
Many of the mineral sources used to prepare bioleaching heaps are rich in sulfides. Such sulfide minerals can react with water and air to form sulfuric acid when mechanically exposed. Unless neutralized by accompanying specific minerals present in the rock, the end result is a significant enhancement in acidity, which can cause the resuscitation of reservoirs of inactive acidophiles presumed to be present in dormant condition. In general, mesophiles do not remain active at higher temperatures. Since no nitrogen-fixing thermophiles have been reported from bioleaching heaps, mortality and recycling of mesophiles can be a significant source of fixed carbon and, possibly, the only source of fixed nitrogen for the thermophilic bioleaching microorganisms.
Ferric ions formed during bio-oxidation are instrumental in oxidizing pyrite [8,9] which produces acid, most of which is consumed during ferrous ion oxidation as shown in Equations (1) and (2).
8H2O + FeS2 + 14Fe3+ ↔ 15Fe2+ + 2SO42− + 16H+
14Fe2+ + 14H+ + 7O2 ↔ 14H2O + 14Fe3+
Both Fe3+ ions and acidic media are useful for REEs dissolution [10], and the process of utilizing pyrite to generate acid for extraction, simultaneously eliminates it from causing future acid rock drainage and related environmental issues. Thus, in the context of REE in coal resources, which also contain pyrite, the production of REEs from coal resources using bioleaching allows for the recovery of important domestic REE resources and related income, which can also broaden asset life while simultaneously reducing environmental impact and related expenses [2,11].
In this research, the extraction, recovery, and upgrading of REEs from coal-based resources have been conducted with bioleaching and precipitation. Recovering the REEs from coal-based resources using this approach has many advantages compared to traditional methods. Therefore, it has the potential to generate strategic REE products in a profitable manner from waste materials. Procedures for REEs production from coal waste resources were developed with theoretical calculations and experimental validation. The associated leaching and precipitation processes were analyzed to study the properties of the product and the efficiency of the process.
2. Experimental
Bioleaching and precipitation tests were designed and conducted to study the REE extraction, recovery, and upgrading processes. This series of tests were marked as B4 tests. Solutions obtained in each step were marked as B4S1-B4S5 to help track the changes of the REE concentrations in the solution during the leaching and precipitation tests.
2.1. Bioleaching Test
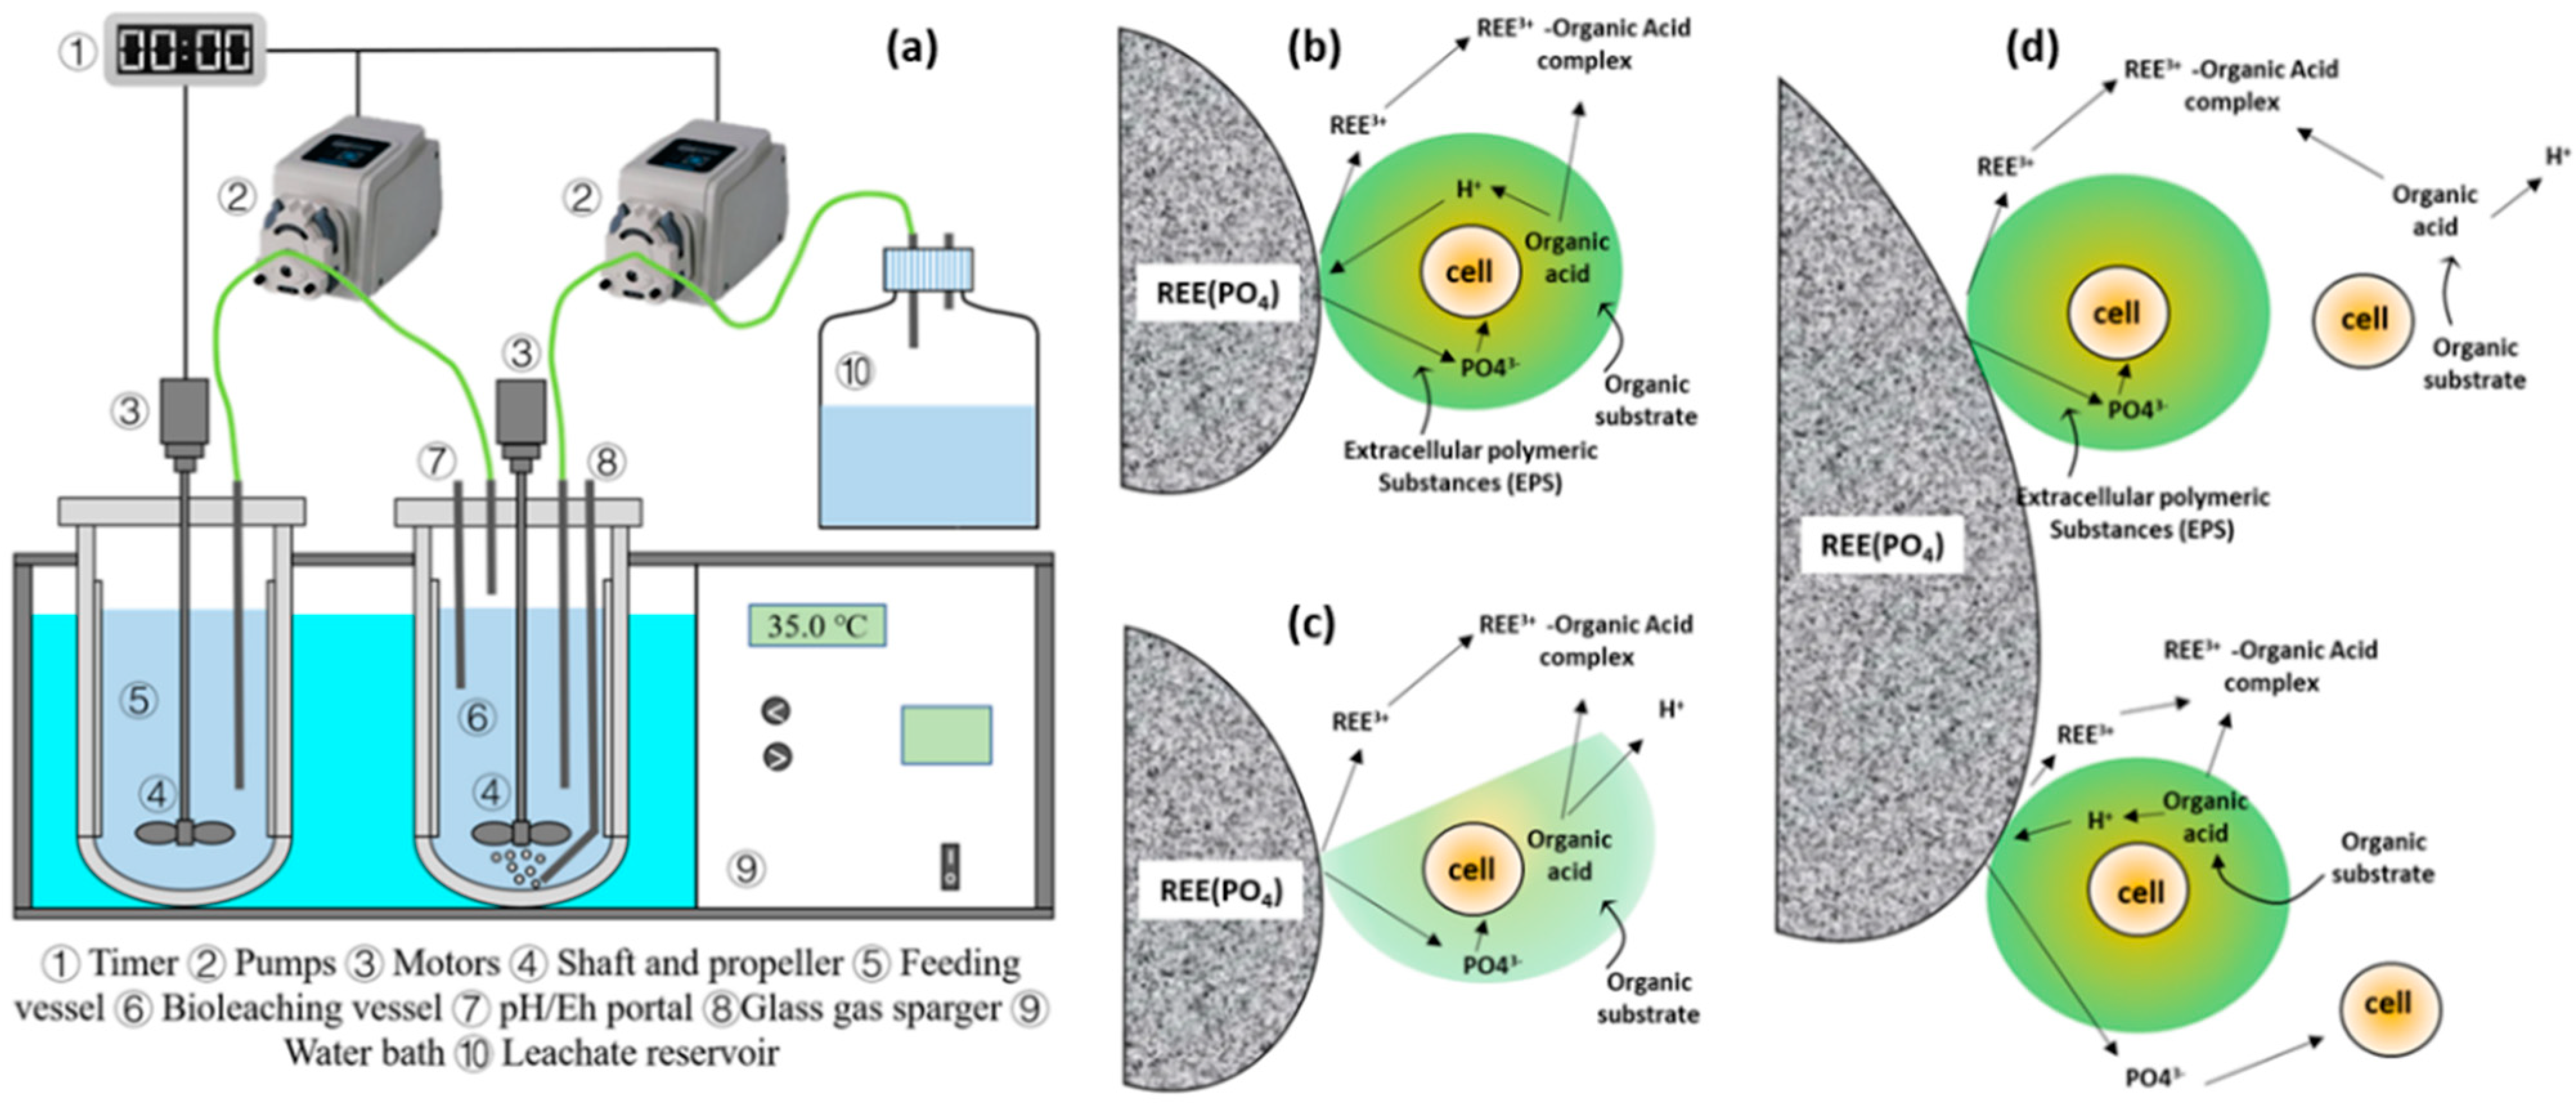
The bioreactor has been designed and used to cultivate the Acidothiobacillus ferrooxidans. The bacteria were used to consume sulfides, such as pyrite, and generate sulfuric acid and ferric sulfate which enable the REEs leaching process. A schematic diagram of this system is shown in Figure 1a. This system is designed to run automatically. The daily input of pure pyrite is 15 g and the residence time of solution in the bioreactor is 5 days, but it can be improved to 50 h if optimized conditions are provided. The daily input of pure pyrite and the residence time of the solution in the bioreactor was determined by the acid generation rate of the bioreactor, which relies on the population and activity of the bacteria in the bioreactor. The Fe2(SO4)3 concentration of the effluent solution is about 10 g/L; and the pH is about 1.3, which is a suitable pH value that is beneficial for both the microbial activity and a considerable acid generation rate.
A leaching test with a total mass of material of 4000 g was conducted with the bioleaching solution. This test was conducted to study the concentration of the leaching solution and the kinetics of the leaching process for rare earth elements from coal waste. The leaching tests were conducted using the typical Eh (~550 mV) and pH (~1.30) conditions of the bacteria cultivation solution. The other test parameters such as the liquid/solid ratio, temperature, and leaching time were determined by the authors based on the experience simply to test the possibility of REE leaching with the bioleaching solution and keep a suitable condition for the bacteria. In the leaching test, 1200 g of the coal waste under 10 US mesh was separated from the coal waste sample, while a total volume of 2800 mL of the leaching solution was prepared, which makes a 30% concentration of the solid in the solution. Then the coal waste solid and the leaching solution were mixed, and the mixed slurry was stirred with an overhead stirrer to keep a homogeneous composition of the slurry and increase the leaching rate. Hydrogen peroxide was added throughout the test to maintain the Eh > 550 mV, so as to keep an oxidizing environment of the solution. Diluted H2SO4 was added to keep the pH around 1.30 during the test to simulate a continuous leaching scenario. The leaching vessel was placed on a hot plate to keep the solution temperature ~35 °C. The leaching test was conducted for 72 h and followed by the precipitation test. Leaching solution samples were collected at 0 h, 1 h, 2 h, 4 h, 8 h, 24 h, 48 h, and 72 h, then concentration of REEs in these samples were determined with an inductively coupled plasma mass spectrometry (ICP-MS, Agilent 7900) (Agilent, Santa Clara, CA, USA). In later stages of the project, the team had conducted longer duration leaching tests, which resulted ~40–60% recovery of most REEs in four-month column leaching tests.
Earlier REE dissolution mechanisms have been proposed, among those, a mechanism described by Fathollahzadeh et al. [12] is shown in Figure 1b–d. In most cases for REE-phosphate type minerals, bacterial dissolution follows either (b) contact or (c) non-contact, or (d) cooperative mechanisms. Other mechanisms involving ferrous and ferric ions are described elsewhere [2,13]. In general, H+ is critical in dissolving some of the minerals or in exchanging with REE3+ associated with host minerals.
2.2. Visual Minteq Calculation for Speciation and Concentrations
In the final leaching solution, the main impurity is iron, which can be removed by selective precipitation. Therefore, it is important to determine the right pH for the step-wise precipitation with MgCO3, Na2CO3, or NaOH. The target is to remove iron and other unwanted ions without losing too much REEs [14]. Because of the important relationship between carbonate and pH and the potential interaction between carbonate and rare earth elements as pH increases, additional calculations were performed to determine the species present in solution as a function of pH.
2.3. Precipitation Modeling
To have a better understanding of the selective precipitation process of iron and rare earth elements, modeling of precipitation behavior of rare earth elements in solutions containing ferric sulfate from the biooxidation of pyrite was performed using Visual Minteq 3.1. To simulate the effect of pH on iron and rare earth element precipitation, the model used 10 g/L ferric sulfate heptahydrate, 50 ppm lanthanum, and 50 ppm dysprosium as inputs.
2.4. Precipitation Test Procedures
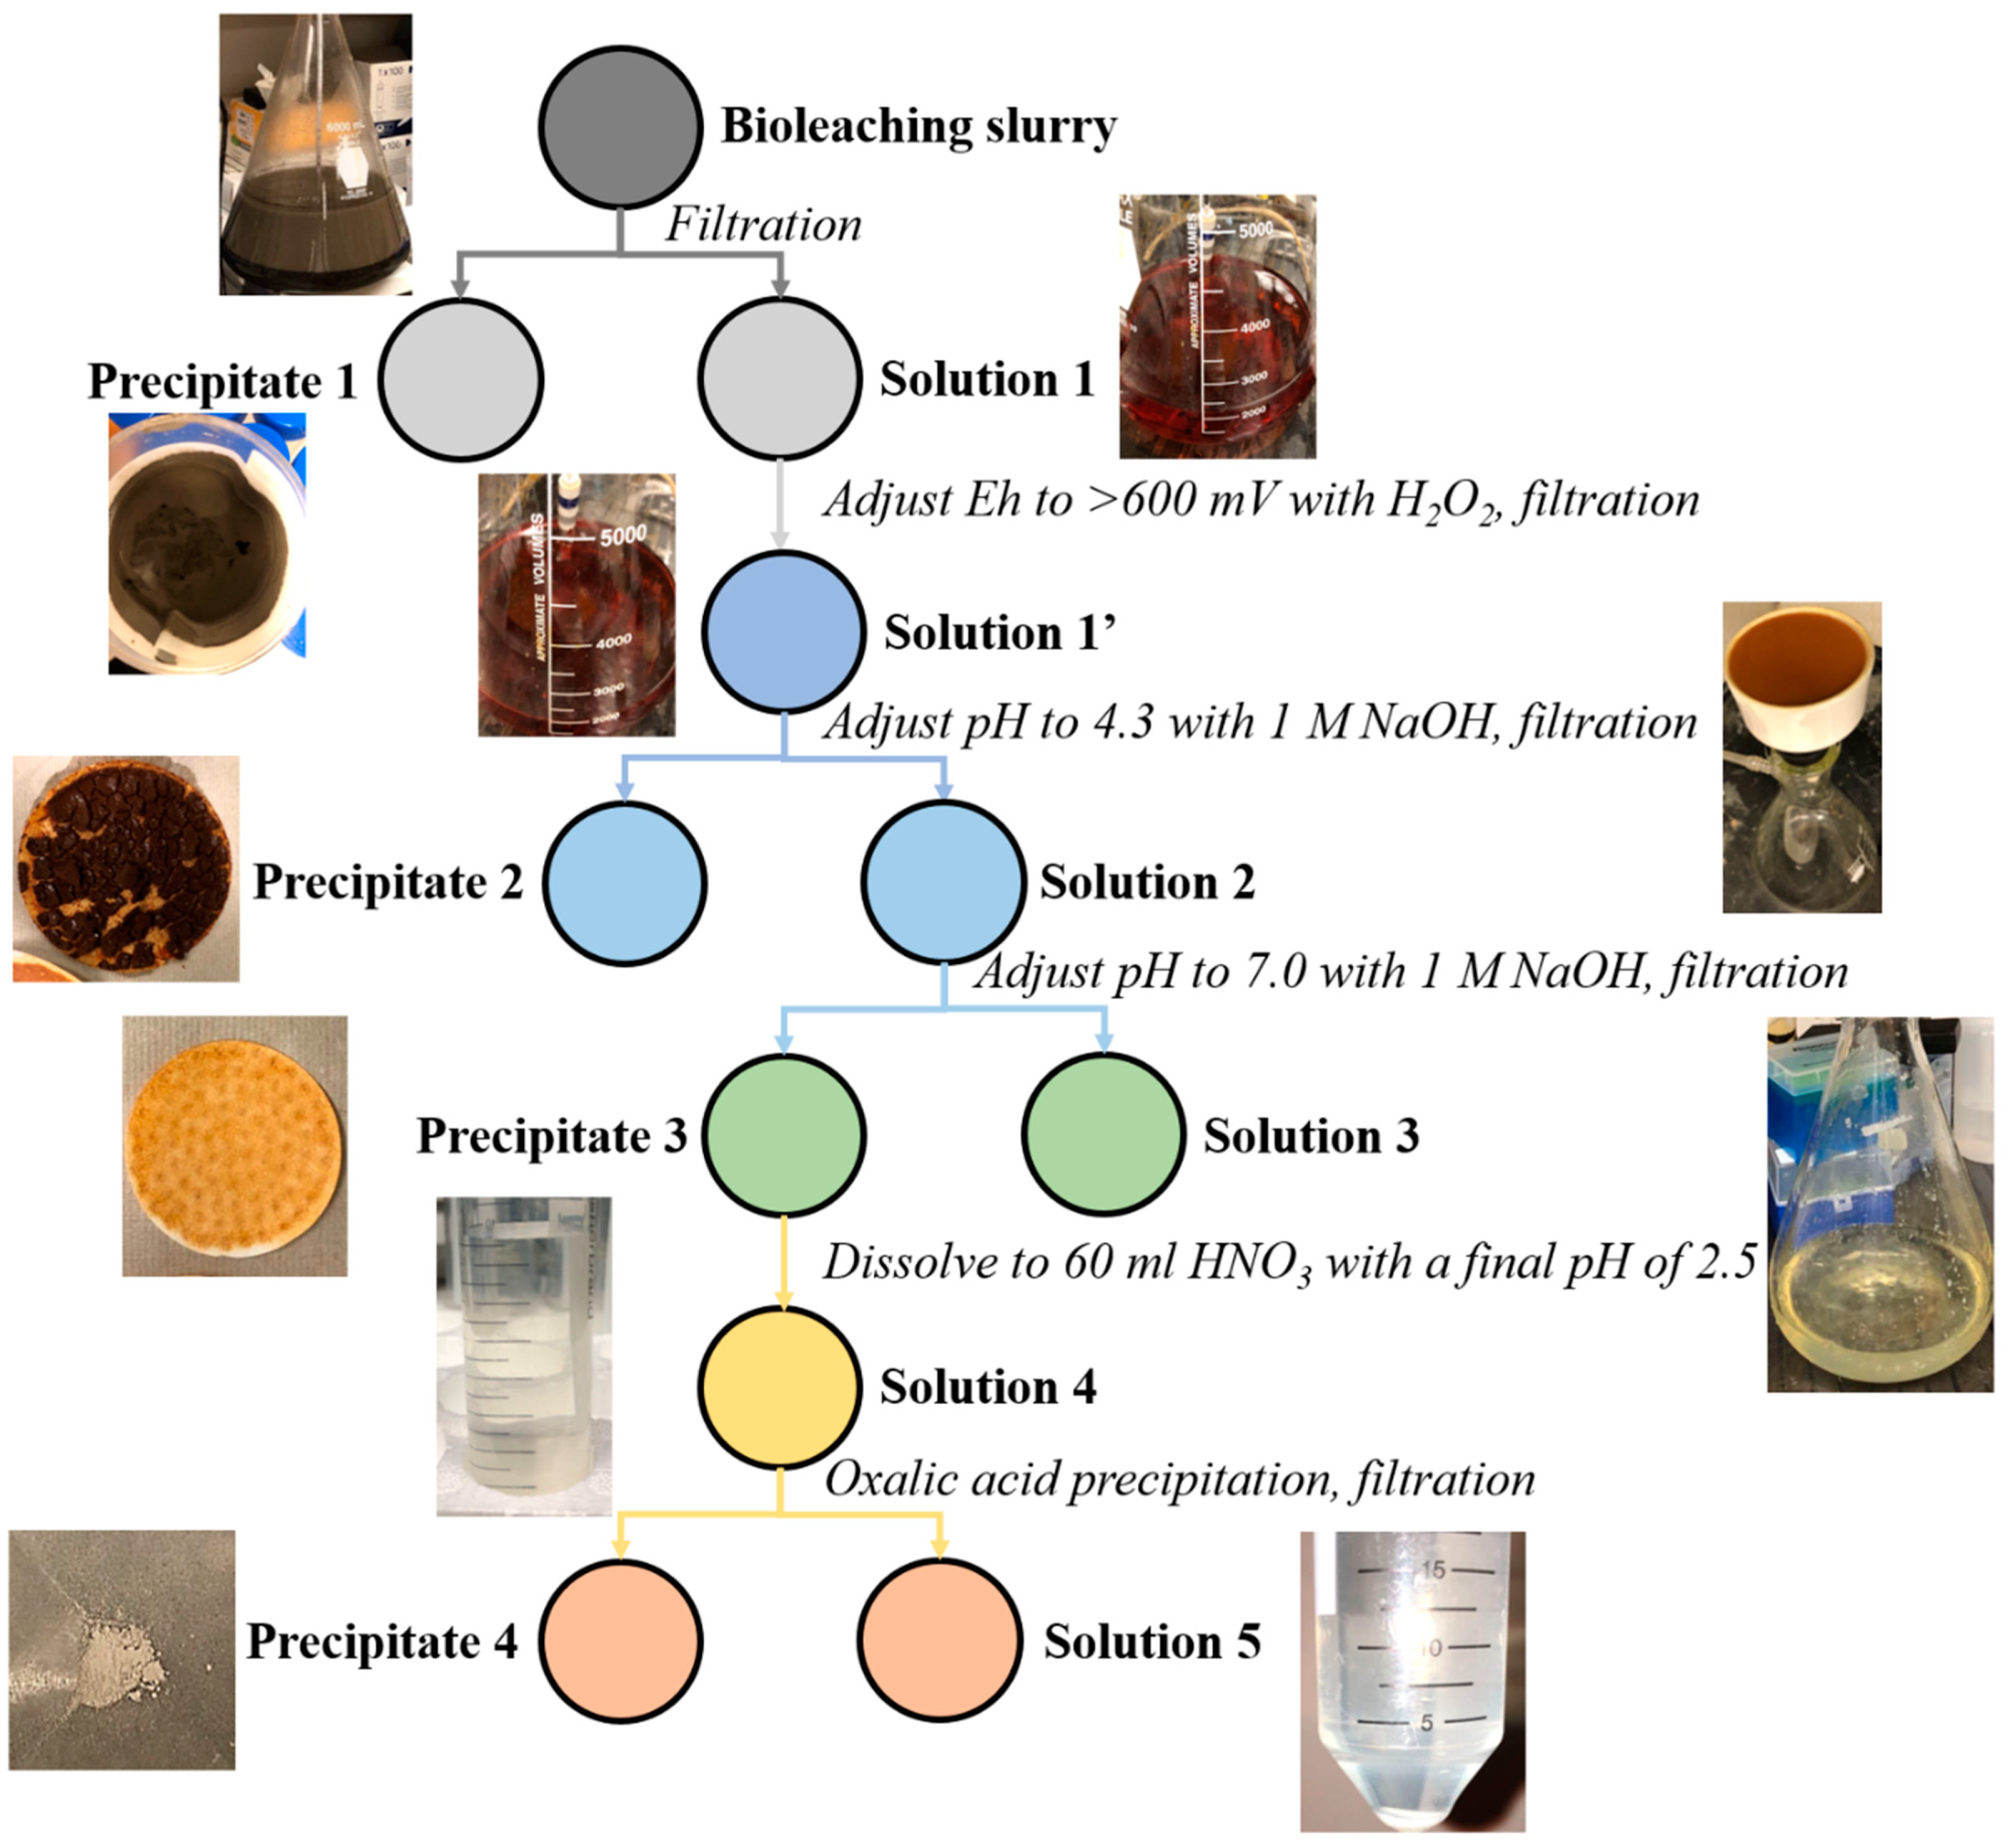
The slurry from the leaching test was filtered to remove the coal waste residue. Then the Eh of the solution was measured and adjusted to greater than 600 mV with H2O2 to oxidize Fe2+ to Fe3+ and facilitate the removal of iron. Following that, the pH of the solution was adjusted to 4.3 with 1M NaOH solution to remove the iron in the solution as most of the ferric iron will precipitate when the pH is greater than 4.3. Further, after filtration, the pH was adjusted to 7.0 with 1 M NaOH solution to collect the REE into the precipitate. The precipitate from this step was dried and re-dissolved into the HNO3 solution with a final pH of 2.5 because the REE precipitate from the last step tends to dissolve in HNO3 at lower pH. Oxalic acid is typically used in the precipitation separation process of REEs [15,16]. The final volume of solution for REE precipitate dissolution is 60 mL. 30 mL of this solution was taken for the oxalic acid precipitation test. This test was marked as B4 test. Finally, 10% oxalic acid solution was added to the REE bearing solution to generate the final REE oxalate. Samples were taken from each of the process solutions and diluted for rare earth element concentration analysis with the Agilent 7900 ICP-MS. The flow chart of the bioleaching and REE precipitation tests and pictures from the test are shown in Figure 2.
3. Results and Discussion
3.1. Leaching Kinetics and REE Concentrations
The REE concentrations in the coal waste material was determined by microwave digestion technique and ICP-MS analysis. The results are shown in Table 1.
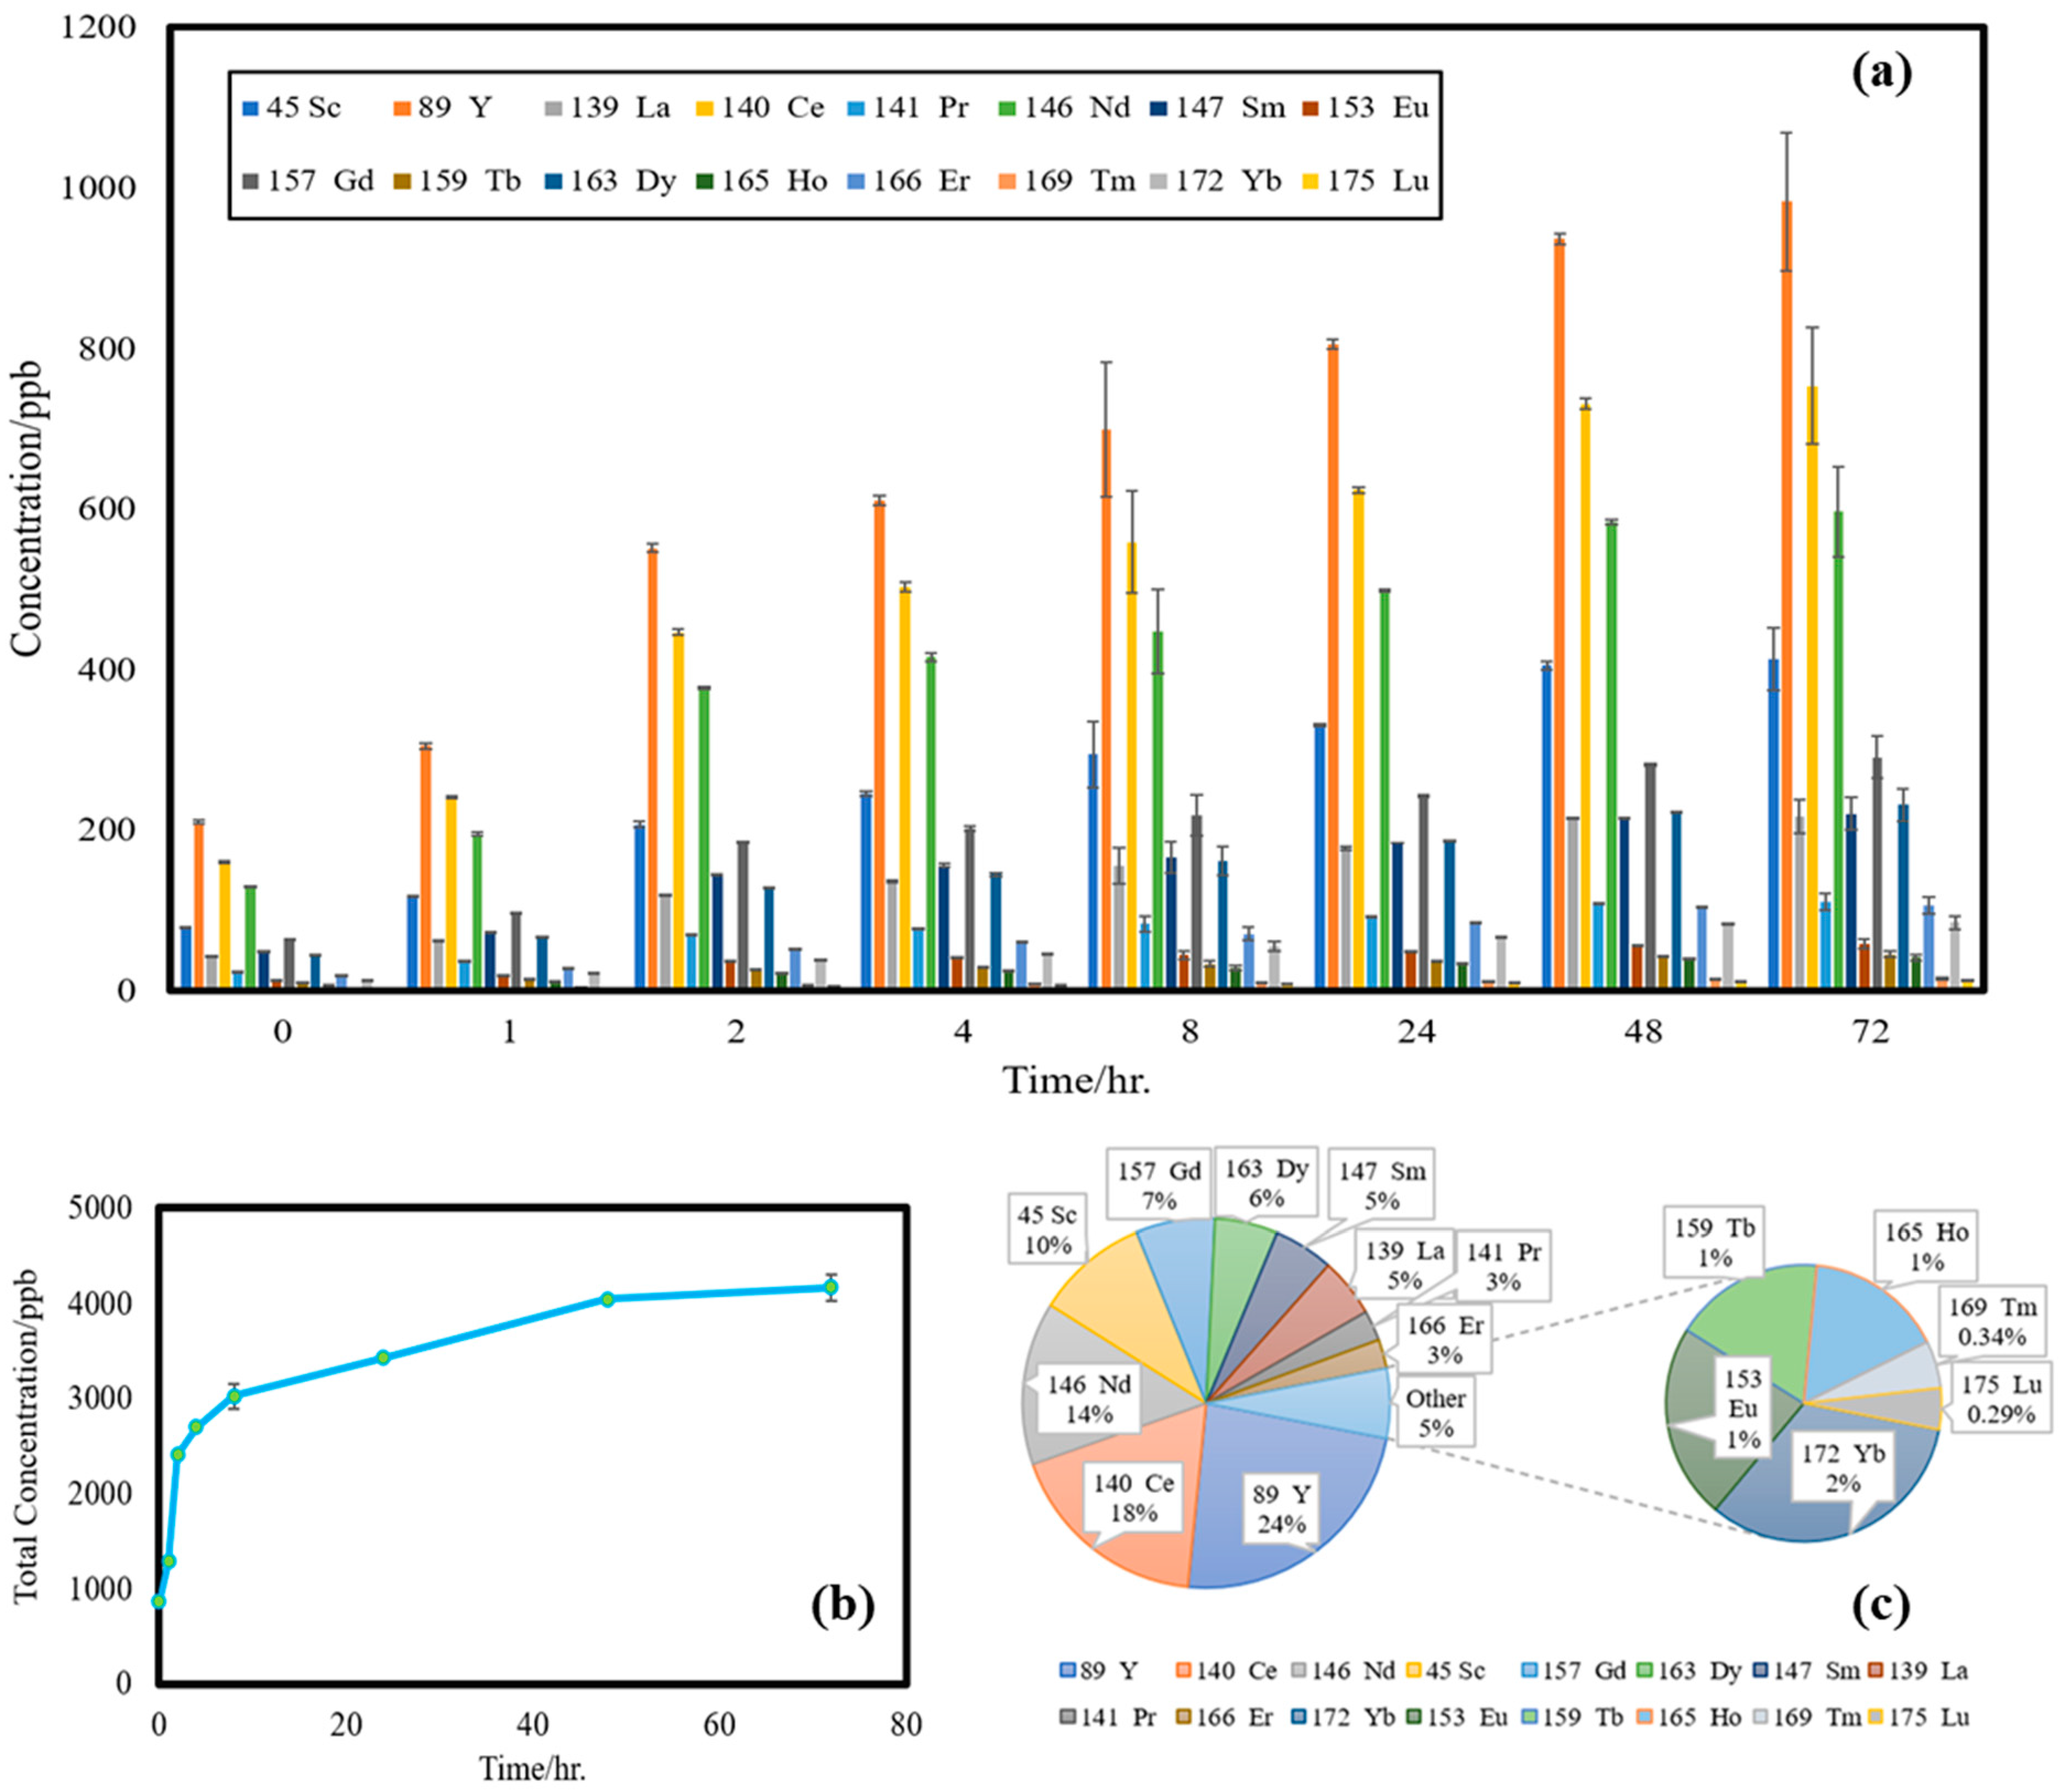
The concentrations of the REEs in the leaching solution after different leaching time in the B4 test are shown in Figure 3a. The concentrations of all the rare earth elements increase with the leaching time but may appear different leaching rates.
The total concentration of all the rare earth elements was calculated by summing up all the concentrations. The total concentration of the rare earth elements as a function of time is shown in Figure 3b. This curve is basically a kinetic curve of the leaching process, and it is similar to the typical leaching kinetics of the REE leaching test [17]. It shows that the rate of leaching is high in the first few hours of the test; after that, it becomes slower because of the kinetics of the process. During the third day of the leaching test, the concentration did not change very much, which means the leaching is almost finished in the first two days even with the large coal waste particles. The yields for most REEs are 13–14% for only 72 h of leaching.
As can be seen from Figure 3a,b, the concentrations of rare earth elements vary from each other because of their relative amount in the coal waste and their reaction to the leaching process. A pie chart of the relative percentages of the REE distribution in the final leaching solution is shown in Figure 3c. As can be seen, REEs with percentages higher than 5% are Y, Ce, Nd, Sc, Gd, and Dy, which accounts for 24%, 18%, 14%, 10%, 7%, and 6%, respectively. Among them, Y, Nd, and Dy are the in the critical groups of the REEs according to the market and industrial classification from an economic point of view [18].
3.2. Visual Minteq Calculation for Speciation and Concentrations
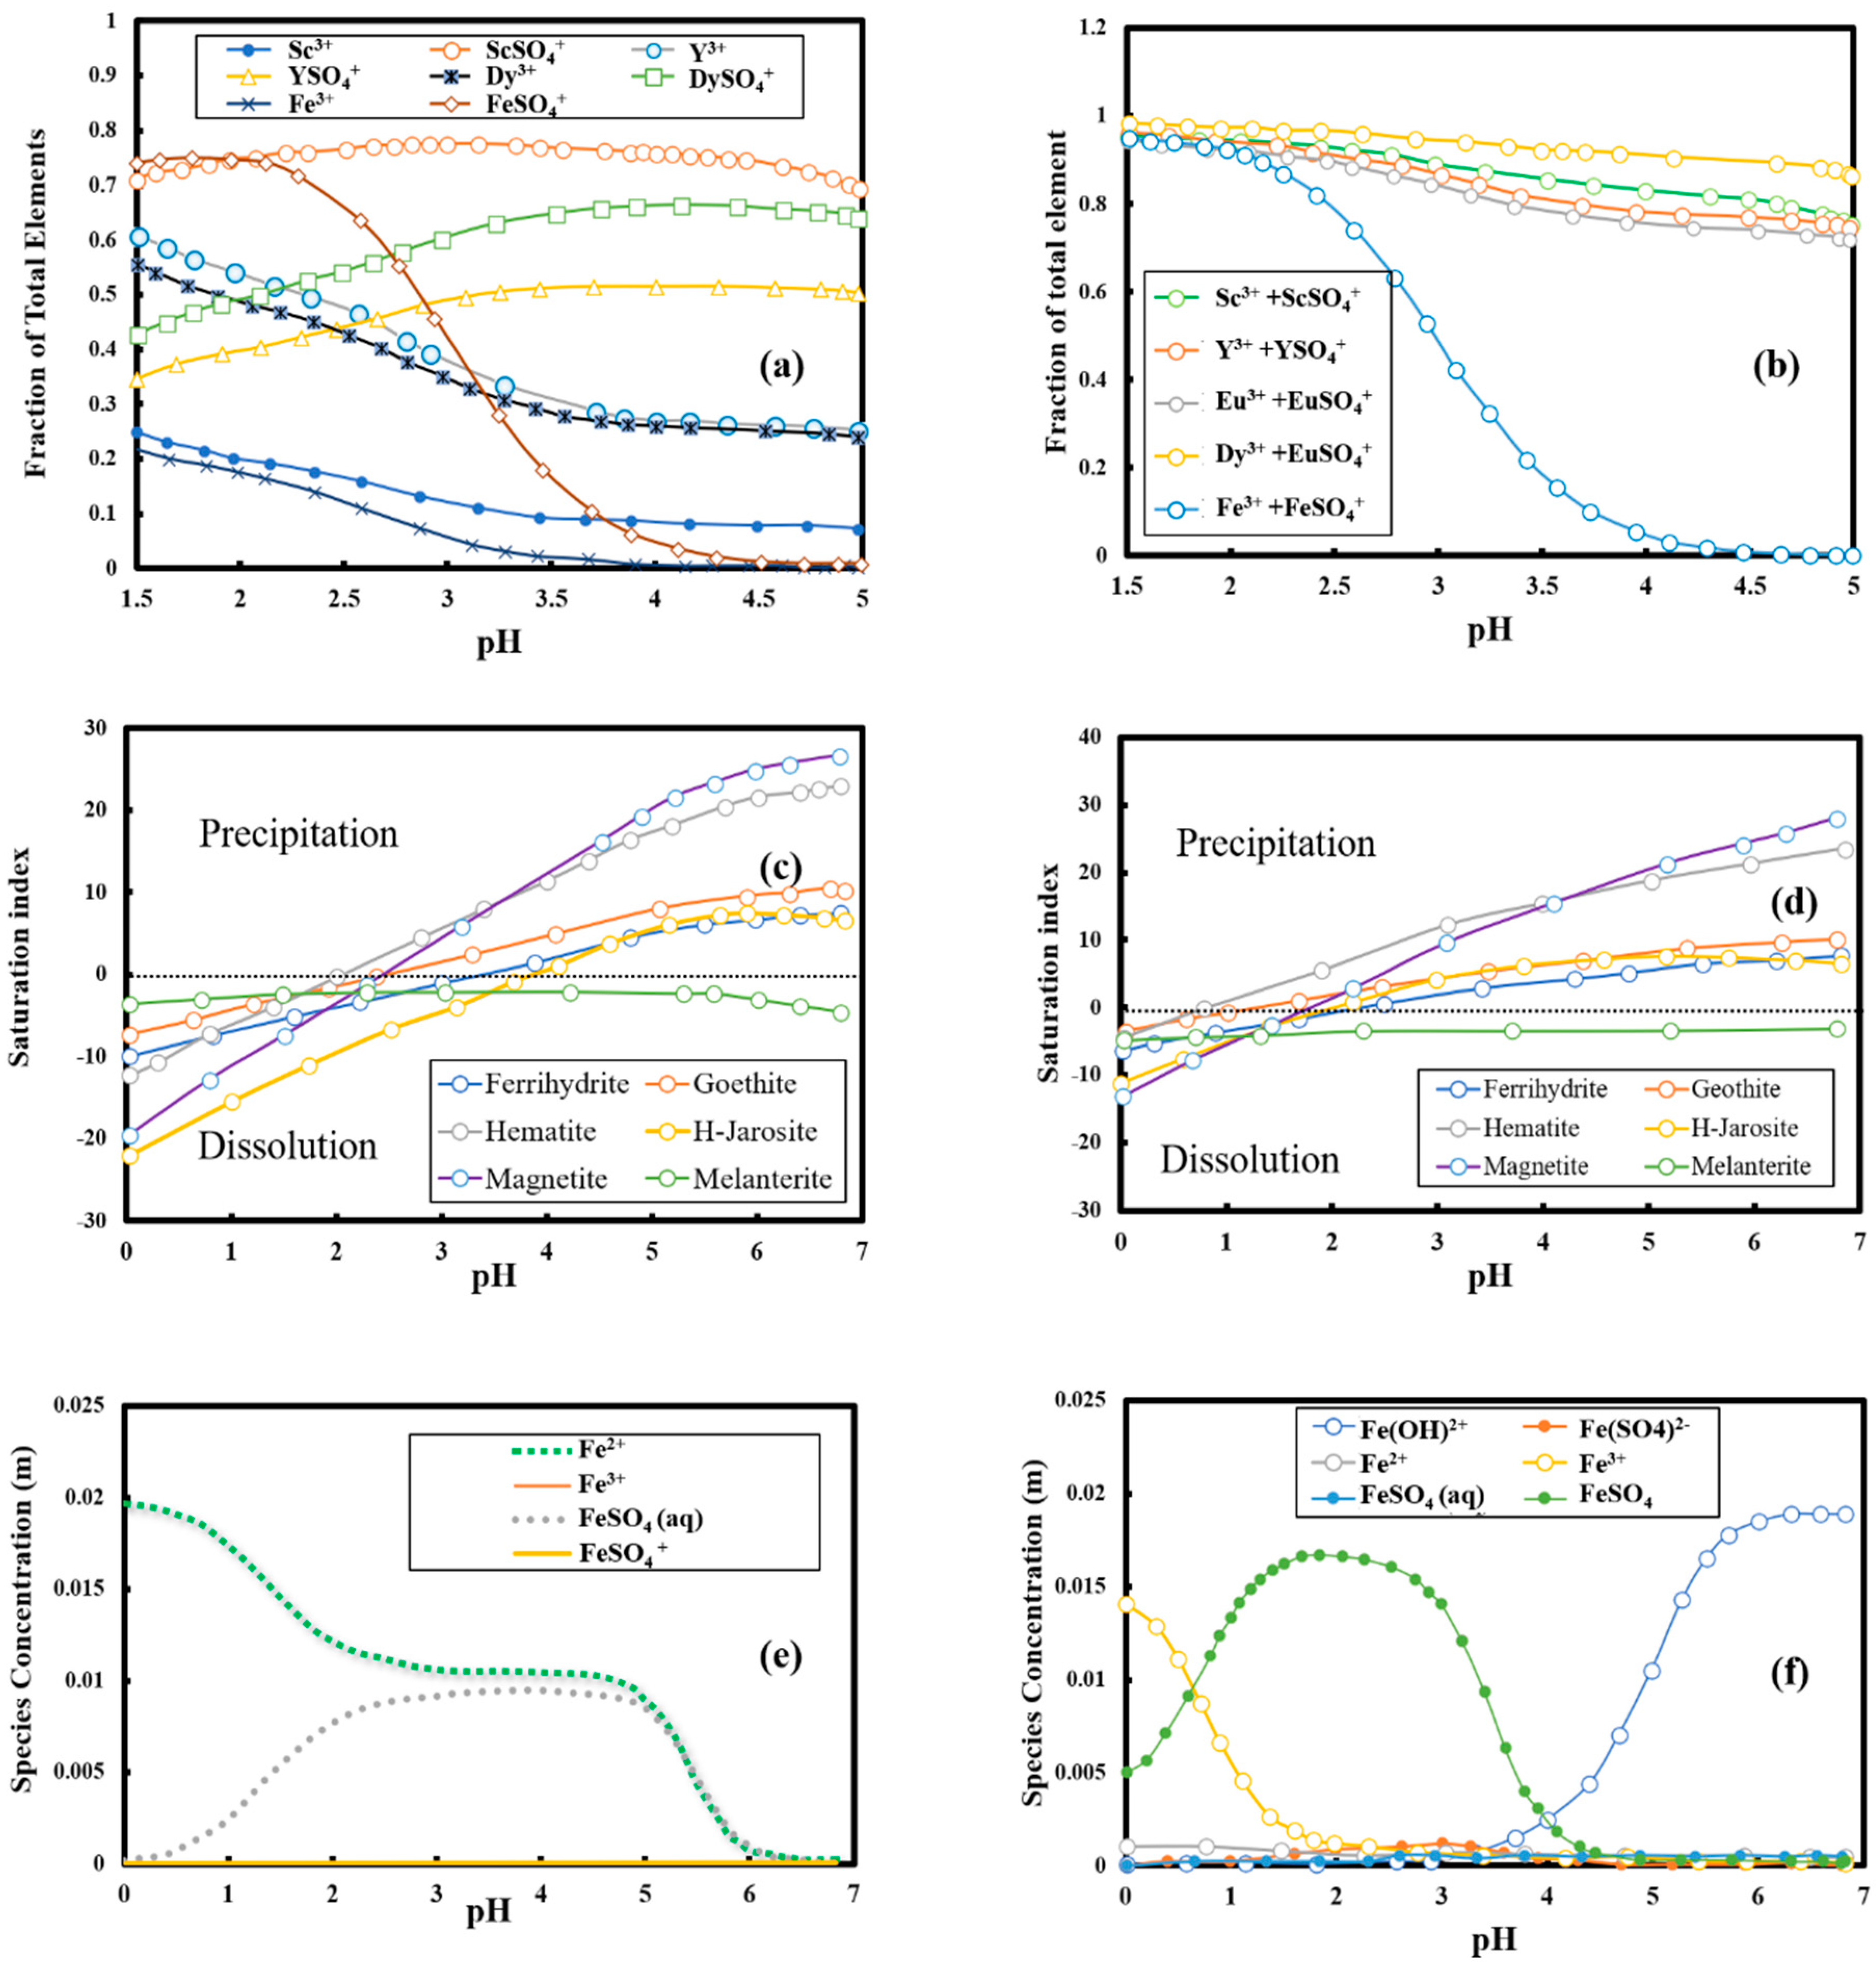
Visual Minteq calculations were performed to determine the species present in solution as a function of pH. Table S1 shows the species calculated for solutions containing the species observed in the leaching solutions based on Visual Minteq software calculations. The information in the table shows that the only relevant species for rare earth elements and iron in the acidic sulfate-based solutions used for leaching are the soluble sulfate complexes such as FeSO4+ DySO4+, etc. and the dissolved metal ions such as Fe3+, Dy3+, etc. Thus, a more in-depth precipitation analysis was performed that included only these species with varying concentrations of magnesium carbonate, which is used to adjust the pH and cause iron to precipitate. The results are presented in Figure 4a,b. The data in these figures shows that iron can be completely precipitated with magnesium carbonate with approximately a 15% loss in rare earth elements at pH of 4.5. However, in a real circuit it is desirable to recirculate much of the iron. Thus, at a realistic precipitation pH near pH 3, the losses are predicted to be less than 10%. Losses can be reduced further by reducing the pH, which will depend on the need for iron recirculation.
Calculations show that various precipitates begin to form in iron rich solutions above approximately pH 2 that are relevant to our leaching solutions. These precipitation events can help remove iron compounds including goethite, ferrihydrite, jarosite, hematite, and magnetite selectively [19,20]. Calculated saturation indexes for these compounds as a function of pH are shown in Figure 4c,d.
The data and calculation suggest that when there is an equivalent ratio of ferrous and ferric iron in solution, hematite starts to precipitate at around pH 2, while when the ratio of ferric to ferrous iron is increased to 94 percent ferric iron and 6 percent ferrous iron, the pH drops to about 1.8. Thus, these figures suggest that some iron precipitation is feasible at moderate pH and that the higher ratio of ferric to ferrous iron facilitates precipitation at lower pH levels.
The calculation of the soluble species for the same scenarios shown previously indicate a drop in solubility near a pH of 5.5 if the ratio of ferrous iron to ferric iron is 15.7:1 as shown in Figure 4e. However, if the ferrous iron to ferric iron is reversed to 1:15.7, the pH for reduced solubility is decreased to pH 4 as shown in Figure 4f.
3.3. Precipitation Modeling Results
At a pH of 0, the program measured the presence of several species at the concentrations shown in Table 2. Metal ions and metal sulfate ions (Fe3+, FeSO4+, Dy3+, DySO4+, La3+, LaSO4+) are the main soluble species with large concentration levels at pH 0, as shown in Table 2. As the pH grows, the decreasing concentration of H+ ions, makes sulfate more available to complex with the metal ions as indicated in Equation (3).
H+ + SO42− ↔ HSO4−
Calculations show that as H+ is removed, HSO4− dissociates into H+ and SO42−. The excess SO42− is then present to form soluble metal sulfate complexes as shown in Figure 5. As shown in Figure 5a, soluble ferric iron is generally removed from solution beginning at a pH of around 2.5 and finishing at a pH of around 4.3. However, few iron precipitates, such as jarosite and hematite, can precipitate between pH 1 and 2, as can be seen in Figure 5d by the saturation index, which implies that precipitation is thermodynamically favorable above a value of 0, despite the fact that in reality it is greater. Rare earth compounds remain soluble or do not begin to precipitate until a pH of around 8 is reached, as shown in Figure 5b,c. Figure 5e shows that if the ferrous ions are the dominant form of iron, it will remain as either soluble FeSO4 (aq) or Fe2+ until the pH reaches about 9. Therefore, if the ferrous iron is not oxidized to Fe3+ completely, it will precipitate with the rare earth elements. If the dissolved iron is oxidized to Fe3+, however, the vast differences in speciation and precipitation of iron and rare earth elements allow for easy removal of iron from solution by precipitation without significant losses of rare earth elements.
3.4. REE Precipitation Experimental Results
3.4.1. REE Concentration Analysis with ICP-MS
The REE concentrations of the process solutions during the precipitation tests for B4 test are shown in Figure 6. As it shows, similar precipitation behavior is shown for this test. However, because of the high REE concentration in the concentrated solution, a higher percentage of 63.68% of the REE went to the precipitate.
3.4.2. SEM and EDS Analysis
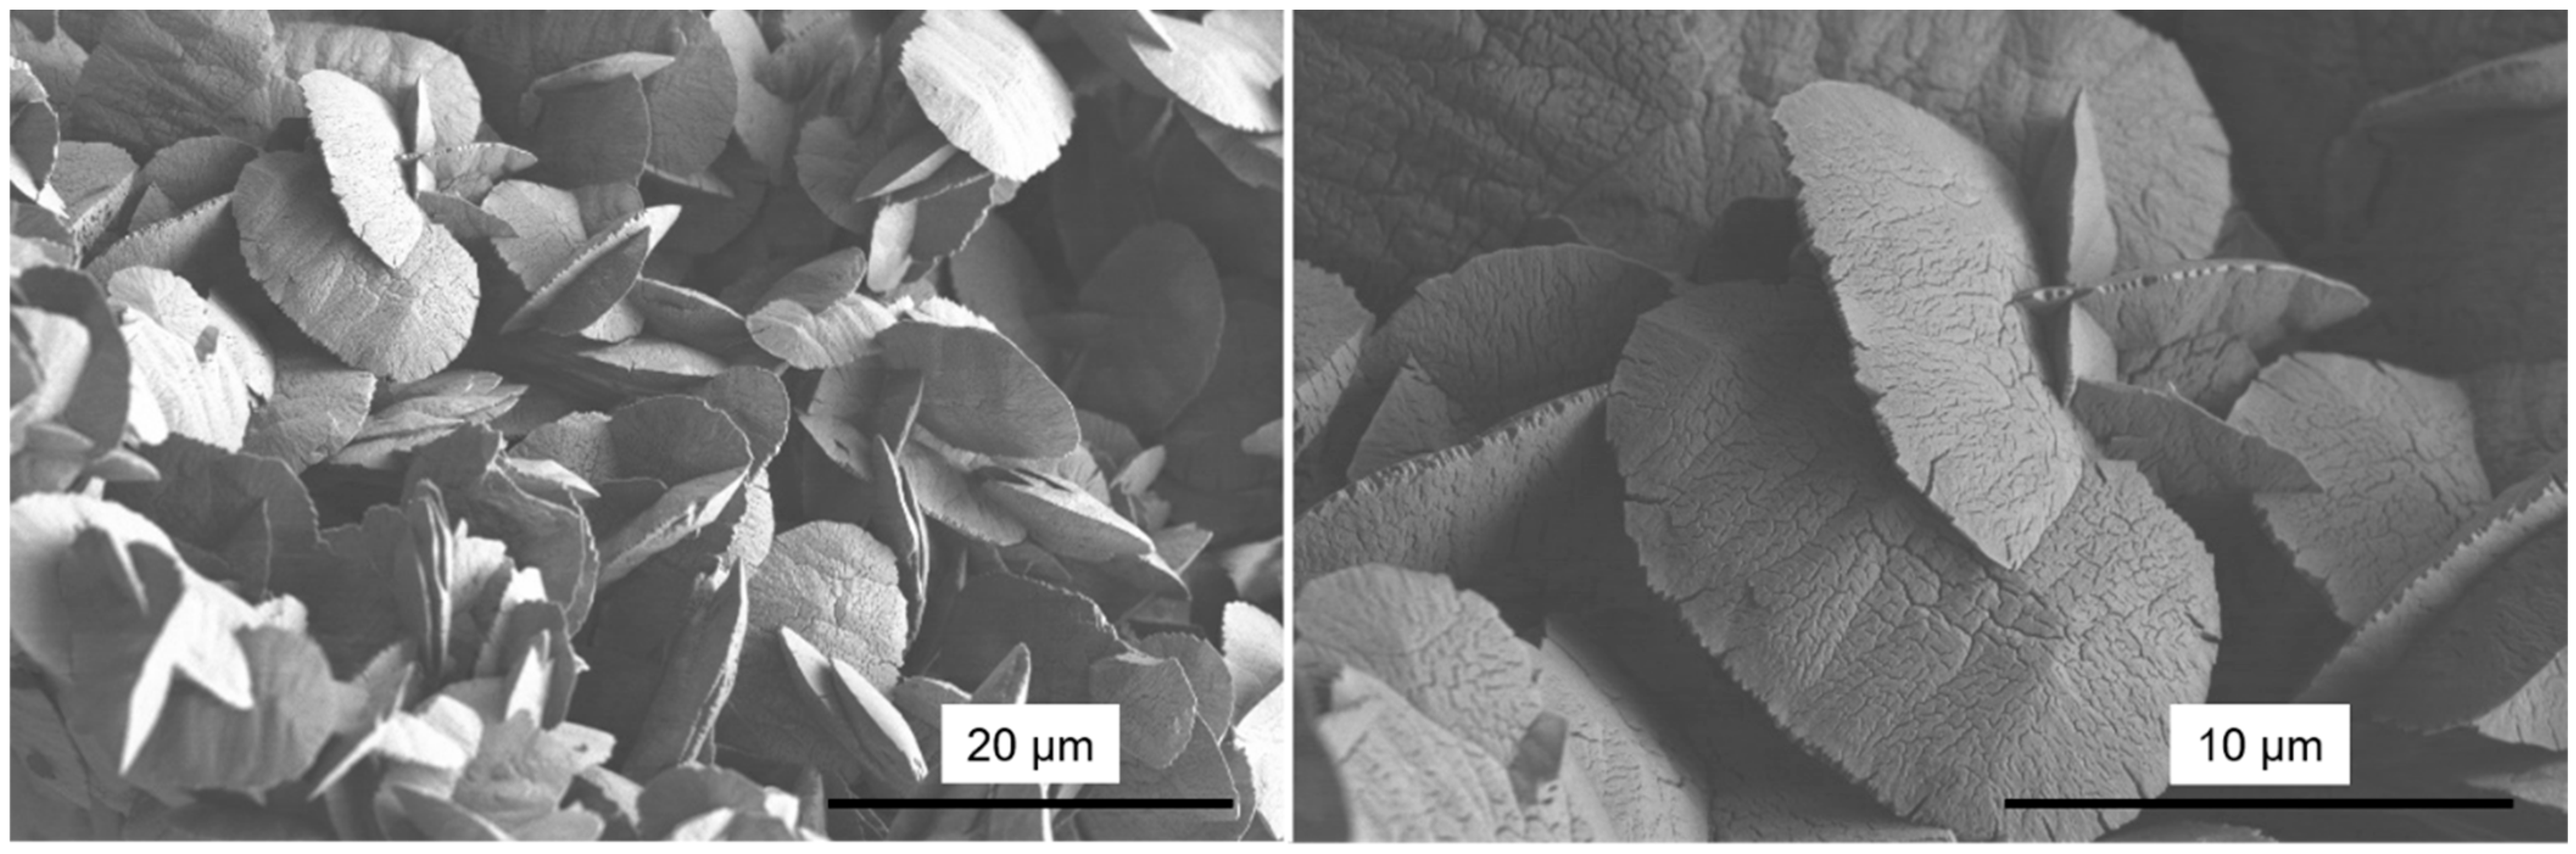
The precipitate from the oxalic acid precipitation test is shown in Figure 2 as precipitate 4. The precipitate is a white crystal. SEM (scanning electron microscopy) and EDS (energy dispersive X-ray spectroscopy) were conducted on the rare earth precipitate. The SEM images of the REE precipitate are shown in Figure 7. It shows the rare earth precipitate is composed of small flakes of the solid with a shape of a shell. The size is of the flake is quite uniform and is about 10–15 microns.
An EDS analysis has been done on one of the flakes in the precipitate, as shown in Figure 8. As can be seen, in the range of the flake, there is a very high concentration of O and C, which is consistent with the composition of the precipitate, REE oxalate (REE(C2O4)3). As indicated by the density of the dots in the EDS map, the concentration of Pm, Nd, Sm, La, Y, Pr, and Ce are high in the precipitate. As an impurity, there is a considerable amount of Zn in the precipitate.
3.4.3. REE Percentage in the Precipitate
The REE percentage in the precipitate is calculated based on the data acquired in the leaching and precipitation tests. For the 4 L leaching and precipitation test, the amount of the precipitate formed in the oxalic acid precipitation step is 4.3 mg. Based on the REE concentration change before and after adding oxalic acid and the volume of the solution, the amount of REE went to the precipitate as REE oxalate [1] is calculated with Equation (4).
The amount of REE oxalate calculated with this equation is 1.58 mg. Therefore, the percentage of REE oxalate in the precipitate is calculated with Equation (5).
Based on the data and the equation, the final REE oxalate salt percentage in the final product is 36.7%.
3.4.4. Precipitate Composition Analysis
To have a better understanding of the composition of the precipitate, more tests and analyses were carried out on the solutions before and after oxalic acid precipitation. The concentrations of the major elements were analyzed by a third-party analytical lab. These elements include: Y, La, Ce, Co, Li, Fe, Mg, Mn, Al, Si, Zn, Ca, S, K, Ni, U, and Na. Rare earth elements Y, La, and Ce were included in this list because they have relative high concentrations in the solution and the concentrations of Y, La, and Ce can be used to cross check the accuracy of the concentration of other rare earth elements not included in this test. The solution before oxalic acid precipitation (B4S4) was diluted by a factor of 50 because of its little volume saved for analysis. The solution after oxalic acid precipitation (B4S5) was diluted by a factor of five before sending for analysis.
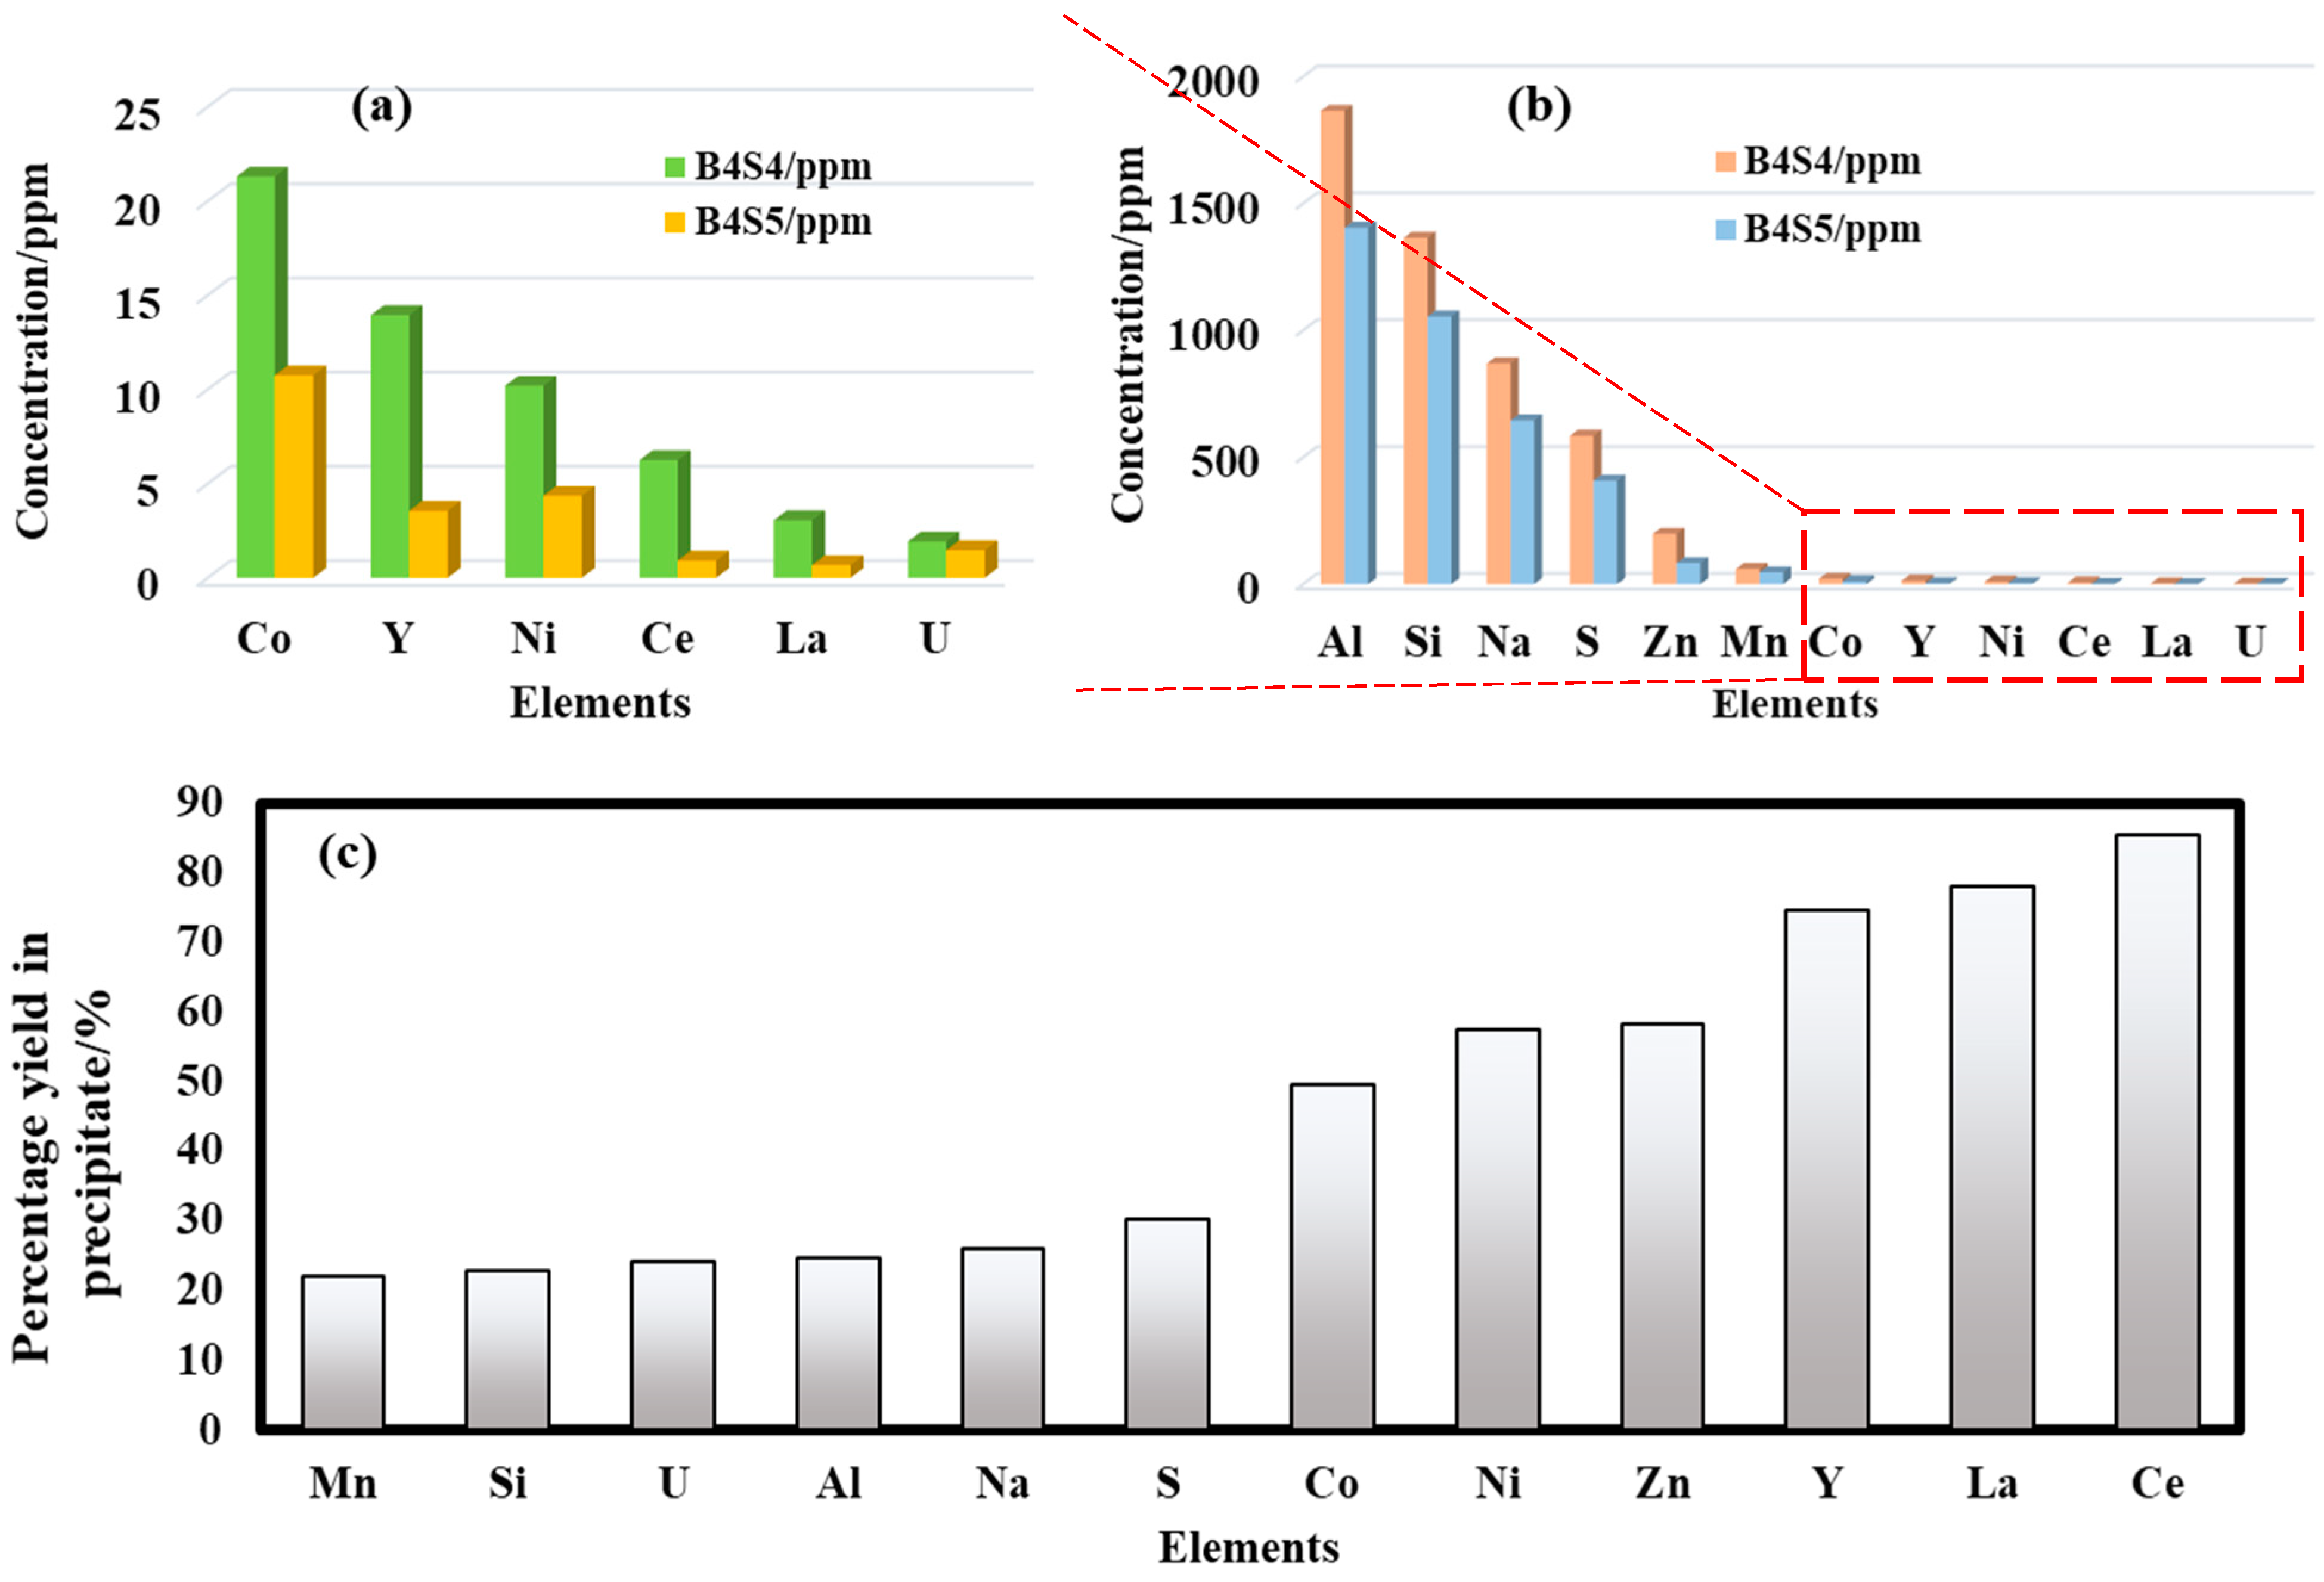
The measured concentrations of these elements are shown in Table 3. The concentrations of some elements were lower than the test limits, therefore they are reported in the form of <test limit*dilution factor. As can be seen from this table, Al, Si, Na, S, and Zn have relatively high concentrations in the solution before precipitate. The concentrations of Y, La, and Ce are very close to the concentrations reported in Figure 8, indicating the consistency of the results.
Based on Table 3, the concentrations of these elements before and after precipitation is shown in Figure 9a,b. As can be seen, the concentrations of all the elements show some decrease in the solution after oxalic acid precipitation. However, because of the difference in the oxalate salt solubilities of these elements, it is clear that for some elements, the percentage yield in the precipitate is a lot higher than other elements, especially for the rare elements. The percentage yield of these elements in the precipitate is shown in Figure 9c.
From Figure 9c, it is clear that for the rare elements Y, La, and Ce, the yield is as high as 75% to 85%, which indicates most of the rare elements have been precipitated into the precipitation phase. Other elements such as Zn, Ni, and Co have a medium percentage yield, however, Zn concentration in the initial solution is 10–20 times high than Ni and Co. Therefore, with similar yield rate, most of the impurities should be zinc oxalate given that zinc oxalate is highly insoluble in water. Moreover, this is consistent with the EDS mapping results. For elements Si, Al, and Na, the measured yield rate is similar and in the range of 20–25%. However, these elements have very high concentrations in the initial solution B4S4, even with the low yield rate, the theoretical amount of oxalate precipitate from these elements will exceed the actual amount of precipitate (4.3 mg) acquired in the precipitation test. The other fact is that the solubility of sodium oxalate in water is 3.7 g/100 mL (20 °C). Therefore, sodium oxalate should not form in the test. In this case, the loss of Na in the solution might come from the operation error such as dilution and the measurement error. Besides, no Na, Al, and Mn were detected in the EDS mapping.
Therefore, based on the above analysis and discussion, the most important impurity element in the final precipitate product is Zn. A small amount of Mn, Al, Si, Co, and Ni exist in the precipitate.
4. Conclusions
The extraction, recovery, and upgrading of the REEs from coal-based resources were achieved in this research with bioleaching and selective precipitation. Firstly, the bioleaching solution with pH of 1.3 and Fe concentration of ~10 g/L was produced with the oxidation of pyrite by microbial consortium that included Acidithiobacillus ferrooxidans as the only added microbe. Then a leaching test was conducted for 72 h on one coal waste sample with the bioleaching solution produced in the bioreactor. The kinetic curve of the leaching test shows that the reaction rate at the beginning of the test is rapid, but the rate declines significantly as the REEs in the coal waste has been leached into the bioleaching solution. The total concentration of REEs in the final leaching solution is about 4 ppm, among them, Y, Ce, Nd, Sc, Gd, and Dy have higher concentrations. Based on the results from the Visual Minteq calculations and modeling, a selective precipitation procedure was designed to remove the impurities and upgrade the REEs in the leaching solution. REE precipitate with purity of 36.7% was acquired from the selective precipitation test, indicating that REEs production from coal waste is feasible with the bioleaching and precipitation approach demonstrated in this research.
Supplementary Materials
The following are available online at https://www.mdpi.com/article/10.3390/min11050484/s1, Table S1: Comparison of Visual Minteq species calculations for leaching solutions with added magnesium carbonate for iron removal.
Author Contributions
Conceptualization, M.L.F. and P.K.S.; methodology, M.L.F. and Z.Z.; software, M.L.F. and Z.Z.; validation, P.K.S., Z.Z. and P.P.; formal analysis, M.L.F. and Z.Z.; investigation, Z.Z., L.A., and P.P.; resources, M.L.F.; data curation, Z.Z.; writing—original draft preparation, Z.Z.; writing—review and editing, M.L.F. and P.K.S.; supervision, M.L.F.; project administration, M.L.F.; funding acquisition, M.L.F. and P.K.S. All authors have read and agreed to the published version of the manuscript.
Funding
This research was funded by U.S. Department of Energy, grant number DE-FE0031526.
Data Availability Statement
Data sharing is not applicable to this article.
Acknowledgments
This research is supported by the U.S. Department of Energy, managed by the Office of Fossil Energy (Award number DE-FE0031526). This report was prepared as an account of work sponsored by an agency of the United States government. Neither the United States government nor any agency thereof, nor any of their employees, make any warranty, express or implied, or assumes any legal liability or responsibility for the accuracy, completeness, or usefulness of any information, apparatus, product, or process disclosed, or represents that its use would not infringe privately owned rights. Reference to any specific commercial product, process, or service by trade name, trademark, manufacturer, or otherwise does not necessarily constitute or imply its endorsement, recommendation, or favoring by the United States government or any agency there. The views and opinions of authors’ expressed herein do not necessarily state or knows of the United States government or any agency thereof.
Conflicts of Interest
The authors declare no conflict of interest.
References
- Sarswat, P.K.; Free, M.L. Frequency and atomic mass based selective electrochemical recovery of rare earth metals and isotopes. Electrochim. Acta 2016, 219, 435–446. [Google Scholar] [CrossRef]
- Sarswat, P.K.; Leake, M.; Allen, L.; Free, M.L.; Hu, X.; Kim, D.; Noble, A.; Luttrell, G.H. Efficient recovery of rare earth elements from coal based resources: A bioleaching approach. Mater. Today Chem. 2020, 16, 100246. [Google Scholar] [CrossRef]
- Kołodyńska, D.; Fila, D.; Gajda, B.; Gęga, J.; Hubicki, Z. Rare Earth Elements—Separation Methods Yesterday and Today. In Applications of Ion Exchange Materials in the Environment; Inamuddin, M., Ahamed, I., Asiri, M., Eds.; Springer International Publishing: Berlin, Germany, 2019; pp. 161–185. [Google Scholar]
- Park, S.; Liang, Y. Bioleaching of trace elements and rare earth elements from coal fly ash. Int. J. Coal Sci. Technol. 2019, 6, 74–83. [Google Scholar] [CrossRef] [Green Version]
- Panyushkina, A.; Matyushkina, D.; Pobeguts, O. Understanding Stress Response to High-Arsenic Gold-Bearing Sulfide Concentrate in Extremely Metal-Resistant Acidophile Sulfobacillus thermotolerans. Microorganisms 2020, 8, 1076. [Google Scholar] [CrossRef] [PubMed]
- Cárdenas, J.P.; Quatrini, R.; Holmes, D.S. Genomic and metagenomic challenges and opportunities for bioleaching: A mini-review. Res. Microbiol. 2016, 167, 529–538. [Google Scholar] [CrossRef] [PubMed] [Green Version]
- Quatrini, R.; Johnson, D. Acidophiles: Life in Extremely Acidic; Caister Academic Press: Haverhill, UK, 2016. [Google Scholar]
- Blight, K.; Ralph, D.; Thurgate, S. Pyrite surfaces after bio-leaching: A mechanism for bio-oxidation. Hydrometallurgy 2000, 58, 227–237. [Google Scholar] [CrossRef]
- Rawlings, D.; Tributsch, H.; Hansford, G.S. Reasons why ‘Leptospirillum’-like species rather than Thiobacillus ferrooxidans are the dominant iron-oxidizing bacteria in many commercial processes for the biooxidation of pyrite and related ores. Microbiology 1999, 145, 5–13. [Google Scholar] [CrossRef] [PubMed] [Green Version]
- Sapsford, D.J.; Bowell, R.; Geroni, J.N.; Penman, K.M.; Dey, M. Factors influencing the release rate of uranium, thorium, yttrium and rare earth elements from a low grade ore. Miner. Eng. 2012, 39, 165–172. [Google Scholar] [CrossRef]
- Rozelle, P.L.; Khadilkar, A.B.; Pulati, N.; Soundarrajan, N.; Klima, M.S.; Mosser, M.M.; Miller, C.E.; Pisupati, S.V. A study on removal of rare earth elements from US coal byproducts by ion exchange. Metall. Mater. Trans. 2016, 3, 6–17. [Google Scholar]
- Fathollahzadeh, H.; Eksteen, J.J.; Kaksonen, A.H.; Watkin, E.L.J. Role of microorganisms in bioleaching of rare earth elements from primary and secondary resources. Appl. Microbiol. Biotechnol. 2019, 103, 1043–1057. [Google Scholar] [CrossRef] [PubMed]
- Free, M.L. Hydrometallurgy: Fundamentals and Applications; Wiley: Hoboken, NJ, USA, 2013. [Google Scholar]
- Kim, E.; Osseo-Asare, K. Aqueous stability of thorium and rare earth metals in monazite hydrometallurgy: Eh–pH diagrams for the systems Th–, Ce–, La–, Nd–(PO4)–(SO4)–H2O at 25 C. Hydrometallurgy 2012, 113, 67–78. [Google Scholar] [CrossRef]
- Chi, R.; Xu, Z. A solution chemistry approach to the study of rare earth element precipitation by oxalic acid. Metall. Mater. Trans. B 1999, 30, 189–195. [Google Scholar] [CrossRef]
- Abreu, R.D.; Morais, C.A. Purification of rare earth elements from monazite sulphuric acid leach liquor and the production of high-purity ceric oxide. Miner. Eng. 2010, 23, 536–540. [Google Scholar] [CrossRef]
- Wang, J.; Huang, X.; Wang, L.; Wang, Q.; Yan, Y.; Zhao, N.; Cui, D.; Feng, Z. Kinetics study on the leaching of rare earth and aluminum from FCC catalyst waste slag using hydrochloric acid. Hydrometallurgy 2017, 171, 312–319. [Google Scholar] [CrossRef]
- Wang, K.; Adidharma, H.; Radosz, M.; Wan, P.; Xu, X.; Russell, C.K.; Tian, H.; Fan, M.; Yu, J. Recovery of rare earth elements with ionic liquids. Green Chem. 2017, 19, 4469–4493. [Google Scholar] [CrossRef]
- Liu, F.; Shi, J.; Duan, J.; Zhou, L.; Xu, J.; Hao, X.; Fan, W. Significance of jarosite dissolution from the biooxidized pyrite surface on further biooxidation of pyrite. Hydrometallurgy 2018, 176, 33–41. [Google Scholar] [CrossRef]
- Liu, J.; Xiu, X.; Cai, P. Study of formation of jarosite mediated by Thiobacillus ferrooxidans in 9K medium. Procedia Earth Planet. Sci. 2009, 1, 706–712. [Google Scholar] [CrossRef] [Green Version]
Figure 1.
(a) Schematic diagram of the bioreactor; (b–d) an alternative (nonpyrite based) organic acid derived dissolution mechanism described by Fathollahzadeh et al. [12] for a typical REE mineral in presence of bioleaching microorganisms.
Figure 1.
(a) Schematic diagram of the bioreactor; (b–d) an alternative (nonpyrite based) organic acid derived dissolution mechanism described by Fathollahzadeh et al. [12] for a typical REE mineral in presence of bioleaching microorganisms.

Figure 2.
The flow chart of the bioleaching and REE precipitation tests and pictures from the test.

Figure 3.
(a) Rare earth elements concentrations vs. leaching time of B4 test; (b) Total rare earth elements concentration vs. time in the leaching process of B4 test; (c) Percentage distribution of the REEs in the final leaching solution.
Figure 3.
(a) Rare earth elements concentrations vs. leaching time of B4 test; (b) Total rare earth elements concentration vs. time in the leaching process of B4 test; (c) Percentage distribution of the REEs in the final leaching solution.

Figure 4.
Visual Minteq calculation for speciation and concentrations: (a) speciation as a function of pH based on 20 g/L ferric sulfate heptahydrate with rare earth element concentrations of approximately 10 ppm, (b) soluble sum of sulfate and metal ion fractions as a function of pH based on 20 g/L ferric sulfate heptahydrate with rare earth element concentrations of approximately 10 ppm, (c) comparison of saturation index values, which indicate precipitate formation is feasible if above zero, as a function of pH for a solution containing 2 g/L of iron as iron sulfate (50% ferric iron and 50% ferrous iron), (d) comparison of saturation index values, which indicate precipitate formation is feasible if above zero, as a function of pH for a solution containing 2 g/L of iron as iron sulfate (94% ferric iron and 6% ferrous iron), (e) comparison of species solution concentrations as a function of pH for a solution containing 2 g/L of iron as iron sulfate (6% ferric iron and 94% ferrous iron), (f) comparison of species solution concentrations as a function of pH for a solution containing 2 g/L of iron as iron sulfate (94% ferric iron and 6% ferrous iron). (Visual Minteq 3.1 calculations).

Figure 5.
Comparison of Visual Minteq 3.1 calculated species concentrations as a function of pH for a system containing 10 g/L of ferric sulfate heptahydrate and 50 ppm of lanthanum and 50 ppm of dysprosium: (a) Fe3+ and FeSO4+, (b) Dy3+ and DySO4+, (c) Dy3+ and DySO4+, (d) hematite and jarosite saturation index, (e) Fe2+ and FeSO4 when 0.005 M Fe2+ presents.

Figure 6.
Rare earth element concentrations in the process solutions of B4 test.

Figure 7.
SEM images of the REE precipitate.

Figure 8.
EDS mapping images of the REE precipitate.

Figure 9.
The concentrations and percentage yields of the major elements before and after precipitation: (a) zoom-in plot for elements with low concentrations, (b) concentrations of all the measured elements, (c) the percentage yield of the major elements in the precipitate.
Figure 9.
The concentrations and percentage yields of the major elements before and after precipitation: (a) zoom-in plot for elements with low concentrations, (b) concentrations of all the measured elements, (c) the percentage yield of the major elements in the precipitate.


Table 1.
REE concentrations for coarse waste determined by ICP-MS (mg/kg).
| TREE | Sc | Y | La | Ce | Pr | Nd | Sm | Eu | Gd | Tb | Dy | Ho | Er | Tm | Yb | Lu |
|---|---|---|---|---|---|---|---|---|---|---|---|---|---|---|---|---|
| 199.79 | 14.18 | 16.37 | 36.27 | 69.12 | 8.29 | 33.38 | 6.43 | 1.26 | 5.18 | 0.76 | 4.06 | 0.74 | 1.86 | 0.25 | 1.44 | 0.20 |
Table 2.
Based on Visual Minteq 3.1 simulations, iron, lanthanum, and dysprosium were identified in 10 g/L ferric sulfate heptahydrate, 50 ppm lanthanum, and 50 ppm dysprosium at pH = 0 and an input of 10 g/L ferric sulfate heptahydrate, 50 ppm lanthanum, and 50 ppm dysprosium.
Table 2.
Based on Visual Minteq 3.1 simulations, iron, lanthanum, and dysprosium were identified in 10 g/L ferric sulfate heptahydrate, 50 ppm lanthanum, and 50 ppm dysprosium at pH = 0 and an input of 10 g/L ferric sulfate heptahydrate, 50 ppm lanthanum, and 50 ppm dysprosium.
| Species | Concentration (M) |
|---|---|
| Dy(SO4)2− | 1.95 × 10⁻⁷ |
| Dy3+ | 2.70 × 10⁻⁴ |
| DyOH2+ | 1.73 × 10⁻¹² |
| DySO4+ | 3.94 × 10⁻⁵ |
| Fe(OH)2+ | 4.43 × 10⁻⁹ |
| Fe(OH)3 (aq) | 1.55 × 10⁻¹⁸ |
| Fe(OH)4− | 4.79 × 10⁻²⁶ |
| Fe(SO4)2− | 6.35 × 10⁻⁵ |
| Fe+3 | 2.32 × 10⁻² |
| Fe2(OH)24+ | 3.81 × 10⁻⁷ |
| Fe3(OH)45+ | 3.43 × 10⁻¹² |
| FeOH2+ | 5.52 × 10⁻⁵ |
| FeSO4+ | 1.47 × 10⁻² |
| H+ | 1.32 |
| HSO4− | 4.11 × 10⁻² |
| La(SO4)2− | 7.09 × 10⁻⁷ |
| La3+ | 3.11 × 10⁻⁴ |
| LaOH2+ | 1.20 × 10⁻¹³ |
| LaSO4+ | 4.85 × 10⁻⁵ |
| OH− | 1.30 × 10⁻¹⁴ |
| SO42− | 9.57 × 10⁻⁴ |
Table 3.
Concentrations of the major elements in the solutions before (B4S4) and after (B4S5) oxalic acid precipitation.
Table 3.
Concentrations of the major elements in the solutions before (B4S4) and after (B4S5) oxalic acid precipitation.
| Elements | B4S4/ppm | B4S5/ppm |
|---|---|---|
| Al | 1865 | 1405 |
| Si | 1365 | 1055 |
| Na | 870 | 645 |
| S | 585 | 408 |
| Zn | 198.5 | 83 |
| Mn | 60 | 46.85 |
| Co | 21.3 | 10.75 |
| Y | 13.95 | 3.555 |
| Ni | 10.2 | 4.355 |
| Ce | 6.25 | 0.915 |
| La | 3.055 | 0.675 |
| U | 1.93 | 1.465 |
| Ca | <250 | 112 |
| Fe | <25 | 14 |
| Li | <25 | <2.5 |
| Mg | <250 | 49.6 |
| K | <250 | <25 |
Publisher’s Note: MDPI stays neutral with regard to jurisdictional claims in published maps and institutional affiliations. |
© 2021 by the authors. Licensee MDPI, Basel, Switzerland. This article is an open access article distributed under the terms and conditions of the Creative Commons Attribution (CC BY) license (https://creativecommons.org/licenses/by/4.0/).
Share and Cite
MDPI and ACS Style
Zhang, Z.; Allen, L.; Podder, P.; Free, M.L.; Sarswat, P.K. Recovery and Enhanced Upgrading of Rare Earth Elements from Coal-Based Resources: Bioleaching and Precipitation. Minerals 2021, 11, 484. https://doi.org/10.3390/min11050484
AMA Style
Zhang Z, Allen L, Podder P, Free ML, Sarswat PK. Recovery and Enhanced Upgrading of Rare Earth Elements from Coal-Based Resources: Bioleaching and Precipitation. Minerals. 2021; 11(5):484. https://doi.org/10.3390/min11050484
Chicago/Turabian StyleZhang, Zongliang, Landon Allen, Prasenjit Podder, Michael L. Free, and Prashant K. Sarswat. 2021. "Recovery and Enhanced Upgrading of Rare Earth Elements from Coal-Based Resources: Bioleaching and Precipitation" Minerals 11, no. 5: 484. https://doi.org/10.3390/min11050484
Note that from the first issue of 2016, this journal uses article numbers instead of page numbers. See further details here.