
Intuitionistic Fuzzy TOPSIS as a Method for Assessing Socioeconomic Phenomena on the Basis of Survey Data


1
Faculty of Economics and Finance, University of Bialystok, 15-062 Białystok, Poland
2
Department of Quality and Environmental Management, Wroclaw University of Economics and Business, 53-345 Wrocław, Poland
3
Department of Econometrics and Computer Science, Wroclaw University of Economics and Business, 53-345 Wrocław, Poland
*
Author to whom correspondence should be addressed.
Entropy 2021, 23(5), 563; https://doi.org/10.3390/e23050563
Submission received: 25 March 2021
/
Revised: 22 April 2021
/
Accepted: 28 April 2021
/
Published: 1 May 2021
(This article belongs to the Special Issue Entropy Method for Decision Making)
Abstract
:In the assessment of most complex socioeconomic phenomena with the use of multicriteria methods, continuous data are used, the source of which are most often public statistics. However, there are complex phenomena such as quality of life and quality of services in the assessment, for which questionnaire surveys and ordinal measurement scales are used. In this case, the use of classic multicriteria methods is very difficult, taking into account the way of presenting this type of data by official statistics, as well as their permissible transformations and arithmetic operations. Therefore, the main purpose of this study was the presentation of a novel framework which can be applied for assessing socioeconomic phenomena on the basis of survey data. It was assumed that the object assessments may contain positive or negative opinions and an element of uncertainty expressed in the form a “no”, “difficult to say”, or “no opinion” answers. For this reason, the intuitionistic fuzzy TOPSIS (IF-TOPSIS) method is proposed. To demonstrate the potential of this solution, the results of measuring the subjective quality of life of the inhabitants of 83 cities in EU countries, EFTA countries, the UK, the Western Balkans, and Turkey are presented. For most cities, a high level of subjective quality of life was observed using the proposed approach. The highest level of quality of life was observed in Zurich, whereas the lowest was observed in Palermo.
1. Introduction
Multicriteria decision making (MCDM) offers several techniques which are used in comparative analyses of complex socioeconomic phenomena [1,2]. The analysis concerns objects such as countries, regions, and cities which are characterized by a set of socioeconomic indicators. We can distinguish three main approaches used in multicriteria methods: utility function, outranking relation, and sets of decision rules [3]. To handle the problems of analyzing complex socioeconomic phenomena, the most useful methods are those based on a utility function, which allows aggregating information about objects into a unique parameter. These methods allow ranking objects and classifying them according to the values of aggregated measure.
The most popular methods based on the synthesizing criterion are SAW (simple additive weighting) [4], TOPSIS (technique for order of preference by similarity to ideal solution) [5], AHP (analytic hierarchy process) [6], and VIKOR (visekriterijumska optimizacija i kompromisno resenje) [7]. Choosing among these methods depends on the problem under consideration and the available data.
One of the most frequently used methods in practice because of its simplicity and rationality is TOPSIS, developed by Hwang and Yoon in 1981 [5]. The advantages and the usefulness of the TOPSIS in comparative analyses stem from the fact that the objects are compared to so-called reference points. In the classic variant of TOPSIS, the coordinates of the reference objects are based on the maximum and minimum values. In some studies, however, objects were compared to a specific object selected as a benchmark or to desired target values [8]. Examples include indicators for SDG, where a different target value is specified for each country.
The spectrum of socioeconomic analyses to which the TOPSIS method is applied is very wide. Studies using the TOPSIS method have investigated human capital [9], the macroeconomic situation [10], international trade performance [11], smart development [12], innovation [13], energy performance [14], sustainable development [8,15,16,17,18], economic development [19], social development [20], healthcare [21], and eGovernment development [22], among others. The authors used different variants or hybrids of TOPSIS methods, and their analyses were based on different sources of data.
Balcerzak and Pietrzak [9] assessed changes in the quality of human capital in EU countries. Stankovic et al. [12] prepared a ranking of central and eastern European cities, based on various elements of their smart performance, by combining the AHP (analytic hierarchy process) for determining the relative importance of criteria and the TOPSIS method of ranking. Piwowarski et al. [15] assessed EU countries in terms of sustainable development using the VIKOR and TOPSIS methods. Roszkowska and Filipowicz-Chomko [8] measured sustainable development in the area of education in EU countries using an extended TOPSIS procedure, which took into account EU targets and/or national targets in building a positive ideal solution and a negative ideal solution. Sielska [21] conducted a comparative analysis of the level of healthcare in European Union countries. Vavrek and Chovancová [14] analyzed the energy performance of EU member states concerning the priorities of the European Energy Union. The common feature of the above-presented surveys is that they were conducted using Eurostat databases.
In addition to Eurostat, there are other popular sources of data used in the analysis of socioeconomic phenomena for countries. Kaynak et al. [13] compared the innovation performance of EU candidate countries using an entropy-based TOPSIS. In the comparative analysis, they used information from the following reports: Global Competitiveness Index, Innovation Union Scoreboard, Knowledge Assessment Methodology (KAM), and Global Innovation Index. Eyüboğlu [10] determined the macroeconomic performance of developing countries using data such as economic growth, inflation rate, unemployment rate, and the current account balance/GDP published by the OECD and the IMF. The TOPSIS method was used for the ranking of performance, whereas AHP was used for the determination of criteria weights. Karabiyik and Kutlu [11] assessed the international trade performance of OECD countries on the basis of data from the World Trade Organization Statistics Database. Vavrek and Ardielli [22] evaluated eGovernment development in EU member states using data from the European Commission, Eurostat, and the United Nations.
Other popular sources of data in socioeconomic research are national or regional statistical yearbooks. Sustainable urban development in China was analyzed by applying the modified TOPSIS method and using different source data from the Regional Statistical Yearbook. Ding et al. [23] provided a comprehensive evaluation of urban sustainable development in China using the TOPSIS-entropy method. The data used in this study came from Chinese social and economic statistical yearbook databases, including the China Urban Construction Statistical Yearbook, China City Statistical Yearbook, and China Statistical Yearbook for Regional Economy. Li et al. [16] assessed the sustainability of cities in northeastern China using dynamic TOPSIS-entropy methods. The research data were extracted from the Liaoning Provincial Statistical Yearbook, Jilin Provincial Statistical Yearbook, Heilongjiang Provincial Statistical Yearbook, and China City Statistical Yearbook. Tang et al. [17] assessed the urban sustainability of selected cities in China using a modified TOPSIS based on gray relational analysis and data from the China City Statistical Yearbook, the Anhui Statistical Yearbook, and the Statistical Yearbooks of the cities. Łuczak and Just [19] explored two types of TOPSIS (classical and positional) for the assessment of economic development of units at different government levels. The study was based on data from the Central Statistical Office of Poland. Stecyk et al. [18] used the AHP/TOPSIS model in the analysis of the level of sustainable development regions in the West Pomeranian Province in 2010 and 2017 in Poland using data from the Statistical Office in West Pomeranian Province. Roszkowska and Filipowicz-Chomko [20] applied TOPSIS with a common development factor for the analysis of regional differentiation in the social development of Polish voivodeships in the context of sustainable development. The study used the data from the Central Statistical Office of Poland. Perło and Roszkowska [24] applied soft modeling and the TOPSIS method for the analysis of the competitiveness of companies in urban functional areas in Poland using data from the Central Statistical Office of Poland and the Customs Office.
The vast majority of the studies mentioned were based on criteria whose values were expressed on an interval and/or ratio scale. However, among complex socioeconomic phenomena, there are also those based on public opinion. Such phenomena include, for example, subjective quality of life, quality of public services, and air quality. Data for this type of analysis are collected, for example, by the European Commission within the framework of the international Eurobarometer public opinion survey project. Another source of data based on public opinion is one of the largest European research projects, the European Sociological Survey. As part of the research projects mentioned, the values of criteria are most often measured using ordinal scales (e.g., Likert scales). Measurement results are presented as percentages of responses to particular categories of ordinal measurement scales, and researchers often do not have access to raw data. Therefore, the comparability of the assessments of criteria is much more difficult. In such a case, multicriteria assessment using the TOPSIS method would require the multiplication of percentages of responses in particular categories by numerical signs assigned to categories of ordinal measurement scales. Such a procedure would make it possible to obtain average assessments of criteria for objects and use the classic TOPSIS method. In the literature, we found very limited propositions for how to deal with ordinal scales in survey data. Such a procedure based on the Hellwig approach was proposed by Jefmański [25].
Motivated by the presented studies, this article proposes a new approach based on the fuzzy intuitionistic TOPSIS method to deal with the problem of aggregating respondents’ opinions presented by official statistics. The contributions of the paper are as follows: firstly, we described the problem of analyzing survey data and building synthetic measures where data are represented on an ordinal scale. Then, the IF-TOPSIS based model for the evaluation of questionnaires was proposed. The novel IF-TOPSIS method has several advantages: (1) it does not require overstating the level of measurement or subjective fuzzy number parameters to be set; (2) the method allows taking into consideration not only positive and negative opinions about the objects in the questionnaires, but also “I do not know” or “no opinion” answers, i.e., hesitancy in the evaluation object. Ideal and nonideal points were used as stable benchmarks allowing for an independent evaluation of each object with respect to criteria. Importantly, our proposition avoids rank reversal, which can occur if objects are confronted with new information that was not considered when the evaluation process was performed [26]. Lastly, the classification of objects with respect to the IF-TOPSIS ranking is also proposed.
To illustrate the suitability of the proposed methodological approach to the resolution of real decision-making problems, we applied IF-TOPSIS to the ranking of European cities concerning quality of life in 2019. A comparison analysis with classical TOPSIS methods was conducted to show the advantages and limitations of the IF-TOPSIS method. Results indicate that the method is suitable and effective for solving problems with evaluating survey data.
The rest of the paper is organized as follows: the fundamentals of intuitionistic fuzzy sets are first presented, and the intuitionistic fuzzy TOPSIS approach, along with its applications, is highlighted. Next, we propose the novel framework of intuitionistic fuzzy TOPSIS to tackle the problem of assessing socioeconomic phenomena on the basis of survey data. Furthermore, we apply the proposed approach to an evaluation of cities using a dataset for the subjective quality of life of the inhabitants of 83 cities in EU countries, EFTA countries, the UK, the Western Balkans, and Turkey in 2019. Lastly, we present the conclusions of the paper, and future research is proposed.
2. Preliminaries
In this section, we briefly introduce some basic concepts related to intuitionistic fuzzy sets (IFSs) and distances on IFSs, which are used in the IF-TOPSIS procedure.
Zadeh [27] introduced the fuzzy set (FS) theory to deal with vagueness and uncertainty. One of the well-known extensions of FS is the intuitionistic fuzzy set theory (IFS) proposed by Atanassov in 1986 [28].
Definition 1.
According to [28,29], let be a universe of discourse of objects. An intuitionistic fuzzy set in is given by
where are functions with the condition for every .
where the numbers and denote, respectively, the degrees of membership and non-membership of the element to the set A; represents the intuitionistic fuzzy index (hesitation margin) of the element x in the set A.
If the universe X contains only one element , then the IFS over can be denoted as , which is called an intuitionistic fuzzy value (IFV) [30,31]. Let be the set of all IFVs. Clearly, the fuzzy value is the largest, while is the smallest.
Some researchers [32,33,34] noted that intuitionistic fuzzy sets can reflect the decision-maker’s approval, rejection, and hesitations. Moreover, entropy was proposed by Zadeh [27] as a measure of fuzziness. For IFSs, different frameworks of entropy have been proposed by [35,36,37], among others. The definition introduced by Burillo and Bustince [35] allows us to measure the degree of intuitionism of an IFS. Szmidt and Kacprzyk [36] proposed a non-probabilistic-type entropy measure that is the result of a geometric interpretation of IFSs, which uses a ratio of distances between two of the IFSs. Hung and Yang [37] introduced the concept of probability for defining the entropy of an IFS. The concept of entropy and fuzzy entropy is widely used for determining weights in multicriteria methods.
Two well-known types of distances used for fuzzy sets are Euclidean and Hamming distances [33]. In the paper, we used the concept of Euclidean distance.
Definition 2.
According to [33], let us consider two with membership functions , and non-membership functions , , respectively. The normalized Euclidean distance is calculating as follows:
3. Intuitionistic Fuzzy TOPSIS (IF-TOPSIS) Method—Methodological Consideration and Application
One of the most well-known MCDM methods based on reference points is TOPSIS introduced by Hwang and Yoon [5]. In the TOPSIS approach, the most preferred alternative has the shortest distance from the positive-ideal solution and the farthest distance from the negative-ideal solution. TOPSIS has been applied to solve multicriteria problems because of the sound logic and rationale of human choice [38]. To handle several conflicting criteria for which the decision-maker’s knowledge is usually vague and imprecise, the TOPSIS method was modified into a fuzzy environment.
The recent developments of the TOPSIS technique [39,40] and fuzzy TOPSIS technique [41,42] were presented in review papers. One of the very popular variants of the fuzzy TOPSIS method, despite the fact that it was proposed relatively recently, is TOPSIS based on the concept of intuitionistic fuzzy sets.
Boran et al. [43] proposed intuitionistic fuzzy TOPSIS, where the ratings of alternatives with respect to criteria and weights were given as linguistic terms characterized by intuitionistic fuzzy numbers. They applied intuitionistic fuzzy TOPSIS for the evaluation of suppliers. In another paper [44], intuitionistic fuzzy TOPSIS was used in choosing the location of a new plant. Four potential sites characterized in terms of five evaluation factors were scored. Joshi and Kumar [45] developed an intuitionistic fuzzy TOPSIS method based on a distance measure and intuitionistic fuzzy entropy for multicriteria decision making. Büyüközkan and Güleryüz [46] proposed a method for evaluating and selecting mobile phones. In the presented example, they assessed three models of mobile phones characterized by six criteria. Three experts assessed the validity and performance of the criteria using nine- and six-label linguistic evaluation scales. Rouyendegh [32] proposed a hybrid model based on analytic network process (ANP) and intuitionistic fuzzy TOPSIS methods for the problem of uncertainty and subjectivity under certain environments, which were handled using linguistic values and weights via the ANP method. Wang et al. [38] presented an integrated OWA/TOPSIS approach in the intuitionistic fuzzy environment for solving MCDM problems. Zulqarnain and Dayan [47] proposed a method of supplier selection for an automotive company based on linguistic variables and IFT. Shen et al. [30] presented an extended IFT method based on a new distance measure to evaluate a potential strategic partner’s credit risk. Five potential strategic partners were assessed against five criteria. Rouyendegh et al. [48] applied intuitionistic fuzzy TOPSIS to solve the problem of wind powerplant site selection. Chen [49] proposed a multicriteria assessment model which combines intuitionistic fuzzy entropy-based TOPSIS with grey relational analysis (GRA) for the selection of sustainable building material suppliers. In the TOPSIS procedure, the objective weights based on intuitionistic fuzzy entropy were used instead of subjective weights directly obtained from decision-makers. Memari et al. [50] applied an intuitionistic fuzzy TOPSIS method to select the right sustainable supplier. Rouyendegh et al. [51] used an intuitionistic fuzzy TOPSIS to select the best green supplier for a company located in Ankara. The study was conducted with the help of 10 criteria, and three decision-makers select the best among four supplier companies. Dymova et al. [52] proposed the generalization of the intuitionistic fuzzy TOPSIS method in the framework of evidence theory.
This short literature review shows that several variants of the intuitionistic fuzzy TOPSIS approaches have been extensively investigated in the framework of decision-making problems. The main decisions to be made in the intuitionistic fuzzy TOPSIS-based approach are related to the ranking of alternatives and weights of criteria, construction reference points, and calculation distance measure. Table 1 summarizes the main differences in the TOPSIS methods based on an intuitionistic fuzzy framework.
4. The Intuitionistic Fuzzy TOPSIS-Based Model for Evaluating Socioeconomic Phenomena on the Basis of Survey Data
Let be the set of objects under survey evaluation, and let be the set of criteria for the objects are evaluated. We assume that respondents answered questions using different scales, which can be aggregated into three groups: “positive opinion about the object”, “negative opinion about the object”, and “no opinion or no answer”. As an example, let us take a question from the “Perception survey on the quality of life in European cities, 2019” (Table 2).
In this case, “positive opinions” would include answers 3 and 4. “Negative opinions” would include answers 1 and 2. The third group would include answers coded as 99. However, it should be noted that, in opinion research with the use of ordinal scales, reverse items are also used. An example of such an item is Q13 from the same survey (Table 3).
In such an inverse item, answers 1 and 2 would be considered “positive opinions”. The set of “negative opinions” would constitute answers 3 and 4. Answers coded as 99 would again form the third group.
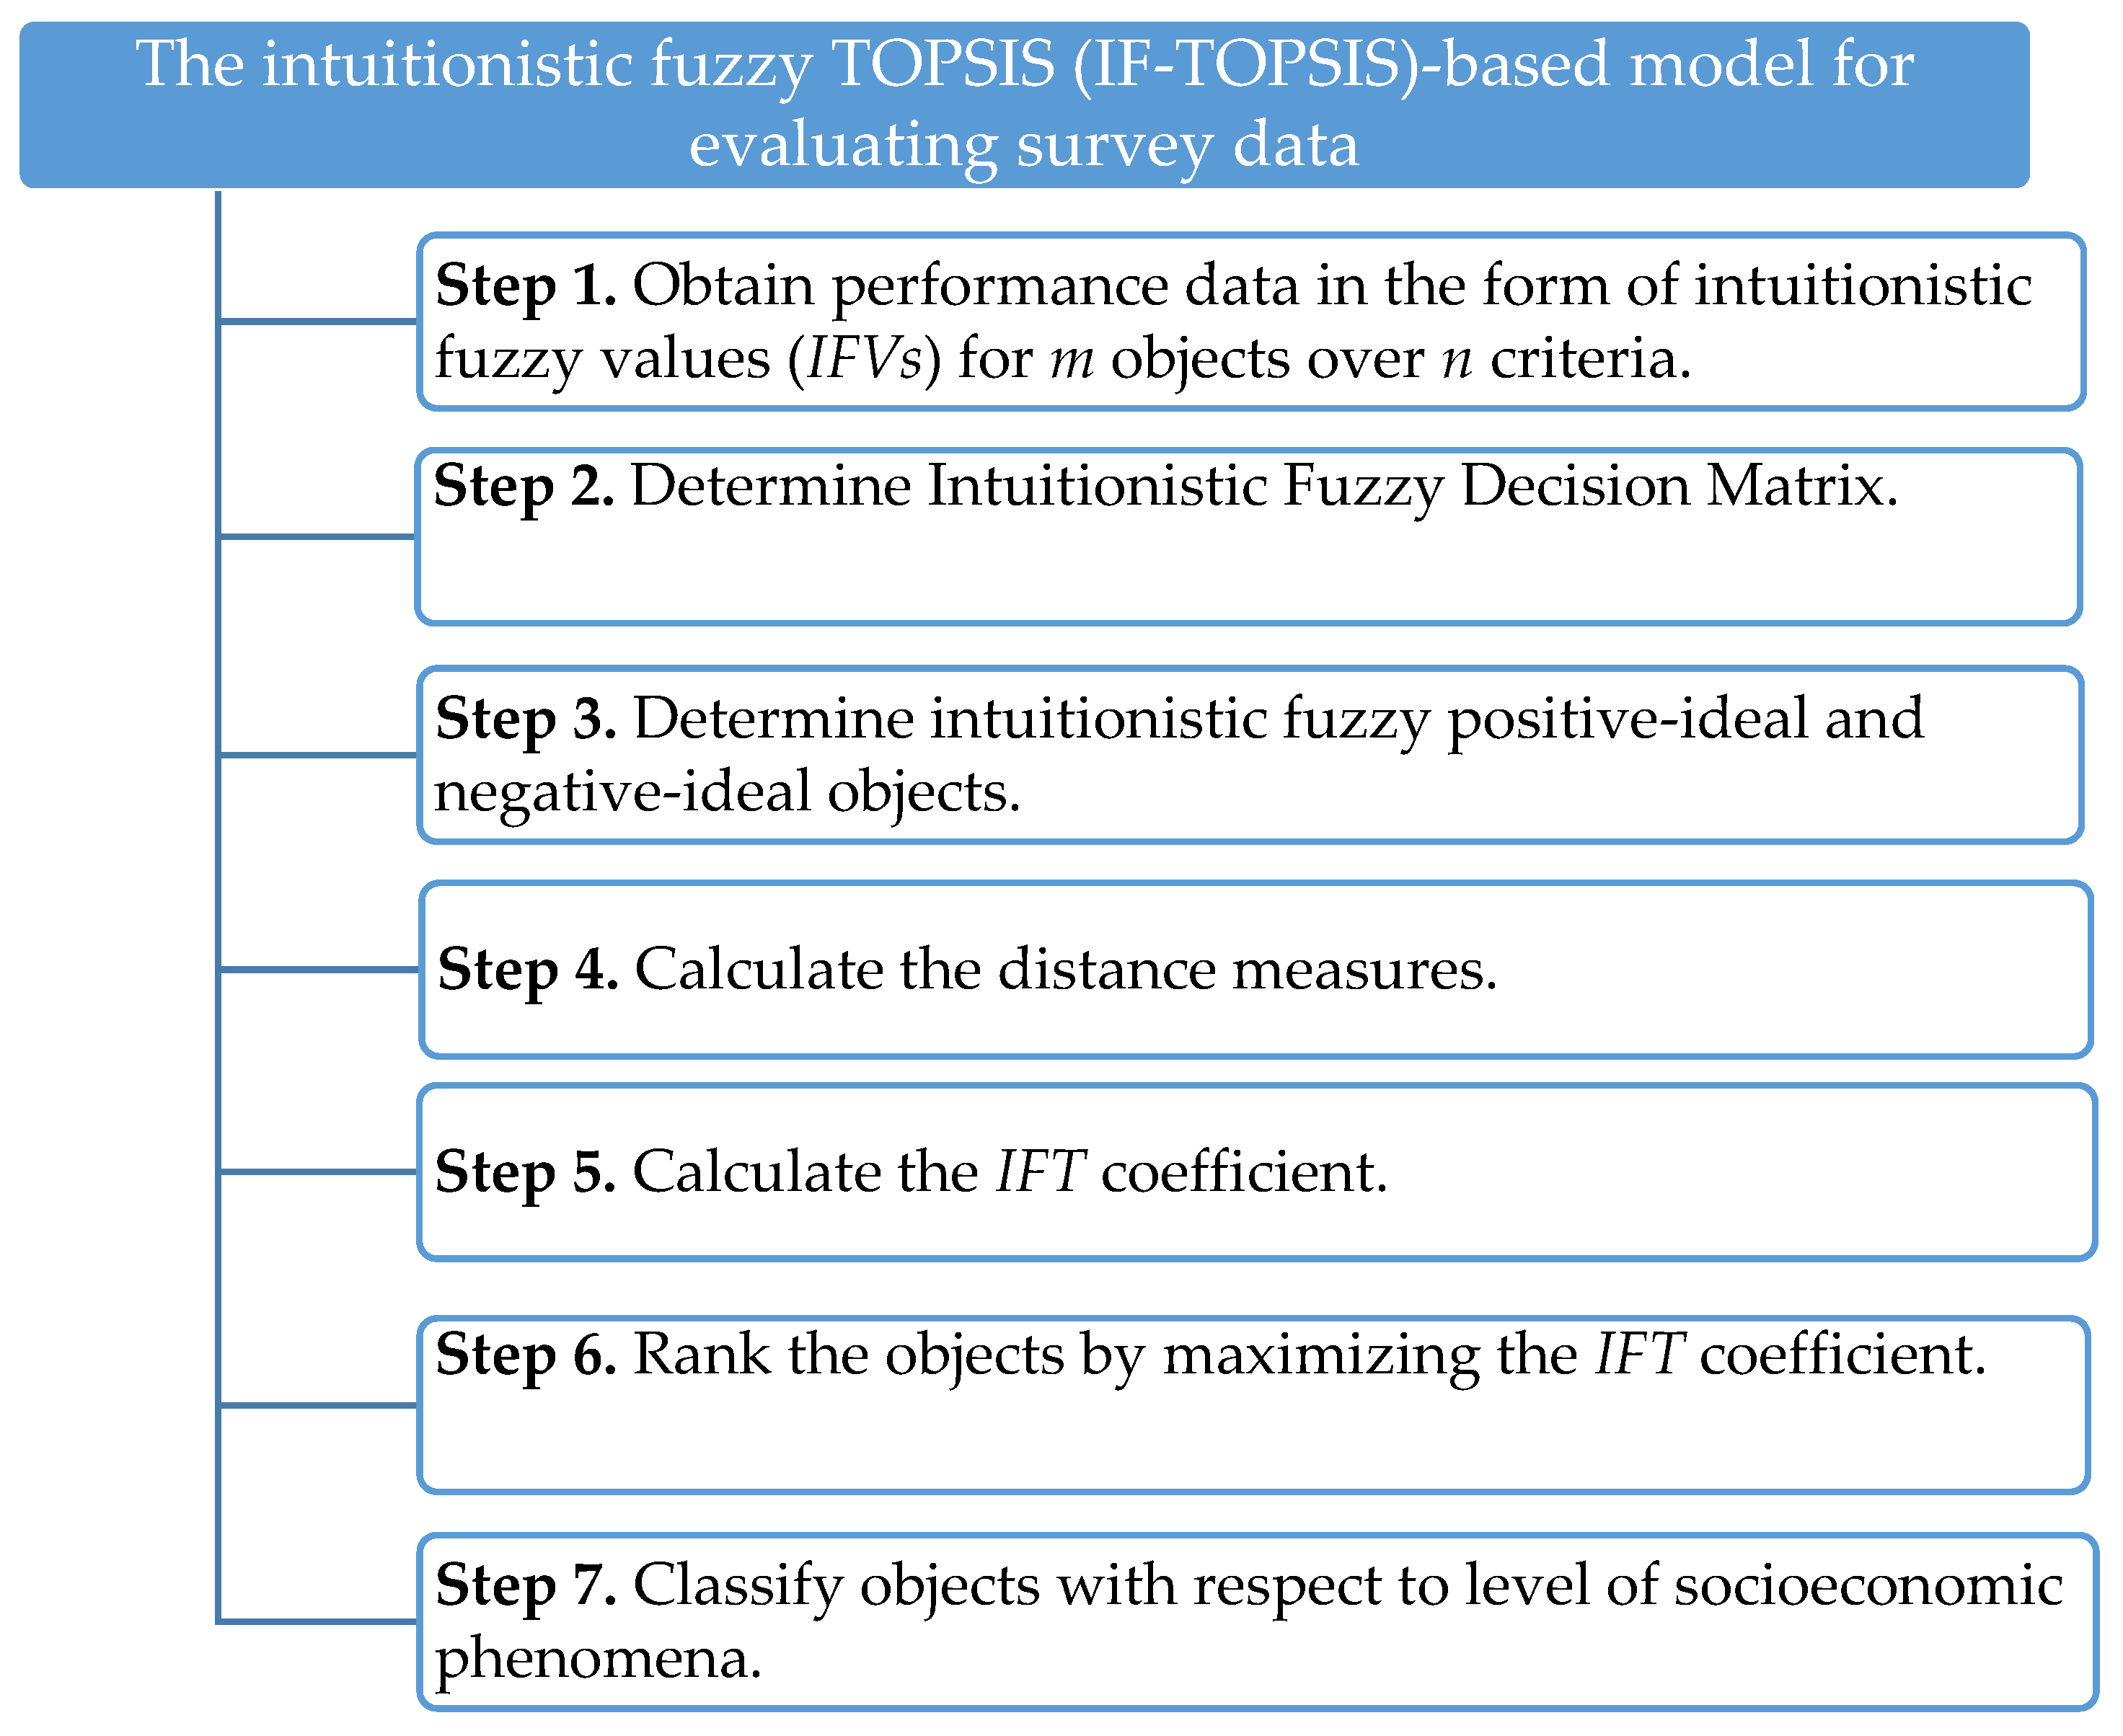
The algorithm for the evaluation of socioeconomic phenomena, when survey data are represented by IFSs, using an IF-TOPSIS technique, is given in seven steps. Taking into consideration that the survey questions had the same importance in the evaluation of the objects, we assumed that the weights of criteria were equal. Let us recall that Maggino and Ruviglioni [53] noted that equal weights are used in most applications, whereby, “when the theoretical structure attributes to each indicator the same adequacy in defining the variable to be measured, the theoretical structure does not allow hypotheses to be consistently derived on differential weightings”.
The procedure is described below.
- Step 1. Obtain performance data in the form of intuitionistic fuzzy values (IFVs) for m objects over n criteria.
In this step, the objects are evaluated according to criteria. The respondent’s opinions about object for each criterion are represented by IFVs , where indicates the fraction of positive opinions about the i-th object with respect to the j-th criterion, indicates the fraction of negative opinions about the i-th object with respect to the j-th criterion, and represents the fraction of opinion type “do not know” or “no answer” for the i-th object with respect to the j-th criterion. Thus, we have , i.e.,
where is the total number of respondents who positively evaluated the i-th object with respect to the j-th criterion, is the total number of respondents who negatively evaluated the i-th object with respect to the j-th criterion, is the total number of respondents with a hesitant opinion about the i-th object with respect to the j-th criterion, and is the total number of respondents who evaluated the i-th object. Let us note that Clearly, instead of the total number of responses, we can use the percentage of relevant responses, which is common for secondary survey data.
Let us observe that the i-th object is represented by the following vector:
where .
- Step 2. Determine Intuitionistic Fuzzy Decision Matrix.
Subsequently, the intuitionistic fuzzy decision matrix is given in the following form:
- Step 3. Determine intuitionistic fuzzy positive-ideal and negative-ideal objects.
The intuitionistic fuzzy positive-ideal object is based on maximum IFV and has the following form:
The intuitionistic fuzzy negative-ideal object is based on minimum IFV and has the following form:
- Step 4. Calculate the distance measures.
The distance measure from the fuzzy positive-ideal object and the distance measure from the fuzzy negative-ideal object are calculated using Equation (3).
- Step 5. Calculate the intuitionistic fuzzy TOPSIS coefficient (IFT).
For each object, we calculated the ratio of the distance from the fuzzy negative-ideal object to the sum of the distance from the fuzzy negative-ideal object and fuzzy positive-ideal object. The intuitionistic fuzzy TOPSIS coefficient is defined as follows:
- Step 6. Rank the objects by maximizing the coefficient .
Let us observe that . The highest value of is, thus, the highest position of the object . Moreover, for , and for .
- Step 7. Classify objects with respect to the level of socioeconomic phenomena.
Different classification criteria could be applied. We present two classification procedures that allowed distinguishing the objects according to the various levels of socioeconomic development with respect to the IF-TOPSIS procedure. The first is based on average and standard deviation measures, as described below.
- Group 1: represents a very high level of socioeconomic phenomena;
- Group 2: represents a medium–high level of socioeconomic phenomena;
- Group 3: represents a medium–low level of socioeconomic phenomena;
- Group 4: represents a very low level of socioeconomic phenomena, where and are the average value and the standard deviation of the coefficient.
The second procedure is based on the values of the coefficient , as described below.
- Group 1: represents a very high level of socioeconomic phenomena;
- Group 2: represents a high level of socioeconomic phenomena;
- Group 3: represents a medium level of socioeconomic phenomena;
- Group 4: represents a low level of socioeconomic phenomena;
- Group 5: represents a very low level of socioeconomic phenomena.
The IF-TOPSIS-based model for the evaluation of questionnaires is presented in Figure 1.
5. Empirical Example
The proposed approach to the analysis of survey data, using the presented procedure and the IF-TOPSIS method, was used in the analysis of results from the fifth survey on quality of life in European cities. A growing interest in the quality of life category has been observed in scientific research conducted by representatives of various fields and disciplines of science, as well as in the practical dimension, i.e., in the daily life of individuals, groups, or entire communities, e.g., city inhabitants. A natural consequence of this interest is differences in views on the perception of the quality of life category and differences in the methodology of the conducted research, including the methods and tools used to measure it. Despite these differences, there is agreement on the fundamental assumptions of this category. Undoubtedly, quality of life should be treated as a complex, multidimensional construct. In this context, in the literature on the subject, one can find proposals for definitions of a global (holistic) nature, covering all aspects and dimensions of the quality of life, as well as of a partial (detailed or fragmentary) nature, which relate only to selected areas, e.g., health. Another important issue is taking into account the two dimensions of the quality of life category, objective and subjective, which is of particular importance for the practice of research in the field of measuring and assessing the quality of life. Following international recommendations and current research practice, this measurement should take into account both objective and subjective indicators. Both sets of indicators should be treated as complementary and give a complete picture of the quality of life in both its dimensions. Objective quality of life is sometimes equated with living conditions (standard of living) and includes all indicators of the nature of objective measures that allow the comparison of various parameters in the economic, social, or environmental dimensions that determine the life of individuals and societies. Subjective quality-of-life indicators take the form of value judgments that are formulated by an individual in relation to their own life in the context of previous experiences, desires, expectations, and system of values. It is worth emphasizing here that the relationships between quality of life in the objective and subjective dimensions are not clearly defined, i.e., the improvement of objective living conditions does not have to translate directly into an increase in the subjective sense of satisfaction with life. This is due to the fact that subjective quality of life is an individual matter, dependent on the unique perception of each person.
The fifth survey on quality of life in European cities was conducted for the European Commission by the IPSOS company. The survey covered the inhabitants of 83 cities in EU countries, EFTA countries, the UK, the Western Balkans, and Turkey. The study was conducted between 12 June and 27 September 2019, with a pause between 15 July and 1 September. A total of 700 interviews were completed in each city surveyed. This means that a total of 58,100 inhabitants of 83 cities participated in the study.
Our study aimed to measure and benchmark inhabitants’ satisfaction with life in selected cities using the IF-TOPSIS method. Inhabitants’ satisfaction, as a complex phenomenon, was characterized using 10 criteria: C1—satisfaction with public transport, C2—satisfaction with healthcare services, doctors, and hospitals, C3—satisfaction with sports facilities such as sports fields and indoor sports halls, C4—satisfaction with cultural facilities such as concert halls, theaters, museums, and libraries, C5—satisfaction with green spaces such as parks and gardens, C6—satisfaction with public spaces such as markets, squares, and pedestrian areas, C7—satisfaction with schools and other educational facilities, C8—satisfaction with the quality of the air, C9—satisfaction with the noise level, and C10—satisfaction with the cleanliness. In the assessment of criteria, a five-point measurement scale was used: very satisfied, rather satisfied, rather unsatisfied, very unsatisfied, and do not know/no answer.
The characteristics of the research sample in terms of sex, age, and level of education are presented in Table 4.
Due to the large number of cities covered by the survey, individual steps of the proposed procedure are presented for the example of three selected cities: London, Stockholm, and Vienna. The selected cities were among the top five most sustainable cities in 2018 according to the ARCADIS ranking. Edinburgh and Singapore, ranked third and fourth, respectively, were not included in the analyzed survey. The assessment of selected cities in terms of 10 criteria was presented in two manners by Eurostat. The first approach, using a four-point Likert scale, is presented in Table 5. The second approach was based on opinion aggregated into three classes: (1) unsatisfied, which included categories very unsatisfied and rather unsatisfied; (2) satisfied, which included categories rather satisfied and very satisfied; (3) respondents with answers of do not know/no answer/refused to answer (see Table 6).
These two ways of presenting data allow for two possibilities for the aggregation of data, as well as for the construction of two synthetic measures. The novel method IF-TOPSIS proposed in this paper was applied to the data, as presented in Table 6.
According to Equation (5), the respondents’ assessments were transformed into IFVs (Table 7).
Criterion assessments in the form of IFVs for all cities are listed in Table A1, Table A2 and Table A3 (Appendix A).
Assessments of cities in terms of the 10 criteria in the form of IFVs were used to construct an intuitionistic fuzzy decision matrix, a fragment of which is presented below for the described cities.
We did not assign weights for individual criteria. According to the concept of sustainable development, all dimensions (social, environmental, and economic) and aspects (e.g., health, education, security) should be in balance, i.e., they are equally important for improving the quality of life, for both current and future generations. Recognizing that a given dimension or aspect of sustainable development has priority over others (has a higher weight) would be contrary to the idea of sustainable development.
The coordinates of intuitionistic fuzzy positive-ideal and negative-ideal objects were determined on the basis of the maximum and minimum IFVs, respectively (Table 8 and Table 9).
Using the normalized Euclidean distance in accordance with Equation (3), the distances of each city from the intuitionistic fuzzy positive-ideal and negative-ideal objects were calculated, and then the IFT coefficients were calculated (Table 10).
The values of IF-TOPSIS coefficients for all cities are presented in Table A4 (Appendix A).
The position of cities in the ranking was determined on the basis of the IF-TOPSIS coefficient values, in accordance with the principle that a higher value of the IF-TOPSIS coefficient denoted a higher position in the ranking (Table 11).
On the basis of the IFT coefficient values, the cities were classified into one of five classes according to the second procedure proposed in step 6 (Table 12).
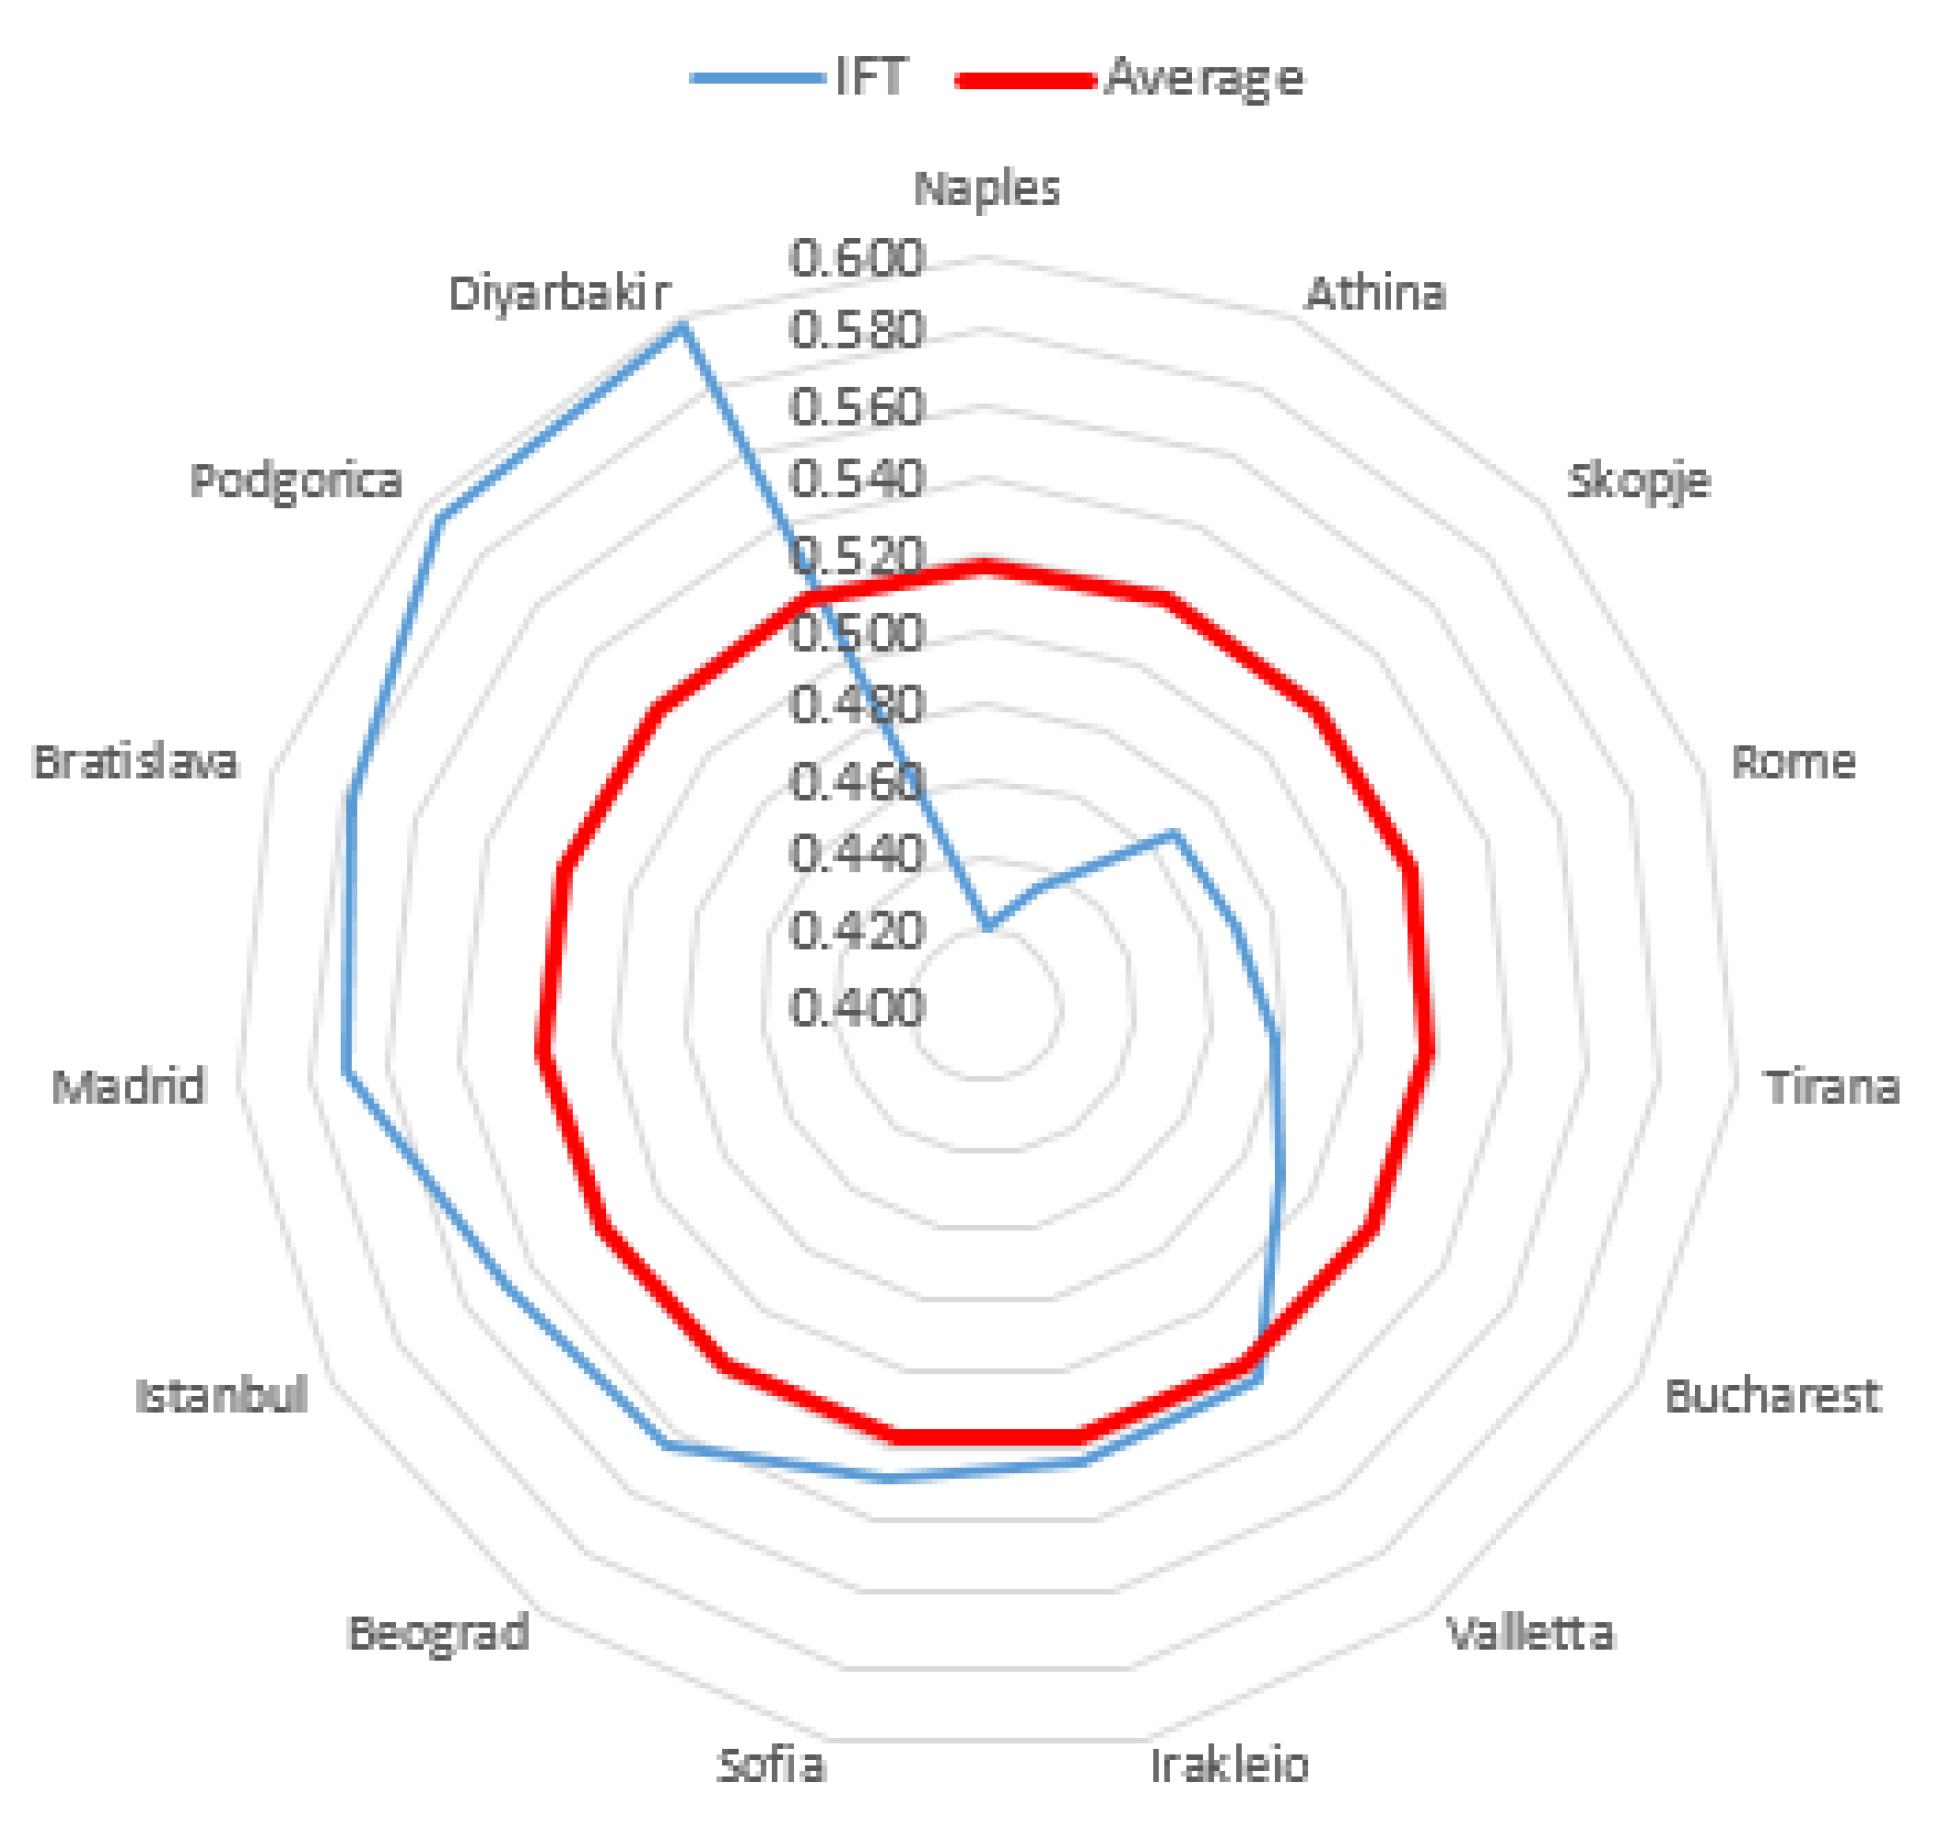
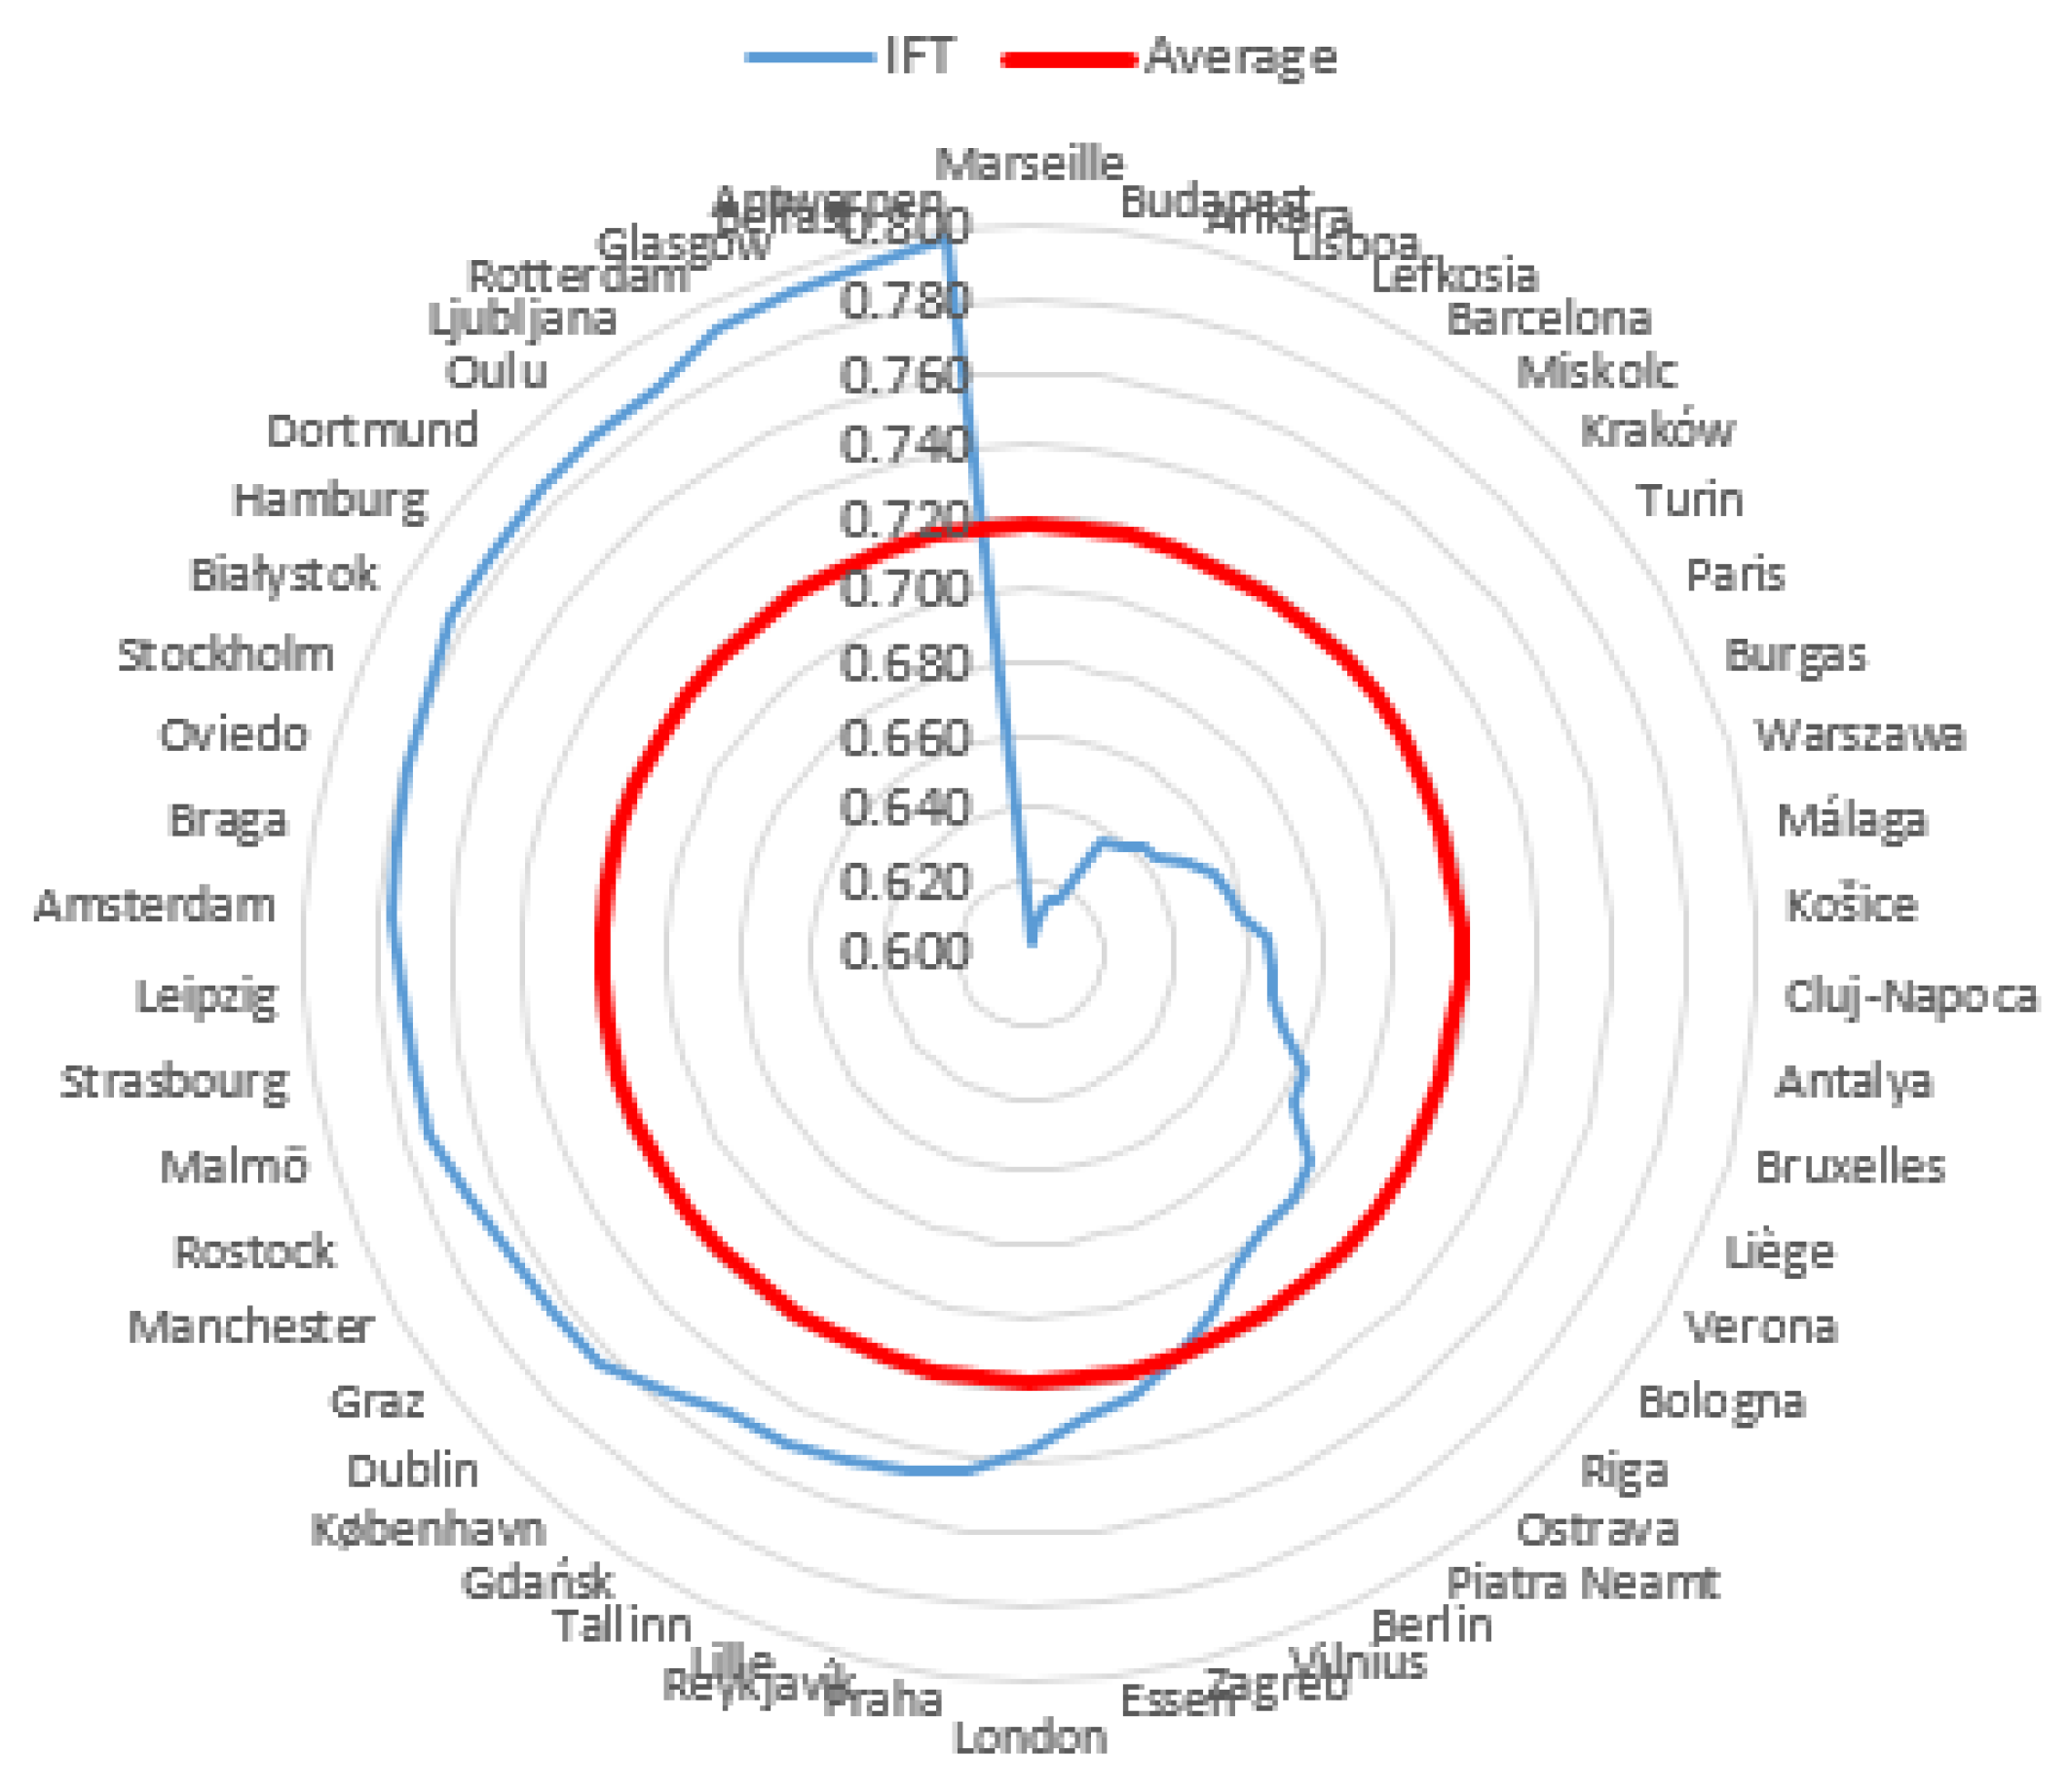
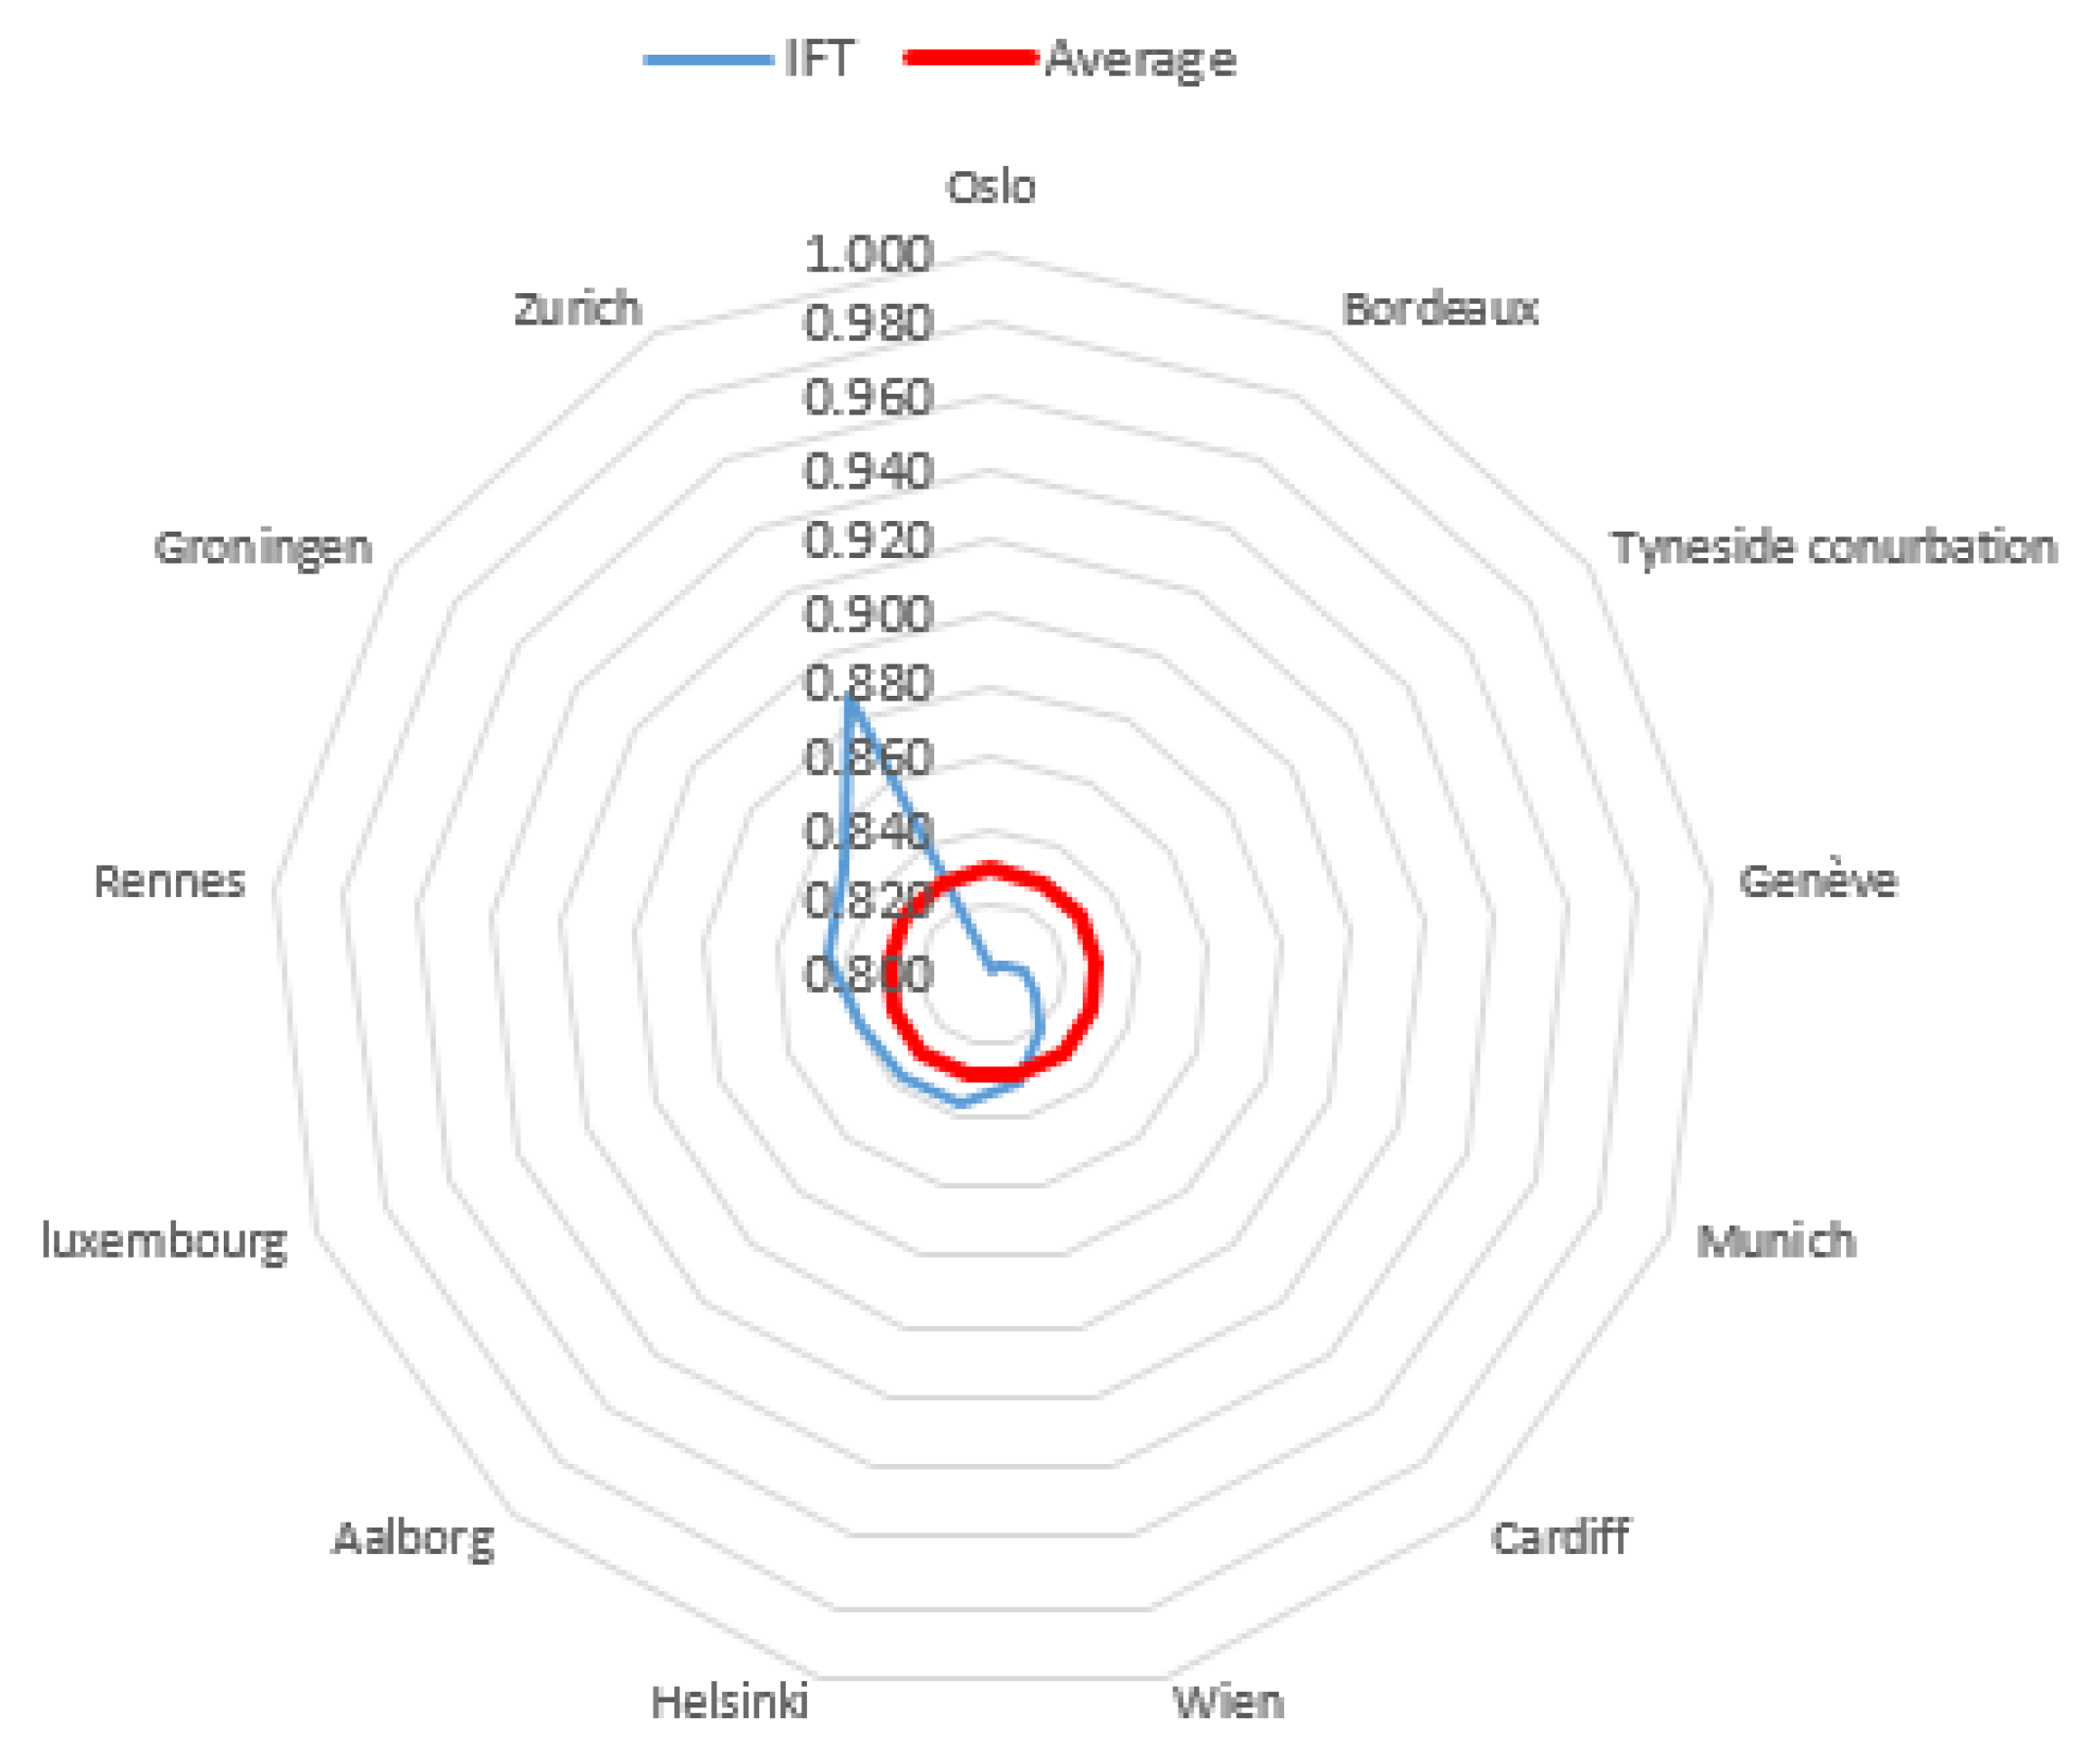
The level of subjective quality of life in most cities was high (65.06% of the research sample). The highest level of this phenomenon was observed in 15.663% of cities. Zurich was the highest in the ranking. The value of the IFT coefficient for this city was 0.886. Palermo obtained the lowest rank with an IFT coefficient of 0.377. The inhabitants’ subjective quality of life of 18.072% of the cities was at the average level. Graphical representations of the obtained results, broken down into three city classes, distinguished on the basis of the inhabitants’ level of subjective quality of life, are presented in Figure 2, Figure 3 and Figure 4.
For the class with a low level of quality of life, it was not possible to prepare a chart because only Palermo was included in it.
Additionally, basic descriptive statistics were calculated for three classes (Table 13).
The most significant differentiation in terms of IFT coefficient values was observed in the group of cities with a medium level quality of life. Exactly six of the 15 cities in this group achieved IFT coefficient values below the group average (less than 0.518). The highest values were observed for the cities of Diyarbakir and Podgorica. These two cities were almost at the top of the medium class. The second group of cities, for which the subjective quality of life is high, was the most numerous with 54 cities.
Interestingly, the variation area, i.e., the difference between the highest and the lowest scores in this group, was almost equal to the class width and amounted to 0.195. At two opposite ends were Marseille with a score of 0.603 and Antwerpen with an IFT coefficient value of 0.798. Exactly 30 cities in this group were those for which the IFT coefficient value was equal to or higher than the group means. The most homogeneous and numerous group was the third group, which included cities with a very high quality of life. The best result was observed for Zurich with an IFT value of 0.886. Although this was the highest result in this group of cities, the obtained value was closer to the lower limit defining this class (IFT of 0.800).
Contrary to the medium and high groups, in the very high group, no city came close to the upper limit of this class, i.e., an IFT coefficient value equal to 1. However, it is worth emphasizing that cities with high and very high quality of life account for about 80% of all surveyed cities. The list also includes the one-element low class, featuring Palermo, and the empty very low class.
The results obtained for the cities with partial calculations presented significant discrepancies between sustainable development assessment based on objective indicators and quality of life assessment based on subjective indicators. London, the best city in the ARCADIS ranking, took 40th place in the ranking of inhabitants’ quality of life. Stockholm was ranked higher in the 23rd position. Vienna occupied the highest at the seventh position. It should be emphasized here that a high level of sustainable development of cities should lead to its inhabitants’ satisfaction. As shown by the results of this study, this relationship is not always so unambiguous. However, it should be emphasized that the discussed issue was not the goal of our analyses and would require much more in-depth research evaluating, e.g., the selection of indicators, the method of their measurement, the number of dimensions representing the discussed constructs, and aggregation methods.
Lastly, we compared the results obtained using the IF-TOPSIS method with the results obtained using the classical TOPSIS method (for the algorithm of classical TOPSIS, see, e.g., [5]). The use of the TOPSIS method required averaging the respondents’ ratings for each criterion. The numerical signs assigned to the four categories of the Likert scale in the Eurostat database were multiplied by the respective shares of the respondents’ answers. Thus, the ratings of the criteria fell within the range 1–4. In the classic TOPSIS variant, missing responses, refusals to answer, or “do not know” responses were not taken into account because they do not constitute a point on the Likert scale used in the study. The coordinates of the fuzzy positive-ideal and negative-ideal objects were assumed as 4 and 1. The positions of cities in the ranking obtained using the classic TOPSIS method are presented in Table 14.
The values of the coefficients for cities and the classification of cities in terms of subjective quality of life using the classic TOPSIS method are presented in Table A5 and Table A6 (Appendix A).
The values of the coefficients for cities calculated using the classic TOPSIS method decreased compared to the results obtained using the IF-TOPSIS method. The mean values of the coefficients using the IF-TOPSIS and TOPSIS methods were 0.695 and 0.578, respectively. Changes in the values of the coefficients influenced the classification of cities in terms of the subjective quality of life of their inhabitants. The class of cities with a low quality of life level grew, while none of the cities were classified into the group of cities with the highest quality of life level. The biggest changes took place in the class with the average level of quality of life, featuring a number of cities that came close to the high class.
The vast majority of cities changed their position in the ranking after applying the classic TOPSIS method. The Kendall tau correlation coefficient for the two compared rankings was Tau = 0.878 (p-value < 0.0001). In the case of 9.639% of cities, the use of these two methods did not affect the positions in the rankings. Most of the cities (18.072%) changed their position in the ranking by only one position. The analyzed group of cities also included such cities for which the choice of the method had a significant impact on the position in the ranking. These include Graz, Braga, and Dublin, for which position changes in the rankings amounted to 23, 15, and 14 places, respectively.
6. Conclusions and Discussions
The literature has proposed several tools for solving multicriteria decision-making problems in various real-life situations under different types of uncertainties (for example, see [55,56,57,58,59]). In this paper, we proposed an intuitionistic fuzzy TOPSIS (IF-TOPSIS) method to solve the problem of assessing socioeconomic phenomena on the basis of survey data. Firstly, the proposed approach does not require raw data, and it takes into consideration uncertainty in respondents’ opinions. This enables the evaluation of the phenomenon on the basis of aggregated secondary data by transforming these data into intuitionistic fuzzy values. The degree of membership to the intuitionistic fuzzy value is the fraction of positive opinions in all assessments of the object in terms of the selected criterion. The degree of non-membership to an intuitionistic fuzzy value is the fraction of negative opinions in all assessments of the object in terms of the selected criterion. The degree of uncertainty is estimated according to Definition 1. The degree of uncertainty is represented by the fraction of respondents who, for various reasons, did not express their opinion or chose the option “hard to say”, “I have no opinion”, etc.
Secondly, the proposed approach to the transformation of aggregate secondary data into the form of intuitionistic fuzzy values does not violate the assumptions related to the measurement level of ordinal scales, as well as permissible relations and transformations of their values. After data transformation, the evaluation of the complex phenomenon using the IF-TOPSIS method is based on arithmetic operations, comparisons, and transformations acceptable for intuitionistic fuzzy values.
The last distinguishing feature of the proposed approach is the method of determining the coordinates of the intuitionistic fuzzy positive-ideal and negative-ideal objects. In the case of complex phenomena assessed on the basis of continuous data, the coordinates of the intuitionistic fuzzy positive-ideal and negative-ideal objects are determined, respectively, on the basis of the maximum and minimum values observed in the set of objects. Researchers are usually unable to indicate the desired values of the criteria. This results, inter alia, to the fact that adding another object to the research sample may change the coordinates of the intuitionistic fuzzy positive-ideal and negative-ideal objects, thus changing the position of the objects in the ranking. The method of determining the coordinates proposed in the article uses the parameters of intuitionistic fuzzy values. Thus, in the case of an intuitionistic fuzzy positive-ideal object, the degrees of membership and non-membership to the intuitionistic fuzzy set are known and should be 1 and 0, respectively. The degrees of membership and non-membership to the intuitionistic fuzzy set for an intuitionistic fuzzy negative-ideal object will be 0 and 1, respectively. In this case, including the new object in the intuitionistic fuzzy decision matrix will have no effect on the coordinates of the intuitionistic fuzzy positive-ideal and negative-ideal objects. This approach is characterized by the additional advantage of comparability of the results over time because, in each time unit, the results of the object evaluation are always related to the same intuitionistic fuzzy positive-ideal and negative-ideal objects. Of course, it is also possible to use an approach based on the maximum and minimum values of the parameters of intuitionistic fuzzy values.
Comparing the IF-TOPSIS method with the classic TOPSIS method made it possible to indicate the strengths and weaknesses of the proposed approach in the analysis of survey data aggregated from public statistics. The proposed method is simple and does not require raw data. It is directly based on the data format provided by official statistics. The method does not differentiate the categories that make up the positive and negative opinions of the respondents, which results in the loss of a certain part of information. On the other hand, it takes into account an additional element, which is the uncertainty expressed in the lack of answers, refusal to answer, or ignorance of the answer, which is omitted in the classic variant of the TOPSIS method. In addition, the classic TOPSIS method requires a real number of criteria assessments. This necessitates aggregating the opinions of respondents using an arithmetic mean. Therefore, using the classic TOPSIS method, we are forced to assume the equality of intervals among the various categories that make up the measurement scale. This assumption is most often not met, which means that the evaluation of the criteria will be imprecise and may impact the final results obtained using the classic TOPSIS method.
The future research challenge is to propose a modification of the IF-TOPSIS method which will make it possible to take into account the distribution of ratings into individual categories on the side of positive and negative ratings. Future research will also focus on applying the proposed approach and the intuitionistic fuzzy TOPSIS method to analyze changes in the quality of life in cities in 2007–2020. The method of determining intuitionistic fuzzy positive-ideal and negative-ideal objects and the method of classifying cities in terms of the quality of life of their inhabitants proposed in the article will make it possible to identify cities with the smallest and greatest changes in quality of life. The proposed approach is also resistant to changes in the number of cities in particular editions of the survey. The analysis will also concern changes in individual classes in the period 2007–2020, because our study results indicated that there are cities located on the border of two classes, whereby it was difficult to classify them in terms of the quality of life of their inhabitants.
Author Contributions
Conceptualization, E.R., M.K.-J., and B.J.; methodology, E.R., M.K.-J., and B.J.; validation, E.R., M.K.-J., and B.J., formal analysis, E.R., M.K.-J., and B.J.; investigation, E.R., M.K.-J., and B.J.; resources, E.R., M.K.-J., and B.J.; data curation, E.R., M.K.-J., and B.J.; writing—original draft preparation, E.R., M.K.-J., and B.J.; writing—review and editing, E.R., M.K.-J., and B.J.; visualization, M.K.-J. and B.J.; supervision, E.R.; administration, E.R. All authors read and agreed to the published version of the manuscript.
Funding
This research received no external funding.
Data Availability Statement
Not applicable (for secondary data analysis, see [54]).
Conflicts of Interest
The authors declare no conflict of interest.
Appendix A

Table A1.
Degrees of non-membership to IFVs for cities.
| City | C1 | C2 | C3 | C4 | C5 | C6 | C7 | C8 | C9 | C10 |
|---|---|---|---|---|---|---|---|---|---|---|
| Aalborg | 0.159 | 0.153 | 0.084 | 0.045 | 0.075 | 0.125 | 0.071 | 0.114 | 0.142 | 0.186 |
| Amsterdam | 0.148 | 0.088 | 0.107 | 0.061 | 0.114 | 0.121 | 0.105 | 0.286 | 0.317 | 0.356 |
| Ankara | 0.383 | 0.361 | 0.349 | 0.334 | 0.300 | 0.347 | 0.404 | 0.355 | 0.455 | 0.367 |
| Antalya | 0.360 | 0.325 | 0.277 | 0.277 | 0.229 | 0.280 | 0.340 | 0.266 | 0.394 | 0.251 |
| Antwerpen | 0.252 | 0.076 | 0.097 | 0.077 | 0.148 | 0.114 | 0.100 | 0.349 | 0.252 | 0.217 |
| Athina | 0.253 | 0.627 | 0.535 | 0.323 | 0.707 | 0.647 | 0.366 | 0.708 | 0.667 | 0.697 |
| Barcelona | 0.226 | 0.315 | 0.248 | 0.189 | 0.294 | 0.181 | 0.276 | 0.624 | 0.563 | 0.386 |
| Belfast | 0.218 | 0.236 | 0.183 | 0.085 | 0.150 | 0.171 | 0.106 | 0.156 | 0.147 | 0.262 |
| Beograd | 0.544 | 0.584 | 0.222 | 0.204 | 0.370 | 0.374 | 0.339 | 0.582 | 0.500 | 0.626 |
| Berlin | 0.135 | 0.155 | 0.235 | 0.117 | 0.126 | 0.200 | 0.282 | 0.278 | 0.397 | 0.507 |
| Białystok | 0.143 | 0.509 | 0.132 | 0.089 | 0.086 | 0.100 | 0.131 | 0.122 | 0.198 | 0.075 |
| Bologna | 0.271 | 0.178 | 0.136 | 0.108 | 0.135 | 0.167 | 0.150 | 0.535 | 0.402 | 0.494 |
| Bordeaux | 0.143 | 0.107 | 0.160 | 0.145 | 0.146 | 0.111 | 0.109 | 0.219 | 0.254 | 0.326 |
| Braga | 0.209 | 0.239 | 0.186 | 0.208 | 0.273 | 0.121 | 0.094 | 0.168 | 0.246 | 0.178 |
| Bratislava | 0.309 | 0.522 | 0.412 | 0.131 | 0.444 | 0.290 | 0.197 | 0.436 | 0.393 | 0.679 |
| Bruxelles | 0.260 | 0.142 | 0.195 | 0.115 | 0.150 | 0.194 | 0.270 | 0.486 | 0.451 | 0.583 |
| Bucharest | 0.420 | 0.537 | 0.348 | 0.179 | 0.362 | 0.437 | 0.391 | 0.794 | 0.684 | 0.617 |
| Budapest | 0.254 | 0.570 | 0.221 | 0.105 | 0.295 | 0.198 | 0.263 | 0.508 | 0.495 | 0.568 |
| Burgas | 0.111 | 0.539 | 0.176 | 0.193 | 0.171 | 0.167 | 0.135 | 0.685 | 0.443 | 0.281 |
| Cardiff | 0.189 | 0.177 | 0.133 | 0.046 | 0.080 | 0.121 | 0.070 | 0.144 | 0.200 | 0.247 |
| Cluj-Napoca | 0.159 | 0.434 | 0.146 | 0.103 | 0.312 | 0.253 | 0.219 | 0.480 | 0.501 | 0.305 |
| Diyarbakir | 0.432 | 0.408 | 0.434 | 0.364 | 0.307 | 0.264 | 0.448 | 0.261 | 0.454 | 0.438 |
| Dortmund | 0.109 | 0.162 | 0.170 | 0.076 | 0.090 | 0.157 | 0.130 | 0.196 | 0.245 | 0.369 |
| Dublin | 0.256 | 0.384 | 0.193 | 0.117 | 0.129 | 0.235 | 0.134 | 0.153 | 0.139 | 0.367 |
| Essen | 0.248 | 0.122 | 0.333 | 0.133 | 0.156 | 0.213 | 0.192 | 0.201 | 0.280 | 0.408 |
| Gdańsk | 0.123 | 0.488 | 0.116 | 0.070 | 0.153 | 0.150 | 0.110 | 0.219 | 0.326 | 0.238 |
| Genève | 0.135 | 0.085 | 0.090 | 0.093 | 0.063 | 0.096 | 0.072 | 0.284 | 0.310 | 0.240 |
| Glasgow | 0.178 | 0.170 | 0.144 | 0.077 | 0.107 | 0.159 | 0.126 | 0.241 | 0.147 | 0.347 |
| Graz | 0.228 | 0.082 | 0.177 | 0.114 | 0.220 | 0.134 | 0.085 | 0.501 | 0.240 | 0.180 |
| Groningen | 0.153 | 0.067 | 0.088 | 0.055 | 0.092 | 0.081 | 0.043 | 0.150 | 0.190 | 0.174 |
| Hamburg | 0.101 | 0.139 | 0.186 | 0.073 | 0.103 | 0.164 | 0.179 | 0.198 | 0.284 | 0.272 |
| Helsinki | 0.098 | 0.233 | 0.093 | 0.036 | 0.062 | 0.151 | 0.075 | 0.113 | 0.173 | 0.186 |
| Irakleio | 0.314 | 0.510 | 0.378 | 0.424 | 0.684 | 0.484 | 0.336 | 0.258 | 0.526 | 0.614 |
| Istanbul | 0.382 | 0.371 | 0.445 | 0.332 | 0.432 | 0.433 | 0.469 | 0.460 | 0.648 | 0.369 |
| København | 0.183 | 0.159 | 0.197 | 0.093 | 0.083 | 0.147 | 0.151 | 0.299 | 0.298 | 0.283 |
| Košice | 0.404 | 0.382 | 0.346 | 0.108 | 0.265 | 0.134 | 0.124 | 0.431 | 0.414 | 0.363 |
| Kraków | 0.192 | 0.479 | 0.146 | 0.087 | 0.264 | 0.146 | 0.116 | 0.807 | 0.504 | 0.321 |
| Lefkosia | 0.381 | 0.349 | 0.320 | 0.319 | 0.449 | 0.426 | 0.118 | 0.336 | 0.348 | 0.369 |
| Leipzig | 0.185 | 0.159 | 0.160 | 0.070 | 0.090 | 0.121 | 0.185 | 0.149 | 0.289 | 0.280 |
| Liège | 0.370 | 0.116 | 0.187 | 0.154 | 0.235 | 0.225 | 0.137 | 0.429 | 0.299 | 0.577 |
| Lille | 0.174 | 0.109 | 0.122 | 0.110 | 0.171 | 0.188 | 0.114 | 0.423 | 0.332 | 0.393 |
| Lisboa | 0.367 | 0.361 | 0.282 | 0.225 | 0.293 | 0.262 | 0.189 | 0.433 | 0.479 | 0.567 |
| Ljubljana | 0.226 | 0.296 | 0.152 | 0.119 | 0.131 | 0.146 | 0.115 | 0.243 | 0.302 | 0.142 |
| London | 0.138 | 0.269 | 0.202 | 0.173 | 0.074 | 0.136 | 0.167 | 0.440 | 0.238 | 0.332 |
| Luxembourg | 0.158 | 0.132 | 0.120 | 0.087 | 0.103 | 0.097 | 0.131 | 0.183 | 0.220 | 0.063 |
| Madrid | 0.241 | 0.340 | 0.376 | 0.314 | 0.318 | 0.280 | 0.370 | 0.654 | 0.514 | 0.616 |
| Málaga | 0.189 | 0.338 | 0.283 | 0.201 | 0.366 | 0.232 | 0.205 | 0.271 | 0.475 | 0.575 |
| Malmö | 0.213 | 0.301 | 0.106 | 0.062 | 0.041 | 0.098 | 0.232 | 0.172 | 0.133 | 0.311 |
| Manchester | 0.119 | 0.188 | 0.174 | 0.151 | 0.192 | 0.170 | 0.120 | 0.235 | 0.169 | 0.393 |
| Marseille | 0.282 | 0.157 | 0.341 | 0.212 | 0.343 | 0.390 | 0.238 | 0.507 | 0.431 | 0.742 |
| Miskolc | 0.254 | 0.573 | 0.237 | 0.087 | 0.253 | 0.200 | 0.160 | 0.460 | 0.320 | 0.511 |
| Munich | 0.148 | 0.080 | 0.123 | 0.066 | 0.057 | 0.120 | 0.152 | 0.206 | 0.257 | 0.125 |
| Naples | 0.664 | 0.546 | 0.608 | 0.363 | 0.687 | 0.503 | 0.380 | 0.655 | 0.575 | 0.743 |
| Oslo | 0.105 | 0.105 | 0.226 | 0.082 | 0.065 | 0.173 | 0.084 | 0.231 | 0.231 | 0.289 |
| Ostrava | 0.102 | 0.149 | 0.135 | 0.088 | 0.101 | 0.230 | 0.106 | 0.739 | 0.358 | 0.393 |
| Oulu | 0.431 | 0.332 | 0.111 | 0.053 | 0.095 | 0.152 | 0.061 | 0.108 | 0.118 | 0.143 |
| Oviedo | 0.217 | 0.205 | 0.223 | 0.196 | 0.165 | 0.097 | 0.173 | 0.223 | 0.259 | 0.070 |
| Palermo | 0.744 | 0.608 | 0.615 | 0.354 | 0.637 | 0.532 | 0.450 | 0.633 | 0.673 | 0.913 |
| Paris | 0.233 | 0.196 | 0.290 | 0.113 | 0.155 | 0.181 | 0.152 | 0.694 | 0.490 | 0.572 |
| Piatra Neamt | 0.198 | 0.514 | 0.212 | 0.229 | 0.161 | 0.345 | 0.177 | 0.159 | 0.228 | 0.172 |
| Podgorica | 0.575 | 0.512 | 0.349 | 0.385 | 0.445 | 0.258 | 0.271 | 0.404 | 0.331 | 0.386 |
| Praha | 0.096 | 0.142 | 0.122 | 0.087 | 0.206 | 0.169 | 0.098 | 0.383 | 0.428 | 0.421 |
| Rennes | 0.144 | 0.136 | 0.110 | 0.097 | 0.066 | 0.101 | 0.076 | 0.203 | 0.182 | 0.207 |
| Reykjavík | 0.260 | 0.273 | 0.091 | 0.072 | 0.176 | 0.196 | 0.126 | 0.172 | 0.200 | 0.272 |
| Riga | 0.195 | 0.504 | 0.256 | 0.106 | 0.130 | 0.214 | 0.231 | 0.299 | 0.264 | 0.254 |
| Rome | 0.719 | 0.490 | 0.353 | 0.289 | 0.402 | 0.460 | 0.373 | 0.676 | 0.526 | 0.911 |
| Rostock | 0.087 | 0.134 | 0.162 | 0.293 | 0.153 | 0.145 | 0.121 | 0.154 | 0.153 | 0.273 |
| Rotterdam | 0.073 | 0.093 | 0.119 | 0.076 | 0.159 | 0.074 | 0.089 | 0.362 | 0.226 | 0.320 |
| Skopje | 0.344 | 0.642 | 0.321 | 0.317 | 0.558 | 0.490 | 0.329 | 0.875 | 0.580 | 0.786 |
| Sofia | 0.188 | 0.494 | 0.362 | 0.195 | 0.341 | 0.386 | 0.317 | 0.704 | 0.609 | 0.654 |
| Stockholm | 0.164 | 0.207 | 0.214 | 0.099 | 0.093 | 0.111 | 0.132 | 0.203 | 0.218 | 0.282 |
| Strasbourg | 0.127 | 0.128 | 0.145 | 0.064 | 0.106 | 0.110 | 0.112 | 0.486 | 0.323 | 0.255 |
| Tallinn | 0.133 | 0.388 | 0.135 | 0.076 | 0.122 | 0.175 | 0.102 | 0.216 | 0.289 | 0.202 |
| Tirana | 0.671 | 0.545 | 0.543 | 0.451 | 0.533 | 0.413 | 0.278 | 0.720 | 0.549 | 0.470 |
| Turin | 0.345 | 0.272 | 0.179 | 0.100 | 0.186 | 0.145 | 0.202 | 0.669 | 0.440 | 0.542 |
| Tyneside conurbation | 0.113 | 0.139 | 0.158 | 0.136 | 0.144 | 0.152 | 0.078 | 0.142 | 0.146 | 0.310 |
| Valletta | 0.301 | 0.224 | 0.353 | 0.514 | 0.554 | 0.535 | 0.111 | 0.648 | 0.544 | 0.455 |
| Verona | 0.319 | 0.171 | 0.238 | 0.157 | 0.258 | 0.245 | 0.134 | 0.534 | 0.421 | 0.308 |
| Vilnius | 0.194 | 0.373 | 0.260 | 0.088 | 0.125 | 0.160 | 0.228 | 0.263 | 0.244 | 0.212 |
| Warszawa | 0.147 | 0.568 | 0.147 | 0.071 | 0.154 | 0.249 | 0.154 | 0.494 | 0.521 | 0.325 |
| Wien | 0.046 | 0.142 | 0.175 | 0.045 | 0.100 | 0.102 | 0.140 | 0.150 | 0.237 | 0.130 |
| Zagreb | 0.206 | 0.339 | 0.344 | 0.101 | 0.182 | 0.176 | 0.244 | 0.293 | 0.328 | 0.294 |
| Zurich | 0.033 | 0.063 | 0.052 | 0.032 | 0.093 | 0.106 | 0.054 | 0.072 | 0.201 | 0.101 |
Table A2.
Degrees of membership to IFVs for cities.
| City | C1 | C2 | C3 | C4 | C5 | C6 | C7 | C8 | C9 | C10 |
|---|---|---|---|---|---|---|---|---|---|---|
| Aalborg | 0.710 | 0.806 | 0.758 | 0.917 | 0.902 | 0.819 | 0.829 | 0.860 | 0.847 | 0.797 |
| Amsterdam | 0.813 | 0.890 | 0.755 | 0.868 | 0.876 | 0.864 | 0.685 | 0.664 | 0.663 | 0.630 |
| Ankara | 0.560 | 0.638 | 0.484 | 0.539 | 0.687 | 0.644 | 0.523 | 0.637 | 0.541 | 0.630 |
| Antalya | 0.538 | 0.667 | 0.566 | 0.614 | 0.764 | 0.705 | 0.553 | 0.724 | 0.591 | 0.744 |
| Antwerpen | 0.695 | 0.917 | 0.807 | 0.894 | 0.842 | 0.881 | 0.849 | 0.631 | 0.722 | 0.759 |
| Athina | 0.705 | 0.339 | 0.369 | 0.638 | 0.289 | 0.344 | 0.489 | 0.279 | 0.323 | 0.301 |
| Barcelona | 0.724 | 0.672 | 0.657 | 0.744 | 0.697 | 0.798 | 0.599 | 0.364 | 0.433 | 0.598 |
| Belfast | 0.720 | 0.739 | 0.670 | 0.874 | 0.844 | 0.803 | 0.803 | 0.823 | 0.825 | 0.730 |
| Beograd | 0.365 | 0.398 | 0.707 | 0.754 | 0.626 | 0.610 | 0.608 | 0.400 | 0.486 | 0.366 |
| Berlin | 0.829 | 0.831 | 0.587 | 0.841 | 0.868 | 0.797 | 0.544 | 0.701 | 0.596 | 0.480 |
| Białystok | 0.739 | 0.455 | 0.758 | 0.875 | 0.909 | 0.892 | 0.734 | 0.866 | 0.797 | 0.915 |
| Bologna | 0.672 | 0.798 | 0.712 | 0.834 | 0.853 | 0.816 | 0.705 | 0.454 | 0.585 | 0.502 |
| Bordeaux | 0.834 | 0.885 | 0.762 | 0.821 | 0.838 | 0.876 | 0.808 | 0.767 | 0.740 | 0.664 |
| Braga | 0.640 | 0.749 | 0.728 | 0.732 | 0.715 | 0.868 | 0.853 | 0.817 | 0.751 | 0.818 |
| Bratislava | 0.570 | 0.449 | 0.466 | 0.786 | 0.544 | 0.672 | 0.607 | 0.526 | 0.596 | 0.310 |
| Bruxelles | 0.698 | 0.843 | 0.665 | 0.815 | 0.840 | 0.784 | 0.603 | 0.504 | 0.539 | 0.409 |
| Bucharest | 0.482 | 0.419 | 0.432 | 0.689 | 0.615 | 0.547 | 0.481 | 0.197 | 0.307 | 0.369 |
| Budapest | 0.681 | 0.400 | 0.550 | 0.797 | 0.693 | 0.789 | 0.503 | 0.487 | 0.491 | 0.429 |
| Burgas | 0.782 | 0.432 | 0.680 | 0.697 | 0.811 | 0.820 | 0.703 | 0.296 | 0.543 | 0.711 |
| Cardiff | 0.735 | 0.808 | 0.777 | 0.925 | 0.908 | 0.863 | 0.756 | 0.837 | 0.785 | 0.739 |
| Cluj-Napoca | 0.690 | 0.521 | 0.728 | 0.831 | 0.660 | 0.732 | 0.695 | 0.506 | 0.485 | 0.687 |
| Diyarbakir | 0.520 | 0.582 | 0.443 | 0.554 | 0.692 | 0.722 | 0.538 | 0.708 | 0.542 | 0.544 |
| Dortmund | 0.832 | 0.807 | 0.683 | 0.881 | 0.907 | 0.820 | 0.726 | 0.786 | 0.721 | 0.615 |
| Dublin | 0.720 | 0.603 | 0.745 | 0.873 | 0.865 | 0.745 | 0.796 | 0.834 | 0.856 | 0.624 |
| Essen | 0.660 | 0.863 | 0.523 | 0.823 | 0.830 | 0.773 | 0.644 | 0.775 | 0.702 | 0.586 |
| Gdańsk | 0.811 | 0.481 | 0.769 | 0.882 | 0.835 | 0.835 | 0.714 | 0.759 | 0.657 | 0.739 |
| Genève | 0.822 | 0.893 | 0.780 | 0.838 | 0.918 | 0.891 | 0.814 | 0.692 | 0.667 | 0.742 |
| Glasgow | 0.768 | 0.808 | 0.784 | 0.882 | 0.879 | 0.810 | 0.707 | 0.737 | 0.842 | 0.642 |
| Graz | 0.757 | 0.904 | 0.667 | 0.861 | 0.768 | 0.855 | 0.836 | 0.489 | 0.753 | 0.814 |
| Groningen | 0.757 | 0.904 | 0.767 | 0.892 | 0.898 | 0.890 | 0.859 | 0.819 | 0.806 | 0.812 |
| Hamburg | 0.878 | 0.825 | 0.634 | 0.900 | 0.889 | 0.824 | 0.643 | 0.782 | 0.690 | 0.719 |
| Helsinki | 0.870 | 0.737 | 0.816 | 0.845 | 0.918 | 0.831 | 0.764 | 0.878 | 0.807 | 0.797 |
| Irakleio | 0.559 | 0.478 | 0.534 | 0.526 | 0.308 | 0.499 | 0.558 | 0.736 | 0.474 | 0.368 |
| Istanbul | 0.569 | 0.628 | 0.461 | 0.567 | 0.558 | 0.560 | 0.497 | 0.527 | 0.344 | 0.618 |
| København | 0.776 | 0.789 | 0.587 | 0.842 | 0.900 | 0.803 | 0.652 | 0.661 | 0.687 | 0.708 |
| Košice | 0.521 | 0.594 | 0.554 | 0.833 | 0.727 | 0.832 | 0.746 | 0.537 | 0.564 | 0.627 |
| Kraków | 0.766 | 0.503 | 0.732 | 0.892 | 0.716 | 0.839 | 0.712 | 0.179 | 0.480 | 0.675 |
| Lefkosia | 0.400 | 0.612 | 0.496 | 0.590 | 0.536 | 0.558 | 0.787 | 0.624 | 0.647 | 0.622 |
| Leipzig | 0.774 | 0.831 | 0.630 | 0.907 | 0.900 | 0.856 | 0.555 | 0.828 | 0.685 | 0.707 |
| Liège | 0.563 | 0.875 | 0.680 | 0.779 | 0.735 | 0.738 | 0.764 | 0.535 | 0.663 | 0.410 |
| Lille | 0.766 | 0.881 | 0.805 | 0.812 | 0.807 | 0.786 | 0.821 | 0.546 | 0.656 | 0.596 |
| Lisboa | 0.544 | 0.604 | 0.565 | 0.678 | 0.670 | 0.722 | 0.676 | 0.520 | 0.513 | 0.416 |
| Ljubljana | 0.721 | 0.684 | 0.749 | 0.851 | 0.868 | 0.841 | 0.802 | 0.743 | 0.694 | 0.855 |
| London | 0.840 | 0.699 | 0.662 | 0.786 | 0.921 | 0.829 | 0.614 | 0.536 | 0.746 | 0.659 |
| Luxembourg | 0.813 | 0.851 | 0.790 | 0.844 | 0.884 | 0.876 | 0.747 | 0.801 | 0.766 | 0.937 |
| Madrid | 0.724 | 0.632 | 0.527 | 0.619 | 0.674 | 0.697 | 0.512 | 0.319 | 0.464 | 0.383 |
| Málaga | 0.744 | 0.648 | 0.663 | 0.751 | 0.608 | 0.745 | 0.698 | 0.701 | 0.519 | 0.422 |
| Malmö | 0.723 | 0.663 | 0.705 | 0.908 | 0.953 | 0.886 | 0.523 | 0.818 | 0.849 | 0.679 |
| Manchester | 0.813 | 0.788 | 0.698 | 0.795 | 0.786 | 0.808 | 0.685 | 0.739 | 0.809 | 0.588 |
| Marseille | 0.667 | 0.831 | 0.540 | 0.743 | 0.635 | 0.593 | 0.633 | 0.472 | 0.565 | 0.253 |
| Miskolc | 0.630 | 0.405 | 0.551 | 0.753 | 0.732 | 0.762 | 0.626 | 0.536 | 0.674 | 0.481 |
| Munich | 0.837 | 0.896 | 0.691 | 0.905 | 0.931 | 0.858 | 0.628 | 0.778 | 0.716 | 0.865 |
| Naples | 0.297 | 0.441 | 0.340 | 0.611 | 0.298 | 0.481 | 0.570 | 0.333 | 0.416 | 0.253 |
| Oslo | 0.881 | 0.869 | 0.651 | 0.888 | 0.929 | 0.798 | 0.743 | 0.754 | 0.755 | 0.702 |
| Ostrava | 0.818 | 0.804 | 0.753 | 0.872 | 0.885 | 0.736 | 0.796 | 0.250 | 0.623 | 0.597 |
| Oulu | 0.476 | 0.633 | 0.835 | 0.861 | 0.878 | 0.825 | 0.837 | 0.883 | 0.859 | 0.848 |
| Oviedo | 0.701 | 0.769 | 0.679 | 0.729 | 0.825 | 0.898 | 0.663 | 0.750 | 0.735 | 0.921 |
| Palermo | 0.207 | 0.366 | 0.286 | 0.598 | 0.341 | 0.464 | 0.474 | 0.349 | 0.320 | 0.076 |
| Paris | 0.749 | 0.795 | 0.600 | 0.857 | 0.836 | 0.805 | 0.690 | 0.293 | 0.502 | 0.428 |
| Piatra Neamt | 0.596 | 0.433 | 0.615 | 0.651 | 0.804 | 0.623 | 0.707 | 0.835 | 0.760 | 0.817 |
| Podgorica | 0.317 | 0.479 | 0.638 | 0.594 | 0.553 | 0.734 | 0.712 | 0.592 | 0.664 | 0.611 |
| Praha | 0.874 | 0.852 | 0.781 | 0.861 | 0.786 | 0.811 | 0.791 | 0.598 | 0.561 | 0.569 |
| Rennes | 0.835 | 0.837 | 0.817 | 0.870 | 0.919 | 0.882 | 0.862 | 0.781 | 0.807 | 0.787 |
| Reykjavík | 0.427 | 0.660 | 0.812 | 0.871 | 0.752 | 0.746 | 0.759 | 0.788 | 0.736 | 0.712 |
| Riga | 0.693 | 0.446 | 0.530 | 0.840 | 0.847 | 0.752 | 0.572 | 0.682 | 0.720 | 0.738 |
| Rome | 0.253 | 0.496 | 0.558 | 0.688 | 0.588 | 0.534 | 0.535 | 0.315 | 0.463 | 0.082 |
| Rostock | 0.855 | 0.840 | 0.643 | 0.620 | 0.838 | 0.836 | 0.550 | 0.839 | 0.841 | 0.722 |
| Rotterdam | 0.889 | 0.862 | 0.755 | 0.855 | 0.829 | 0.910 | 0.766 | 0.616 | 0.748 | 0.675 |
| Skopje | 0.563 | 0.345 | 0.632 | 0.631 | 0.437 | 0.509 | 0.638 | 0.125 | 0.417 | 0.212 |
| Sofia | 0.718 | 0.476 | 0.376 | 0.711 | 0.637 | 0.569 | 0.445 | 0.256 | 0.374 | 0.337 |
| Stockholm | 0.804 | 0.785 | 0.577 | 0.886 | 0.906 | 0.860 | 0.663 | 0.776 | 0.768 | 0.708 |
| Strasbourg | 0.835 | 0.856 | 0.771 | 0.874 | 0.886 | 0.874 | 0.804 | 0.497 | 0.669 | 0.741 |
| Tallinn | 0.747 | 0.576 | 0.650 | 0.872 | 0.849 | 0.787 | 0.613 | 0.769 | 0.694 | 0.787 |
| Tirana | 0.283 | 0.446 | 0.441 | 0.508 | 0.467 | 0.584 | 0.696 | 0.279 | 0.450 | 0.527 |
| Turin | 0.615 | 0.711 | 0.653 | 0.772 | 0.799 | 0.846 | 0.620 | 0.324 | 0.551 | 0.458 |
| Tyneside conurbation | 0.799 | 0.851 | 0.706 | 0.806 | 0.835 | 0.812 | 0.737 | 0.831 | 0.835 | 0.677 |
| Valletta | 0.450 | 0.685 | 0.443 | 0.336 | 0.430 | 0.420 | 0.661 | 0.344 | 0.448 | 0.539 |
| Verona | 0.563 | 0.815 | 0.654 | 0.794 | 0.732 | 0.748 | 0.725 | 0.454 | 0.565 | 0.683 |
| Vilnius | 0.590 | 0.594 | 0.529 | 0.821 | 0.849 | 0.829 | 0.525 | 0.712 | 0.737 | 0.779 |
| Warszawa | 0.763 | 0.387 | 0.659 | 0.846 | 0.833 | 0.735 | 0.627 | 0.475 | 0.466 | 0.661 |
| Wien | 0.950 | 0.848 | 0.642 | 0.944 | 0.895 | 0.872 | 0.721 | 0.844 | 0.746 | 0.867 |
| Zagreb | 0.765 | 0.641 | 0.570 | 0.850 | 0.812 | 0.807 | 0.708 | 0.680 | 0.660 | 0.688 |
| Zurich | 0.962 | 0.919 | 0.820 | 0.938 | 0.900 | 0.890 | 0.856 | 0.915 | 0.775 | 0.895 |
Table A3.
Degrees of hesitancy for IFVs for cities.
| City | C1 | C2 | C3 | C4 | C5 | C6 | C7 | C8 | C9 | C10 |
|---|---|---|---|---|---|---|---|---|---|---|
| Aalborg | 0.131 | 0.040 | 0.159 | 0.038 | 0.023 | 0.056 | 0.099 | 0.027 | 0.011 | 0.016 |
| Amsterdam | 0.039 | 0.022 | 0.137 | 0.071 | 0.010 | 0.015 | 0.210 | 0.051 | 0.020 | 0.013 |
| Ankara | 0.057 | 0.001 | 0.167 | 0.128 | 0.013 | 0.009 | 0.072 | 0.008 | 0.004 | 0.003 |
| Antalya | 0.101 | 0.009 | 0.157 | 0.109 | 0.008 | 0.015 | 0.106 | 0.011 | 0.015 | 0.006 |
| Antwerpen | 0.054 | 0.007 | 0.096 | 0.029 | 0.010 | 0.006 | 0.051 | 0.020 | 0.027 | 0.024 |
| Athina | 0.042 | 0.034 | 0.097 | 0.039 | 0.004 | 0.008 | 0.145 | 0.012 | 0.011 | 0.002 |
| Barcelona | 0.049 | 0.013 | 0.094 | 0.067 | 0.009 | 0.021 | 0.125 | 0.011 | 0.004 | 0.016 |
| Belfast | 0.062 | 0.025 | 0.147 | 0.041 | 0.006 | 0.026 | 0.091 | 0.021 | 0.028 | 0.008 |
| Beograd | 0.091 | 0.018 | 0.072 | 0.043 | 0.004 | 0.016 | 0.053 | 0.018 | 0.014 | 0.008 |
| Berlin | 0.036 | 0.014 | 0.178 | 0.042 | 0.006 | 0.003 | 0.174 | 0.020 | 0.007 | 0.013 |
| Białystok | 0.118 | 0.036 | 0.110 | 0.036 | 0.005 | 0.008 | 0.135 | 0.011 | 0.005 | 0.010 |
| Bologna | 0.057 | 0.024 | 0.152 | 0.058 | 0.011 | 0.017 | 0.145 | 0.011 | 0.013 | 0.004 |
| Bordeaux | 0.023 | 0.008 | 0.077 | 0.034 | 0.017 | 0.013 | 0.082 | 0.014 | 0.006 | 0.010 |
| Braga | 0.151 | 0.011 | 0.086 | 0.060 | 0.012 | 0.011 | 0.053 | 0.015 | 0.002 | 0.004 |
| Bratislava | 0.121 | 0.029 | 0.122 | 0.083 | 0.012 | 0.039 | 0.195 | 0.038 | 0.012 | 0.011 |
| Bruxelles | 0.042 | 0.015 | 0.140 | 0.070 | 0.009 | 0.022 | 0.127 | 0.010 | 0.010 | 0.008 |
| Bucharest | 0.098 | 0.044 | 0.219 | 0.132 | 0.024 | 0.015 | 0.128 | 0.009 | 0.009 | 0.014 |
| Budapest | 0.065 | 0.030 | 0.230 | 0.098 | 0.012 | 0.013 | 0.234 | 0.005 | 0.014 | 0.003 |
| Burgas | 0.107 | 0.029 | 0.144 | 0.109 | 0.018 | 0.013 | 0.161 | 0.018 | 0.014 | 0.008 |
| Cardiff | 0.076 | 0.015 | 0.090 | 0.029 | 0.012 | 0.016 | 0.174 | 0.019 | 0.015 | 0.014 |
| Cluj-Napoca | 0.151 | 0.045 | 0.125 | 0.065 | 0.028 | 0.015 | 0.086 | 0.014 | 0.014 | 0.009 |
| Diyarbakir | 0.049 | 0.010 | 0.123 | 0.082 | 0.001 | 0.013 | 0.014 | 0.031 | 0.004 | 0.018 |
| Dortmund | 0.059 | 0.031 | 0.147 | 0.043 | 0.002 | 0.023 | 0.145 | 0.018 | 0.034 | 0.015 |
| Dublin | 0.025 | 0.013 | 0.062 | 0.009 | 0.006 | 0.020 | 0.070 | 0.012 | 0.005 | 0.009 |
| Essen | 0.092 | 0.015 | 0.144 | 0.044 | 0.014 | 0.014 | 0.164 | 0.024 | 0.017 | 0.006 |
| Gdańsk | 0.066 | 0.030 | 0.115 | 0.049 | 0.012 | 0.015 | 0.175 | 0.022 | 0.017 | 0.023 |
| Genève | 0.042 | 0.021 | 0.130 | 0.069 | 0.020 | 0.013 | 0.114 | 0.025 | 0.022 | 0.018 |
| Glasgow | 0.054 | 0.022 | 0.072 | 0.041 | 0.014 | 0.031 | 0.168 | 0.022 | 0.010 | 0.011 |
| Graz | 0.014 | 0.014 | 0.155 | 0.025 | 0.011 | 0.011 | 0.079 | 0.010 | 0.007 | 0.006 |
| Groningen | 0.090 | 0.029 | 0.145 | 0.052 | 0.010 | 0.029 | 0.098 | 0.031 | 0.004 | 0.014 |
| Hamburg | 0.021 | 0.037 | 0.180 | 0.027 | 0.008 | 0.012 | 0.178 | 0.019 | 0.026 | 0.009 |
| Helsinki | 0.032 | 0.030 | 0.092 | 0.119 | 0.020 | 0.018 | 0.161 | 0.009 | 0.020 | 0.017 |
| Irakleio | 0.127 | 0.012 | 0.088 | 0.050 | 0.008 | 0.017 | 0.106 | 0.006 | 0.000 | 0.018 |
| Istanbul | 0.049 | 0.001 | 0.094 | 0.101 | 0.010 | 0.007 | 0.034 | 0.012 | 0.008 | 0.013 |
| København | 0.042 | 0.052 | 0.215 | 0.065 | 0.017 | 0.050 | 0.197 | 0.040 | 0.015 | 0.009 |
| Košice | 0.076 | 0.024 | 0.100 | 0.059 | 0.007 | 0.034 | 0.130 | 0.032 | 0.022 | 0.010 |
| Kraków | 0.042 | 0.017 | 0.121 | 0.021 | 0.020 | 0.015 | 0.172 | 0.014 | 0.016 | 0.004 |
| Lefkosia | 0.219 | 0.039 | 0.185 | 0.091 | 0.014 | 0.016 | 0.095 | 0.040 | 0.005 | 0.010 |
| Leipzig | 0.041 | 0.011 | 0.211 | 0.023 | 0.010 | 0.023 | 0.260 | 0.023 | 0.027 | 0.013 |
| Liège | 0.067 | 0.009 | 0.133 | 0.067 | 0.030 | 0.038 | 0.099 | 0.036 | 0.039 | 0.013 |
| Lille | 0.060 | 0.010 | 0.073 | 0.079 | 0.022 | 0.025 | 0.065 | 0.031 | 0.012 | 0.011 |
| Lisboa | 0.089 | 0.035 | 0.153 | 0.098 | 0.037 | 0.016 | 0.135 | 0.047 | 0.008 | 0.016 |
| Ljubljana | 0.054 | 0.020 | 0.100 | 0.030 | 0.001 | 0.013 | 0.082 | 0.015 | 0.003 | 0.003 |
| London | 0.022 | 0.032 | 0.136 | 0.042 | 0.004 | 0.035 | 0.219 | 0.024 | 0.016 | 0.009 |
| Luxembourg | 0.029 | 0.017 | 0.090 | 0.069 | 0.013 | 0.027 | 0.122 | 0.016 | 0.014 | 0.000 |
| Madrid | 0.036 | 0.028 | 0.097 | 0.067 | 0.008 | 0.022 | 0.118 | 0.027 | 0.022 | 0.001 |
| Málaga | 0.067 | 0.014 | 0.054 | 0.048 | 0.027 | 0.023 | 0.097 | 0.027 | 0.006 | 0.004 |
| Malmö | 0.064 | 0.036 | 0.188 | 0.030 | 0.006 | 0.016 | 0.245 | 0.011 | 0.018 | 0.010 |
| Manchester | 0.068 | 0.024 | 0.128 | 0.053 | 0.022 | 0.022 | 0.195 | 0.026 | 0.022 | 0.018 |
| Marseille | 0.051 | 0.012 | 0.119 | 0.045 | 0.023 | 0.016 | 0.129 | 0.021 | 0.005 | 0.005 |
| Miskolc | 0.116 | 0.021 | 0.212 | 0.160 | 0.015 | 0.038 | 0.214 | 0.004 | 0.006 | 0.008 |
| Munich | 0.015 | 0.024 | 0.186 | 0.029 | 0.012 | 0.023 | 0.221 | 0.016 | 0.026 | 0.009 |
| Naples | 0.039 | 0.013 | 0.052 | 0.026 | 0.016 | 0.016 | 0.050 | 0.012 | 0.009 | 0.004 |
| Oslo | 0.014 | 0.026 | 0.122 | 0.030 | 0.006 | 0.029 | 0.173 | 0.015 | 0.014 | 0.009 |
| Ostrava | 0.080 | 0.047 | 0.112 | 0.041 | 0.014 | 0.034 | 0.099 | 0.011 | 0.019 | 0.010 |
| Oulu | 0.092 | 0.036 | 0.054 | 0.086 | 0.027 | 0.024 | 0.102 | 0.009 | 0.023 | 0.009 |
| Oviedo | 0.081 | 0.025 | 0.098 | 0.075 | 0.010 | 0.005 | 0.164 | 0.027 | 0.006 | 0.009 |
| Palermo | 0.049 | 0.027 | 0.099 | 0.048 | 0.021 | 0.005 | 0.077 | 0.018 | 0.007 | 0.011 |
| Paris | 0.018 | 0.009 | 0.111 | 0.030 | 0.009 | 0.014 | 0.157 | 0.014 | 0.008 | 0.000 |
| Piatra Neamt | 0.206 | 0.053 | 0.173 | 0.120 | 0.035 | 0.032 | 0.116 | 0.006 | 0.011 | 0.011 |
| Podgorica | 0.108 | 0.009 | 0.013 | 0.021 | 0.002 | 0.007 | 0.018 | 0.004 | 0.005 | 0.003 |
| Praha | 0.030 | 0.006 | 0.097 | 0.052 | 0.007 | 0.020 | 0.111 | 0.019 | 0.011 | 0.010 |
| Rennes | 0.021 | 0.028 | 0.073 | 0.033 | 0.015 | 0.016 | 0.062 | 0.017 | 0.012 | 0.006 |
| Reykjavík | 0.313 | 0.067 | 0.097 | 0.057 | 0.072 | 0.058 | 0.115 | 0.039 | 0.064 | 0.016 |
| Riga | 0.112 | 0.050 | 0.214 | 0.054 | 0.023 | 0.034 | 0.197 | 0.019 | 0.016 | 0.008 |
| Rome | 0.028 | 0.014 | 0.088 | 0.022 | 0.010 | 0.006 | 0.092 | 0.008 | 0.011 | 0.006 |
| Rostock | 0.058 | 0.026 | 0.195 | 0.087 | 0.010 | 0.019 | 0.329 | 0.007 | 0.006 | 0.005 |
| Rotterdam | 0.039 | 0.045 | 0.126 | 0.069 | 0.012 | 0.015 | 0.145 | 0.022 | 0.026 | 0.005 |
| Skopje | 0.093 | 0.012 | 0.047 | 0.052 | 0.004 | 0.001 | 0.032 | 0.000 | 0.004 | 0.002 |
| Sofia | 0.094 | 0.030 | 0.262 | 0.093 | 0.022 | 0.045 | 0.238 | 0.041 | 0.017 | 0.009 |
| Stockholm | 0.032 | 0.008 | 0.209 | 0.016 | 0.001 | 0.028 | 0.205 | 0.020 | 0.014 | 0.009 |
| Strasbourg | 0.039 | 0.016 | 0.084 | 0.062 | 0.008 | 0.016 | 0.083 | 0.017 | 0.007 | 0.003 |
| Tallinn | 0.120 | 0.036 | 0.215 | 0.051 | 0.028 | 0.038 | 0.285 | 0.016 | 0.016 | 0.011 |
| Tirana | 0.046 | 0.009 | 0.015 | 0.041 | 0.000 | 0.003 | 0.026 | 0.001 | 0.001 | 0.004 |
| Turin | 0.041 | 0.017 | 0.168 | 0.128 | 0.015 | 0.009 | 0.178 | 0.008 | 0.008 | 0.000 |
| Tyneside conurbation | 0.088 | 0.010 | 0.136 | 0.058 | 0.021 | 0.036 | 0.185 | 0.026 | 0.019 | 0.013 |
| Valletta | 0.249 | 0.091 | 0.204 | 0.151 | 0.016 | 0.045 | 0.229 | 0.008 | 0.008 | 0.006 |
| Verona | 0.119 | 0.014 | 0.107 | 0.050 | 0.010 | 0.007 | 0.141 | 0.012 | 0.014 | 0.009 |
| Vilnius | 0.216 | 0.032 | 0.211 | 0.091 | 0.025 | 0.011 | 0.247 | 0.024 | 0.018 | 0.009 |
| Warszawa | 0.091 | 0.045 | 0.194 | 0.083 | 0.013 | 0.017 | 0.219 | 0.031 | 0.013 | 0.014 |
| Wien | 0.004 | 0.011 | 0.183 | 0.011 | 0.005 | 0.025 | 0.139 | 0.006 | 0.017 | 0.003 |
| Zagreb | 0.030 | 0.020 | 0.086 | 0.048 | 0.006 | 0.016 | 0.048 | 0.027 | 0.012 | 0.018 |
| Zurich | 0.005 | 0.018 | 0.128 | 0.029 | 0.007 | 0.003 | 0.091 | 0.013 | 0.025 | 0.004 |
Table A4.
Values of IFT coefficients for cities.
| City | IFT Coefficient | City | IFT Coefficient | City | IFT Coefficient | City | IFT Coefficient |
|---|---|---|---|---|---|---|---|
| Aalborg | 0.837 | Diyarbakir | 0.598 | Ljubljana | 0.786 | Reykjavík | 0.747 |
| Amsterdam | 0.776 | Dortmund | 0.786 | London | 0.737 | Riga | 0.699 |
| Ankara | 0.609 | Dublin | 0.764 | Luxembourg | 0.839 | Rome | 0.470 |
| Antalya | 0.667 | Essen | 0.729 | Madrid | 0.571 | Rostock | 0.769 |
| Antwerpen | 0.798 | Gdańsk | 0.752 | Málaga | 0.658 | Rotterdam | 0.793 |
| Athina | 0.434 | Genève | 0.809 | Malmö | 0.772 | Skopje | 0.468 |
| Barcelona | 0.637 | Glasgow | 0.794 | Manchester | 0.766 | Sofia | 0.528 |
| Belfast | 0.795 | Graz | 0.764 | Marseille | 0.603 | Stockholm | 0.781 |
| Beograd | 0.545 | Groningen | 0.850 | Miskolc | 0.639 | Strasbourg | 0.772 |
| Berlin | 0.711 | Hamburg | 0.785 | Munich | 0.813 | Tallinn | 0.751 |
| Białystok | 0.784 | Helsinki | 0.836 | Naples | 0.421 | Tirana | 0.477 |
| Bologna | 0.695 | Irakleio | 0.524 | Oslo | 0.800 | Turin | 0.643 |
| Bordeaux | 0.803 | Istanbul | 0.548 | Ostrava | 0.700 | Tyneside conurbation | 0.804 |
| Braga | 0.778 | København | 0.757 | Oulu | 0.786 | Valletta | 0.523 |
| Bratislava | 0.578 | Košice | 0.666 | Oviedo | 0.779 | Verona | 0.684 |
| Bruxelles | 0.673 | Kraków | 0.642 | Palermo | 0.377 | Vilnius | 0.718 |
| Bucharest | 0.490 | Lefkosia | 0.616 | Paris | 0.649 | Warszawa | 0.658 |
| Budapest | 0.604 | Leipzig | 0.774 | Piatra Neamt | 0.703 | Wien | 0.831 |
| Burgas | 0.654 | Liège | 0.683 | Podgorica | 0.594 | Zagreb | 0.725 |
| Cardiff | 0.821 | Lille | 0.749 | Praha | 0.744 | Zurich | 0.886 |
| Cluj-Napoca | 0.667 | Lisboa | 0.615 | Rennes | 0.846 | - | - |
Table A5.
Classification of cities with respect to the level of quality of life.
| City | Level | City | Level | City | Level | City | Level |
|---|---|---|---|---|---|---|---|
| Aalborg | high | Diyarbakir | medium | Ljubljana | high | Reykjavík | medium |
| Amsterdam | high | Dortmund | high | London | high | Riga | medium |
| Ankara | medium | Dublin | high | Luxembourg | high | Rome | medium |
| Antalya | medium | Essen | high | Madrid | medium | Rostock | high |
| Antwerpen | high | Gdańsk | high | Málaga | medium | Rotterdam | high |
| Athina | low | Genève | high | Malmö | high | Skopje | medium |
| Barcelona | medium | Glasgow | high | Manchester | high | Sofia | medium |
| Belfast | high | Graz | high | Marseille | medium | Stockholm | high |
| Beograd | medium | Groningen | high | Miskolc | medium | Strasbourg | high |
| Berlin | medium | Hamburg | high | Munich | high | Tallinn | medium |
| Białystok | high | Helsinki | high | Naples | low | Tirana | low |
| Bologna | medium | Irakleio | medium | Oslo | high | Turin | medium |
| Bordeaux | high | Istanbul | medium | Ostrava | high | Tyneside conurbation | high |
| Braga | high | København | high | Oulu | high | Valletta | medium |
| Bratislava | medium | Košice | medium | Oviedo | high | Verona | medium |
| Bruxelles | medium | Kraków | medium | Palermo | low | Vilnius | medium |
| Bucharest | medium | Lefkosia | medium | Paris | medium | Warszawa | medium |
| Budapest | medium | Leipzig | high | Piatra Neamt | medium | Wien | high |
| Burgas | medium | Liège | medium | Podgorica | medium | Zagreb | high |
| Cardiff | high | Lille | high | Praha | high | Zurich | high |
| Cluj-Napoca | medium | Lisboa | medium | Rennes | high | - | - |
Table A6.
Values of IFT coefficients for cities.
| City | IFT Coefficient | City | IFT Coefficient | City | IFT Coefficient | City | IFT Coefficient |
|---|---|---|---|---|---|---|---|
| Aalborg | 0.698 | Diyarbakir | 0.530 | Ljubljana | 0.667 | Reykjavík | 0.596 |
| Amsterdam | 0.637 | Dortmund | 0.639 | London | 0.616 | Riga | 0.553 |
| Ankara | 0.517 | Dublin | 0.657 | Luxembourg | 0.690 | Rome | 0.430 |
| Antalya | 0.567 | Essen | 0.601 | Madrid | 0.491 | Rostock | 0.618 |
| Antwerpen | 0.663 | Gdańsk | 0.609 | Málaga | 0.561 | Rotterdam | 0.650 |
| Athina | 0.386 | Genève | 0.665 | Malmö | 0.631 | Skopje | 0.412 |
| Barcelona | 0.533 | Glasgow | 0.669 | Manchester | 0.633 | Sofia | 0.427 |
| Belfast | 0.669 | Graz | 0.674 | Marseille | 0.514 | Stockholm | 0.635 |
| Beograd | 0.466 | Groningen | 0.704 | Miskolc | 0.507 | Strasbourg | 0.649 |
| Berlin | 0.598 | Hamburg | 0.647 | Munich | 0.683 | Tallinn | 0.590 |
| Białystok | 0.648 | Helsinki | 0.673 | Naples | 0.399 | Tirana | 0.392 |
| Bologna | 0.576 | Irakleio | 0.452 | Oslo | 0.660 | Turin | 0.543 |
| Bordeaux | 0.666 | Istanbul | 0.480 | Ostrava | 0.602 | Tyneside conurbation | 0.664 |
| Braga | 0.602 | København | 0.622 | Oulu | 0.633 | Valletta | 0.426 |
| Bratislava | 0.481 | Košice | 0.556 | Oviedo | 0.625 | Verona | 0.563 |
| Bruxelles | 0.552 | Kraków | 0.545 | Palermo | 0.366 | Vilnius | 0.554 |
| Bucharest | 0.409 | Lefkosia | 0.499 | Paris | 0.558 | Warszawa | 0.531 |
| Budapest | 0.493 | Leipzig | 0.628 | Piatra Neamt | 0.555 | Wien | 0.708 |
| Burgas | 0.550 | Liège | 0.554 | Podgorica | 0.523 | Zagreb | 0.607 |
| Cardiff | 0.688 | Lille | 0.616 | Praha | 0.631 | Zurich | 0.758 |
| Cluj-Napoca | 0.554 | Lisboa | 0.494 | Rennes | 0.693 | - | - |
References
- Cinelli, M.; Coles, S.R.; Kirwan, K. Analysis of the potentials of multi criteria decision analysis methods to conduct sustainability assessment. Ecol. Indic. 2014, 46, 138–148. [Google Scholar] [CrossRef] [Green Version]
- Diaz-Balteiro, L.; González-Pachón, J.; Romero, C. Measuring systems sustainability with multi-criteria methods: A critical review. Eur. J. Oper. Res. 2017, 258, 607–616. [Google Scholar] [CrossRef]
- Słowiński, R.; Greco, S.; Matarazzo, B. Axiomatization of utility, outranking and decision rule preference models for multiple-criteria classification problems under partial inconsistency with the dominance principle. Control Cybern. 2002, 31, 1005–1035. [Google Scholar]
- Churchman, C.W.; Ackoff, R.L. An approximate measure of value. J. Oper. Res. Soc. Am. 1954, 2, 172–187. [Google Scholar] [CrossRef]
- Hwang, C.L.; Yoon, K. Methods for Multiple Attribute Decision Making; Springer: Berlin/Heidelberg, Germany, 1981. [Google Scholar]
- Saaty, T.L. Decision making with the analytic hierarchy process. Int. J. Serv. Sci. 2008, 1, 83–98. [Google Scholar] [CrossRef] [Green Version]
- Opricovic, S.; Tzeng, G.-H. Compromise solution by MCDM methods: A comparative analysis of VIKOR and TOPSIS. Eur. J. Oper. Res. 2004, 156, 445–455. [Google Scholar] [CrossRef]
- Roszkowska, E.; Filipowicz-Chomko, M. Measuring sustainable development in the education area using multi-criteria methods: A case study. Cent. Eur. J. Oper. Res. 2019, 28, 1219–1241. [Google Scholar] [CrossRef] [Green Version]
- Balcerzak, A.P.; Pietrzak, M.B. TOPSIS analysis of changes of quality of human capital in European Union countries. In Proceedings of the ICEM 2016 International Scientific Conference Economics and Management. Smart and Efficient Economy: Preparation for Future Innovative Economy, Brno, Czech Republic, 19–20 May 2016; Simberova, I., Zizlavsky, O., Milichovsky, F., Eds.; pp. 80–85. [Google Scholar]
- Eyüboğlu, K. Comparison of developing countries’ macro performances with ahp and topsis methods. J. Fac. Econ. Adm. Sci. 2016, 6, 131–146. [Google Scholar]
- Karabiyik, C.; Kutlu, K.B. Benchmarking International Trade Performance of OECD Countries: TOPSIS and AHP Approaches. Gaziantep Univ. J. Soc. Sci. 2018, 17, 239–251. [Google Scholar] [CrossRef]
- Stankovic, J.; Dzunic, M.; Džunić, Ž.; Marinkovic, S. A multi-criteria evaluation of the European cities’ smart performance: Economic, social and environmental aspects. J. Econ. Bus. 2017, 35, 519–550. [Google Scholar] [CrossRef]
- Kaynak, S.; Altuntas, S.; Dereli, T. Comparing the innovation performance of EU candidate countries: An entropy-based TOPSIS approach. Econ. Res. 2017, 30, 31–54. [Google Scholar] [CrossRef]
- Vavrek, R.; Chovancová, J. Energy Performance of the European Union Countries in Terms of Reaching the European Energy Union Objectives. Energies 2020, 13, 5317. [Google Scholar] [CrossRef]
- Piwowarski, M.; Miłąszewicz, D.; Łatuszyńska, M.; Borawski, M.; Nermend, K. TOPSIS and VIKOR methods in study of sustainable development in the EU countries. Procedia Comput. Sci. 2018, 126, 1683–1692. [Google Scholar]
- Li, W.; Yi, P.; Zhang, D. Sustainability evaluation of cities in northeastern China using dynamic TOPSIS-entropy methods. Sustainability 2018, 10, 4542. [Google Scholar] [CrossRef] [Green Version]
- Tang, J.; Zhu, H.; Liu, Z.; Jia, F.; Zheng, X. Urban Sustainability Evaluation under the Modified TOPSIS Based on Grey Relational Analysis. Int. J. Environ. Res. Public Health 2019, 16, 256. [Google Scholar] [CrossRef] [Green Version]
- Stecyk, A. The AHP-TOPSIS Model in the Analysis of the Counties Sustainable Development in the West Pomeranian Province in 2010 and 2017. J. Ecol. Eng. 2019, 20, 233–244. [Google Scholar] [CrossRef]
- Łuczak, A.; Just, M. A Complex MCDM Procedure for the Assessment of Economic Development of Units at Different Government Levels. Mathematics 2020, 8, 1067. [Google Scholar] [CrossRef]
- Roszkowska, E.; Filipowicz-Chomko, M. Assessment of social development of polish voivodeships between 2005 and 2013 in the context of implementing the concept of sustainable development with the use of the TOPSIS method. Ekon. Sr. 2016, 2, 94–108. [Google Scholar]
- Sielska, A. Comparison of Healthcare Performance and its Determinants in European Countries Using TOPSIS Approach. Wars. Forum Econ. Sociol. 2019, 10, 71–94. [Google Scholar]
- Vavrek, R.; Ardielli, E. TOPSIS as Evaluation Tool of eGovernment Development in EU Member States. In Proceedings of the 5th International Multidisciplinary Scientific Conference on Social Sciences and Arts SGEM 2018, Sofia, Bulgaria, 26 August–1 September 2018; pp. 355–362. [Google Scholar]
- Ding, L.; Shao, Z.; Zhang, H.; Xu, C.; Wu, D. A comprehensive evaluation of urban sustainable development in China based on the TOPSIS-entropy method. Sustainability 2016, 8, 746. [Google Scholar] [CrossRef] [Green Version]
- Perło, D.; Roszkowska, E. The Application of Soft Modelling and TOPSIS Method for The Analysis of Competitiveness of Companies in Urban Functional Areas in Poland. Optimum. Studia Ekonomiczne. 2017, 5, 67–84. [Google Scholar] [CrossRef] [Green Version]
- Jefmański, B. Intuitionistic Fuzzy Synthetic Measure for Ordinal Data. In Classification and Data Analysis: Theory and Applications; Jajuga, K., Batóg, J., Walesiak, M., Eds.; Springer: Berlin/Heidelberg, Germany, 2020; pp. 53–72. [Google Scholar] [CrossRef]
- García-Cascales, M.S.; Lamata, M.T. On rank reversal and TOPSIS method. Math. Comput. Model. 2012, 56, 123–132. [Google Scholar] [CrossRef]
- Zadeh, L.A. Fuzzy sets. Inf. Control 1965, 8, 338–353. [Google Scholar] [CrossRef] [Green Version]
- Atanassov, K.T. Intuitionistic fuzzy sets. Fuzzy Sets Syst. 1986, 20, 87–96. [Google Scholar] [CrossRef]
- Atanassov, K.T. Intuitionistic fuzzy sets. In Intuitionistic Fuzzy Sets. Studies in Fuzziness and Soft Computing; Springer: Heidelberg, Germany, 2007; Volume 35, pp. 1–137. [Google Scholar] [CrossRef]
- Shen, F.; Ma, X.; Li, Z.; Xu, Z.; Cai, D. An extended intuitionistic fuzzy TOPSIS method based on a new distance measure with an application to credit risk evaluation. Inf. Sci. 2018, 428, 105–119. [Google Scholar] [CrossRef]
- Xu, Z. Intuitionistic fuzzy aggregation operators. IEEE Trans. Fuzzy Syst. 2007, 15, 1179–1187. [Google Scholar]
- Rouyendegh, B.D. Developing an integrated ANP and intuitionistic fuzzy TOPSIS model for supplier selection. J. Test. Eval. 2015, 43, 664–672. [Google Scholar] [CrossRef]
- Szmidt, E. Distances and Similarities in Intuitionistic Fuzzy Sets. In Studies in Fuzziness and Soft Computing; Springer: Cham, Switzerland, 2014; Volume 307. [Google Scholar] [CrossRef]
- Dymova, L.; Sevastjanov, P. Operations on intuitionistic fuzzy values in multiple criteria decision making. Sci. Res. Inst. Math. Comput. Sci. 2011, 10, 41–48. [Google Scholar]
- Burillo, P.; Bustince, H. Entropy on intuitionistic fuzzy sets and on interval-valued fuzzy sets. Fuzzy Sets Syst. 1996, 78, 305–316. [Google Scholar] [CrossRef]
- Szmidt, E.; Kacprzyk, J. Entropy for intuitionistic fuzzy sets. Fuzzy Sets Syst. 2001, 118, 467–477. [Google Scholar] [CrossRef]
- Hung, W.L.; Yang, M.S. Fuzzy entropy on intuitionistic fuzzy sets. Int. J. Intell. Syst. 2006, 21, 443–451. [Google Scholar] [CrossRef]
- Wang, T.; Liu, J.; Li, J.; Niu, C. An integrating OWA–TOPSIS framework in intuitionistic fuzzy settings for multiple attribute decision making. Comput. Ind. Eng. 2016, 98, 185–194. [Google Scholar] [CrossRef]
- Behzadian, M.; Khanmohammadi Otaghsara, S.; Yazdani, M.; Ignatius, J. A state-of the-art survey of TOPSIS applications. Expert Syst. Appl. 2012, 39, 13051–13069. [Google Scholar] [CrossRef]
- Zavadskas, E.K.; Mardani, A.; Turskis, Z.; Jusoh, A.; Nor, K.M. Development of TOPSIS method to solve complicated decision-making problems—An overview on developments from 2000 to 2015. Int. J. Inf. Technol. Decis. Mak. 2016, 15, 645–682. [Google Scholar] [CrossRef]
- Nădăban, S.; Dzitac, S.; Dzitac, I. Fuzzy TOPSIS: A general view. Procedia Comput. Sci. 2016, 91, 823–831. [Google Scholar] [CrossRef] [Green Version]
- Palczewski, K.; Sałabun, W. The fuzzy TOPSIS applications in the last decade. Procedia Comput. Sci. 2019, 159, 2294–2303. [Google Scholar] [CrossRef]
- Boran, F.E.; Genç, S.; Kurt, M.; Akay, D. A multi-criteria intuitionistic fuzzy group decision making for supplier selection with TOPSIS method. Expert Syst. Appl. 2009, 36, 11363–11368. [Google Scholar] [CrossRef]
- Boran, F.E. An integrated intuitionistic fuzzy multi criteria decision making method for facility location selection. Math. Comput. Appl. 2011, 16, 487–496. [Google Scholar] [CrossRef]
- Joshi, D.; Kumar, S. Intuitionistic fuzzy entropy and distance measure based TOPSIS method for multi-criteria decision making. Egypt. Inform. J. 2014, 15, 97–104. [Google Scholar] [CrossRef]
- Büyüközkan, G.; Güleryüz, S. An application of intuitionistic fuzzy topsis on mobile phone selection. In Proceedings of the 2015 IEEE International Conference on Fuzzy Systems (FUZZ-IEEE), Istanbul, Turkey, 1–8 November 2015. [Google Scholar] [CrossRef]
- Zulqarnain, M.; Dayan, F. Selection of best alternative for an automotive company by intuitionistic fuzzy TOPSIS method. Int. J. Sci. Technol. Res 2017, 6, 126–132. [Google Scholar]
- Rouyendegh, B.D.; Yildizbasi, A.; Arikan, Ü.Z. Using intuitionistic fuzzy TOPSIS in site selection of wind power plants in Turkey. Adv. Fuzzy Syst. 2018, 2018, 6703798. [Google Scholar]
- Chen, C.H. A new multi-criteria assessment model combining GRA techniques with intuitionistic fuzzy entropy-based TOPSIS method for sustainable building materials supplier selection. Sustainability 2019, 11, 2265. [Google Scholar] [CrossRef] [Green Version]
- Memari, A.; Dargi, A.; Jokar, M.R.A.; Ahmad, R.; Rahim, A.R.A. Sustainable supplier selection: A multi-criteria intuitionistic fuzzy TOPSIS method. J. Manuf. Syst. 2019, 50, 9–24. [Google Scholar] [CrossRef]
- Rouyendegh, B.D.; Yildizbasi, A.; Üstünyer, P. Intuitionistic fuzzy TOPSIS method for green supplier selection problem. Soft Comput. 2020, 24, 2215–2228. [Google Scholar] [CrossRef]
- Dymova, L.; Kaczmarek, K.; Sevastjanov, P.; Sułkowski, Ł.; Przybyszewski, K. An approach to generalization of the intuitionistic fuzzy TOPSIS method in the framework of evidence theory. J. Artif. Intell. Soft Comput. Res. 2021, 11, 157–175. [Google Scholar] [CrossRef]
- Maggino, F.; Ruviglioni, E. Obtaining weights: From objective to subjective approaches in view of more participative methods in the construction of composite indicators. In Proceedings of the NTTS: New Techniques and Technologies for Statistics, Brussels, Belgium, 18–20 February 2009; pp. 37–46. [Google Scholar]
- Report on the Quality of Life in European Cities; Publications Office of the European Union: Luxembourg, 2020.
- Dymova, L.; Kaczmarek, K.; Sevastjanov, P.; Kulawik, J. A Fuzzy Multiple Criteria Decision Making Approach with a Complete User-Friendly Computer Implementation. Entropy 2021, 23, 203. [Google Scholar] [CrossRef]
- Verma, R.; Sharma, B.D. A new measure of inaccuracy with its application to multi-criteria decision making under intuitionistic fuzzy environment. J. Intell. Fuzzy Syst. 2014, 27, 1811–1824. [Google Scholar] [CrossRef]
- Singh, S.; Sharma, S.; Lalotra, S. Generalized Correlation Coefficients of Intuitionistic Fuzzy Sets with Application to MAGDM and Clustering Analysis. Int. J. Fuzzy Syst. 2020, 22, 1582–1595. [Google Scholar] [CrossRef]
- Verma, R.; Sharma, B.D. Intuitionistic fuzzy Jensen-Rényi divergence: Applications to multiple-attribute decision making. Informatica 2013, 37, 399–409. [Google Scholar]
- Sotirov, S.; Sotirova, E.; Atanassova, V.; Atanassov, K.; Castillo, O.; Melin, P.; Petkov, T.; Surchev, S. A Hybrid Approach for Modular Neural Network Design Using Intercriteria Analysis and Intuitionistic Fuzzy Logic. Complex 2018, 2018, 3927951. [Google Scholar] [CrossRef]
Figure 1.
The IF-TOPSIS-based model for the evaluation of survey data.

Figure 2.
Cities with a medium level of quality of life of inhabitants compared with an average level of quality of life of inhabitants in this class.
Figure 2.
Cities with a medium level of quality of life of inhabitants compared with an average level of quality of life of inhabitants in this class.

Figure 3.
Cities with a high level of quality of life of inhabitants compared with an average level of quality of life of inhabitants in this class.
Figure 3.
Cities with a high level of quality of life of inhabitants compared with an average level of quality of life of inhabitants in this class.

Figure 4.
Cities with a very high level of quality of life of inhabitants compared with an average level of quality of life of inhabitants in this class.
Figure 4.
Cities with a very high level of quality of life of inhabitants compared with an average level of quality of life of inhabitants in this class.

Table 1.
A classification of TOPSIS methods based on an intuitionistic fuzzy framework with respect to rating the alternatives, rating the weights of criteria, reference points, and distance measure.
Table 1.
A classification of TOPSIS methods based on an intuitionistic fuzzy framework with respect to rating the alternatives, rating the weights of criteria, reference points, and distance measure.
| Authors | Rating the Alternatives | Rating the Weights of Criteria | Reference Points | Distance Measure |
|---|---|---|---|---|
| Joshi & Kumar [45] | Intuitionistic fuzzy numbers | Intuitionistic fuzzy entropy | Max and min | Max distance based on two parameters |
| Büyüközkan and Güleryüz [46] Boran et al. [43] Zulqarnain and Dayan [47] Memari et al. [50] Rouyendegh et al. [51] | Linguistic terms expressed by intuitionistic fuzzy sets | Linguistic terms expressed by intuitionistic fuzzy sets | Max and min | Euclidean distance based on three parameters |
| Shen et al. [30] | Intuitionistic fuzzy numbers | Maximizing deviation method | Max and min | Authors distance measure between the two intuitionistic fuzzy numbers |
| Rouyendegh [32] | Linguistic terms expressed by intuitionistic fuzzy sets | ANP | Max and min | Hamming distance |
| Rouyendegh et al. [48] | Intuitionistic fuzzy numbers | Intuitionistic fuzzy numbers | Max and min | Euclidean distance based on three parameters |
| Chen [49] | Intuitionistic fuzzy numbers | Intuitionistic fuzzy entropy | Max and min | Euclidean distance based on three parameters |
Table 2.
Example of scale item.
| Item | Strongly Disagree | Somewhat Disagree | Somewhat Agree | Strongly Agree | Do Not Know/ No Answer/ Refused to Answer |
|---|---|---|---|---|---|
| The procedures used by my local public administration are straightforward and easy to understand | 1 | 2 | 3 | 4 | 99 |
Table 3.
Example of reverse scale item.
| Item | Strongly Disagree | Somewhat Disagree | Somewhat Agree | Strongly Agree | Do Not Know/ No Answer/ Refused to Answer |
|---|---|---|---|---|---|
| There is corruption in my local administration | 1 | 2 | 3 | 4 | 99 |
Table 4.
Sociodemographic characteristic of respondents.
| Feature | Category | Percentage |
|---|---|---|
| Sex | Male | 47.739% |
| Female | 52.261% | |
| Age | 15–19 | 4.965% |
| 20–24 | 9.288% | |
| 25–34 | 18.683% | |
| 35–44 | 17.592% | |
| 45–54 | 15.872% | |
| 55–64 | 13.920% | |
| 65–74 | 11.407% | |
| 75+ | 8.273% | |
| Education | Less than primary education | 0.173% |
| Primary education | 1.308% | |
| Lower secondary education | 10.389% | |
| Upper secondary education | 35.257% | |
| Postsecondary nontertiary education | 8.056% | |
| Short-cycle tertiary education | 12.886% | |
| Bachelor or equivalent | 18.269% | |
| Master or equivalent | 10.986% | |
| Doctoral or equivalent | 2.221% | |
| Do not know/no answer/refused to answer | 0.455% |
Source: [54].
Table 5.
Assessment of cities (four-point Likert scale).
| City | Category * | C1 | C2 | C3 | C4 | C5 | C6 | C7 | C8 | C9 | C10 |
|---|---|---|---|---|---|---|---|---|---|---|---|
| 1 | 2.475% | 8.483% | 6.754% | 4.651% | 1.630% | 3.856% | 7.673% | 12.667% | 6.632% | 9.070% | |
| 2 | 11.307% | 18.444% | 13.397% | 12.601% | 5.811% | 9.753% | 9.008% | 31.283% | 17.195% | 24.155% | |
| London | 3 | 41.520% | 40.197% | 42.621% | 33.230% | 36.469% | 54.561% | 34.770% | 39.145% | 48.834% | 49.034% |
| 4 | 42.453% | 29.712% | 23.608% | 45.340% | 55.660% | 28.366% | 26.621% | 14.478% | 25.731% | 16.860% | |
| 99 | 2.244% | 3.163% | 13.620% | 4.179% | 0.430% | 3.464% | 21.928% | 2.426% | 1.608% | 0.882% | |
| 1 | 2.588% | 2.622% | 9.875% | 3.982% | 1.320% | 1.990% | 2.457% | 5.883% | 5.449% | 6.919% | |
| 2 | 13.835% | 18.048% | 11.525% | 5.887% | 8.025% | 9.158% | 10.767% | 14.454% | 16.355% | 21.308% | |
| Stockholm | 3 | 46.559% | 48.850% | 38.630% | 34.112% | 40.919% | 58.368% | 44.559% | 51.299% | 52.320% | 51.024% |
| 4 | 33.821% | 29.670% | 19.117% | 54.446% | 49.637% | 27.668% | 21.765% | 26.342% | 24.438% | 19.811% | |
| 99 | 3.198% | 0.811% | 20.853% | 1.572% | 0.098% | 2.817% | 20.452% | 2.022% | 1.438% | 0.938% | |
| 1 | 1.268% | 3.553% | 5.429% | 1.639% | 2.050% | 1.663% | 3.128% | 3.052% | 5.765% | 1.473% | |
| 2 | 3.309% | 10.632% | 12.052% | 2.864% | 7.974% | 8.575% | 10.848% | 11.917% | 17.973% | 11.517% | |
| Wien | 3 | 25.015% | 37.529% | 40.362% | 18.672% | 31.101% | 47.463% | 40.533% | 47.846% | 48.910% | 48.793% |
| 4 | 69.961% | 47.232% | 23.871% | 75.747% | 58.358% | 39.779% | 31.573% | 36.537% | 25.648% | 37.886% | |
| 99 | 0.446% | 1.054% | 18.287% | 1.077% | 0.516% | 2.519% | 13.919% | 0.648% | 1.704% | 0.331% | |
| Total | 700 | 700 | 700 | 700 | 700 | 700 | 700 | 700 | 700 | 700 |
* 1—very unsatisfied, 2—rather unsatisfied, 3—rather satisfied, 4—very satisfied, 99—do not know/no answer/refused to answer. Source: [54].
Table 6.
Assessment of cities (classes).
| City | Classes * | C1 | C2 | C3 | C4 | C5 | C6 | C7 | C8 | C9 | C10 |
|---|---|---|---|---|---|---|---|---|---|---|---|
| Unsatisfied | 13.783% | 26.928% | 20.151% | 17.252% | 7.441% | 13.609% | 16.681% | 43.951% | 23.827% | 33.225% | |
| London | Satisfied | 83.973% | 69.909% | 66.229% | 78.570% | 92.129% | 82.927% | 61.391% | 53.623% | 74.565% | 65.894% |
| 99 | 2.244% | 3.163% | 13.620% | 4.179% | 0.430% | 3.464% | 21.928% | 2.426% | 1.608% | 0.882% | |
| Unsatisfied | 16.422% | 20.669% | 21.400% | 9.870% | 9.346% | 11.147% | 13.224% | 20.337% | 21.804% | 28.227% | |
| Stockholm | Satisfied | 80.380% | 78.520% | 57.747% | 88.558% | 90.556% | 86.036% | 66.324% | 77.641% | 76.758% | 70.835% |
| 99 | 3.198% | 0.811% | 20.853% | 1.572% | 0.098% | 2.817% | 20.452% | 2.022% | 1.438% | 0.938% | |
| Unsatisfied | 4.578% | 14.185% | 17.481% | 4.504% | 10.025% | 10.239% | 13.975% | 14.969% | 23.738% | 12.990% | |
| Wien | Satisfied | 94.976% | 84.761% | 64.233% | 94.419% | 89.459% | 87.242% | 72.106% | 84.383% | 74.558% | 86.679% |
| 99 | 0.446% | 1.054% | 18.287% | 1.077% | 0.516% | 2.519% | 13.919% | 0.648% | 1.704% | 0.331% | |
| Total | 700 | 700 | 700 | 700 | 700 | 700 | 700 | 700 | 700 | 700 |
* Unsatisfied (1—very unsatisfied, 2—rather unsatisfied), satisfied (3—rather satisfied, 4—very satisfied), 99—do not know/no answer/refused to answer. Source: [54].
Table 7.
Assessment of cities with the use of IFVs.
| City | Parameter | C1 | C2 | C3 | C4 | C5 | C6 | C7 | C8 | C9 | C10 |
|---|---|---|---|---|---|---|---|---|---|---|---|
| London | 0.138 | 0.269 | 0.202 | 0.173 | 0.074 | 0.136 | 0.167 | 0.440 | 0.238 | 0.332 | |
| 0.840 | 0.699 | 0.662 | 0.786 | 0.921 | 0.829 | 0.614 | 0.536 | 0.746 | 0.659 | ||
| 0.022 | 0.032 | 0.136 | 0.042 | 0.004 | 0.035 | 0.219 | 0.024 | 0.016 | 0.009 | ||
| Stockholm | 0.164 | 0.207 | 0.214 | 0.099 | 0.093 | 0.111 | 0.132 | 0.203 | 0.218 | 0.282 | |
| 0.804 | 0.785 | 0.577 | 0.886 | 0.906 | 0.860 | 0.663 | 0.776 | 0.768 | 0.708 | ||
| 0.032 | 0.008 | 0.209 | 0.016 | 0.001 | 0.028 | 0.205 | 0.020 | 0.014 | 0.009 | ||
| Wien | 0.046 | 0.142 | 0.175 | 0.045 | 0.100 | 0.102 | 0.140 | 0.150 | 0.237 | 0.130 | |
| 0.950 | 0.848 | 0.642 | 0.944 | 0.895 | 0.872 | 0.721 | 0.844 | 0.746 | 0.867 | ||
| 0.004 | 0.011 | 0.183 | 0.011 | 0.005 | 0.025 | 0.139 | 0.006 | 0.017 | 0.003 |
Table 8.
The coordinates of intuitionistic fuzzy positive-ideal objects.
| Parameter | C1 | C2 | C3 | C4 | C5 | C6 | C7 | C8 | C9 | C10 |
|---|---|---|---|---|---|---|---|---|---|---|
| 0 | 0 | 0 | 0 | 0 | 0 | 0 | 0 | 0 | 0 | |
| 1 | 1 | 1 | 1 | 1 | 1 | 1 | 1 | 1 | 1 | |
| 0 | 0 | 0 | 0 | 0 | 0 | 0 | 0 | 0 | 0 |
Table 9.
The coordinates of intuitionistic fuzzy negative-ideal objects.
| Parameter | C1 | C2 | C3 | C4 | C5 | C6 | C7 | C8 | C9 | C10 |
|---|---|---|---|---|---|---|---|---|---|---|
| 1 | 1 | 1 | 1 | 1 | 1 | 1 | 1 | 1 | 1 | |
| 0 | 0 | 0 | 0 | 0 | 0 | 0 | 0 | 0 | 0 | |
| 0 | 0 | 0 | 0 | 0 | 0 | 0 | 0 | 0 | 0 |
Table 10.
Distances and IFT values.
| City | Distance from IFP | Distance from IFN | IFT Coefficient |
|---|---|---|---|
| London | 0.274 | 0.766 | 0.737 |
| Stockholm | 0.227 | 0.808 | 0.781 |
| Wien | 0.175 | 0.858 | 0.831 |
Table 11.
Ranking of cities in terms of quality of life based on IF-TOPSIS method.
| City | Rank | City | Rank | City | Rank | City | Rank |
|---|---|---|---|---|---|---|---|
| Aalborg | 5 | Diyarbakir | 68 | Ljubljana | 18 | Reykjavík | 38 |
| Amsterdam | 26 | Dortmund | 20 | London | 40 | Riga | 47 |
| Ankara | 65 | Dublin | 33 | Luxembourg | 4 | Rome | 79 |
| Antalya | 52 | Essen | 41 | Madrid | 71 | Rostock | 30 |
| Antwerpen | 14 | Gdańsk | 35 | Málaga | 55 | Rotterdam | 17 |
| Athina | 81 | Genève | 10 | Malmö | 29 | Skopje | 80 |
| Barcelona | 62 | Glasgow | 16 | Manchester | 31 | Sofia | 74 |
| Belfast | 15 | Graz | 32 | Marseille | 67 | Stockholm | 23 |
| Beograd | 73 | Groningen | 2 | Miskolc | 61 | Strasbourg | 28 |
| Berlin | 44 | Hamburg | 21 | Munich | 9 | Tallinn | 36 |
| Bialystok | 22 | Helsinki | 6 | Naples | 82 | Tirana | 78 |
| Bologna | 48 | Irakleio | 75 | Oslo | 13 | Turin | 59 |
| Bordeaux | 12 | Istanbul | 72 | Ostrava | 46 | Tyneside conurbation | 11 |
| Braga | 25 | København | 34 | Oulu | 19 | Valletta | 76 |
| Bratislava | 70 | Košice | 54 | Oviedo | 24 | Verona | 49 |
| Bruxelles | 51 | Kraków | 60 | Palermo | 83 | Vilnius | 43 |
| Bucharest | 77 | Lefkosia | 63 | Paris | 58 | Warszawa | 56 |
| Budapest | 66 | Leipzig | 27 | Piatra Neamt | 45 | Wien | 7 |
| Burgas | 57 | Liège | 50 | Podgorica | 69 | Zagreb | 42 |
| Cardiff | 8 | Lille | 37 | Praha | 39 | Zurich | 1 |
| Cluj-Napoca | 53 | Lisboa | 64 | Rennes | 3 | - | - |
Table 12.
Classification of cities with respect to level of quality of life.
| City | Level | City | Level | City | Level | City | Level |
|---|---|---|---|---|---|---|---|
| Aalborg | very high | Diyarbakir | medium | Ljubljana | high | Reykjavík | high |
| Amsterdam | high | Dortmund | high | London | high | Riga | high |
| Ankara | high | Dublin | high | Luxembourg | very high | Rome | medium |
| Antalya | high | Essen | high | Madrid | medium | Rostock | high |
| Antwerpen | high | Gdańsk | high | Málaga | high | Rotterdam | high |
| Athina | medium | Genève | very high | Malmö | high | Skopje | medium |
| Barcelona | high | Glasgow | high | Manchester | high | Sofia | medium |
| Belfast | high | Graz | high | Marseille | high | Stockholm | high |
| Beograd | medium | Groningen | very high | Miskolc | high | Strasbourg | high |
| Berlin | high | Hamburg | high | Munich | very high | Tallinn | high |
| Białystok | high | Helsinki | very high | Naples | medium | Tirana | medium |
| Bologna | high | Irakleio | medium | Oslo | very high | Turin | high |
| Bordeaux | very high | Istanbul | medium | Ostrava | high | Tyneside conurbation | very high |
| Braga | high | København | high | Oulu | high | Valletta | medium |
| Bratislava | medium | Košice | high | Oviedo | high | Verona | high |
| Bruxelles | high | Kraków | high | Palermo | low | Vilnius | high |
| Bucharest | medium | Lefkosia | high | Paris | high | Warszawa | high |
| Budapest | high | Leipzig | high | Piatra Neamt | high | Wien | very high |
| Burgas | high | Liège | high | Podgorica | medium | Zagreb | high |
| Cardiff | very high | Lille | high | Praha | high | Zurich | very high |
| Cluj-Napoca | high | Lisboa | high | Rennes | very high | - | - |
Table 13.
Descriptive statistics for classes describing the quality of life in cities.
| Descriptive Statistics | Level of Quality of Life | ||
|---|---|---|---|
| Medium | High | Very High | |
| Min | 0.421 | 0.603 | 0.800 |
| Max | 0.598 | 0.798 | 0.886 |
| Average | 0.518 | 0.718 | 0.829 |
| Standard deviation | 0.056 | 0.061 | 0.024 |
| Coefficient of variation | 0.109 | 0.085 | 0.029 |
Table 14.
Ranking of cities in terms of quality of life based on TOPSIS method.
| City | Rank | City | Rank | City | Rank | City | Rank |
|---|---|---|---|---|---|---|---|
| Aalborg | 4 | Diyarbakir | 62 | Ljubljana | 13 | Reykjavík | 43 |
| Amsterdam | 25 | Dortmund | 24 | London | 35 | Riga | 55 |
| Ankara | 64 | Dublin | 19 | Luxembourg | 6 | Rome | 75 |
| Antalya | 46 | Essen | 41 | Madrid | 70 | Rostock | 34 |
| Antwerpen | 17 | Gdańsk | 37 | Málaga | 48 | Rotterdam | 20 |
| Athina | 82 | Genève | 15 | Malmö | 30 | Skopje | 78 |
| Barcelona | 60 | Glasgow | 12 | Manchester | 28 | Sofia | 76 |
| Belfast | 11 | Graz | 9 | Marseille | 65 | Stockholm | 26 |
| Beograd | 73 | Groningen | 3 | Miskolc | 66 | Strasbourg | 21 |
| Berlin | 42 | Hamburg | 23 | Munich | 8 | Tallinn | 44 |
| Bialystok | 22 | Helsinki | 10 | Naples | 80 | Tirana | 81 |
| Bologna | 45 | Irakleio | 74 | Oslo | 18 | Turin | 59 |
| Bordeaux | 14 | Istanbul | 72 | Ostrava | 39 | Tyneside conurbation | 16 |
| Braga | 40 | København | 33 | Oulu | 27 | Valletta | 77 |
| Bratislava | 71 | Košice | 50 | Oviedo | 32 | Verona | 47 |
| Bruxelles | 56 | Kraków | 58 | Palermo | 83 | Vilnius | 52 |
| Bucharest | 79 | Lefkosia | 67 | Paris | 49 | Warszawa | 61 |
| Budapest | 69 | Leipzig | 31 | Piatra Neamt | 51 | Wien | 2 |
| Burgas | 57 | Liège | 53 | Podgorica | 63 | Zagreb | 38 |
| Cardiff | 7 | Lille | 36 | Praha | 29 | Zurich | 1 |
| Cluj-Napoca | 54 | Lisboa | 68 | Rennes | 5 | - | - |
Publisher’s Note: MDPI stays neutral with regard to jurisdictional claims in published maps and institutional affiliations. |
© 2021 by the authors. Licensee MDPI, Basel, Switzerland. This article is an open access article distributed under the terms and conditions of the Creative Commons Attribution (CC BY) license (https://creativecommons.org/licenses/by/4.0/).
Share and Cite
MDPI and ACS Style
Roszkowska, E.; Kusterka-Jefmańska, M.; Jefmański, B. Intuitionistic Fuzzy TOPSIS as a Method for Assessing Socioeconomic Phenomena on the Basis of Survey Data. Entropy 2021, 23, 563. https://doi.org/10.3390/e23050563
AMA Style
Roszkowska E, Kusterka-Jefmańska M, Jefmański B. Intuitionistic Fuzzy TOPSIS as a Method for Assessing Socioeconomic Phenomena on the Basis of Survey Data. Entropy. 2021; 23(5):563. https://doi.org/10.3390/e23050563
Chicago/Turabian StyleRoszkowska, Ewa, Marta Kusterka-Jefmańska, and Bartłomiej Jefmański. 2021. "Intuitionistic Fuzzy TOPSIS as a Method for Assessing Socioeconomic Phenomena on the Basis of Survey Data" Entropy 23, no. 5: 563. https://doi.org/10.3390/e23050563
Note that from the first issue of 2016, this journal uses article numbers instead of page numbers. See further details here.