
Trends in PM2.5 Concentration in Nagoya, Japan, from 2003 to 2018 and Impacts of PM2.5 Countermeasures

 , ,
, , 
Abstract
:1. Introduction
2. Methods
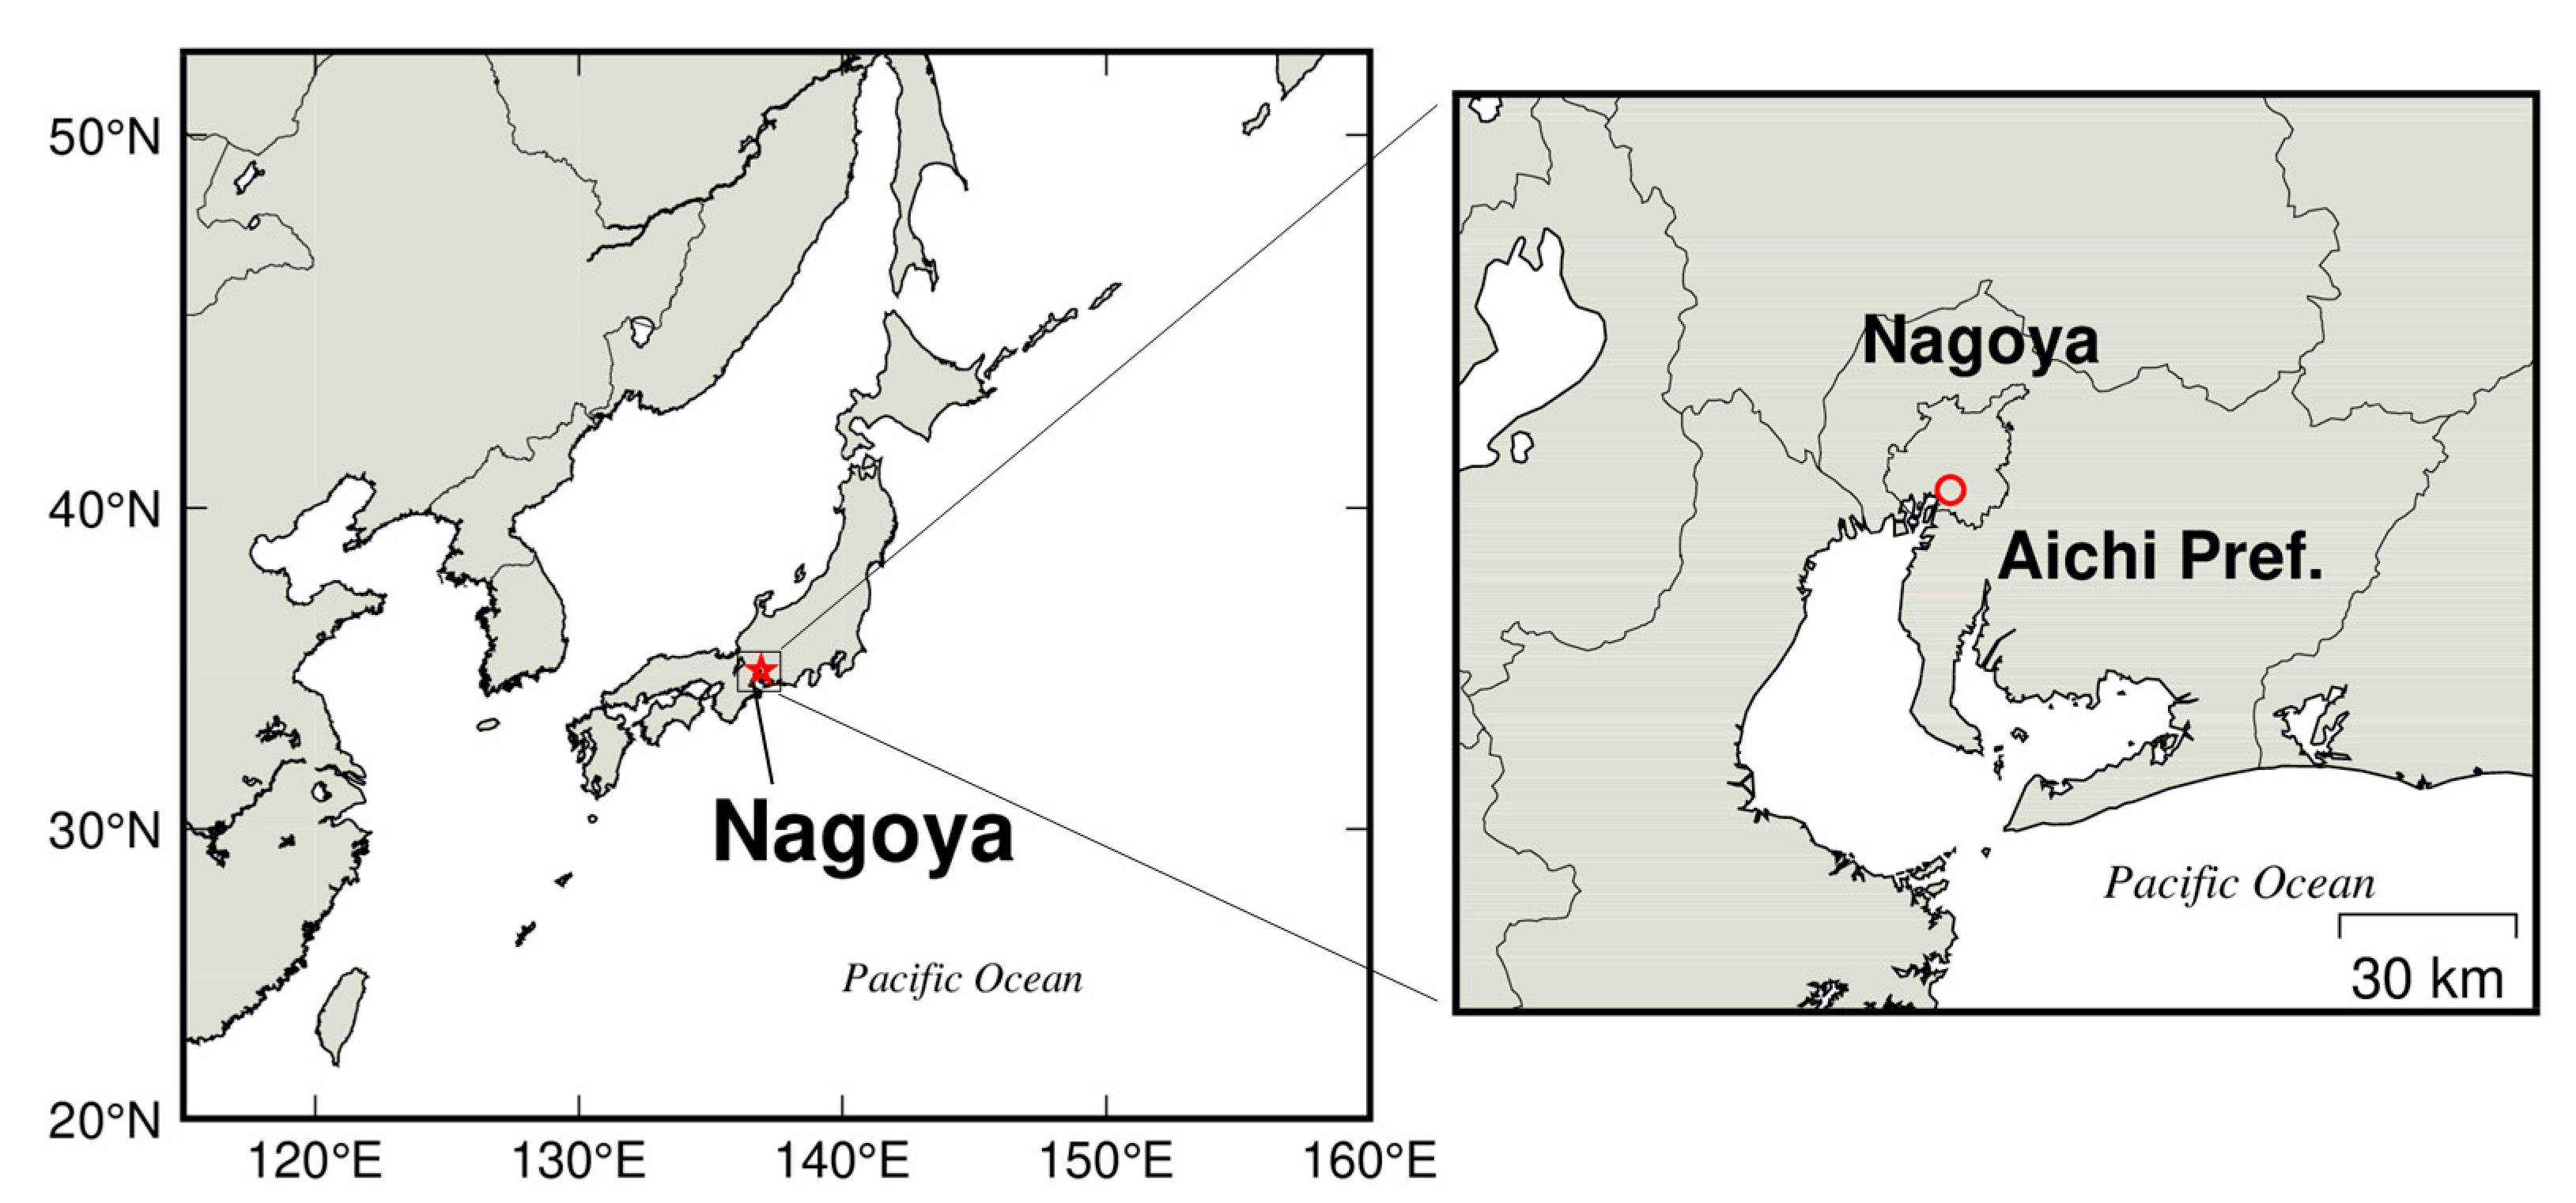
2.1. Sampling
2.2. Chemical Analyses
2.3. Emission Data
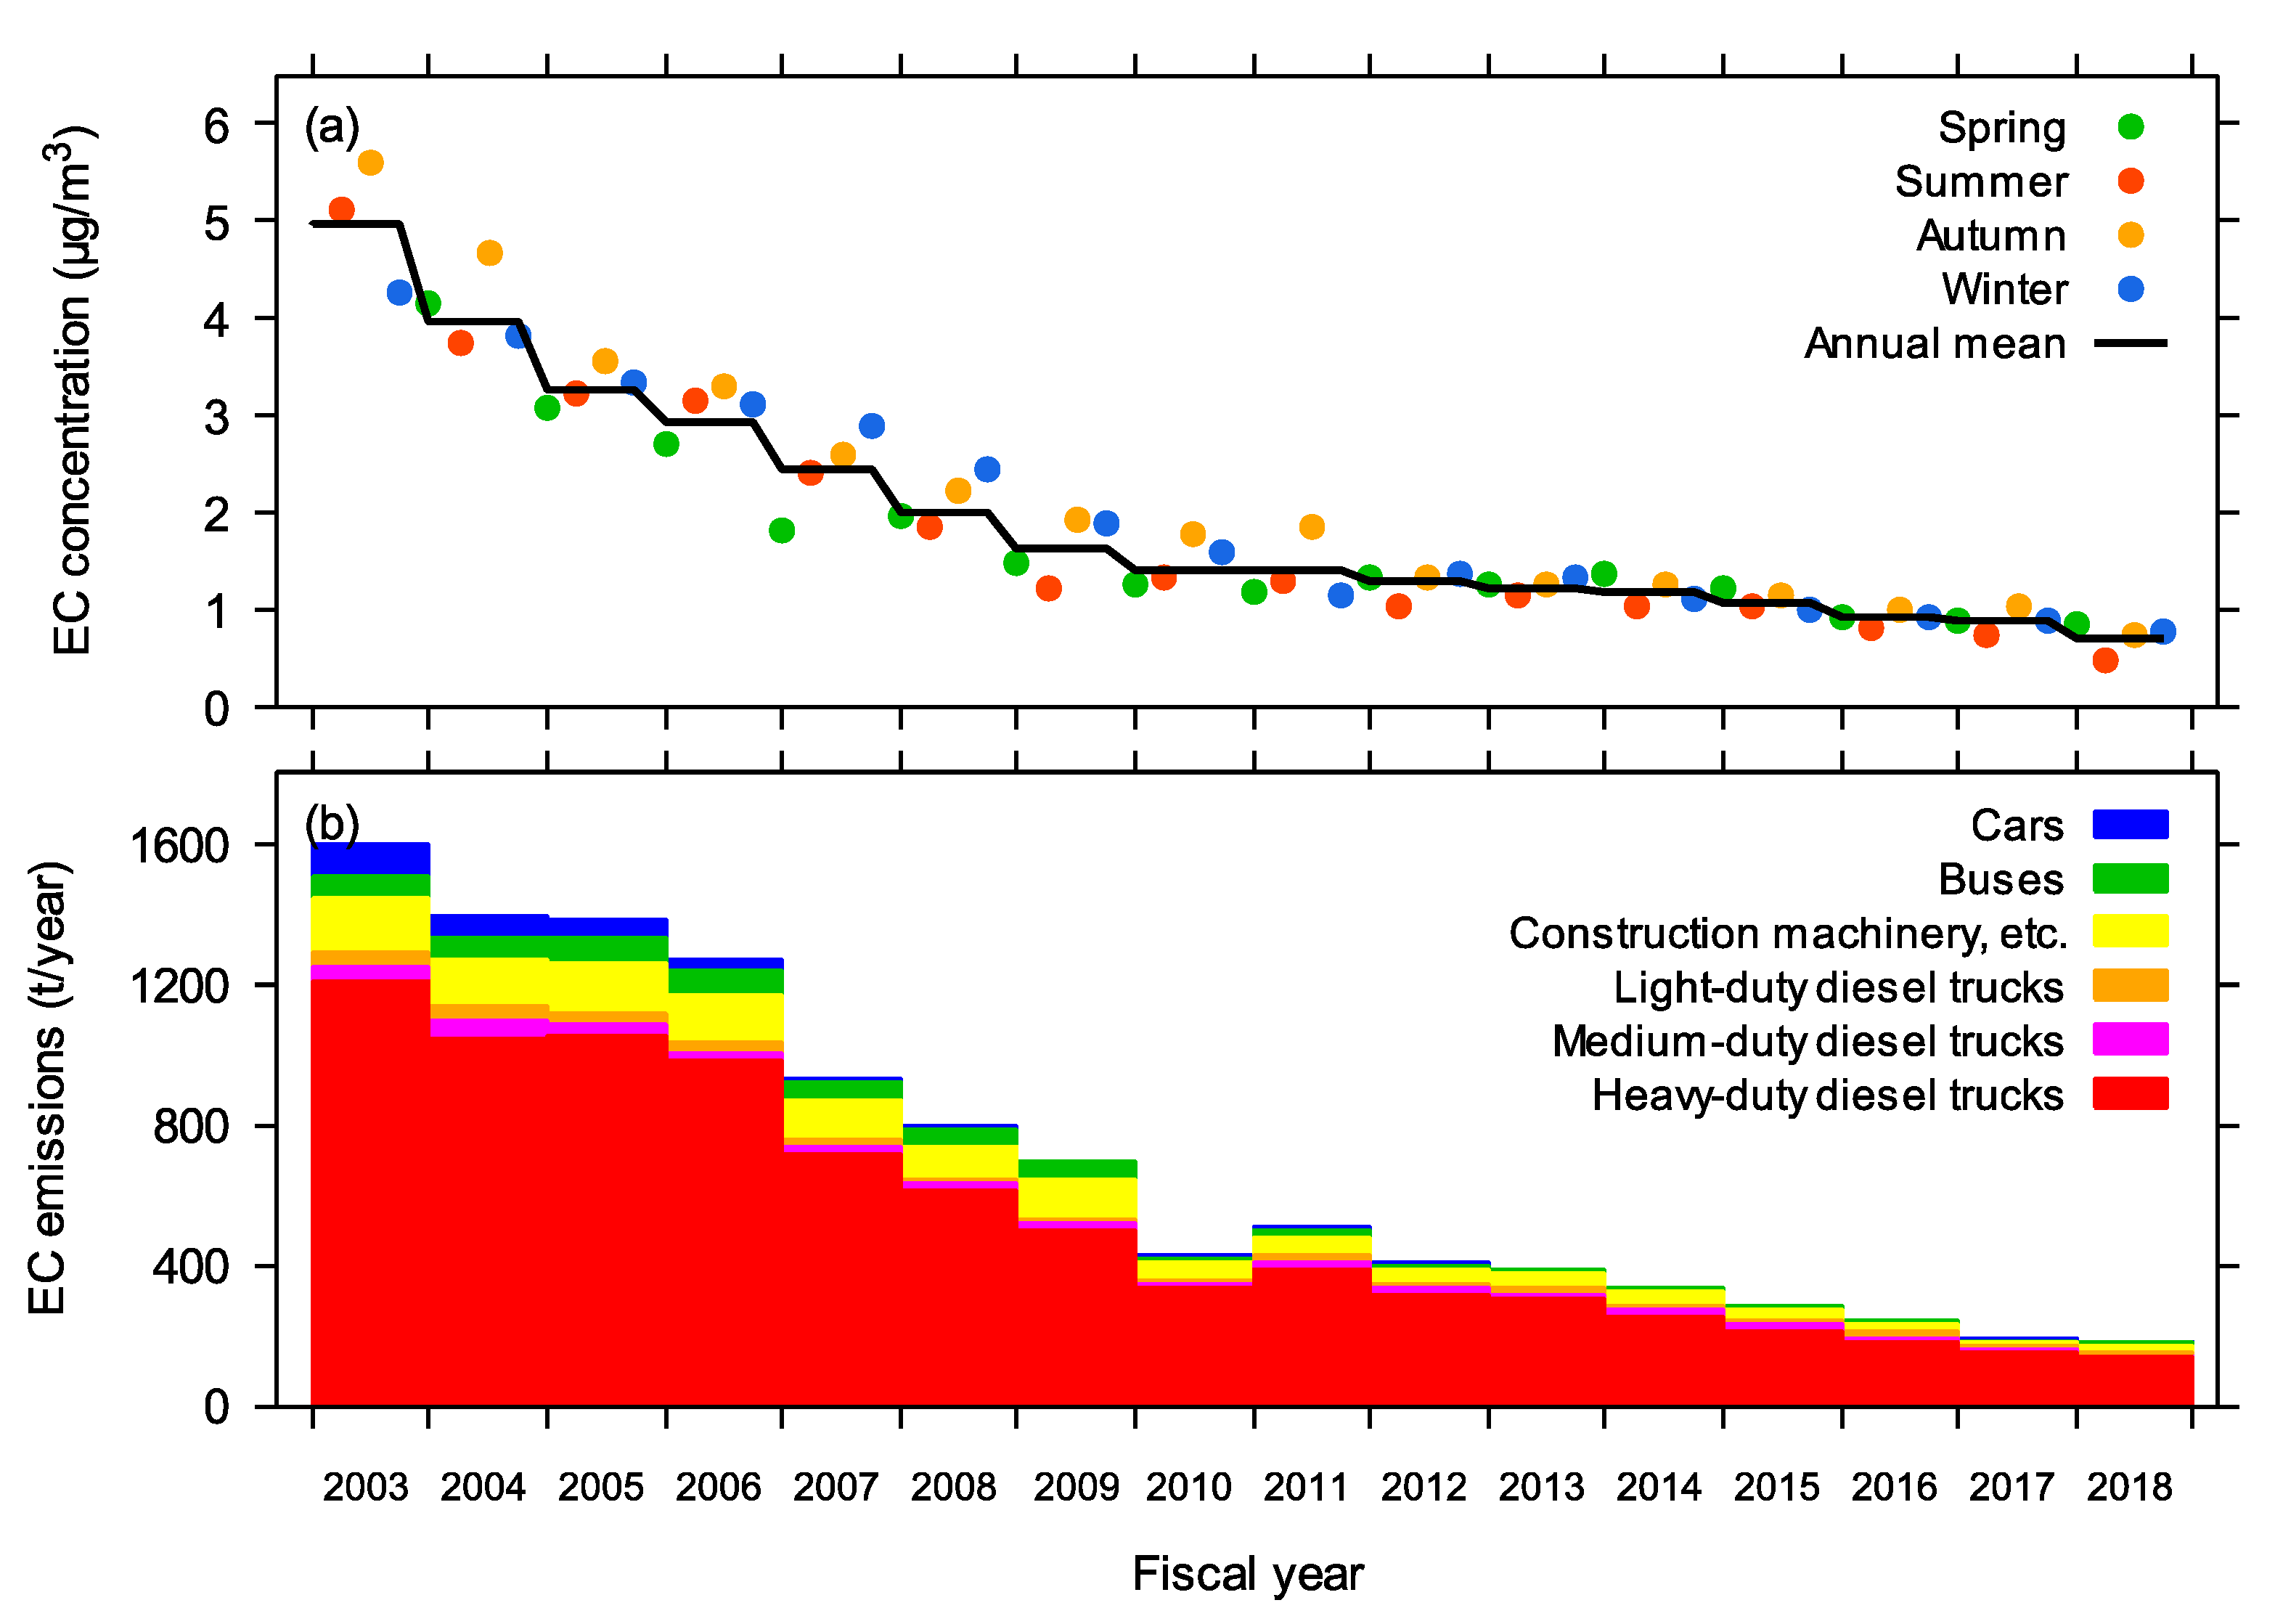
2.3.1. Mobile Sources
EC
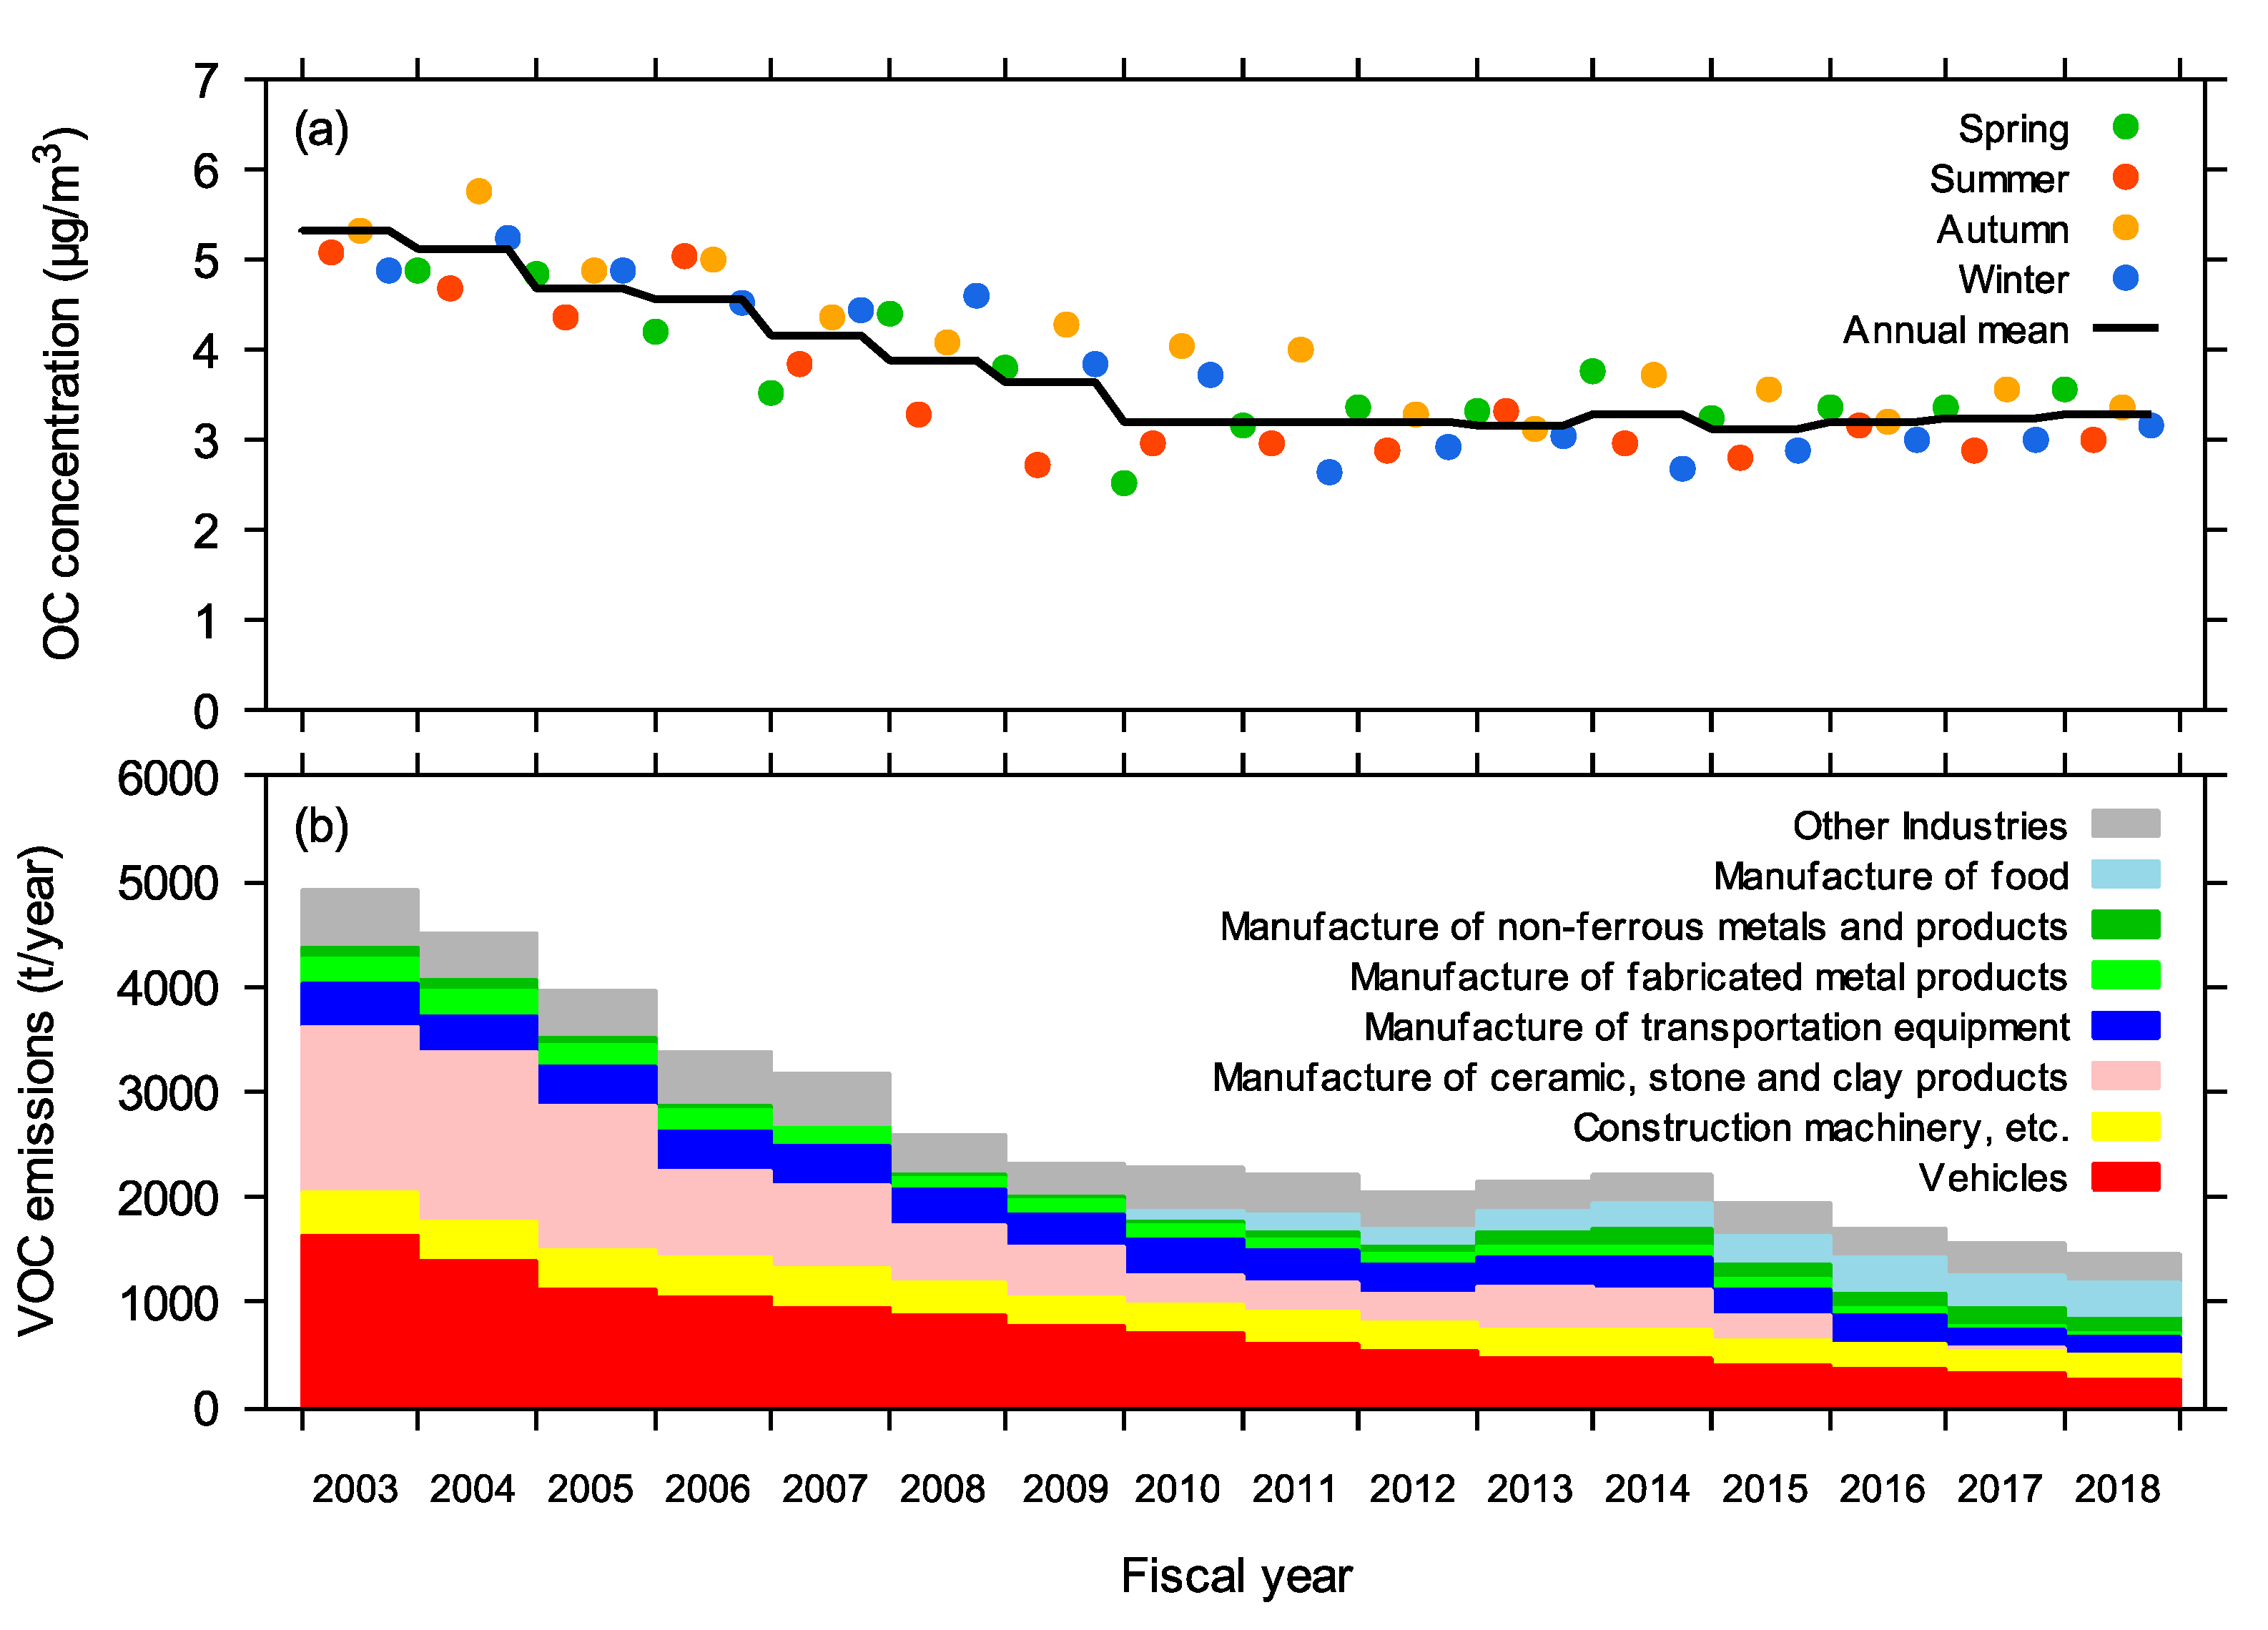
VOC
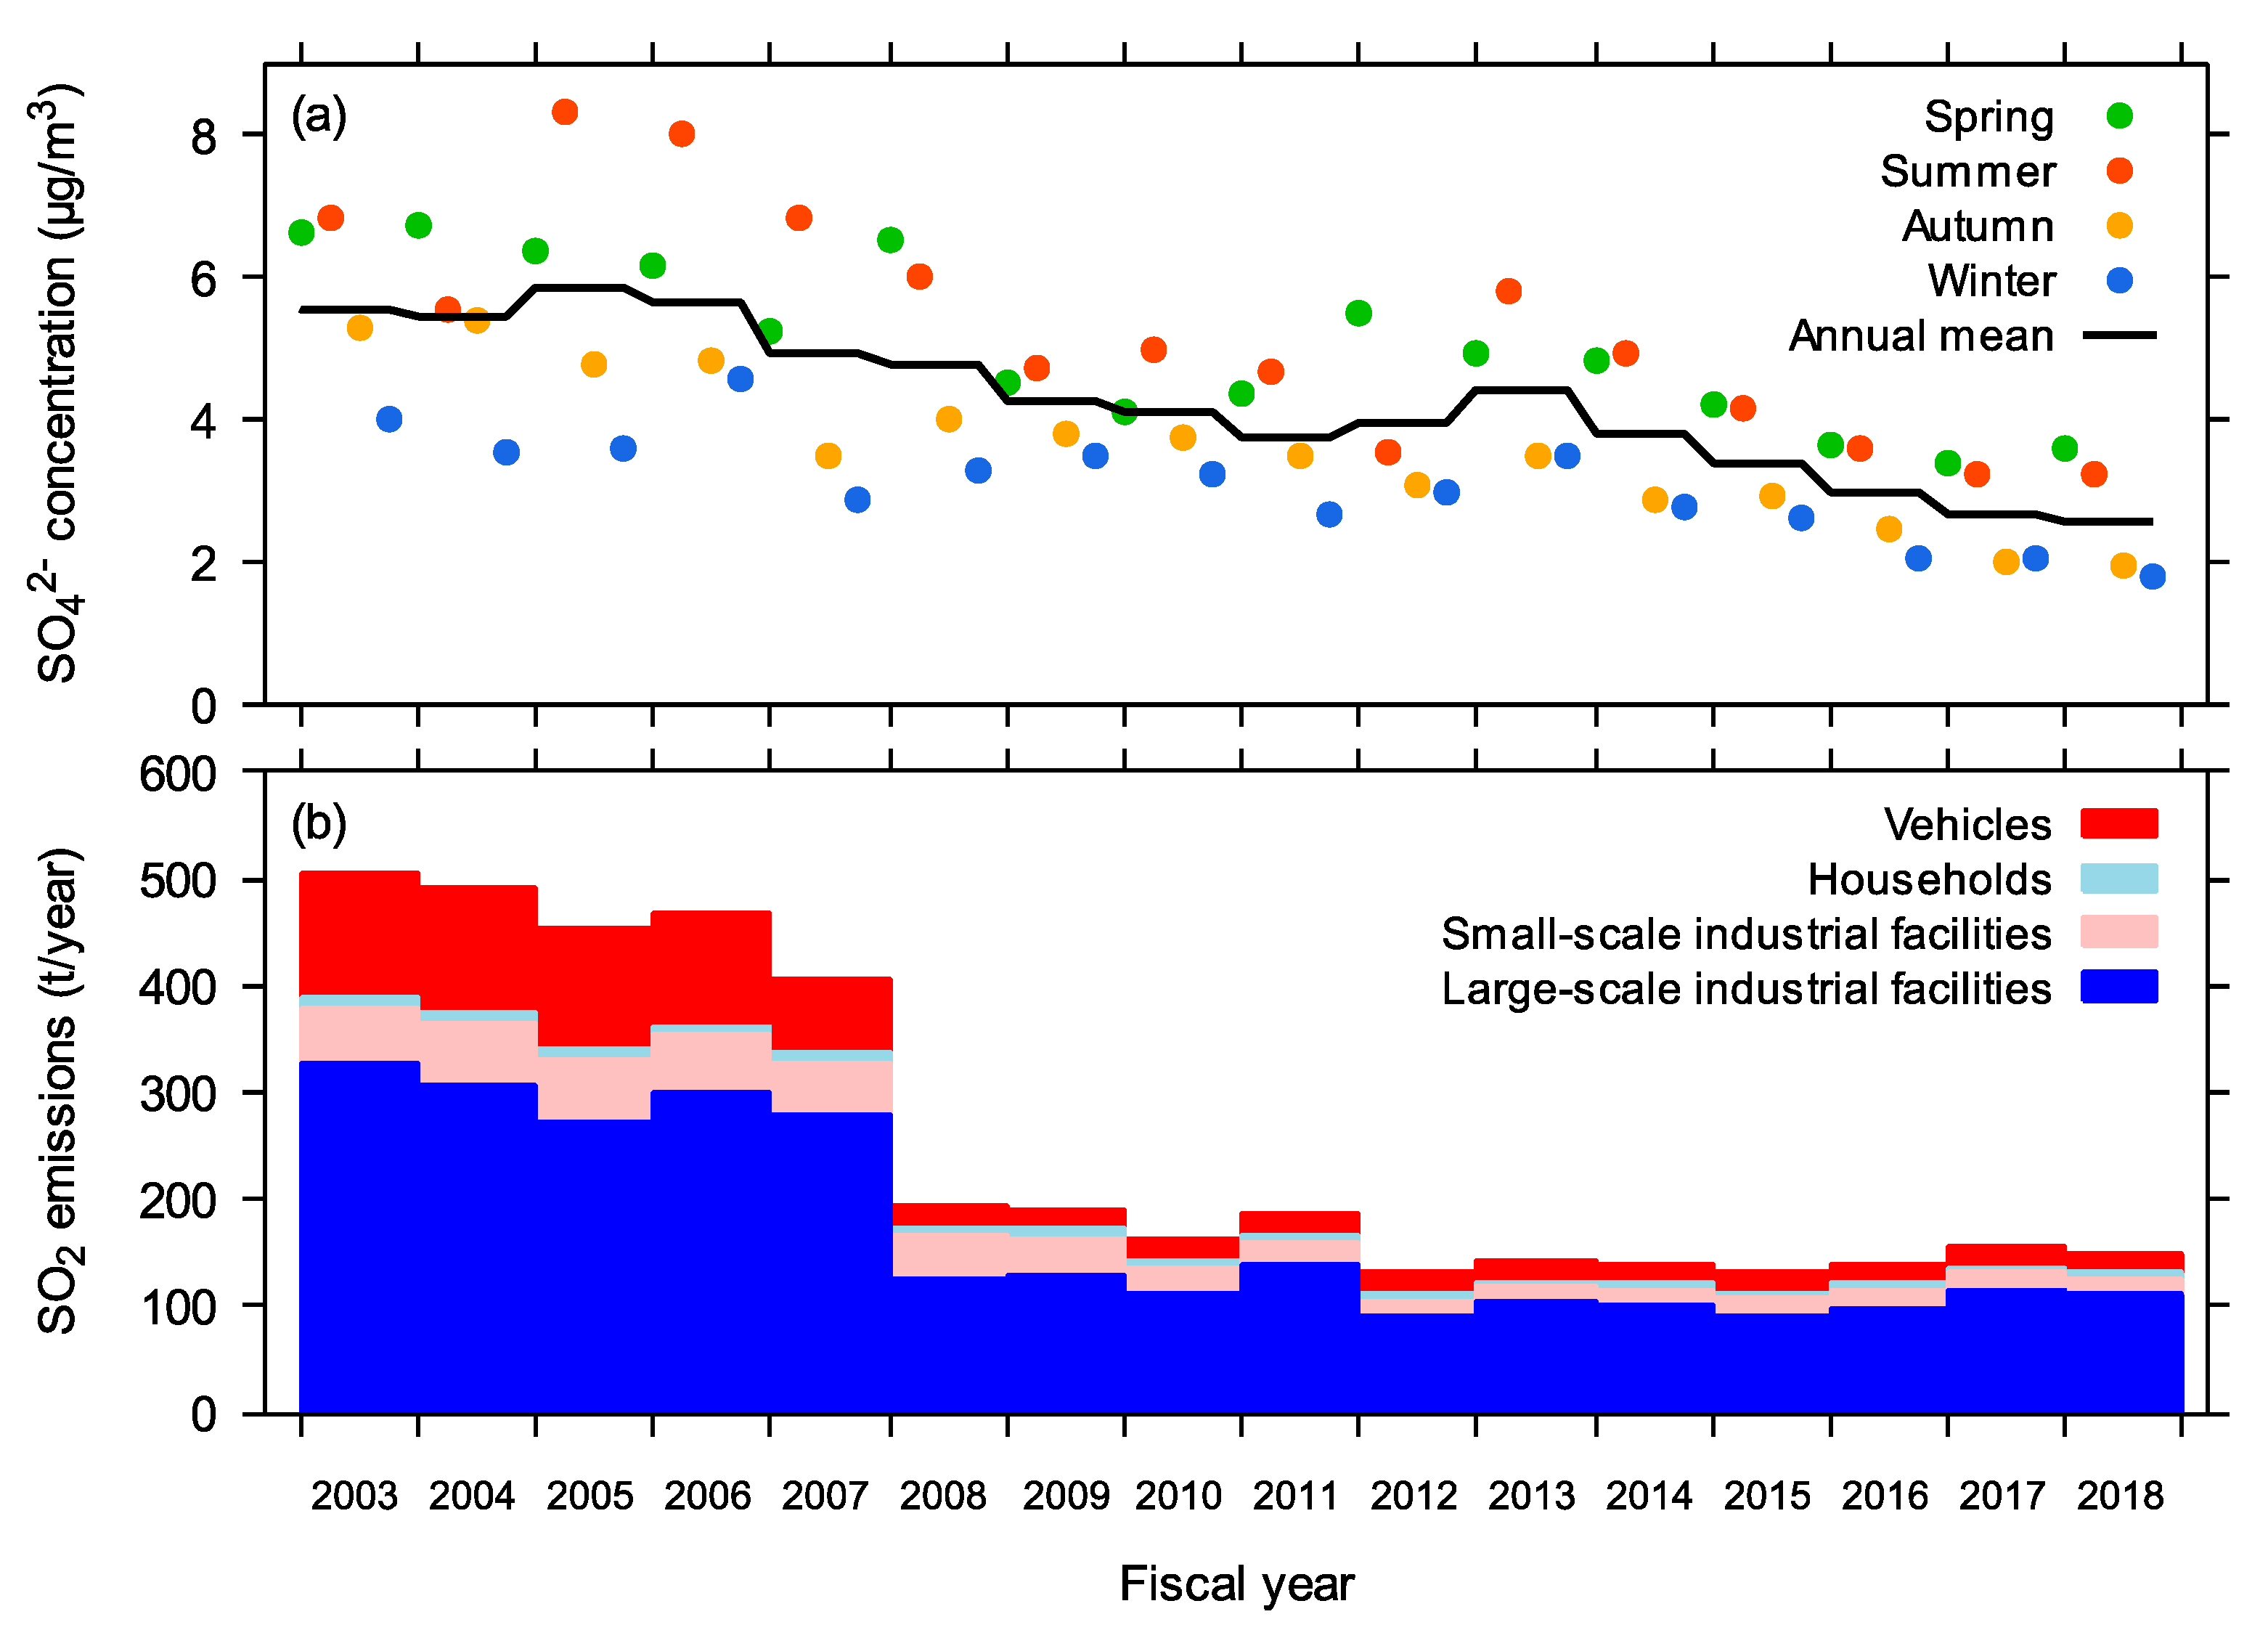
SO2
NOX
2.3.2. Stationary Sources
VOC
SO2
NOX
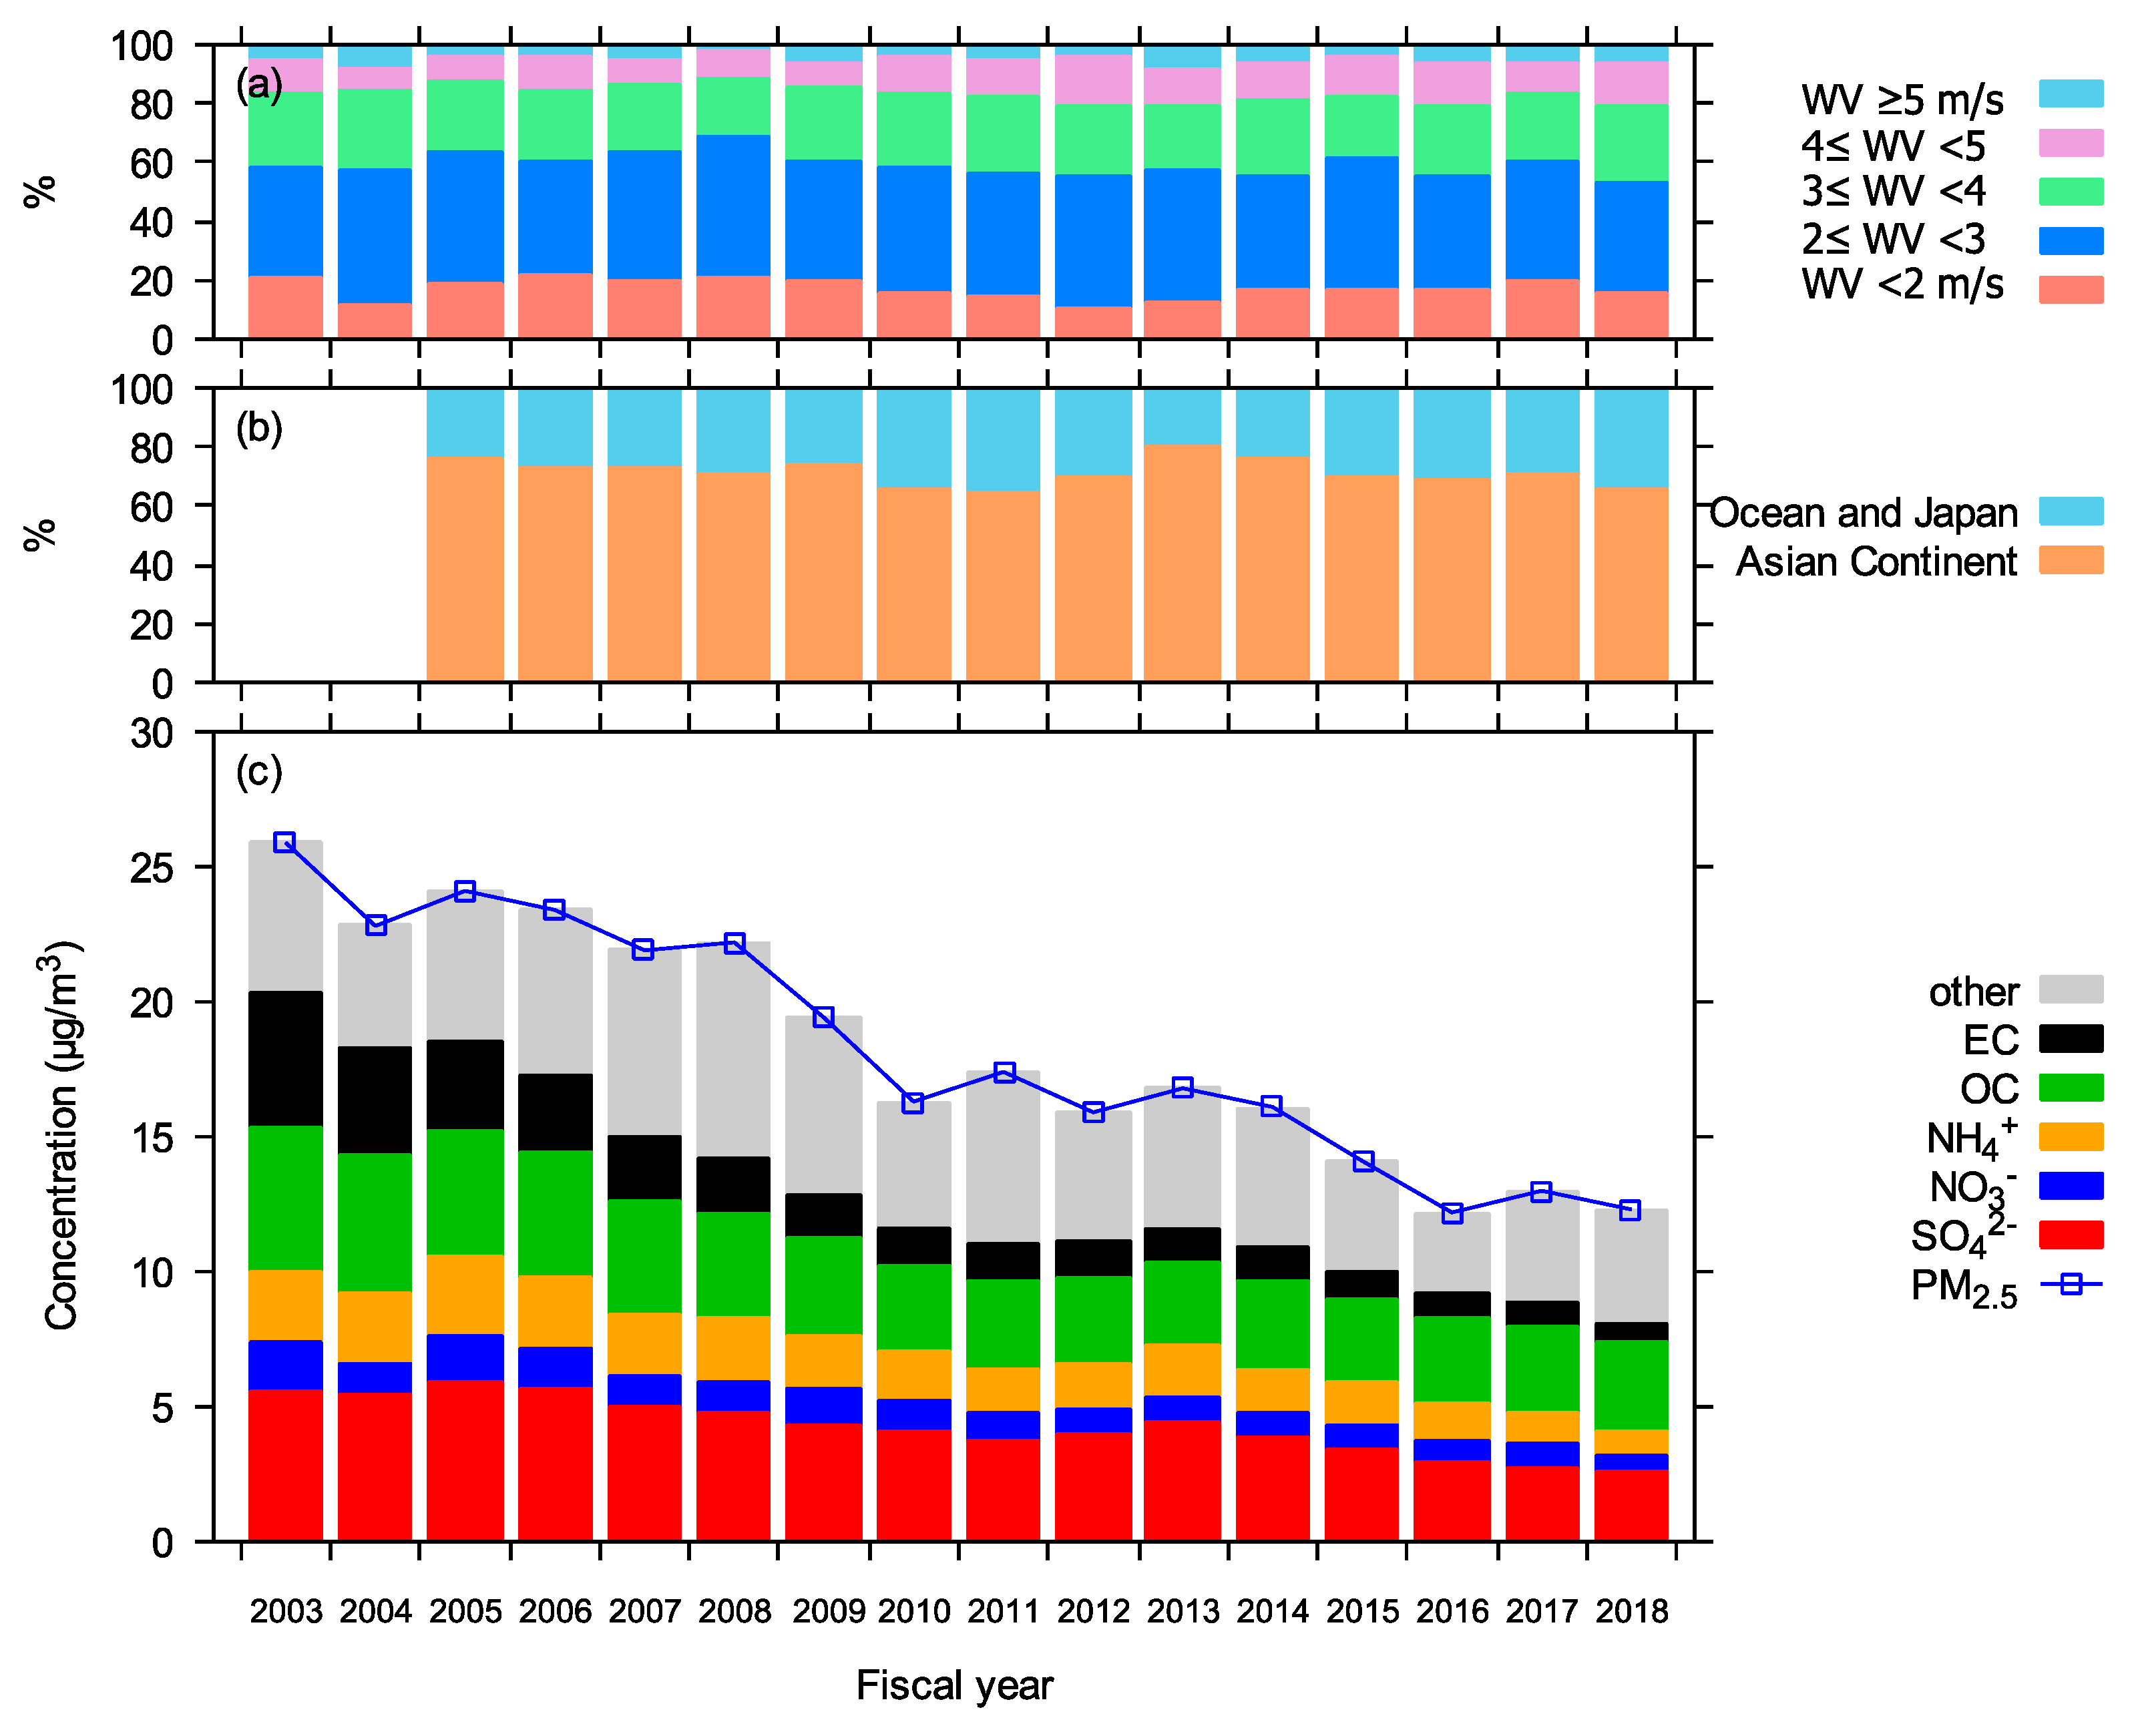
2.4. Backward Trajectory Analysis
3. Results and Discussion
3.1. Long-Term Trends in PM2.5 Concentration and Chemical Composition
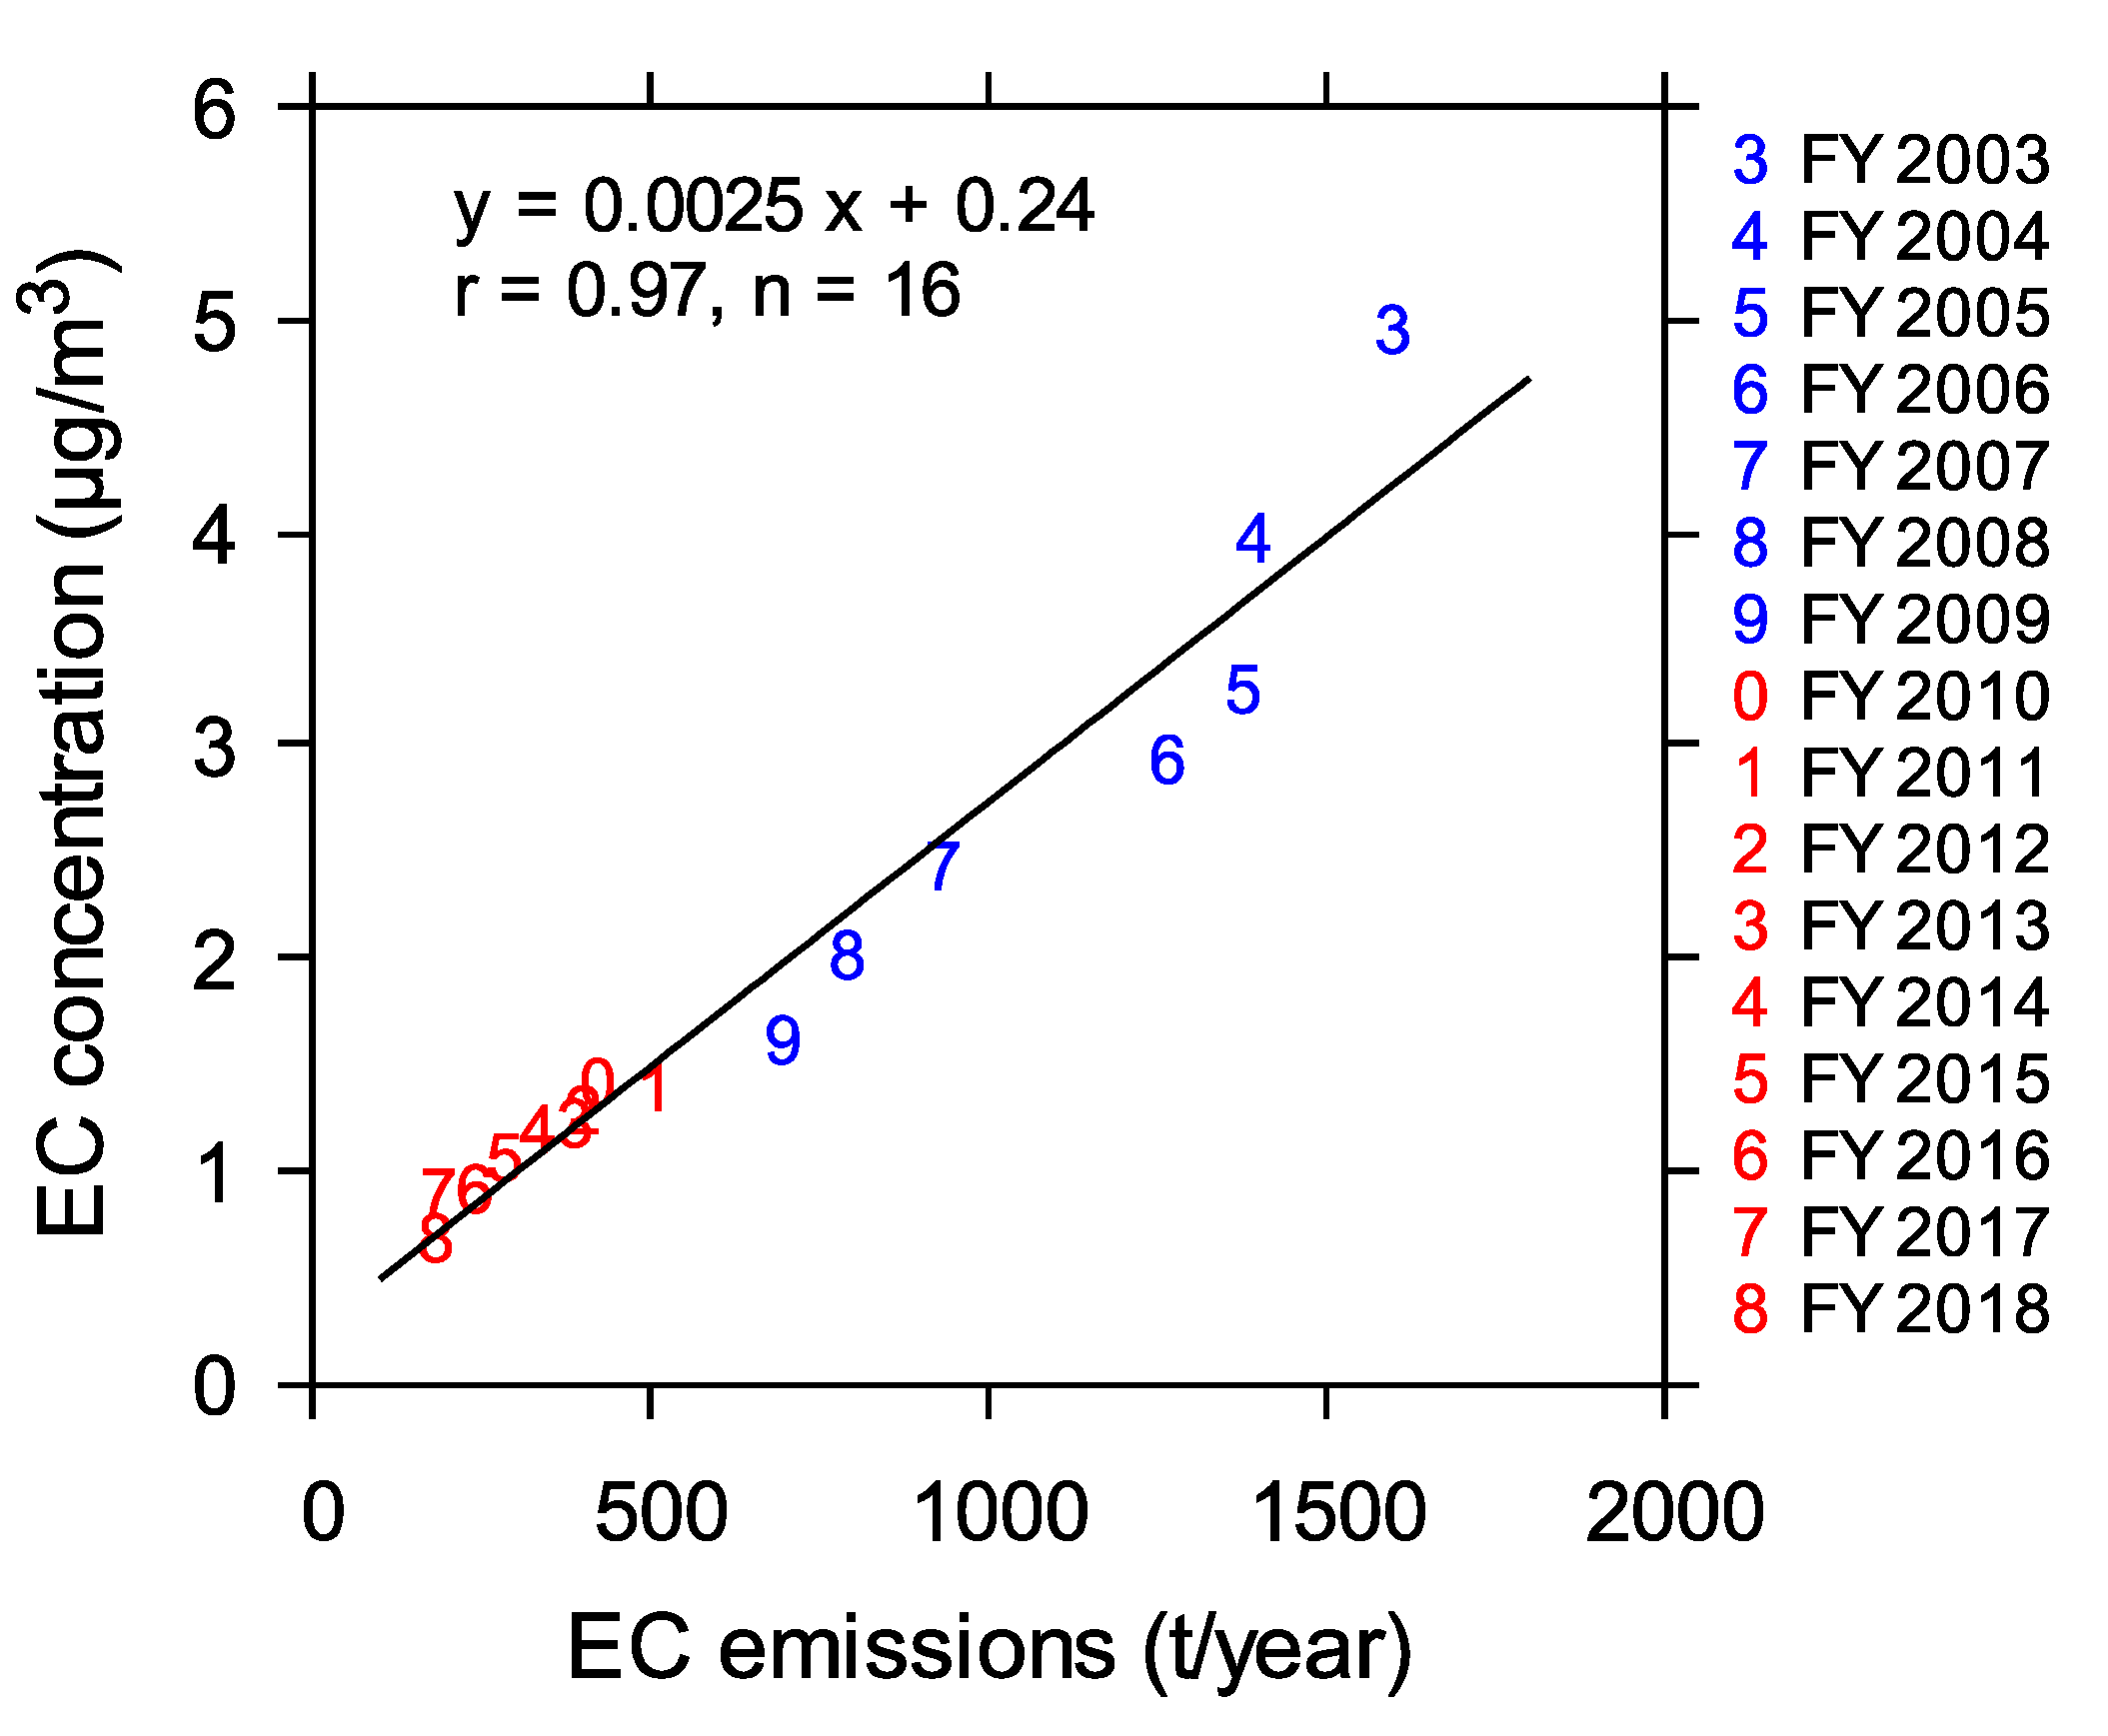
3.2. Elemental Carbon in PM2.5
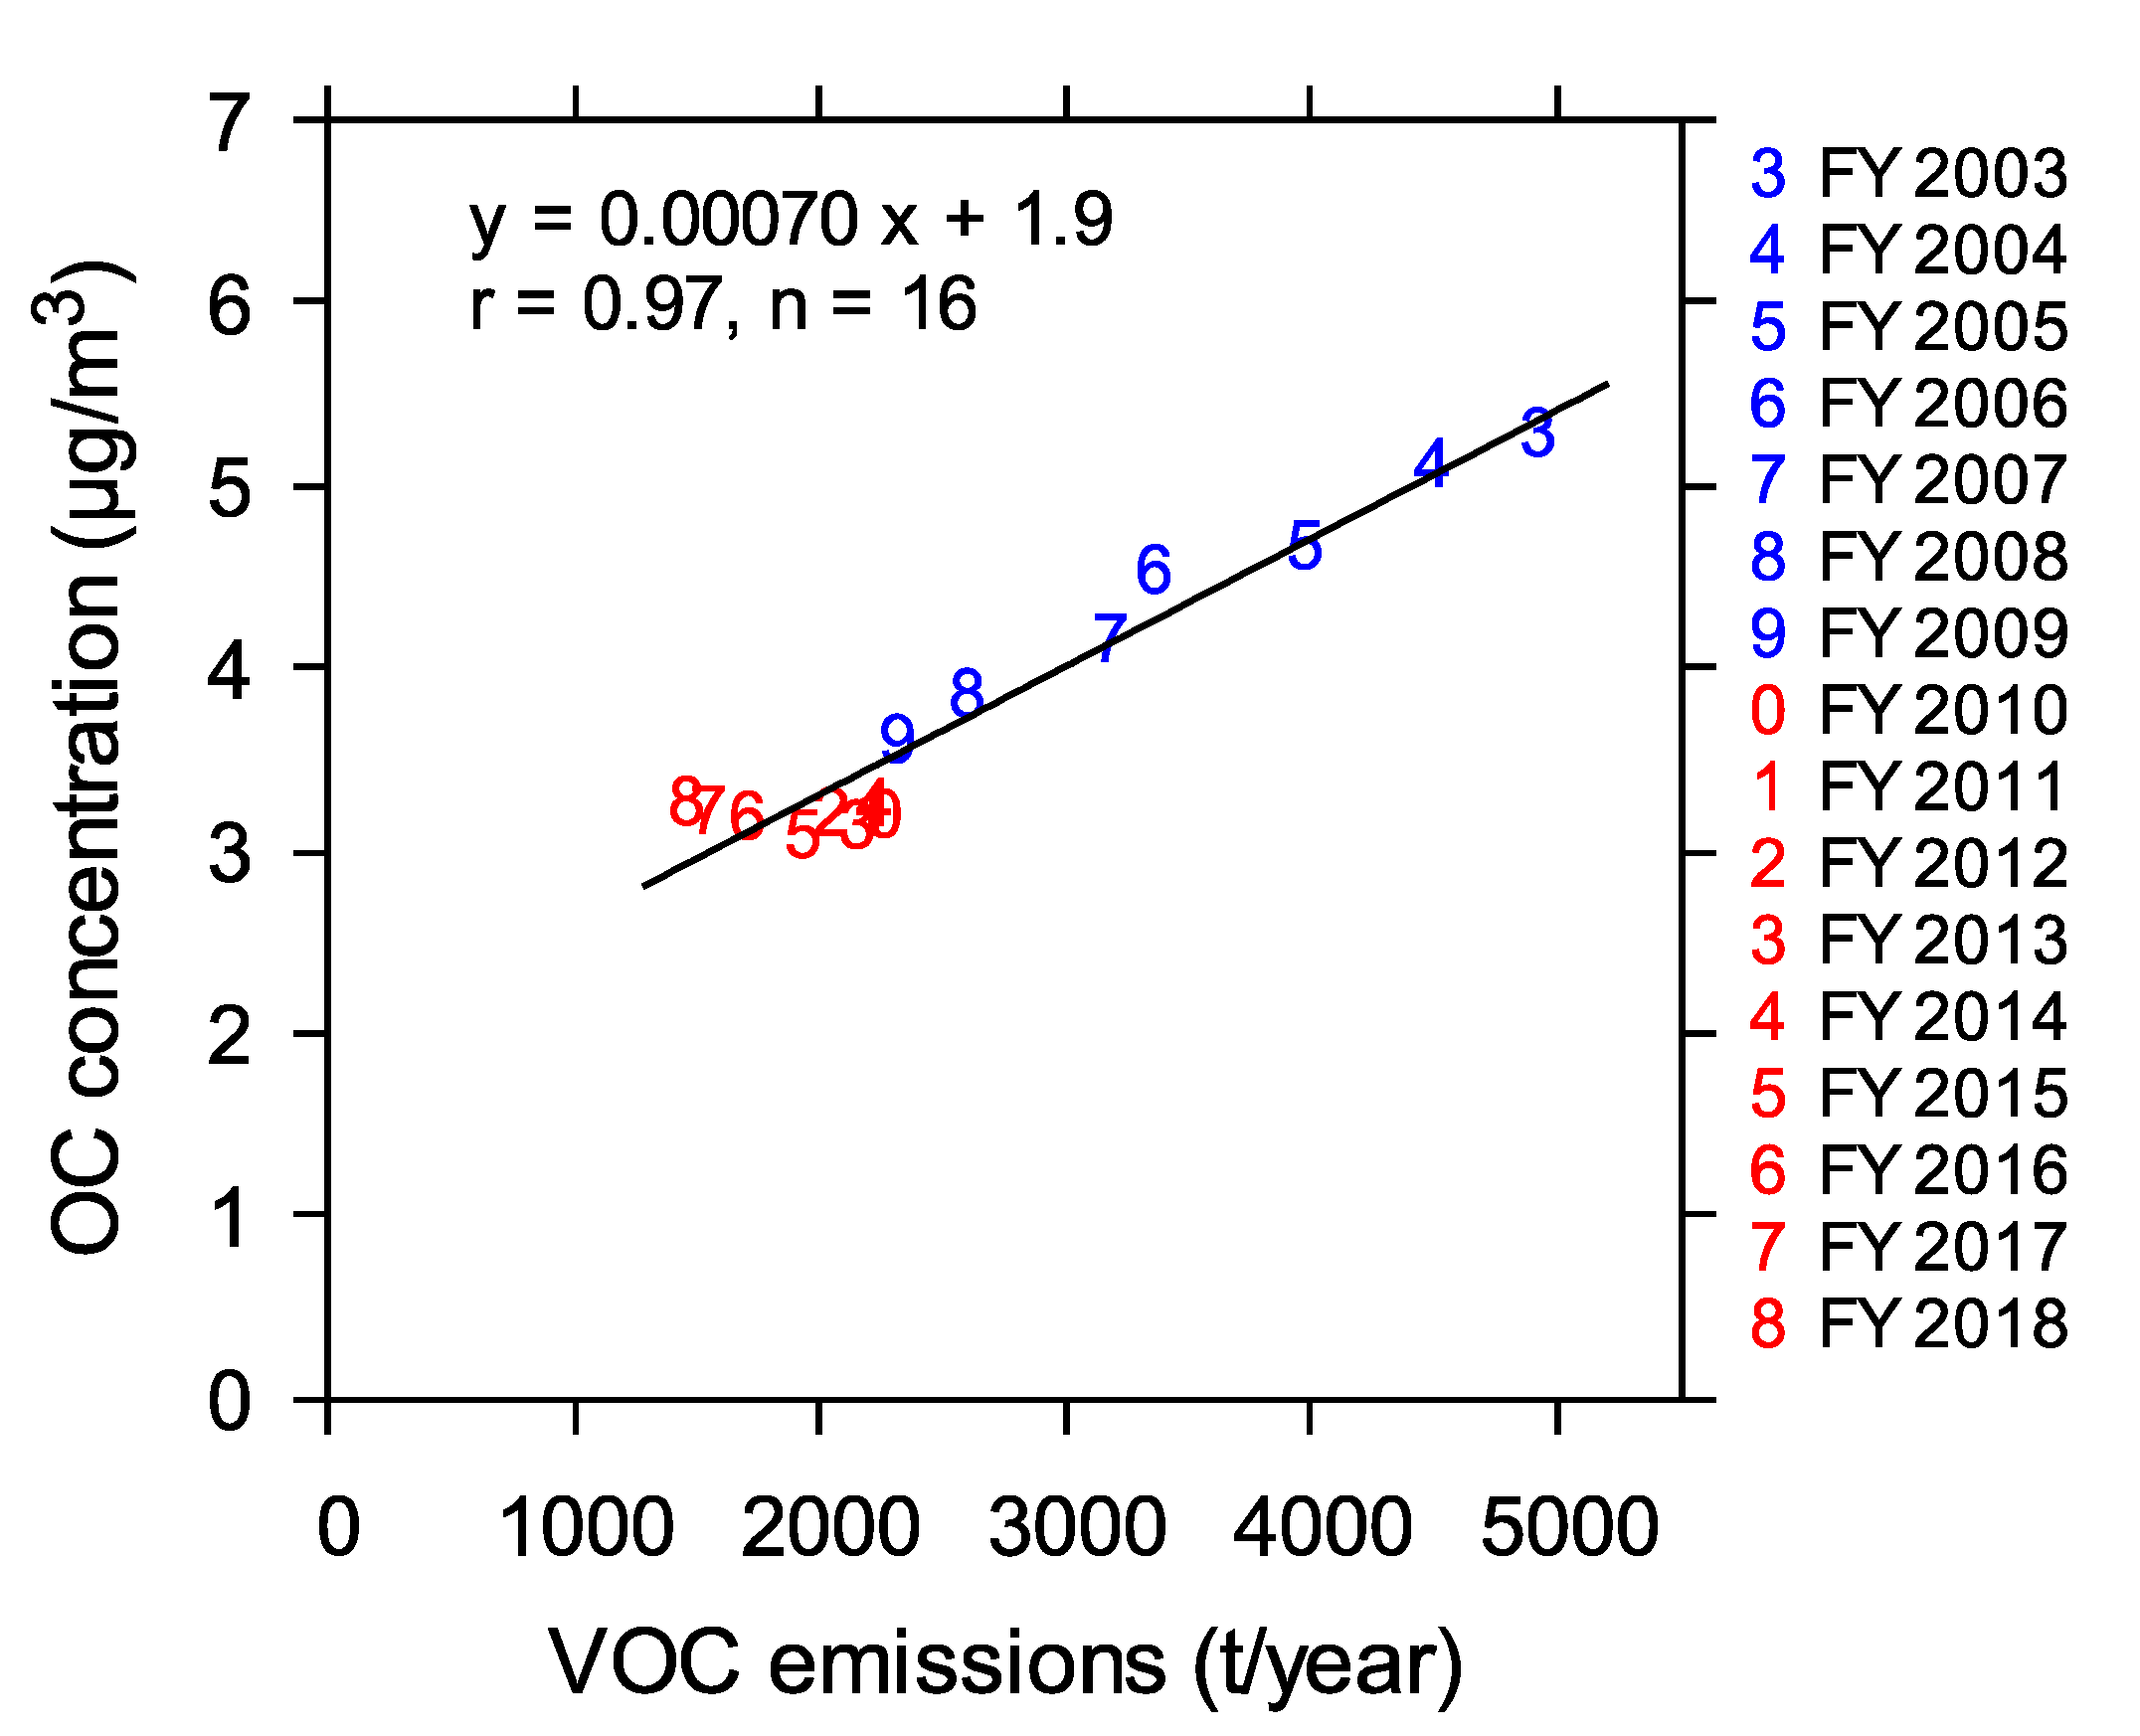
3.3. Organic Carbon in PM2.5
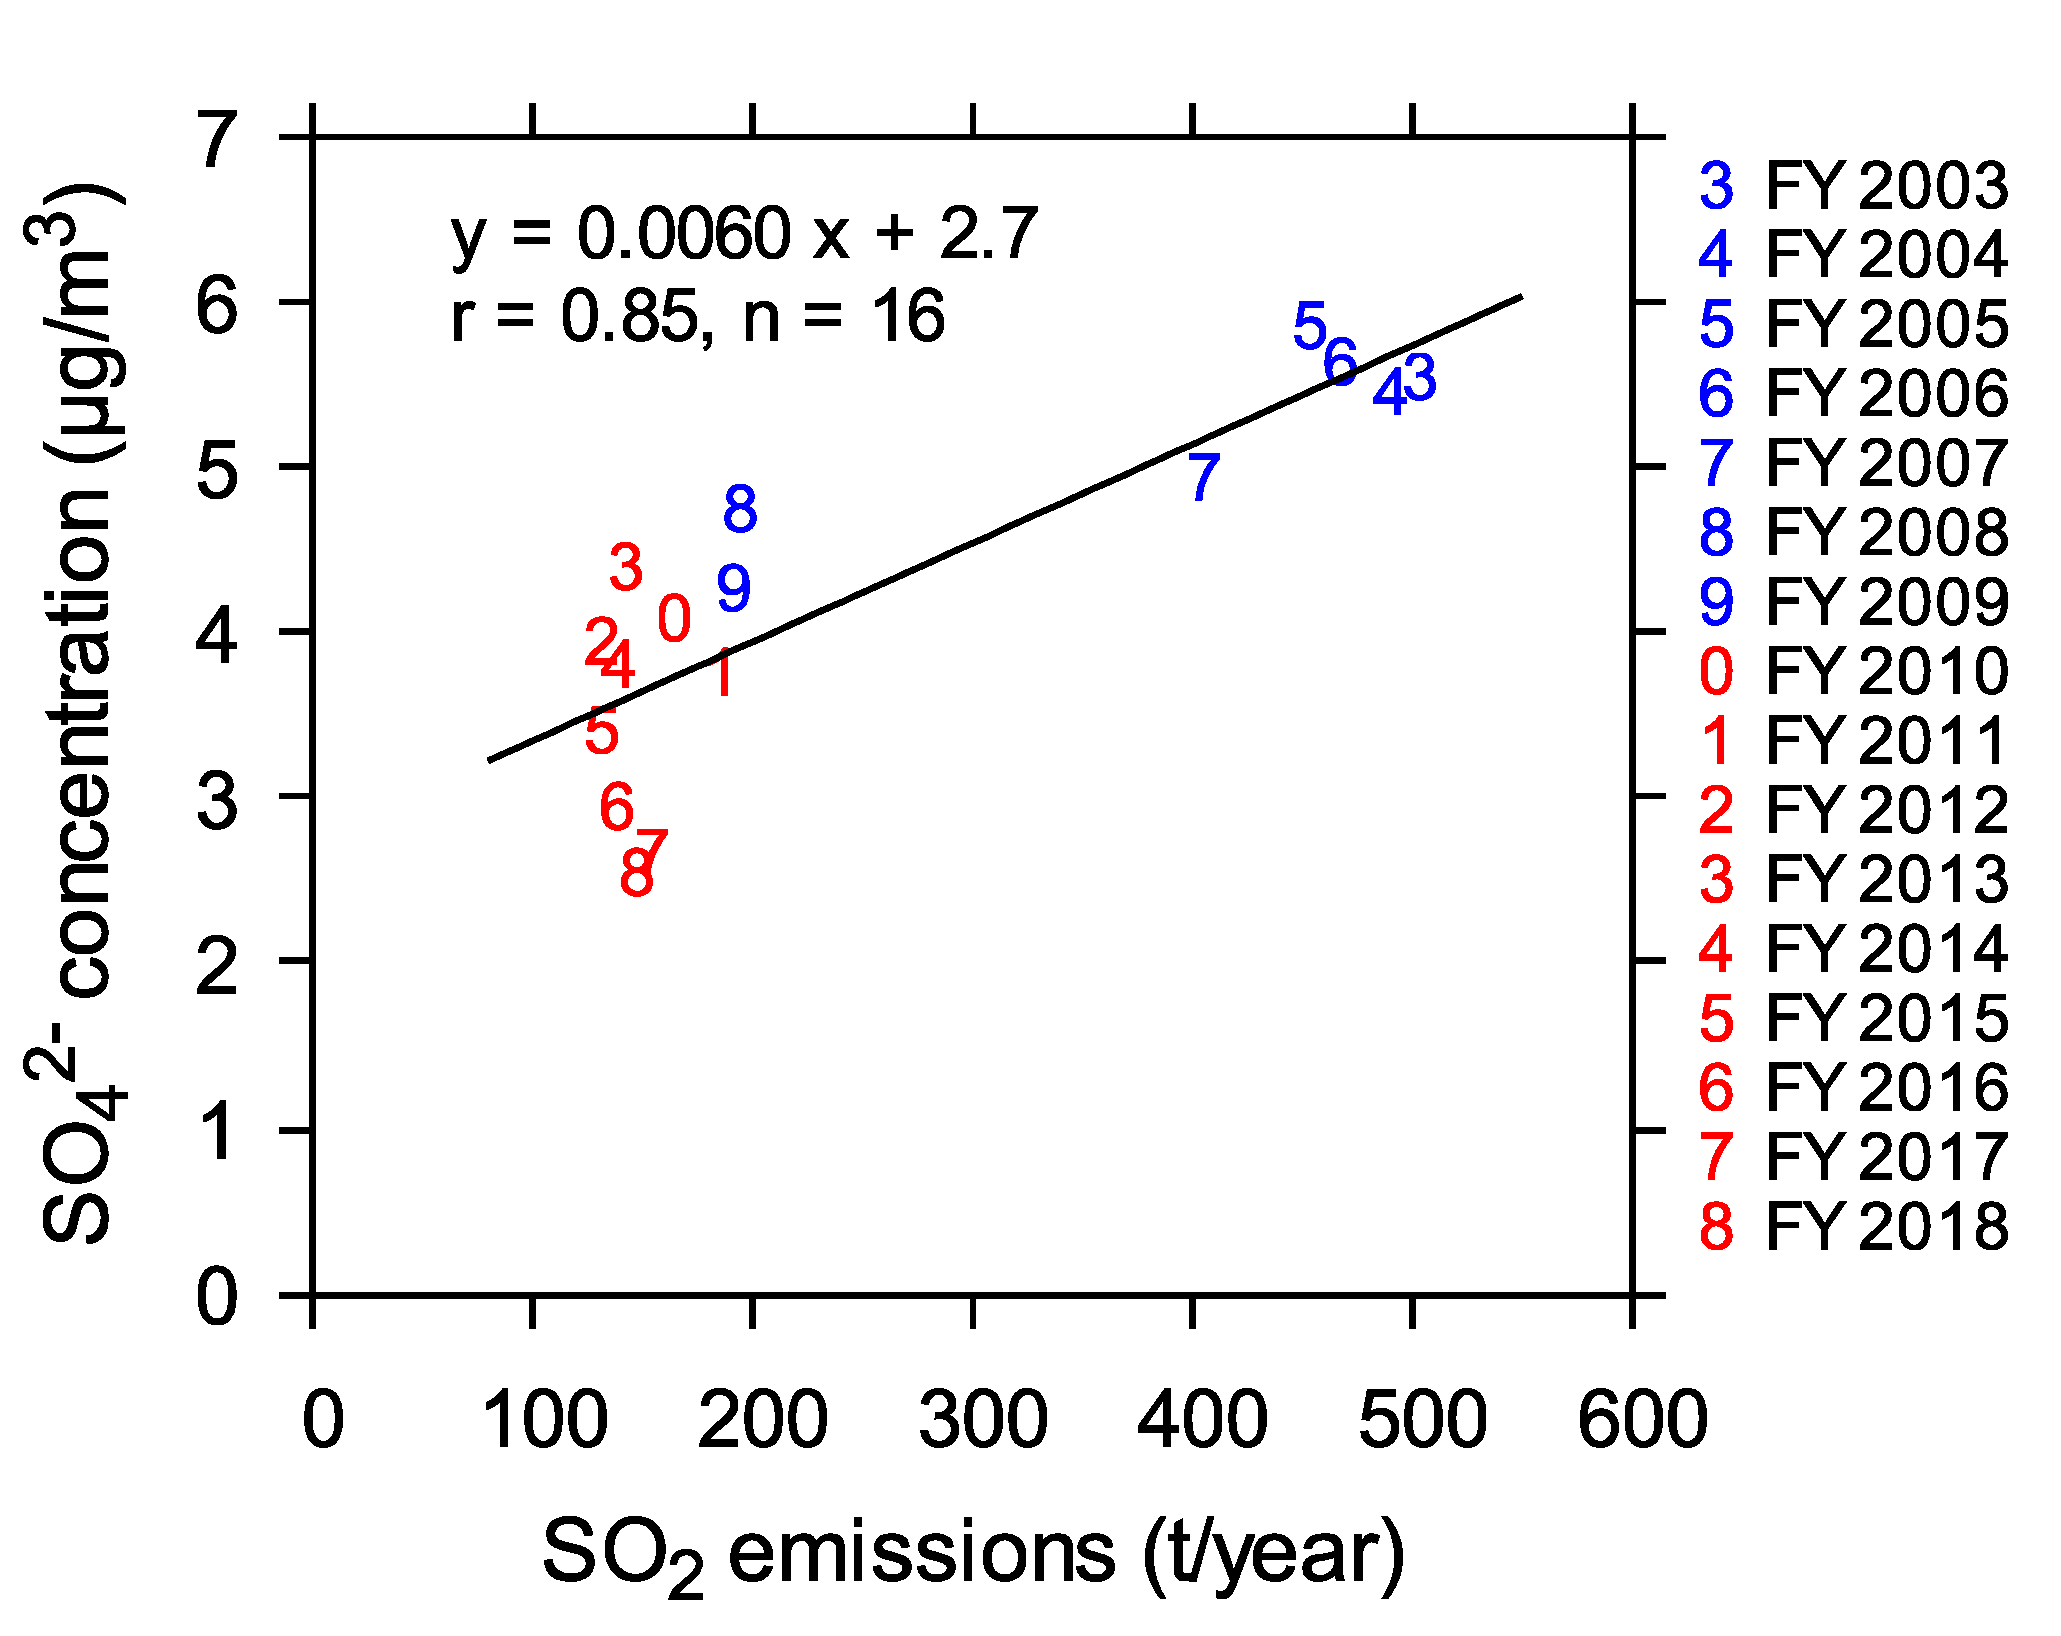
3.4. Sulfate (SO42−) in PM2.5
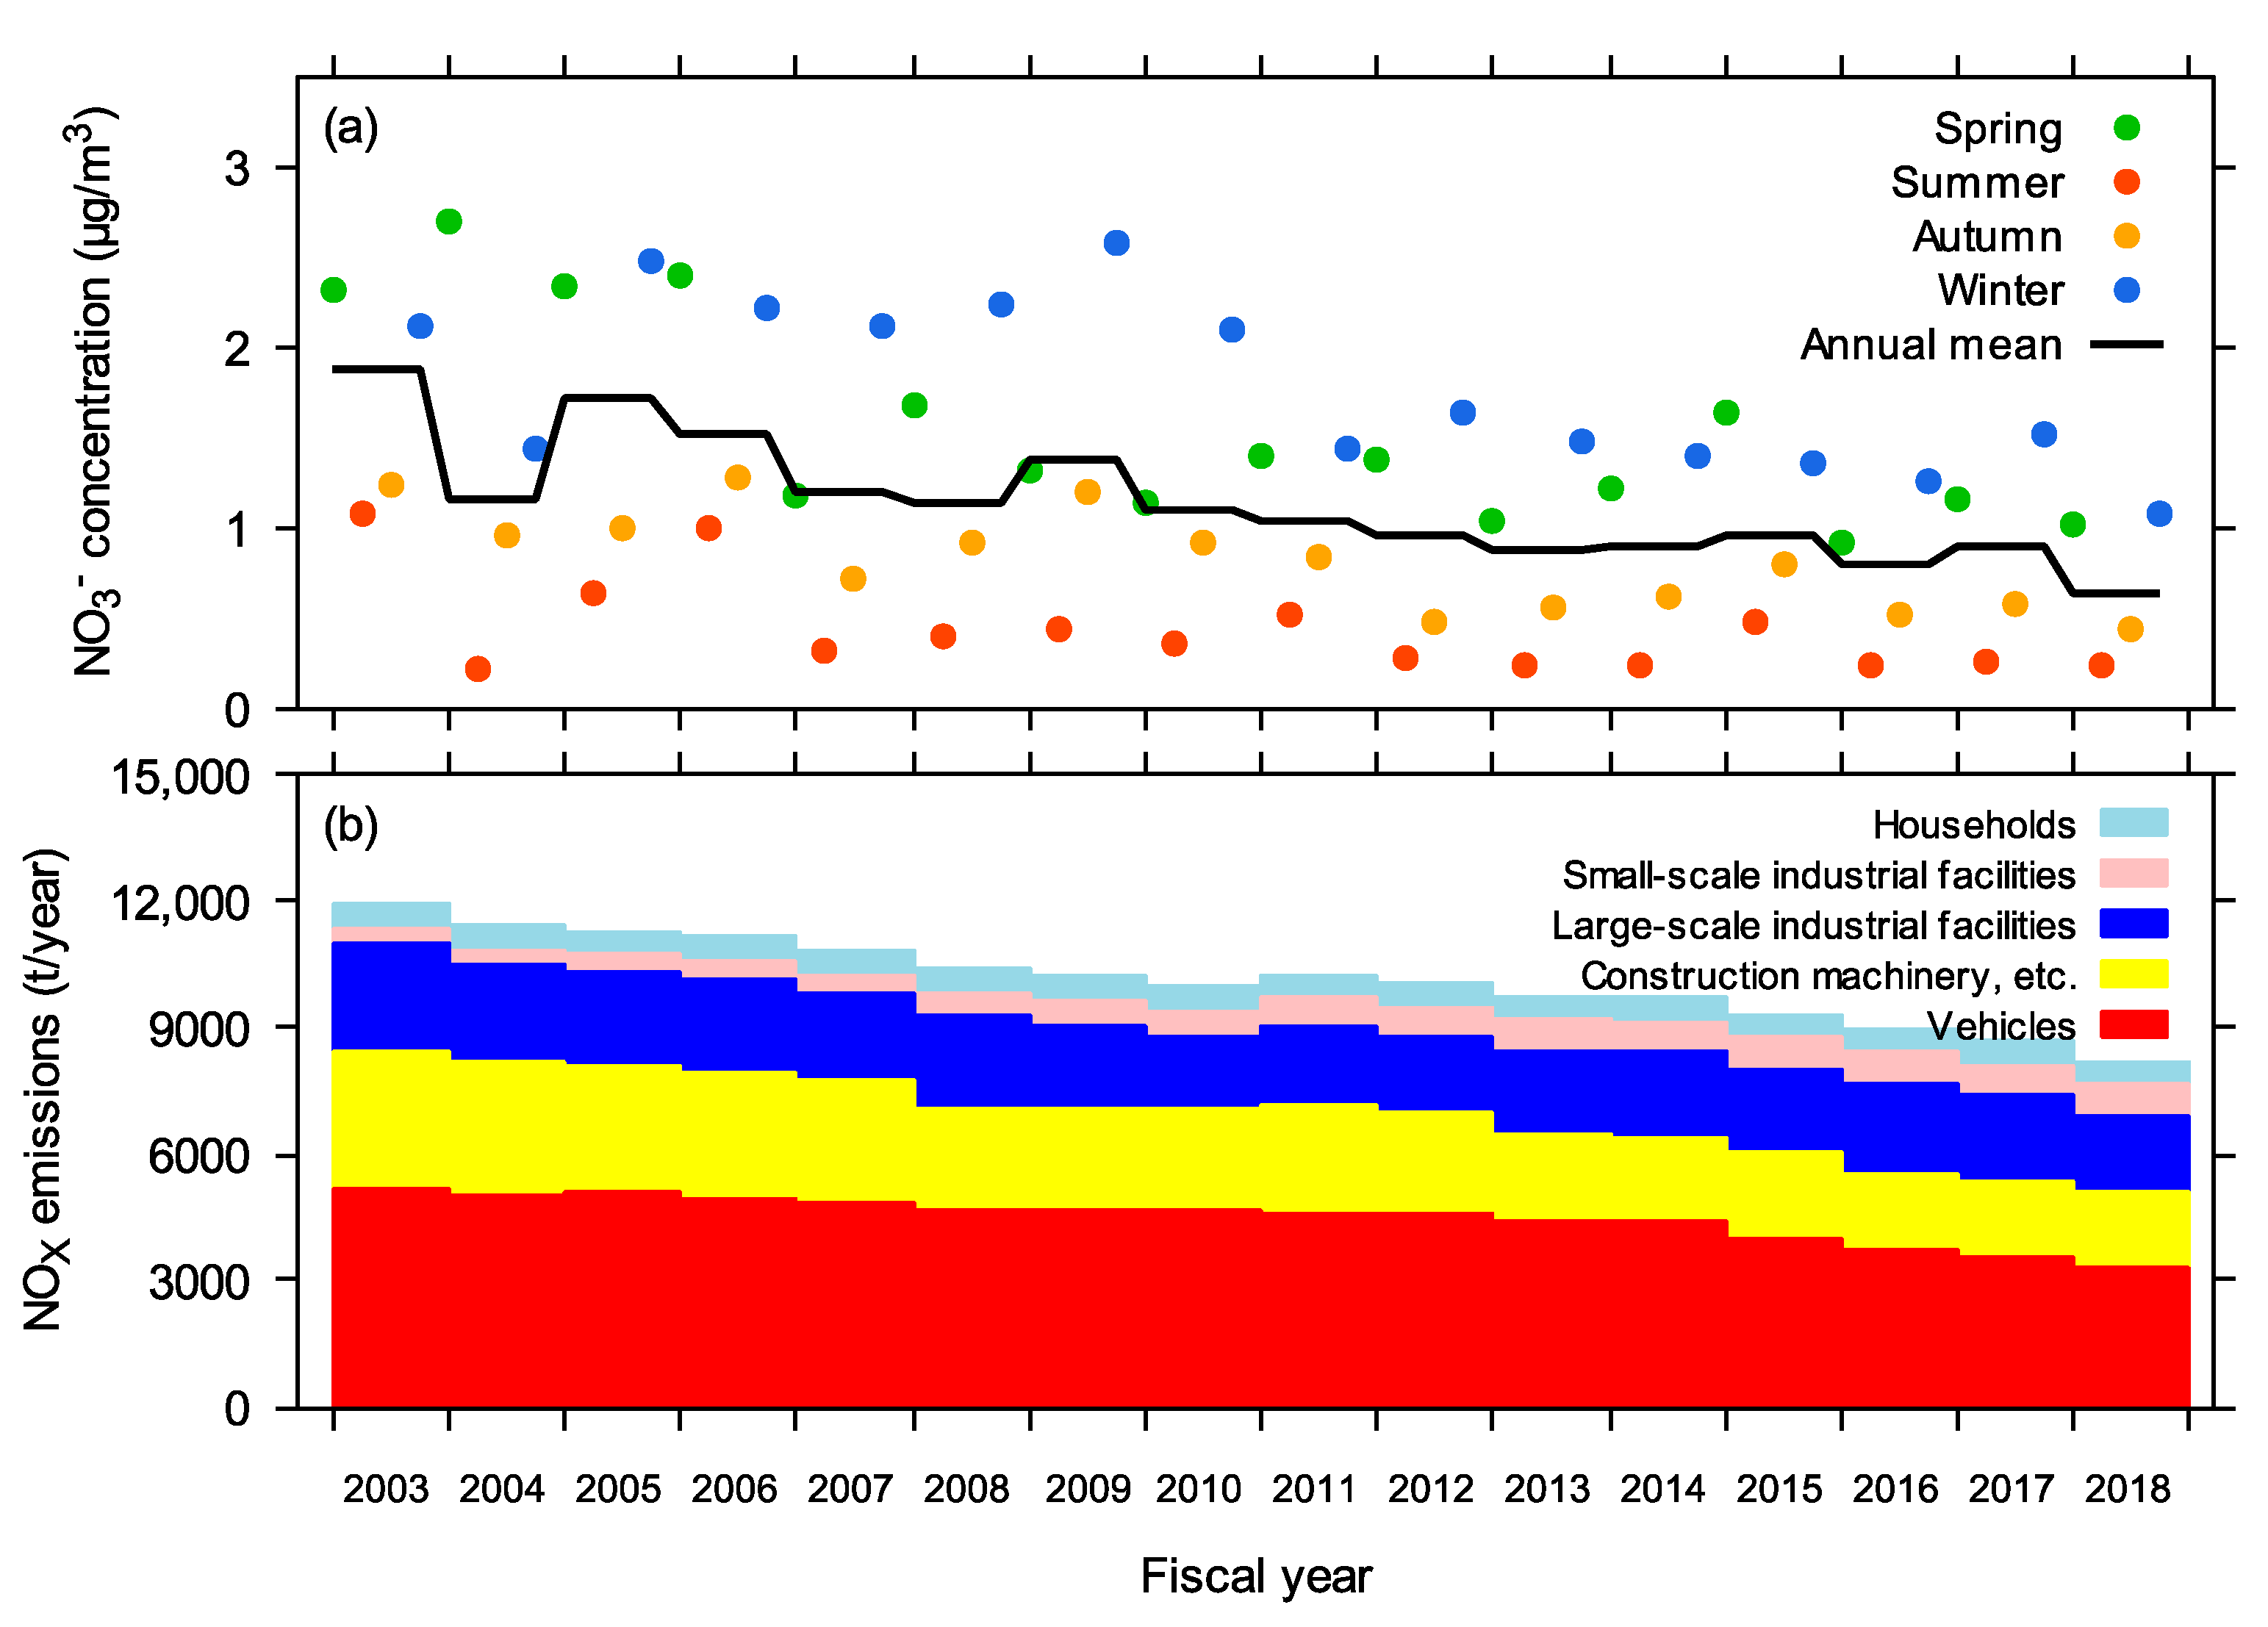
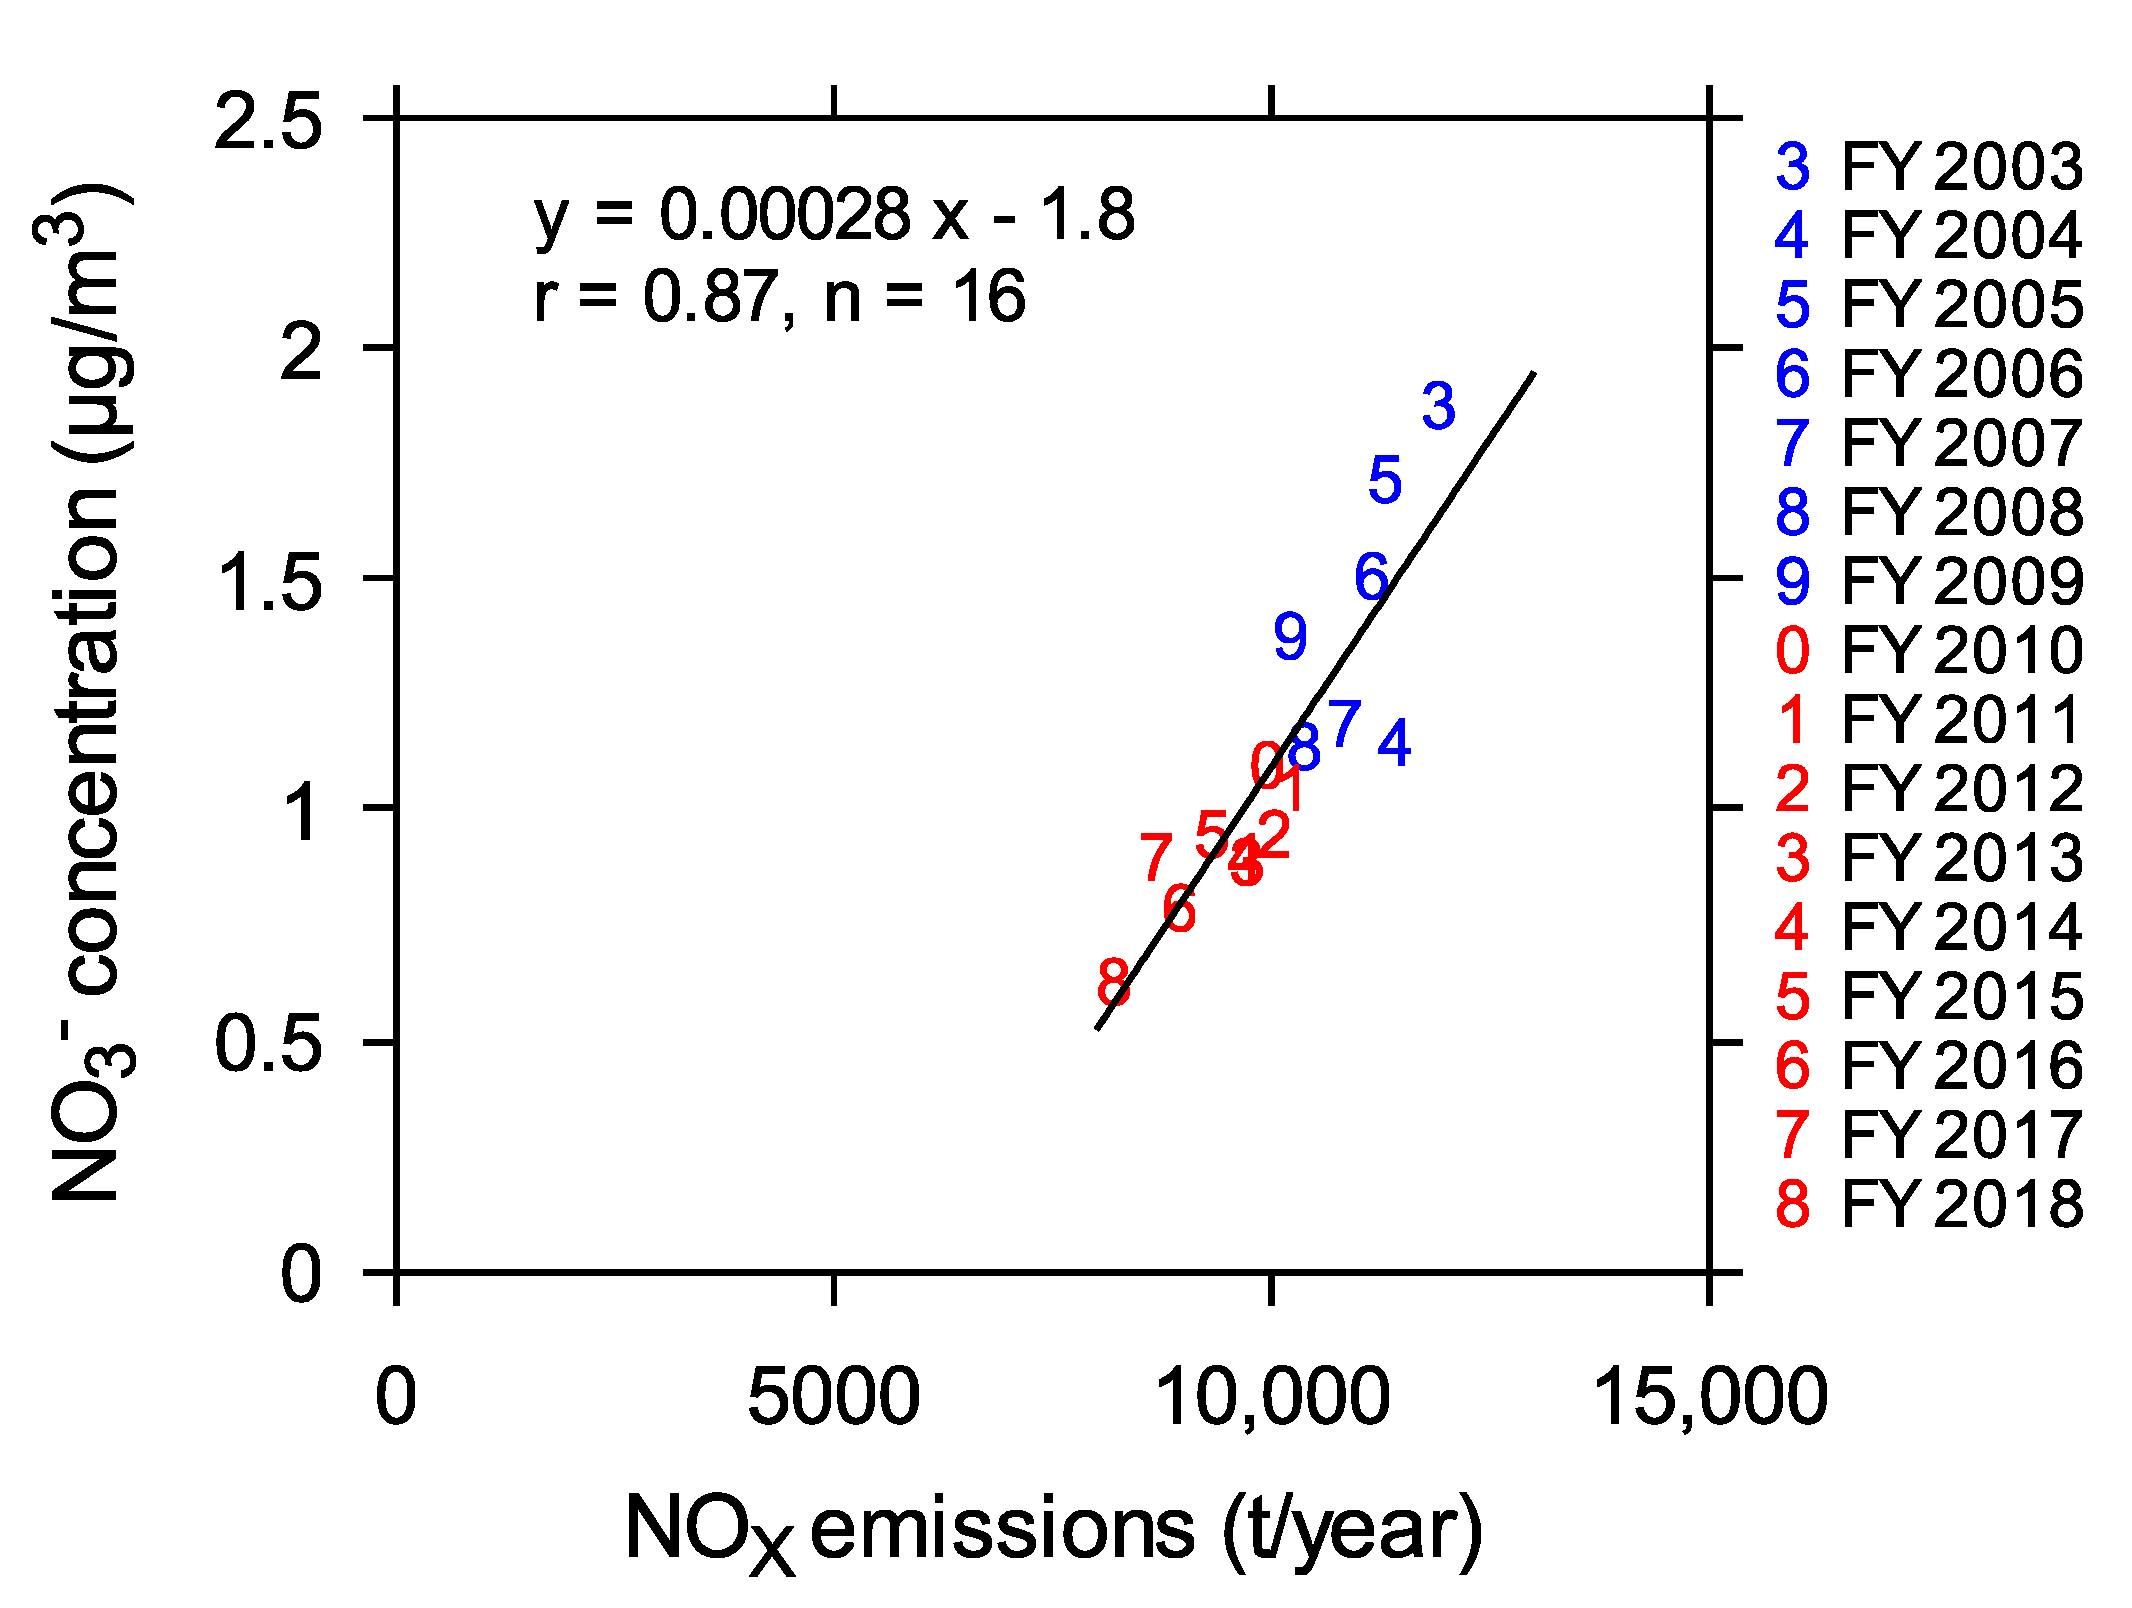
3.5. Nitrate (NO3−) in PM2.5
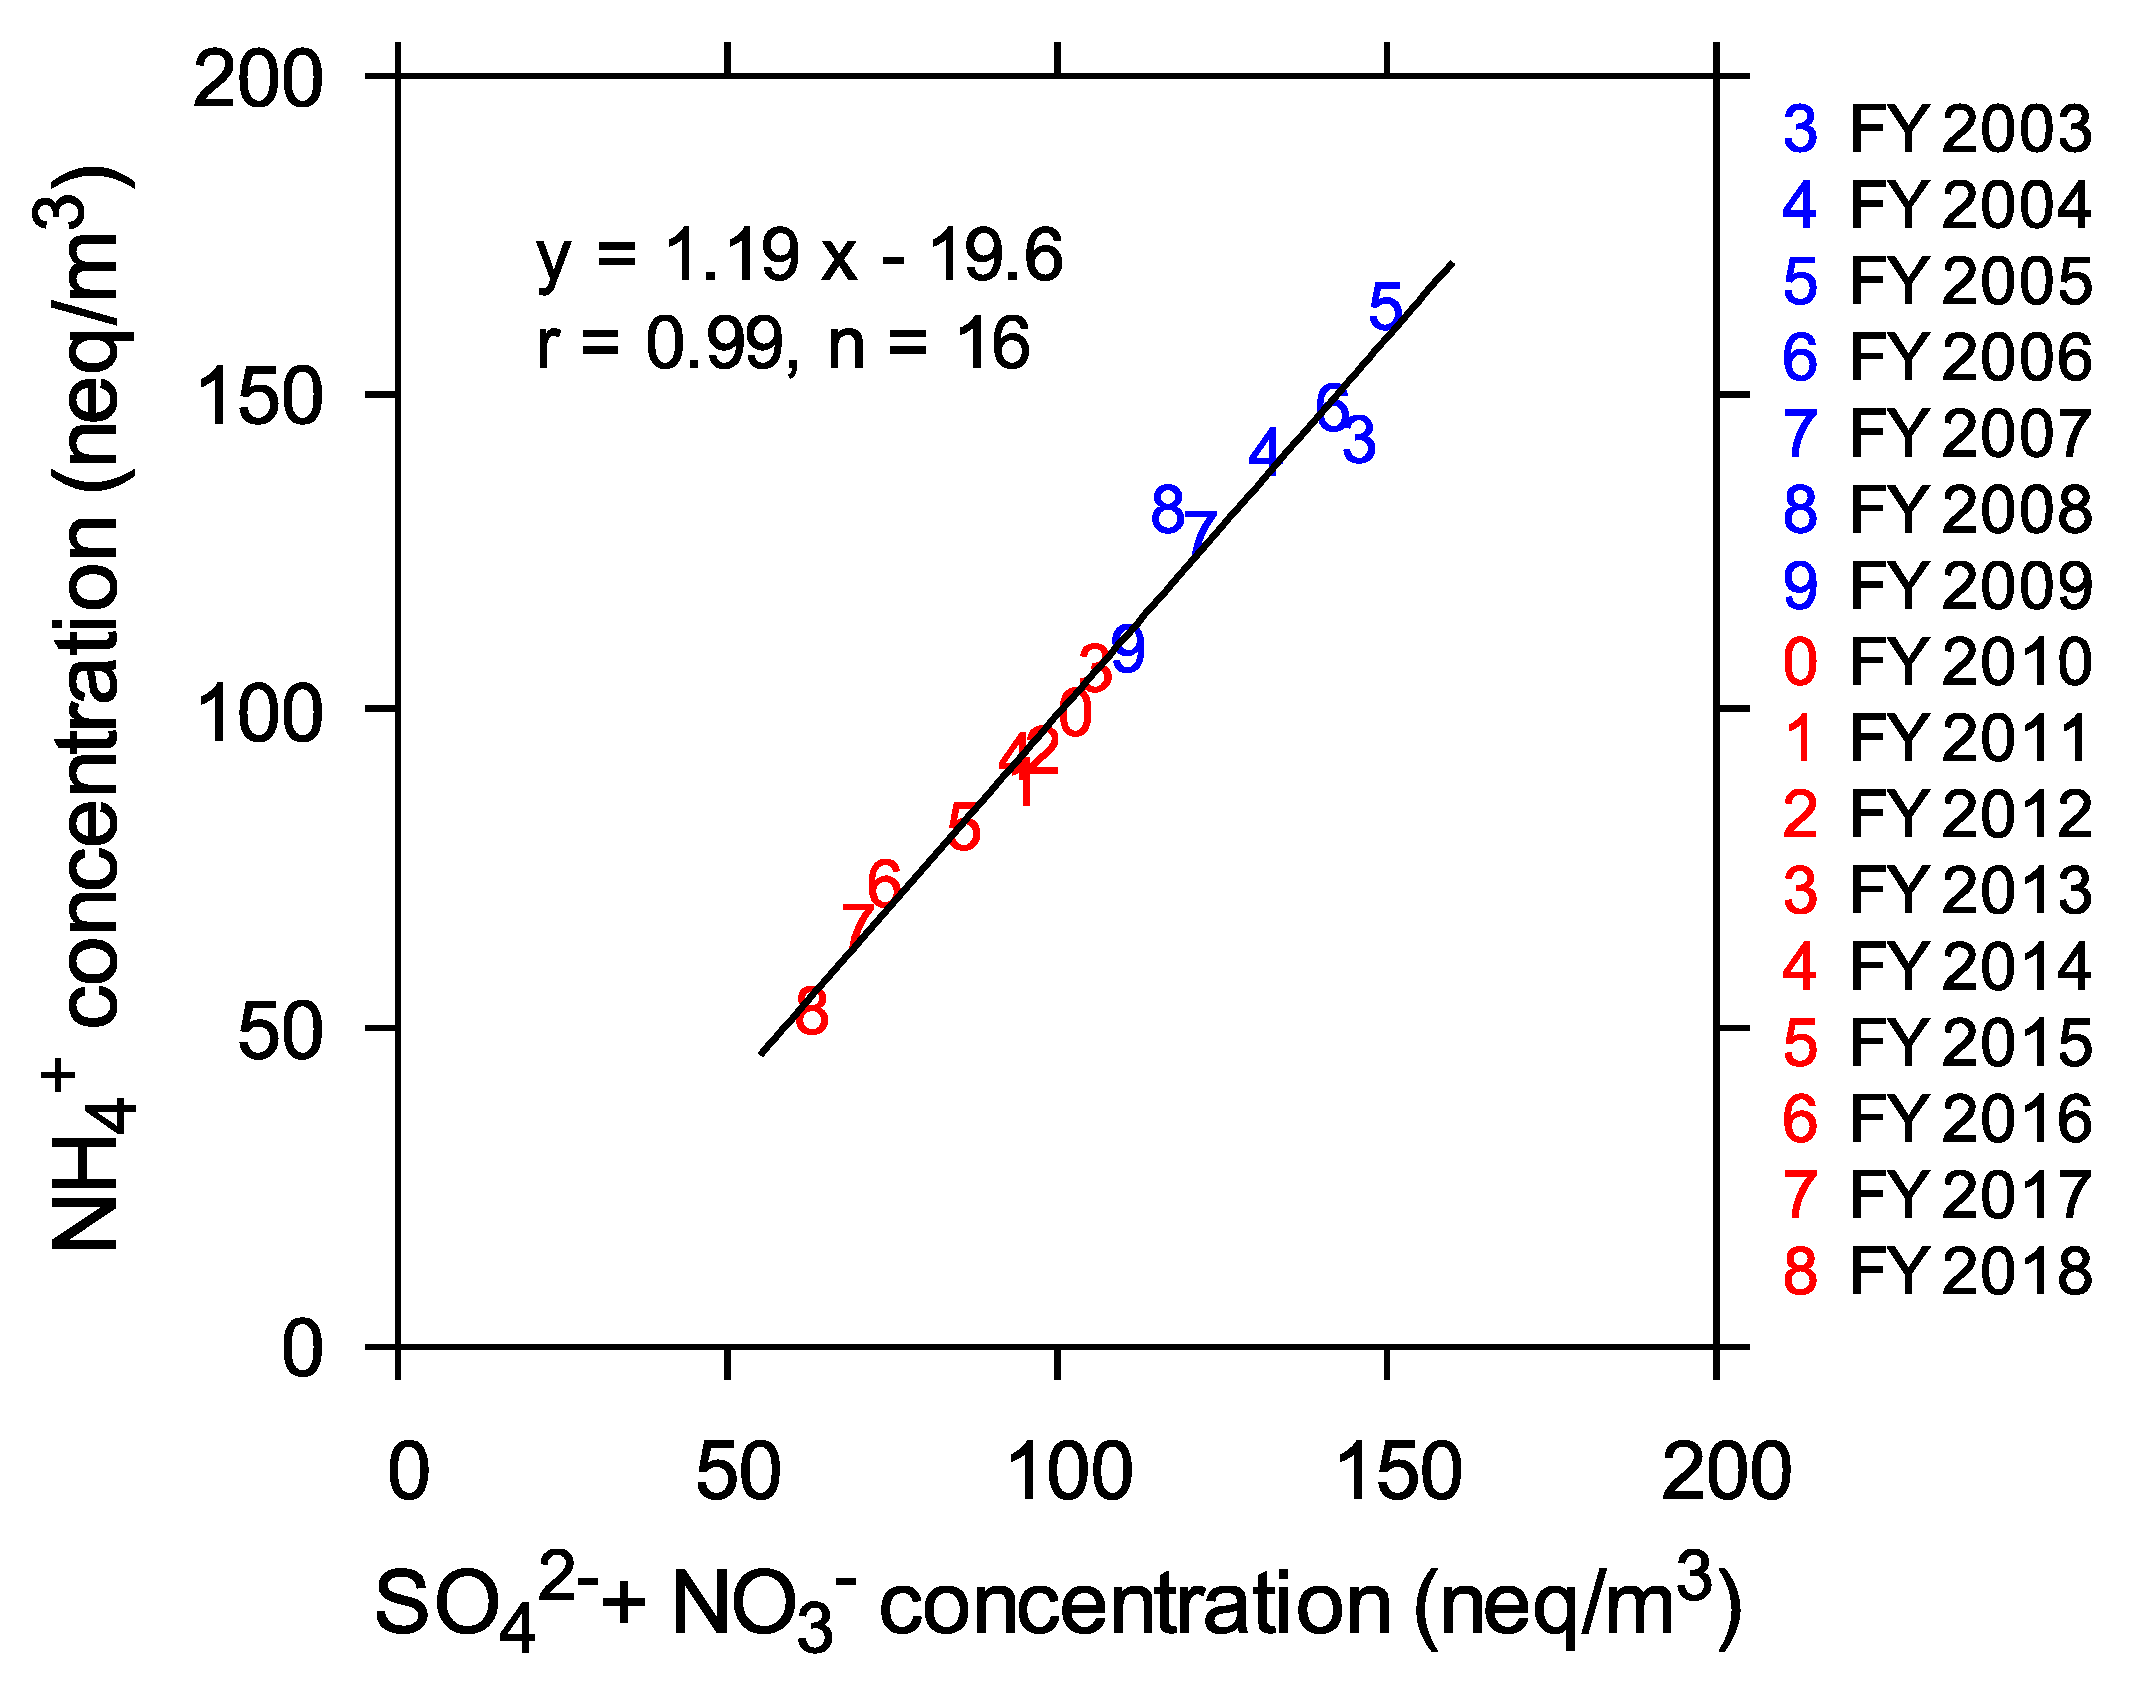
3.6. Ammonium (NH4+) in PM2.5
4. Conclusions
Author Contributions
Funding
Data Availability Statement
Acknowledgments
Conflicts of Interest
References
- ICRP. Human respiratory tract model for radiological protection. Ann. ICRP 1994, 24, 1–3. [Google Scholar] [CrossRef]
- Pope, C.A., III; Dockery, D.W. Health effects of fine particulate air pollution: Lines that connect. J. Air Waste Manag. Assoc. 2006, 56, 709–742. [Google Scholar] [CrossRef] [PubMed]
- Ueda, K.; Yamagami, M.; Ikemori, F.; Hisatsune, K.; Nitta, H. Associations between fine particulate matter components and daily mortality in Nagoya, Japan. J. Epidemiol. 2016, 26, 249–257. [Google Scholar] [CrossRef] [PubMed] [Green Version]
- Michikawa, T.; Yamazaki, S.; Ueda, K.; Yoshino, A.; Sugata, S.; Saito, S.; Hoshi, J.; Nitta, H.; Takami, A. Effects of exposure to chemical components of fine particulate matter on mortality in Tokyo: A case-crossover study. Sci. Total Environ. 2021, 755, 142489. [Google Scholar] [CrossRef] [PubMed]
- Wakamatsu, S.; Morikawa, T.; Ito, A. Air pollution trends in Japan between 1970 and 2012 and impact of urban air pollution countermeasures. Asian J. Atmos. Environ. 2013, 7, 177–190. [Google Scholar] [CrossRef] [Green Version]
- Ohara, T.; Akimoto, H.; Kurokawa, J.; Horii, N.; Yamaji, K.; Yan, X.; Hayasaka, T. An Asian emission inventory of anthropogenic emission sources for the period 1980–2020. Atmos. Chem. Phys. 2007, 7, 4419–4444. [Google Scholar] [CrossRef] [Green Version]
- Central Environment Council. Future Policy for Motor Vehicle Emission Reduction (Eighth Report). 2005. Available online: https://www.env.go.jp/en/air/aq/mv/vehicle-8th.pdf (accessed on 9 January 2021).
- Yamagami, M.; Ohara, T.; Nakashima, H.; Ikemori, F.; Hisatsune, K.; Ohba, K. Trends in chemical composition and pattern of high concentration of PM2.5 in Nagoya city. J. Jpn. Soc. Atmos. Environ. 2011, 46, 139–147. (In Japanese) [Google Scholar]
- Aikawa, M.; Ohara, T.; Hiraki, T.; Oishi, O.; Tsuji, A.; Yamagami, M.; Murano, K.; Mukai, H. Significant geographic gradients in particulate sulfate over Japan determined from multiple-site measurements and a chemical transport model: Impacts of transboundary pollution from the Asian continent. Atmos. Environ. 2010, 44, 381–391. [Google Scholar] [CrossRef]
- Peters, T.M.; Vanderpool, R.W.; Wiener, R.W. Design and calibration of the EPA PM2.5 Well Impactor Ninety-Six (WINS). Aerosol Sci. Technol. 2001, 34, 389–397. [Google Scholar] [CrossRef]
- Yamagami, M.; Ikemori, F.; Nakashima, H.; Hisatsune, K.; Osada, K. Decreasing trend of elemental carbon concentration with changes in major sources at Mega city Nagoya, Central Japan. Atmos. Environ. 2019, 199, 155–163. [Google Scholar] [CrossRef]
- Chow, J.C.; Watson, J.G.; Pritchett, L.C.; Pierson, W.R.; Frazier, C.A.; Purcell, R.G. The DRI thermal/optical reflectance carbon analysis system: Description, evaluation and applications in U.S. air quality studies. Atmos. Environ. 1993, 27A, 1185–1201. [Google Scholar] [CrossRef]
- Research Report on Emissions of Nitrogen Oxides and Particulate Matter in Nagoya City; Commissioned by the Nagoya City Environment Bureau in 2003; Asia Air Survey: Nagoya, Japan, February 2003. (In Japanese)
- Research Report on Emissions of Nitrogen Oxides and Particulate Matter in Nagoya City; Commissioned by the Nagoya City Environment Bureau in 2008; Asia Air Survey: Nagoya, Japan, October 2008. (In Japanese)
- Research Report on Emissions of Nitrogen Oxides and Particulate Matter in Nagoya City; Commissioned by the Nagoya City Environment Bureau in 2016; Asia Air Survey: Nagoya, Japan, February 2016. (In Japanese)
- MOE (Ministry of Environment, Japan). Investigation on Intensity and Total Amount of Emission from Motor Vehicle Exhaust. 2020. Available online: https://www2.env.go.jp/library/opac/Holding_list?rgtn=225307 (accessed on 28 October 2020). (In Japanese)
- MOE (Ministry of Environment, Japan): Diesel Exhaust Particulate Risk Assessment Report (in Japanese). 2002. Available online: https://www.env.go.jp/air/car/diesel-rep/h13/ (accessed on 27 April 2021).
- Ministry of Land, Infrastructure, Transport and Tourism. Annual Report on Auto Fuel Consumption Statistics. Available online: https://www.mlit.go.jp/k-toukei/saishintoukeihyou.html (accessed on 3 March 2021).
- Agency for Natural Resources and Energy. Energy Consumption by Sector. Available online: https://www.enecho.meti.go.jp/about/whitepaper/2020html/2-1-2.html (accessed on 3 March 2021).
- Nagoya City Environment Bureau. Environmental Annual Report Data Compilation in 2010. 2010; (In Japanese). Available online: https://iss.ndl.go.jp/books/R100000001-I041013016-00 (accessed on 27 April 2021).
- Nagoya City Environment Bureau. Environmental Annual Report Data Compilation in 2020. 2020; (In Japanese). Available online: https://www.city.nagoya.jp/kankyo/cmsfiles/contents/0000134/134923/41_r2_hakusho_shiryo_all.pdf (accessed on 3 March 2021).
- METI (Ministry of Economy, Trade and Industry, Japan) Pollutant Release and Transfer Register (PRTR). Available online: https://www.meti.go.jp/english/press/2014/0306_01.html (accessed on 3 March 2021).
- Nagoya City Environment Bureau. Environmental Annual Report Data Compilation in 2005. 2005; (In Japanese). Available online: https://iss.ndl.go.jp/books/R100000001-I026096213-00 (accessed on 27 April 2021).
- Nagoya City Environment Bureau. Environmental Annual Report Data Compilation in 2006. 2006; (In Japanese). Available online: https://iss.ndl.go.jp/books/R100000001-I026096627-00 (accessed on 27 April 2021).
- Nagoya City Environment Bureau. Environmental Annual Report Data Compilation in 2007. 2007; (In Japanese). Available online: https://iss.ndl.go.jp/books/R100000001-I026804646-00 (accessed on 27 April 2021).
- Nagoya City Environment Bureau. Environmental Annual Report Data Compilation in 2008. 2008; (In Japanese). Available online: https://iss.ndl.go.jp/books/R100000001-I025926239-00 (accessed on 27 April 2021).
- Nagoya City Environment Bureau. Environmental Annual Report Data Compilation in 2009. 2009; (In Japanese). Available online: https://iss.ndl.go.jp/books/R100000001-I026137532-00 (accessed on 27 April 2021).
- Nagoya City Environment Bureau. Environmental Annual Report Data Compilation in 2011. 2011; (In Japanese). Available online: https://iss.ndl.go.jp/books/R100000001-I046337519-00 (accessed on 27 April 2021).
- Nagoya City Environment Bureau. Environmental Annual Report Data Compilation in 2012. 2012; (In Japanese). Available online: https://iss.ndl.go.jp/books/R100000001-I049702009-00 (accessed on 27 April 2021).
- Nagoya City Environment Bureau. Environmental Annual Report Data Compilation in 2013. 2013; (In Japanese). Available online: https://iss.ndl.go.jp/books/R100000001-I061273616-00 (accessed on 27 April 2021).
- Nagoya City Environment Bureau. Environmental Annual Report Data Compilation in 2014. 2014; (In Japanese). Available online: https://iss.ndl.go.jp/books/R100000001-I068898788-00 (accessed on 27 April 2021).
- Nagoya City Environment Bureau. Environmental Annual Report Data Compilation in 2015. 2015; (In Japanese). Available online: https://iss.ndl.go.jp/books/R100000001-I071964390-00 (accessed on 27 April 2021).
- Nagoya City Environment Bureau. Environmental Annual Report Data Compilation in 2016. 2016; (In Japanese). Available online: https://iss.ndl.go.jp/books/R100000001-I081562133-00 (accessed on 27 April 2021).
- Nagoya City Environment Bureau. Environmental Annual Report Data Compilation in 2017. 2017; (In Japanese). Available online: https://iss.ndl.go.jp/books/R100000001-I088372233-00 (accessed on 27 April 2021).
- Nagoya City Environment Bureau. Environmental Annual Report Data Compilation in 2018. 2018; (In Japanese). Available online: https://ndlonline.ndl.go.jp/#!/detail/R300000001-I000000101319-00 (accessed on 28 April 2021).
- Nagoya City Environment Bureau. Environmental Annual Report Data Compilation in 2019. 2019; (In Japanese). Available online: https://ndlonline.ndl.go.jp/#!/detail/R300000001-I000000101319-00 (accessed on 28 April 2021).
- Nagoya City General Affairs Bureau. Nagoya City Statistical Yearbook. Available online: https://www.city.nagoya.jp/shisei/category/67-5-9-24-0-0-0-0-0-0.html (accessed on 3 March 2021).
- Stein, A.F.; Draxler, R.R.; Rolph, G.D.; Stunder, B.J.B.; Cohen, M.D.; Ngan, F. NOAA’s HYSPLIT atmospheric transport and dispersion modeling system. Bull. Am. Meteorol. Soc. 2015, 96, 2059–2077. [Google Scholar] [CrossRef]
- Osada, K.; Yamagami, M.; Hisatsune, K.; Ikemori, F.; Chatani, S. Sources of optical black carbon in Nagoya Bay area: Analysis under sea breeze condition. J. Jpn. Soc. Atmos. Environ. 2019, 54, 55–61. (In Japanese) [Google Scholar]
- Ikemori, F.; Uranishi, K.; Asakawa, D.; Nakatsubo, R.; Makino, M.; Kido, M.; Mitamura, N.; Asano, K.; Nonaka, S.; Nishimura, R.; et al. Source apportionment in PM2.5 in central Japan using positive matrix factorization focusing on small-scale local biomass burning. Atmos. Pollut. Res. 2021, 12, 349–359. [Google Scholar] [CrossRef]
- Chatani, S.; Shimadera, H.; Itahashi, S.; Yamaji, K. Comprehensive analyses of source sensitivities and apportionments of PM2.5 and ozone over Japan via multiple numerical techniques. Atmos. Chem. Phys. 2020, 20, 10311–10329. [Google Scholar] [CrossRef]
- MOE (Ministry of Environment, Japan). Volatile Organic Compounds (VOC) Emission Inventory Report, FY 2017. 2018; p. 6. Available online: https://www.env.go.jp/air/%20air/osen/voc/H29-mainR.pdf (accessed on 15 April 2021). (In Japanese)
- Science Portal China. China Statistical Yearbook. Available online: https://spc.jst.go.jp/statistics/statictisc_index.html (accessed on 15 March 2021).
- Wessel, P.; Smith, W.H.F. New, Improved version of generic mapping tools released. EOS Trans. Amer. Geophys. Union. 1998, 79, 579. [Google Scholar] [CrossRef]


Publisher’s Note: MDPI stays neutral with regard to jurisdictional claims in published maps and institutional affiliations. |
© 2021 by the authors. Licensee MDPI, Basel, Switzerland. This article is an open access article distributed under the terms and conditions of the Creative Commons Attribution (CC BY) license (https://creativecommons.org/licenses/by/4.0/).
Share and Cite
Yamagami, M.; Ikemori, F.; Nakashima, H.; Hisatsune, K.; Ueda, K.; Wakamatsu, S.; Osada, K. Trends in PM2.5 Concentration in Nagoya, Japan, from 2003 to 2018 and Impacts of PM2.5 Countermeasures. Atmosphere 2021, 12, 590. https://doi.org/10.3390/atmos12050590
Yamagami M, Ikemori F, Nakashima H, Hisatsune K, Ueda K, Wakamatsu S, Osada K. Trends in PM2.5 Concentration in Nagoya, Japan, from 2003 to 2018 and Impacts of PM2.5 Countermeasures. Atmosphere. 2021; 12(5):590. https://doi.org/10.3390/atmos12050590
Chicago/Turabian StyleYamagami, Makiko, Fumikazu Ikemori, Hironori Nakashima, Kunihiro Hisatsune, Kayo Ueda, Shinji Wakamatsu, and Kazuo Osada. 2021. "Trends in PM2.5 Concentration in Nagoya, Japan, from 2003 to 2018 and Impacts of PM2.5 Countermeasures" Atmosphere 12, no. 5: 590. https://doi.org/10.3390/atmos12050590