
Cinnamaldehyde inhibits the growth of Phytophthora capsici through disturbing metabolic homoeostasis
- Published
- Accepted
- Received
- Academic Editor
- Pedro Silva
- Subject Areas
- Agricultural Science, Microbiology, Plant Science, Toxicology
- Keywords
- Phytophthora capsici leonian, Cinnamaldehyde, Bioactivity, Quantitative proteomics, Mechanism of action
- Copyright
- © 2021 Wang et al.
- Licence
- This is an open access article distributed under the terms of the Creative Commons Attribution License, which permits unrestricted use, distribution, reproduction and adaptation in any medium and for any purpose provided that it is properly attributed. For attribution, the original author(s), title, publication source (PeerJ) and either DOI or URL of the article must be cited.
- Cite this article
- 2021. Cinnamaldehyde inhibits the growth of Phytophthora capsici through disturbing metabolic homoeostasis. PeerJ 9:e11339 https://doi.org/10.7717/peerj.11339
Abstract
Background
Phytophthora capsici Leonian (P. capsici) can cause wilting and roots rotting on pepper and other cash crops. The new fungicide cinnamaldehyde (CA) has high activity against this pathogen. However, its potential mechanism is still unknown.
Methods
In order to gain insights into the mechanism, isobaric tags for relative and absolute quantification (iTRAQ)-based quantitative proteomics was used to analyze P. capsici treated with CA. The iTRAQ results were evaluated by parallel reaction monitoring (PRM) analysis and quantitative real-time PCR (qRT-PCR) analysis. Kyoto Encyclopedia of Genes and Genomes (KEGG) enrichment analysis was used to speculate the biochemical pathways that the agent may act on.
Results
The results showed that 1502 differentially expressed proteins were identified, annotated and classified into 209 different terms (like metabolic process, cellular process, single-organism process) based on Gene Ontology (GO) functional enrichment analysis and nine different pathways (glyoxylate and dicarboxylate metabolism, fatty acid metabolism and so on) based on the Kyoto Encyclopedia of Genes and Genomes (KEGG) enrichment analysis. This study suggested that CA disordered fatty acid metabolism, polysaccharide metabolism and leucine metabolism. Based on PRM analysis, five proteins including CAMK/CAMK1 protein kinase, glucan 1,3-beta-glucosidase, 1,3-beta-glucanosyltransferase, methylcrotonoyl-CoA carboxylase subunit alpha and isovaleryl-CoA dehydrogenase were down-regulated in P. capsici treated with CA. Furthermore, the qRT-PCR analysis showed that the gene expression level of the interested proteins was consistent with the protein expression level, except for CAMK/CAMK1 protein kinase, acetyl-CoA carboxylase and fatty acid synthase subunit alpha.
Conclusions
CA destroyed the metabolic homoeostasisof P. capsici, which led to cell death. This is the first proteomic analysis of P. capsici treated with CA, which may provide an important information for exploring the mechanism of the fungicide CA against P. capsici.
Introduction
Phytophthora capsici Leonian, a soilborne oomycete pathogen, can attack many important cash crops, such as solanaceous, legume and most cucurbit hosts (Lamour et al., 2012). The pathogen affects the plants at any development stage and causes damping-off, seedling blight and wilting followed by plant death (Jin et al., 2016). P. capsici was described in New Mexico in 1922 for the first time (Leonian, 1922) and had been spread all over the world. It is estimated that this pathogen caused more than one billion dollars loss to global vegetable production each year (Lamour et al., 2012). So far, the diseases caused by P. capsici have had damaging impact on the world economy (Chen et al., 2013).
The control of Phytophthora infection is still a persistent agricultural problem. Although crop rotation is an essential basis for disease control, P. capsici oospores can survive in the soil for a long time, which obviates its use as antimicrobial strategy (Bishop-Hurley et al., 2002; Hausbeck & Lamour, 2004). Furthermore, the selection of long-lasting and host-resistant varieties may be one of the most effective disease management methods, but currently there are few phytophthora blight-resistant varieties on the market with horticultural traits acceptable to growers (Hausbeck & Lamour, 2004; Ristaino & Johnston, 1999). Therefore, the most commonly implemented measures to control pepper blight are applying chemical fungicides, such as treating the soil with methyl bromide or metalaxyl, or spraying metalaxyl or metalaxyl on plants. Unfortunately, due to the long-term use and highly variable nature of P. capsici, some strains had developed resistance or tolerance to these fungicides (Lamour & Hausbeck, 2000; Parra & Ristaino, 2001; Silvar, Merino & Dilv, 2006; Dunn et al., 2010), and there is a limited number of fungicides that can be used against the pathogen (Mei et al., 2015; Pang et al., 2015). So, it is urgent to find more environmentally friendly and safe botanical fungicides.
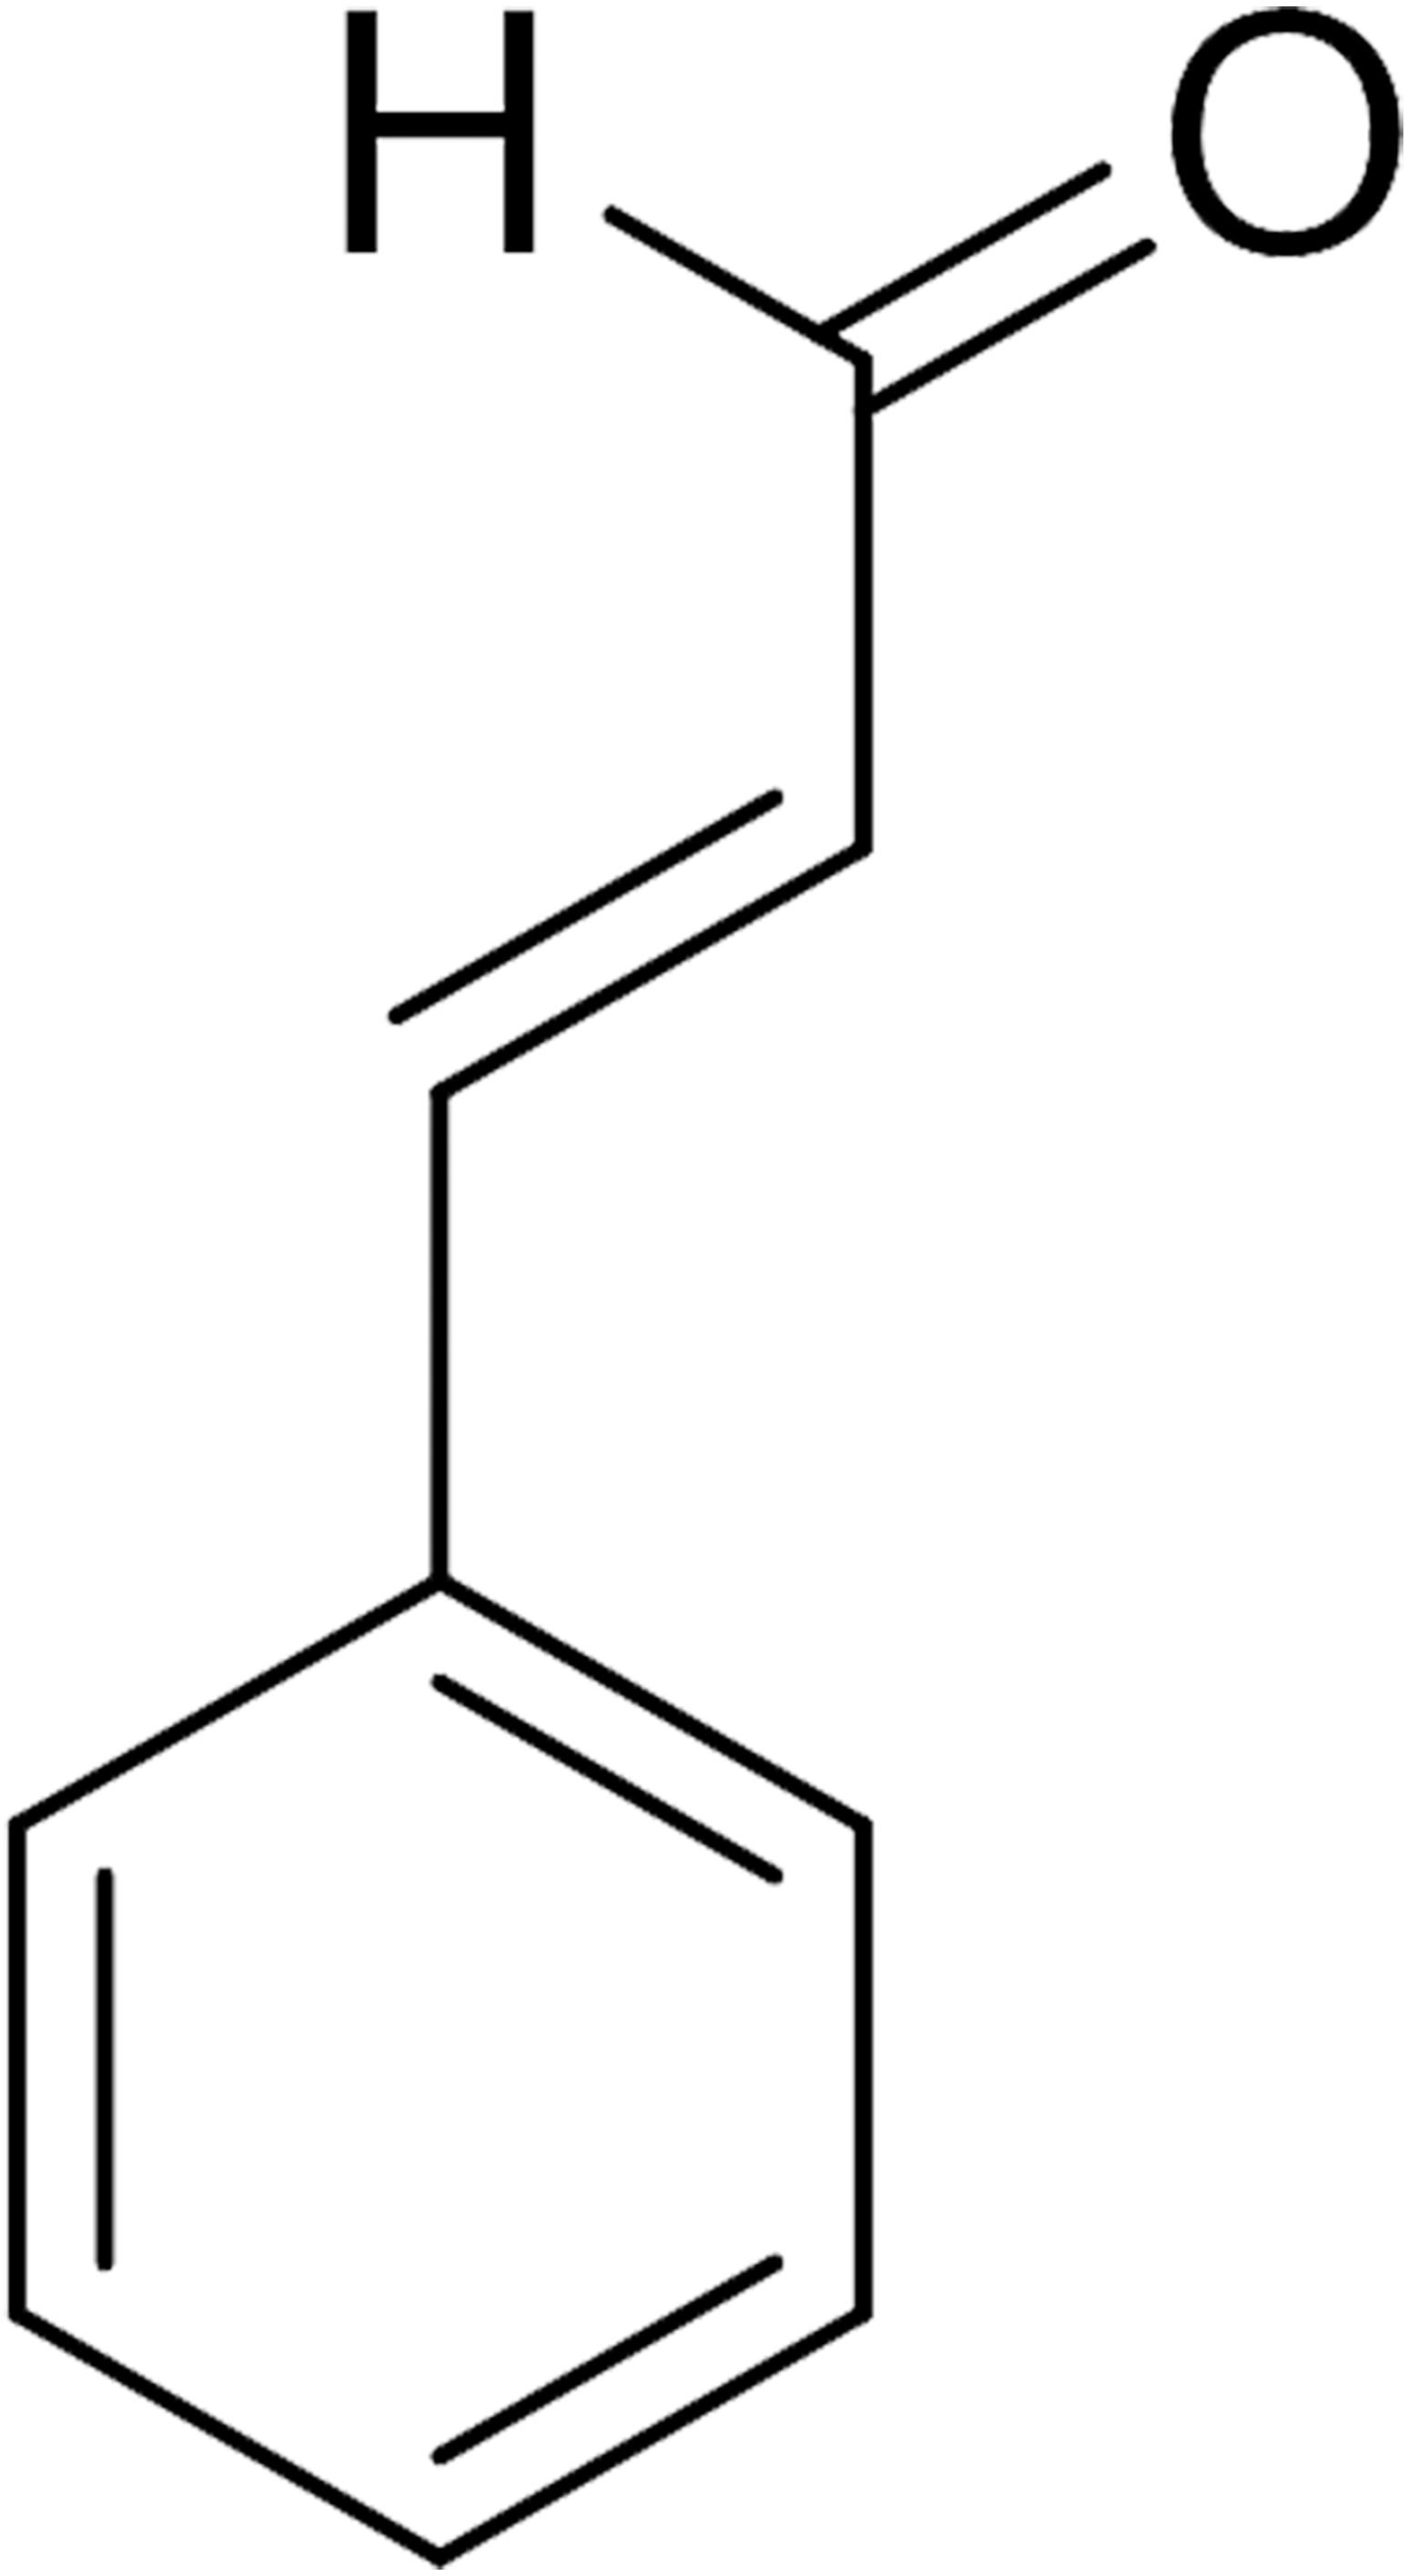
Cinnamaldehyde (CA) (Fig. 1) was extracted from the bark and leaves of cinnamon trees, which is the main active ingredients of cinnamon essential oils (Friedman, 2017). CA was used in the food industry due to its antimicrobial activity against bacteria (He et al., 2019), yeast, and filamentous fungi (Sun et al., 2016; Sun et al., 2020). In addition, more interest has been focused on the exploration of CA and its derivatives as promising antifungal drugs (Shreaz et al., 2016). To date, existing experimental evidence shows that CA exerts antimicrobial effects by inhibiting the ATPase activity (Usta et al., 2003), cell wall biosynthesis (OuYang et al., 2019), altering membrane structure and integrity (Huang et al., 2018) and inhibiting cell separation (Kwon, Yu & Park, 2003). Recently, it is speculated that the inhibitory effect of CA on the growth of P. capsici was realized by mediating Ca2+ efflux in cells (Hu et al., 2013), which provides a significant new idea for the antimicrobial mechanism of CA. However, the target of CA in fungi is not yet clear, which requires more research.
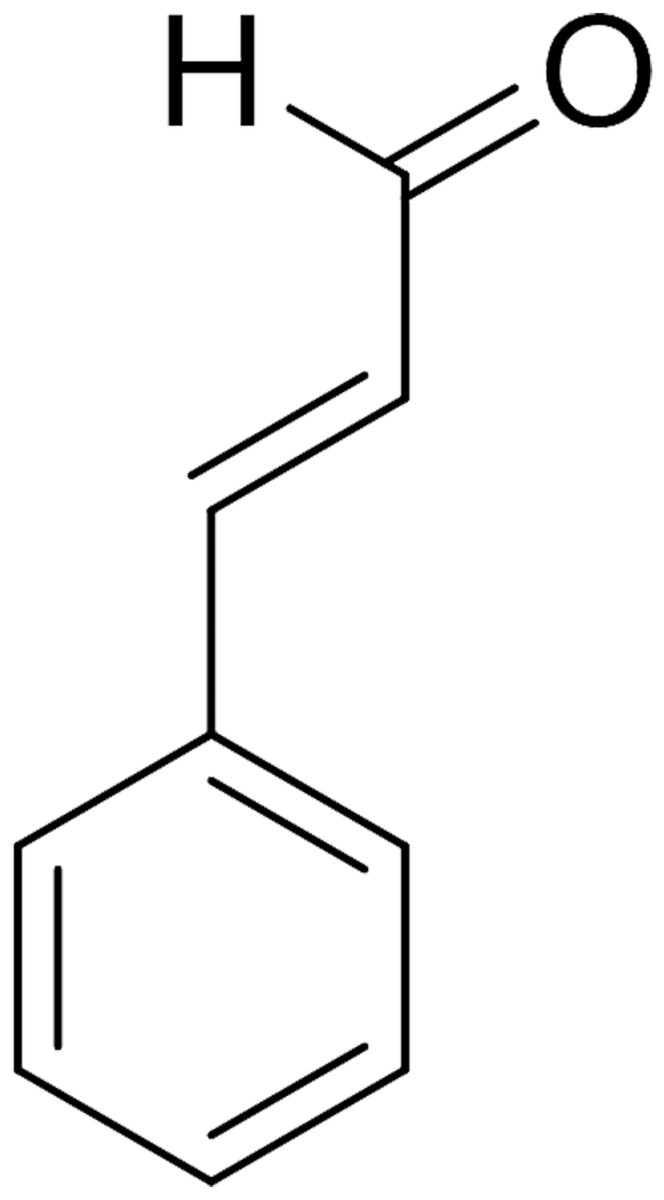
Figure 1: Chemical structure of CA.
At present, proteomics has been widely used in the field of medicine for target discovery, drug action pattern study and toxicological evaluation of chemical agents (Bantscheff et al., 2007; Ahn & Wang, 2008; Uddin et al., 2019; Xia et al., 2021). However, there are few research reports on the mechanism of action of fungicides by proteomics. Hou et al. (2013) applied proteomic based on two-dimensional gel electrophoresis (2-DE) to analyze the effect of fungicides JS399-19 on protein expression of Fusarium graminearum. Mei et al. (2014) also used the 2-DE to study the mechanisms of zoxamide against Phytophehora cactorum. The novel antifungal mechanism of benzothiazole against P. capsici was explored by proteomic analysis based on iTRAQ combined with transcriptome analysis (Mei et al., 2018). Among these methods, iTRAQ has become an effective tool for exploring the target of fungicides (OuYang, Tao & Zhang, 2018). In this study, to gain more insights into the mechanisms underlying CA toxicity, the expression levels of proteins in P. capsici treated with CA were analyzed by iTRAQ. Alterations in protein expression levels were verified using qRT-PCR and PRM (Peterson et al., 2012; Sowers et al., 2015). The proteins related to the inhibition of CA were found, which provided a scientific basis for revealing the inhibition mechanism of CA.
Material and Methods
Strain and reagents
P. capsici susceptible to conventional treatments was isolated and purified from a stem base of the diseased pepper in Henan Province of China. Single-spore isolate was obtained and cultured for 3 days at 25 °C on V8 agar plates in full darkness for subsequent experiments, in which V8 agar medium was composed of 100 mL filtered V8 juice, 900 mL deionized water, 1.5 g CaCO3 and 20 g agar. V8 medium, which was consisted of 100 mL filtered V8 juice, 0.02 g CaCO3 and 900 mL deionized water, was prepared for a large number of mycelia of P. capsici.
Technical-grade CA was purchased from Sigma and its assay was ≥95%. It was dissolved in acetone and Tween 80 to 3 mg/mL for subsequent experiments, in which acetone and Tween 80 were used as solvents. The medical solution was stored at 4 °C in the dark. qRT-PCR Kit and fluorescence quantitative PCR kit were purchased from TaKaRa [TaKaRa Biotechnology (Dalian) Co., Ltd., China]. Q5 Hot Start High-Fidelity2 × Master Mix was purchased from New England BioLabs (United States).
In vitro effect of CA on mycelial growth of P. capsici
Mycelial growth inhibition was used to determine the inhibitory effect of CA on P. capsici according to Khan et al.’s method (2011). CA solution was serially diluted by sterile water with 0.4% (vol/vol) acetone and Tween 80 and the desired concentration of CA emulsions were prepared. one mL of CA emulsion was blended with nine mL of V8 agar medium at 40–45 °C to obtain the agar plates amended with CA at 50, 80, 120, 150 and 250 mg/L. The same volume of solvents only was considered as the control.
A fresh mycelial disc (five mm in diameter) was obtained from culturing 3 days P. capsici dish and placed on treated plates (90 mm in diameter) after this medium solidification. After six days, each colony diameter was measured by the cross method. And the average value of the colony diameter was used for later data analysis. Each test group was repeated three replicates. According to the formula, the inhibitory rate of CA on the growth of P. capsici was calculated. By analyzing the correlation between the logarithm of the CA concentration and the probability value of the P. capsici colony growth inhibition rate, the virulence regression equation was obtained. The effective concentration for 50% and 75% inhibition of P. capsici mycelial growth (EC50, EC75) were estimated by the toxicity regression equation (Hou et al., 2020).
Among them, C and T are colony diameter in the control sample and the treated sample respectively.
Effect of CA on P. capsici mycelium morphology
Mycelium morphology was observed by scanning electron microscope. A mycelial disc was placed into Petri dish containing 10 mL of V8 agar medium with a final concentration of 140 mg/L CA. The same volume of solvents only was considered as the control. After 3 days, mycelia were cut into 0.5 cm*0.5 cm pieces and fixed in 2.5% (w/v) glutaraldehyde at room temperature for 24 h. In order to remove the glutaraldehyde solution, the samples were washed with 0.1M PBS (pH = 7.2). The samples were fixed with 1% OSO4 for 1–2 h. The fixed solution in the sample was washed away by sterile water. The samples were dehydrated by serial rinses with ethanol in water solutions with 30% ethanol for 15 min, 50% ethanol for 20 min, 70%, 80%, 90%, 95%, 100% ethanol for 20 min respectively. After samples were dried and sprayed with gold, P. capsici mycelium morphology was observed under Scanning electron microscope.
Sample preparation for proteomic analysis
P. capsici was incubated on V8 agar medium at 25 °C in the dark for 3 days, and then mycelial plugs were obtained at 1/3 of the edge of the colony. Five mycelial plugs were put into Petri dish with 10 mL V8 medium for 3 days, and the culture medium was complemented with CA to produce a final concentration 140 mg/L. Petri dish with no CA was made as control. The mycelia were collected by centrifugation (4 °C, 4 000g, 15 min) and then discarded the supernatant. The mycelia were washed for 3 times with PBS (pH = 7.4) buffer and stored at −80 °C.
Protein extraction and hydrolysis
Total protein was extracted by acetone/ trichloroacetic acid (TCA) precipitation and SDT lysis method (Méchin, Damerval & Zivy, 2007). Mycelia were pulverized with liquid nitrogen in a mortar and poured into five-time-volume of TCA/ acetone and mixed by vortex. Then they were placed at −20 °C for 5 h. After the supernatant was removed by centrifugation (6000 g for 40 min at 4 °C), the samples were dried in a fume hood to obtain dry powder. The samples were lysed by putting into SDT lysate. The supernatant was collected by centrifugation (14000 g for 40 min) and filtered with a 0.22 M filter. The protein concentration was determined by the BCA protein assay. The total protein concentration was diluted to 100 mM by adding DTT. The mixture was eluted with UA buffer, IAA buffer and dissolution buffer at room temperature and hydrolyzed with 0.1 g/L trypsin buffer at 37 °C for 16 h. Then the peptide fragment was desalted with C18 Cartridge and the lyophilized peptide was dissolved with 40 µL dissolution buffer.
iTRAQ sample labeling and LC-MS/MS analysis
Six samples (three biological replicates) were labeled with the iTRAQ tags as follows: solvent control (113, 114 and 115), CA treatments (116, 117 and 118). These peptides were incubated and centrifuged in vacuo until dried. The labeled samples were pooled and then graded by using AKTA Purifier 100. The chromatographic column was balanced with loading buffer A (10 mM KH2PO4 in 25% ACN). The samples were eluted by gradient elution in liquid chromatography. During elution process, the absorbance was detected at 214 nm, and each fraction was separated for one minute. About 30 fractions were obtained and desalted with C18 cartridge after being lyophilized.
Each sample was separated using Nano-HPLC system Easy-nLC. The column was equilibrated with 95% loading buffer A. After the sample was loaded by the autosampler, it was separated by the analytical column. A linear gradient was performed at a velocity of flow of 300 nL/min for 1 h. The loading buffer B (10 mM KH2PO4 and 500 mM KCl in 25%ACN) was also gradient elution in chromatography.
Proteomics data processing
This study referred to the uniprot Phytophthora protein database. The data was analyzed as Ross et al.’s (2004) described. In short, a normal distribution of iTRAQ ratios was obtained by log2 conversion. And then logarithm, population mean and standard deviation were normalized respectively. Proteins with 1.2-fold change between the two treatments (P < 0.05) were identified as differentially expressed proteins, in which were analyzed by GO and KEGG analysis. An average linkage hierarchical clustering analysis was conducted on interested proteins using Multiple Experiment Viewer (MEV v 4.9.0).
Parallel reaction monitoring (PRM) Analysis
After the same mass protein of each sample was digested by trypsin, the peptide was desalted on the C18 column. The TripleTOF 5600+ LC-MS/MS system (AB SCIEX) was used for targeted MS analysis in PRM. The mass resolution of MS1 scan and MS/MS scan were ∼35000 and ∼15000, respectively. MS data acquisition was carried out in DDA mode to obtain proteins and peptide precursor ions, which were identified by ProteinPilot software. PRM acquisition included a MS1 scan (250 ms), and then a target MS/MS scan, with a period of 1.3–3.3 s. Finally, target proteins were introduced into the software Skyline for processing.
RNA extraction and qRT-PCR analysis
The mycelia cultured in V8 medium for 3 days (solvent control, CA treatment) were collected in 1.5 mL centrifuge tubes, centrifuged (8000 g, 2 min), and then pulverized with liquid nitrogen in a mortar. Total RNA was extracted with TRIZOL. The RNA was disposed using RNase free DNAse (TaKaRa) at 42 °C for 2 min for removing the DNA contamination. The synthetic cDNA was synthesized from 1 µg of total RNA by a reverse transcription kit. Reaction mixtures (12 µL) contained 6 µL of SYBR Green (TaKaRa), 0.5 μL of forward gene-specific primer, 0.5 µL of reverse gene-specific primer, 1 µL of cDNA, and 4 µL of ddH2O. Primers were listed in Table S1. The G3PDH gene was used as the reference.
Data analysis
All experiments were performed thrice. The data were analyzed using one-way analysis of variance (ANOVA) with PASW Statistics 20.0. Differences with P values <0.05 were considered statistically significant.
Results
Inhibitory effect of CA on mycelial growth of P. capsici
The CA obviously effect the mycelial radical elongation of P. capsici (Fig. 2). CA of higher concentration showed stronger inhibitory effect against P. capsica. The toxic regression equation of the CA for P. capsici was Y = − 6.1485 + 5.5080X. Moreover, the EC50 and EC75 values of CA against P. capsici were 105.69 and 140.12 mg/L respectively.
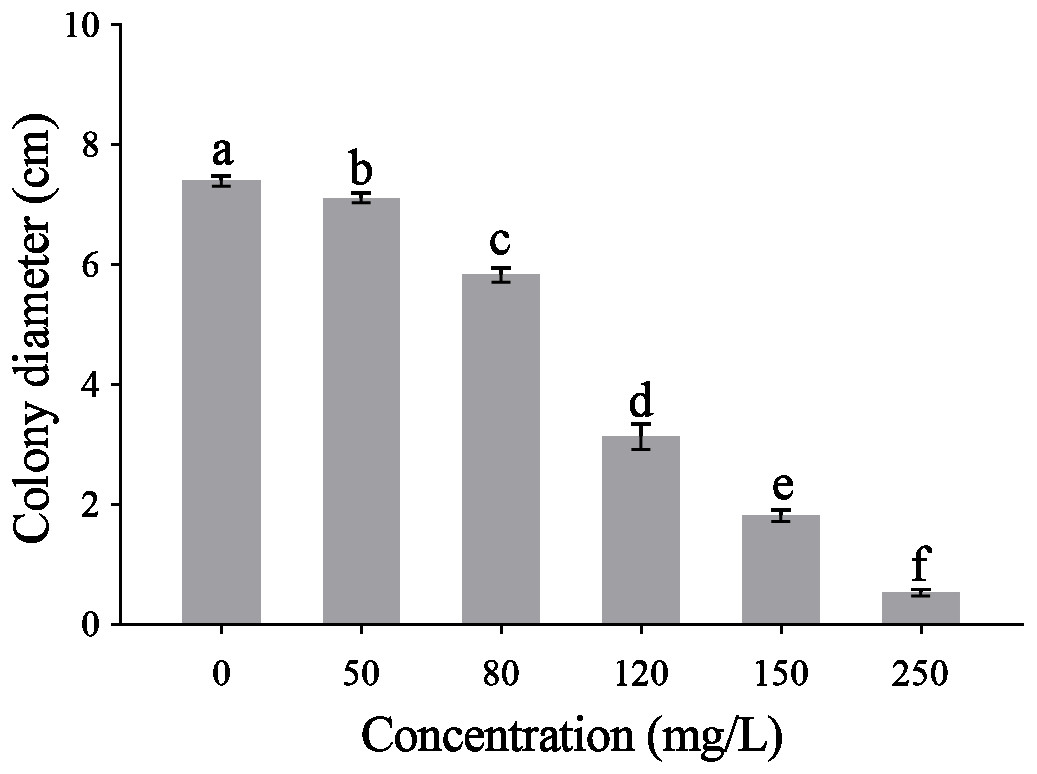
Figure 2: Mycelial growth of P. capsici is affected by CA.
P. capsici was incubated on V8 agar medium at 25 in dark for 6 days and the culture medium were complemented with CA to produce final concentrations 0, 50, 80, 120, 150, 250 mg/L, in which 0 mg/L represented the solvent control. Data presented are the means of the pooled data. Error bars indicate the SDs of the means (n = 3).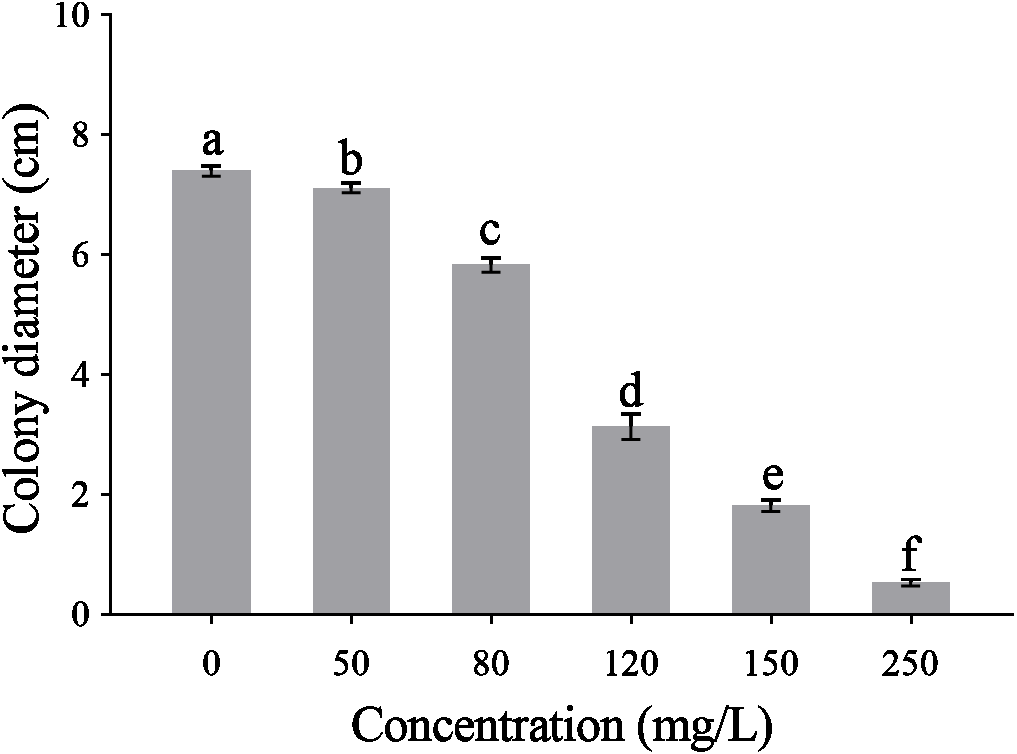
Effect of CA on the mycelial morphology
After treated with CA (140 mg/L) for 3 days in V8 agar medium, the results of scanning electron microscopy (SEM) observations revealed that the mycelium growth of P. capsici was significantly limited (Fig. 3). In addition, the mycelium was distorted and shriveled. The embranchment increased. While, the mycelium of the control group was stretched, uniform and full. And the surface of mycelium was smooth and the diameter of mycelium was constant (Fig. S1). Since the CA of EC75 concentration has obvious inhibition on the mycelium growth of P. capsici, the EC75 value was selected as the test concentration in this study.
Overview of the quantitative proteomics analysis of P. capsici treated with CA
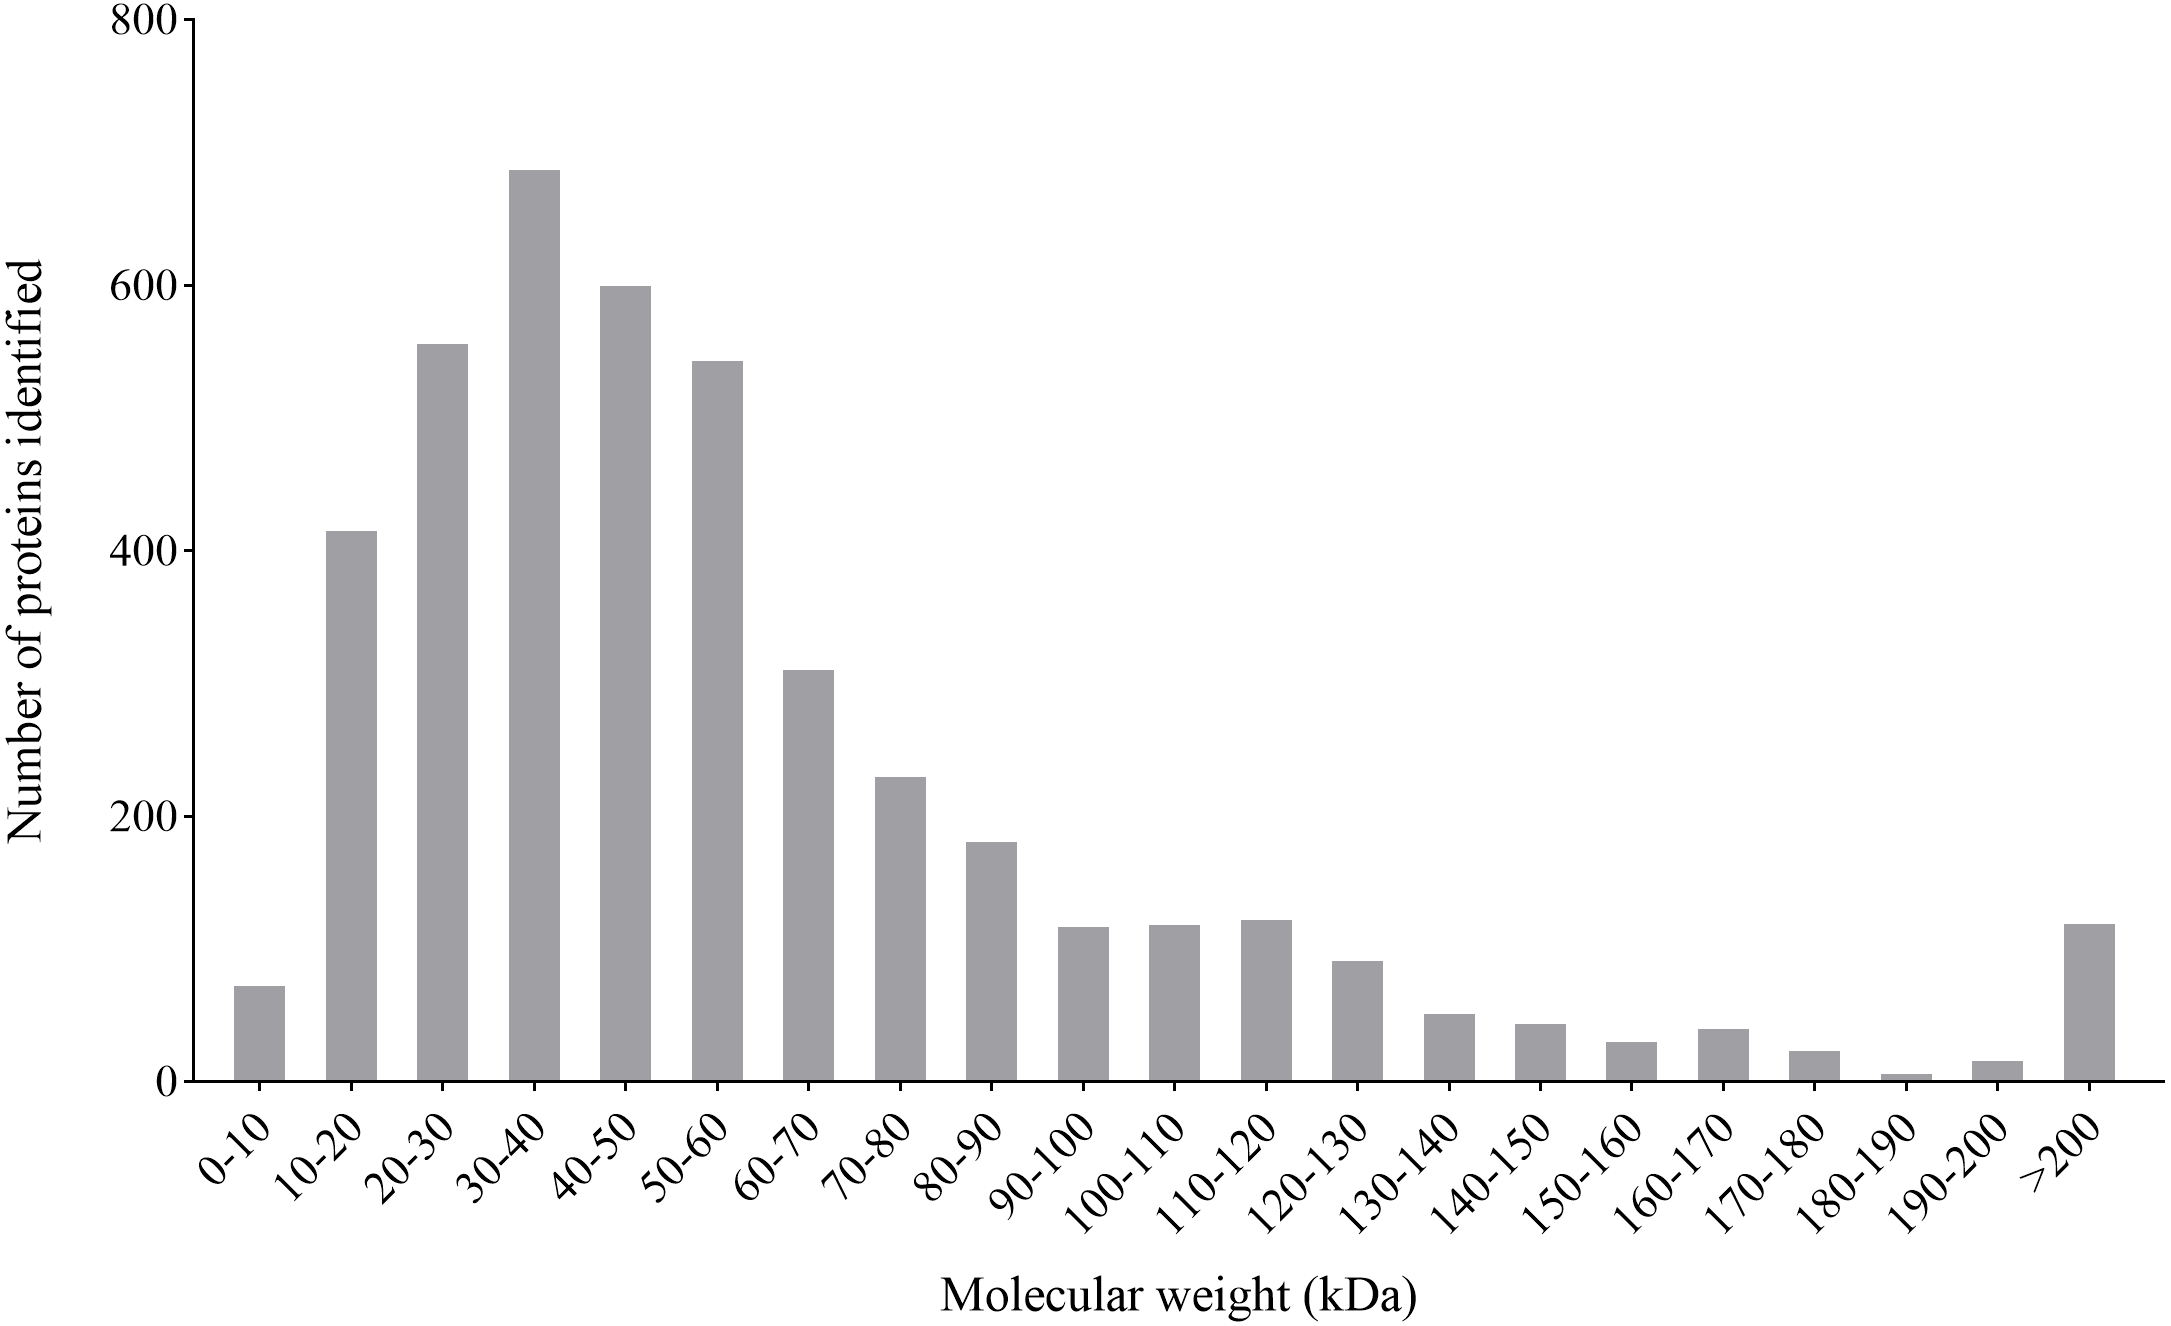
By the iTARQ-LC-MS/MS analysis, a total of 4370 proteins were identified in P. capsici treated with CA (140 mg/L) for 3 days. Most proteins have a molecular weight between 10–70 kDa, in which the number of proteins with molecular weight between 30–40 kDa was in the largest proportion (Fig. 4).
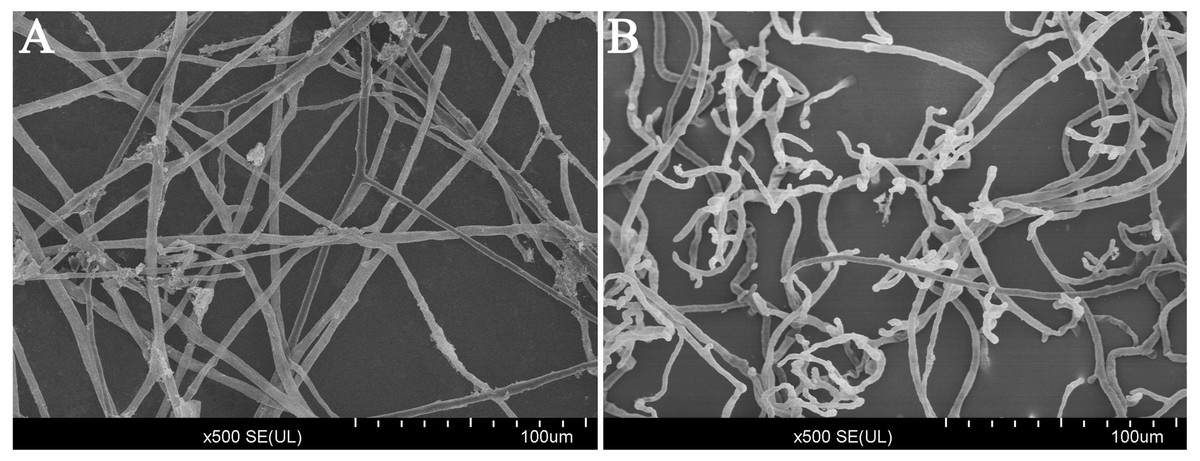
Figure 3: Scanning electron microscope images (500×) of the morphology of P. capsici with and without treatment with CA.
(A) Mycelia of untreated P. capsici (solvent control) cultured for 3 days; (B) mycelia of P. capsici treated with CA at 140 mg/L for 3 days.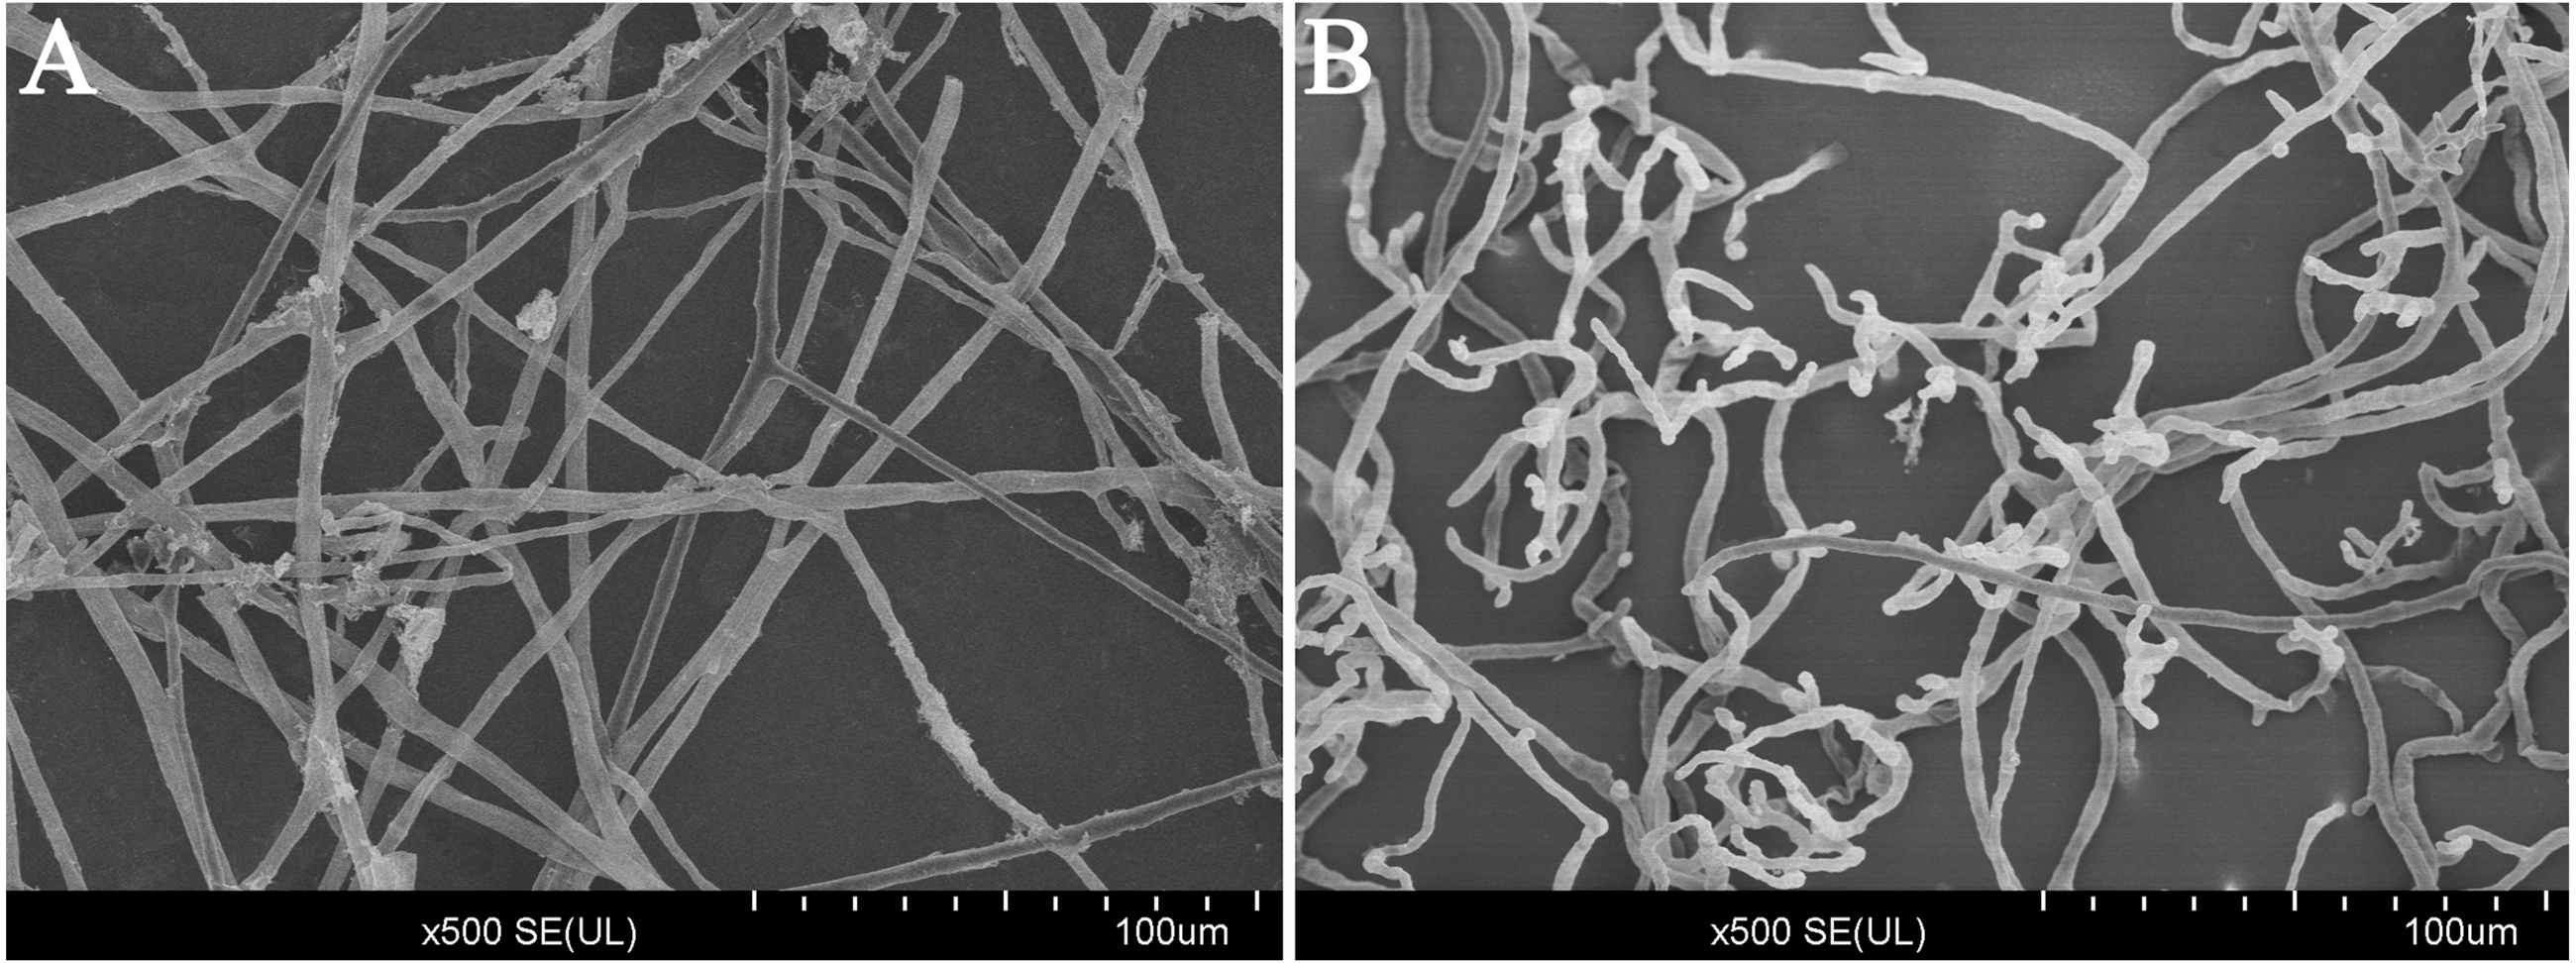
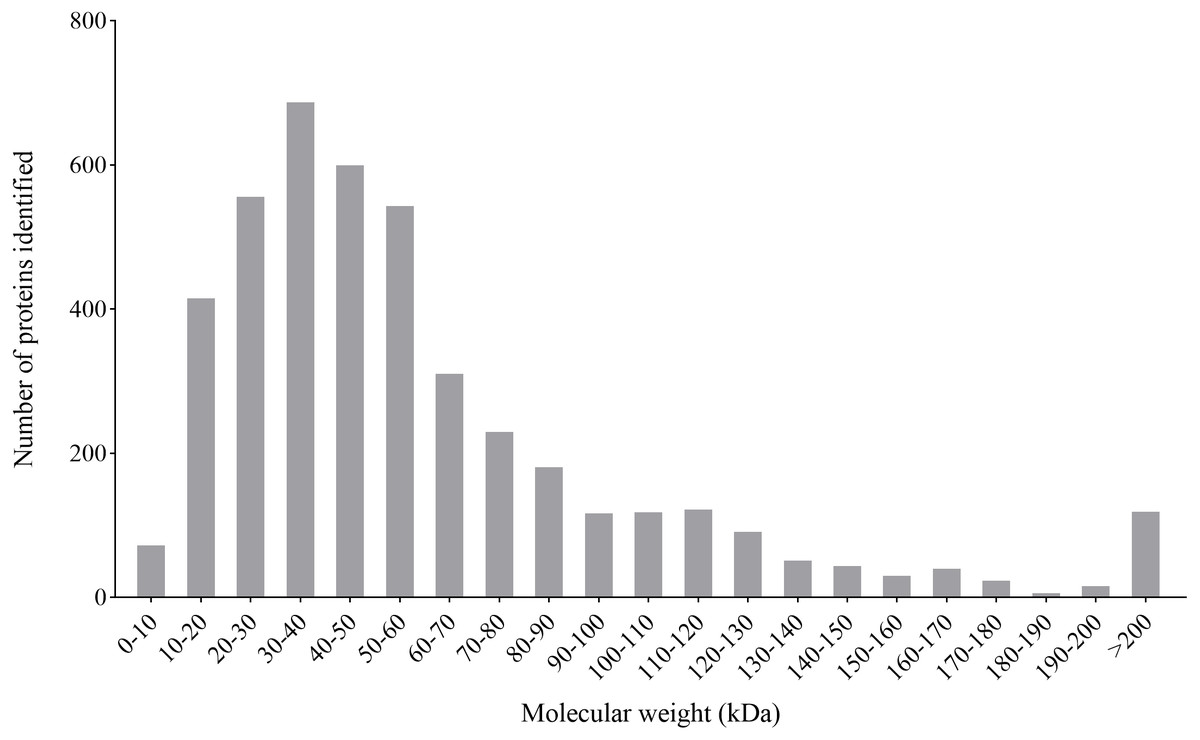
Figure 4: Molecular weight distribution of the proteins identified from the iTRAQ analysis of P. capsici challenged by CA.
Effect of CA on protein levels
With the cut-off values P ≤ 0.05 and fold changes >1.2 or ≤0.83, proteins between the two samples were considered differentially expressed. Compared CA treatment with control group, a total of 1502 differentially expressed proteins were identified of which 647 proteins were up-regulated and 855 down- regulated based on the cut-off value (Table S2).
P. capsici proteins related to the mode of action of CA
Go analysis was performed for level 2, and the differentially expressed proteins were categorized according to their biological process, molecular function and cellular component. The biological process annotation revealed that the differentially expressed proteins of P. capsici treated with CA were involved in response to metabolic process (27%), cellular process (25%) and single-organism process (20%) (Fig. 5A). In the molecular function, as shown in Fig. 5B, the number of differentially expressed proteins involved in catalytic activity and binding, which accounted for 46% and 44%, respectively. In the category of cell component (Fig. 5C), the differentially expressed proteins involved in cell and cell part were the most, accounting for 23% respectively. So, CA mainly caused significant changes in protein expression related to metabolism, cell process, catalytic activity, protein binding and cell and cell separation in P. capsici, indicating that these differential proteins may be involved in the main biochemical pathway of CA acting on the target pathogen.
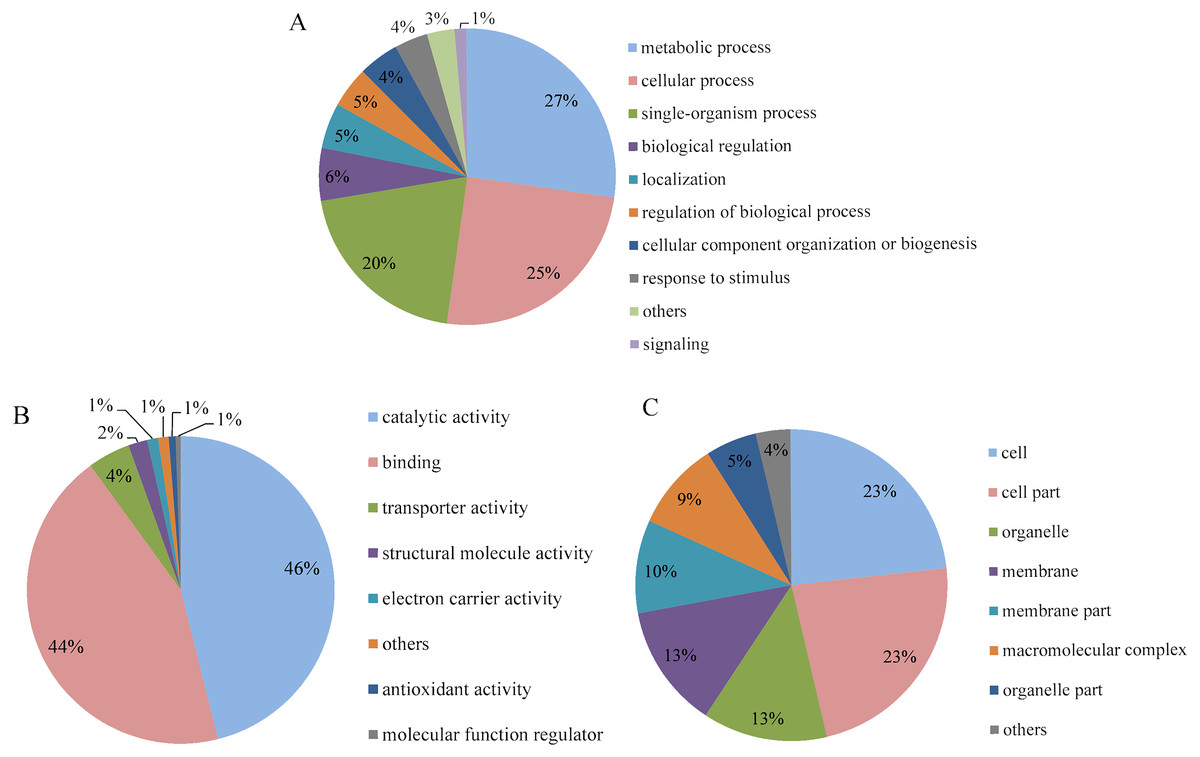
Figure 5: GO analysis of differentially expressed proteins identified on CA-treated P. capsici (P value < 0.05).
(A) Biological process. (B) Molecular function. (C) Cellular component.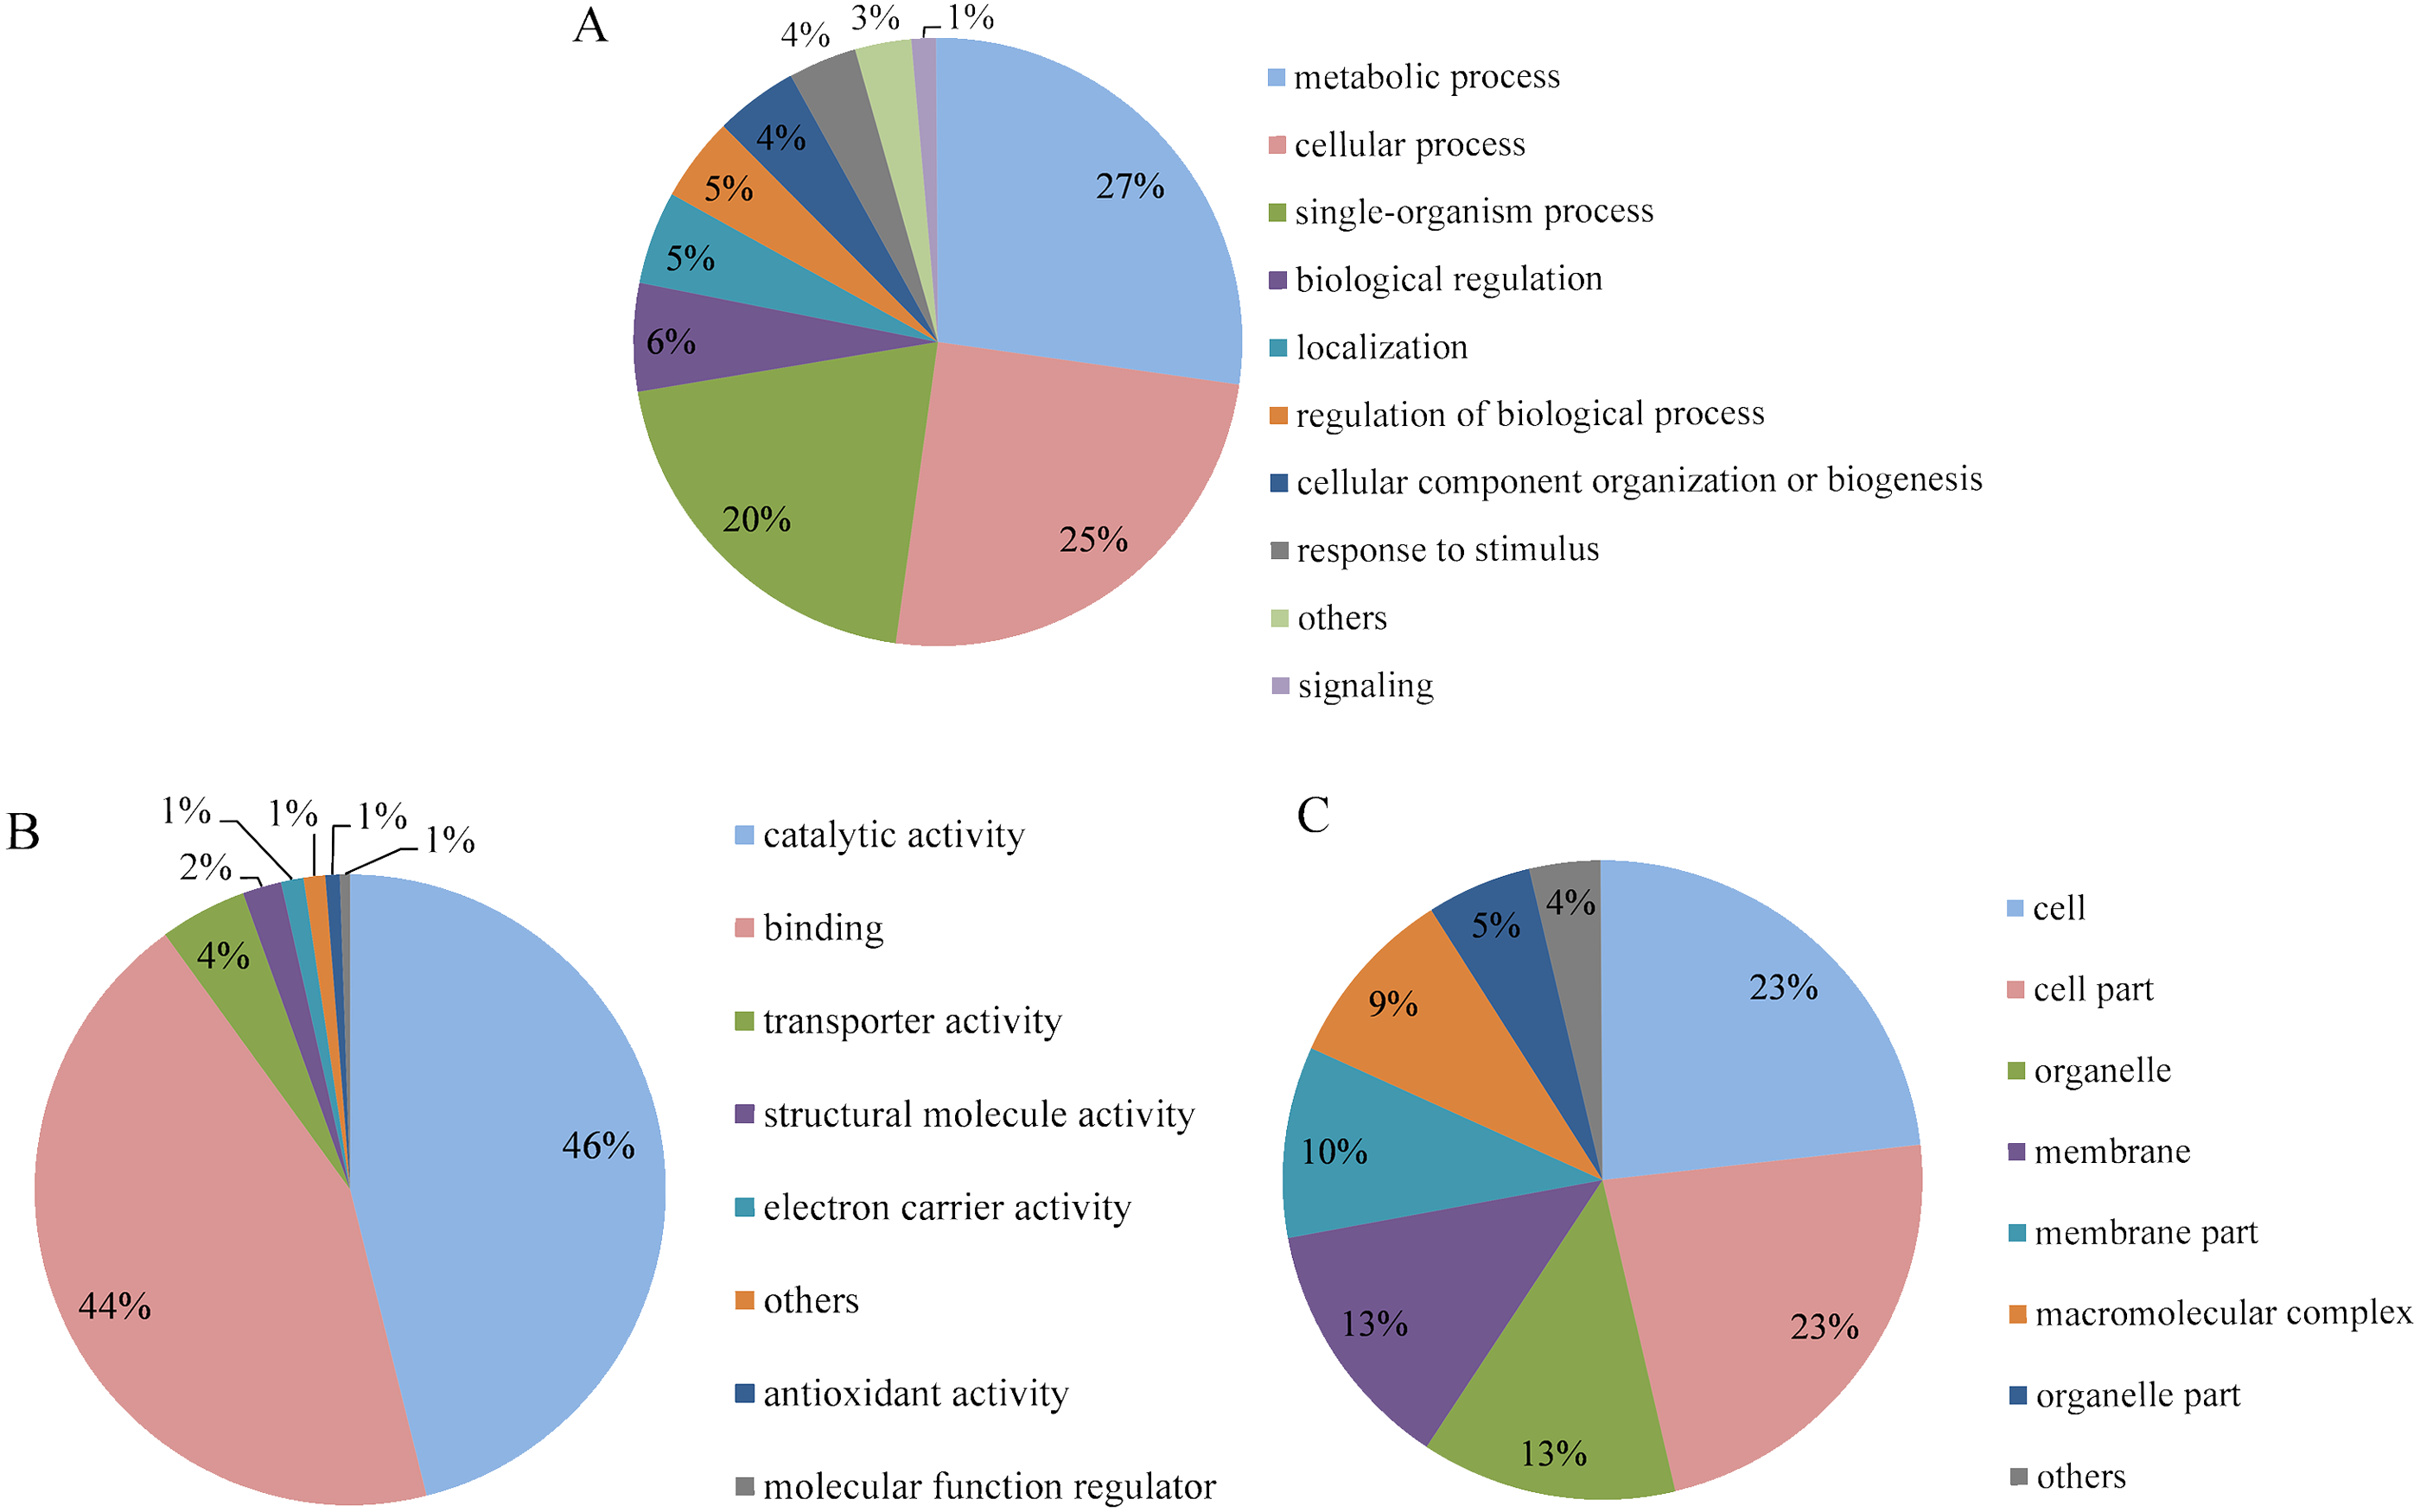
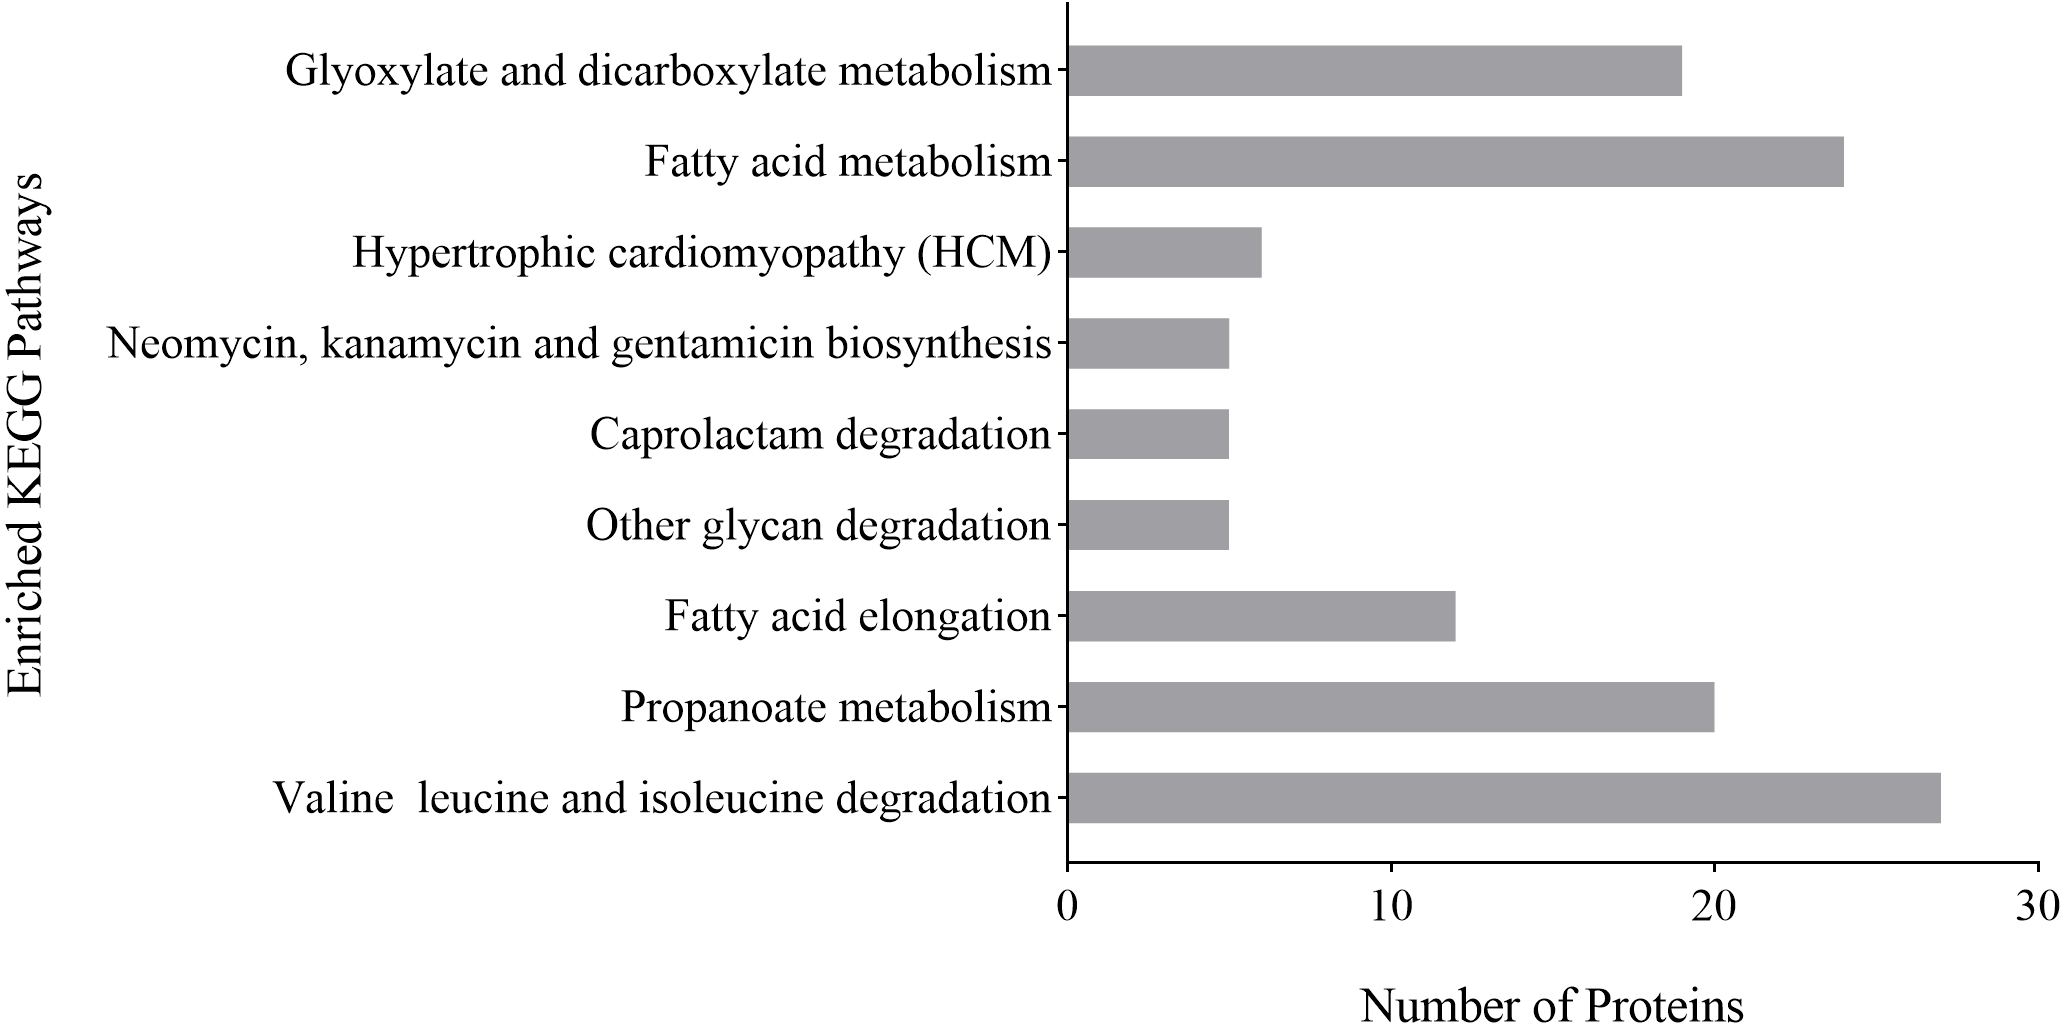
KEGG pathway analysis was used to analyze possible links between a protein and biochemical pathways. The differentially expressed proteins of P. capsici treated with CA were related to degradation pathways, including caprolactam degradation, other glycan degradation and valine, leucine and isoleucine degradation; associated with fatty acid pathways, including fatty acid metabolism and fatty acid elongation and involved with other pathways, including glyoxylate and dicarboxylate metabolism, hypertrophic cardiomyopathy, neomycin, kanamycin and gentamicin biosynthesis, propanoate metabolism (Fig. 6). These results indicated that fatty acid metabolism and the degradation of valine, leucine and isoleucine might play an important role in the inhibition of P. capsica by CA.
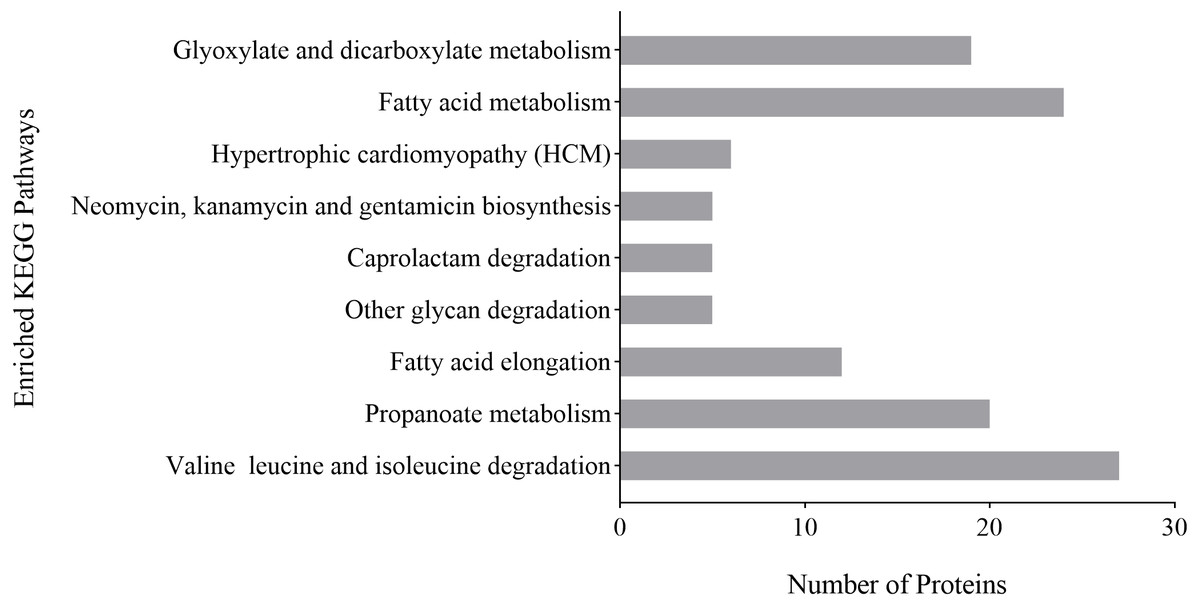
Figure 6: Analysis of KEGG enrichment of differential proteins identified on CA-treated P. capsici (P value < 0.05).
Functional classification of interested differentially expressed proteins
To determine the antimicrobial action of CA against P. capsici, we used the GO terms data and KEGG data to analyze the biochemical pathways involved in differentially expressed proteins. Analysis demonstrated that the 12 interested proteins involved in fatty acid metabolism (3 down-regulated, 3 up-regulated), polysaccharide metabolic (4 down-regulated) and leucine metabolism (2 down-regulated) were also significantly altered (Table 1). As shown in Fig. 7, the heat map of hierarchical clustering verified the rationality and accuracy of the selected differentially expressed proteins.
PRM verification of interested proteins
PRM technology based on mass spectrometry was used to quantitatively verify protein. Five interested proteins including glucan 1,3-beta-glucosidase, 1,3-beta-glucanosyltransferase, CAMK/CAMK1 protein kinase, methylcrotonoyl-CoA carboxylase subunit alpha and isovaleryl-CoA dehydrogenase were selected for initial validation. The PRM results showed that the five proteins of P. capsici treated with CA were down-regulated (Table 2), which was consistent with the results of proteomics analysis.
Quantitative of qRT-PCR analysis
The results of qRT-PCR showed that the gene expression level of the interested proteins was consistent with the protein expression level, except for CAMK/CAMK1 protein kinase, acetyl-CoA carboxylase and fatty acid synthase subunit alpha (Fig. 8). Moreover, the protein expression of cellulose synthase 3 decreased 1.43-fold while its RNA expression decreased 15.73-fold. The discrepancy between protein expression and RNA expression may be caused by the time difference between transcription and translation.
| Accession | Description | Regulation level / fold change |
|---|---|---|
| Fatty acid metabolism | ||
| D0NDY1 | Acyl-CoA dehydrogenase family member 9 | Down/0.76 |
| D0N7H7 | 3-ketoacyl-CoA thiolase | Down/0.74 |
| D0N7Z2 | Acyl-CoA dehydrogenase, putative | Down/0.62 |
| D0NZ18 | Acetyl-CoA carboxylase, putative | Up/1.69 |
| A0A0W8C395 | Fatty acid synthase subunit alpha | Up/2.16 |
| A0A081ALM8 | Elongation of fatty acids protein | Up/3.07 |
| Polysaccharide metabolic | ||
| W2NUF9 | CAMK/CAMK1 protein kinase | Down/0.53 |
| D0NCV1 | Glucan 1,3-beta-glucosidase, putative | Down/0.48 |
| H3GJ13 | 1,3-beta-glucanosyltransferase | Down/0.81 |
| H6U2P7 | Cellulose synthase 3 | Down/0.70 |
| Leucine metabolism | ||
| A0A0W8CX17 | Isovaleryl-CoA dehydrogenase | Down/0.63 |
| D0N1Q9 | Methylcrotonoyl-CoA carboxylase 1 | Down/0.77 |
Discussion
There are few reports on the mechanism of action of CA on fungi and oomycetes. OuYang et al. (2019) found that after CA treatment, the cell wall of Geotrichum citri-aurantii was dissolved and the chitin content was reduced, therefore they concluded that CA could inhibit the mycelial growth by destroying the integrity of cell wall. Shreaz et al. (2011) found that plasma membrane ATPase activity of C. albicans treated with CA was inhibited, which led to the increase of intracellular H+ concentration and cell death. Hu et al. (2013) determined the free Ca2+ concentration in the zoospores of P. capsici before and after CA treatment, and found that CA inhibits mycelial growth by causing Ca2+ efflux. In this study, based on the strong inhibition of CA on the mycelial growth of P. capsici, a total of 1502 differentially expressed proteins were identified by quantitative proteomics. These differentially expressed proteins were mostly involved in fatty acid metabolism, polysaccharide metabolism, and leucine metabolism (Table 1). It has been reported that glucose, fatty acids and amino acids are the three substrates for organisms to maintain metabolic homoeostasis (Sander & Ronald, 2010). Therefore, CA may break the metabolic balance of the oomycete, causing to inhibit pathogen growth (Fig. 9).
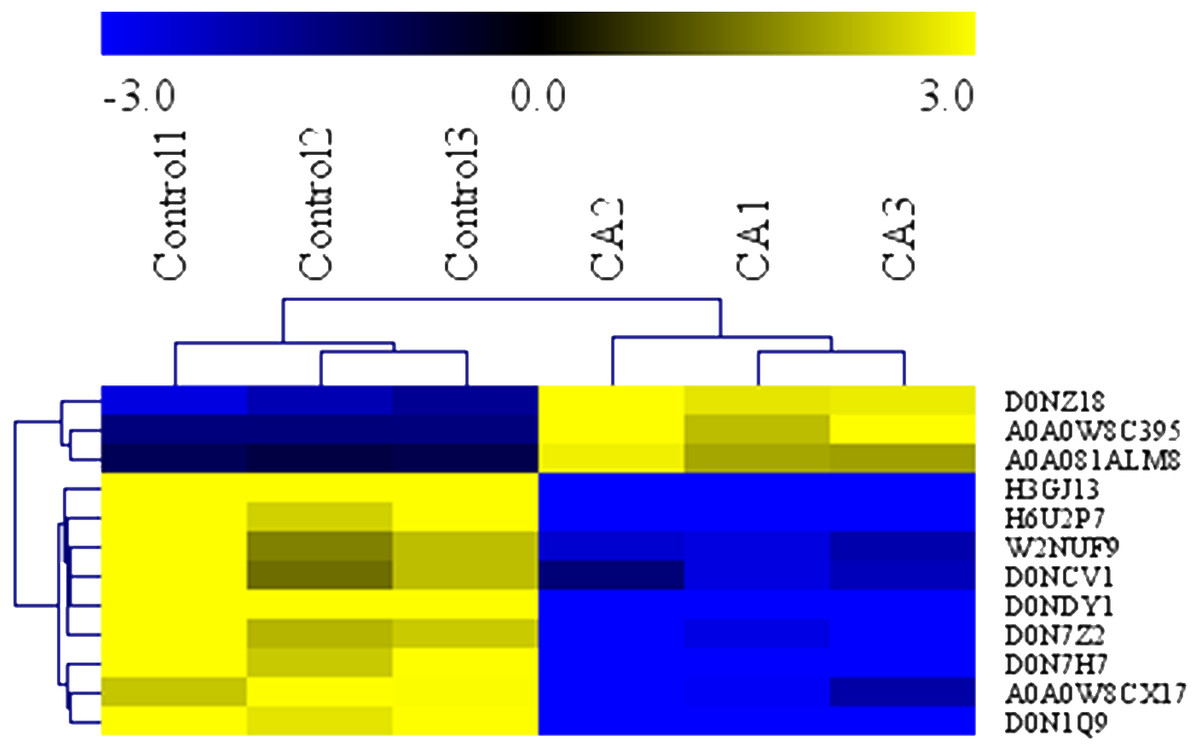
Figure 7: Heatmap of protein expression levels in in solvent control and CA treatment.
Blue represents the down-regulated proteins (fold change ≤ 0.83 and P Value < 0.05), and yellow represents the up-regulated proteins (fold change > 1.2 and P value < 0.05).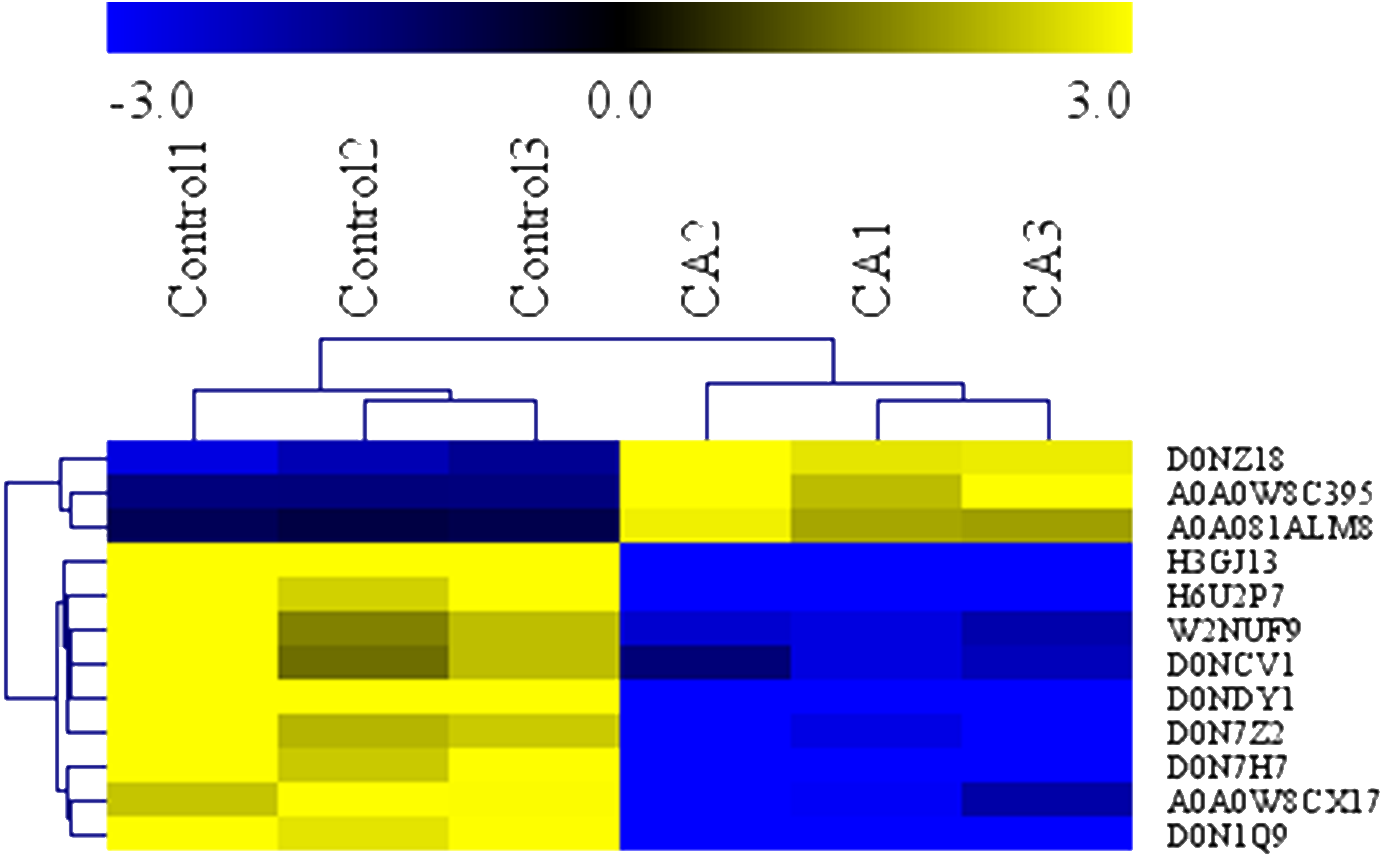
| Accession | Description | Regulation level / fold change |
|---|---|---|
| Polysaccharide metabolic | ||
| W2NUF9 | CAMK/CAMK1 protein kinase | Down/0.319 |
| D0NCV1 | Glucan 1,3-beta-glucosidase | Down/0.408 |
| H3GJ13 | 1,3-beta-glucanosyltransferase | Down/0.491 |
| Leucine metabolism | ||
| D0N1Q9 | Methylcrotonoyl-CoA carboxylase subunit alpha, putative | Down/0.453 |
| A0A0W8CX17 | Isovaleryl-CoA dehydrogenase | Down/0.345 |
| Internal reference protein | ||
| A0A0W8DRZ2 | 40S ribosomal protein S13 | |
| Q2M3Z6 | Ribosomal protein L23 | |
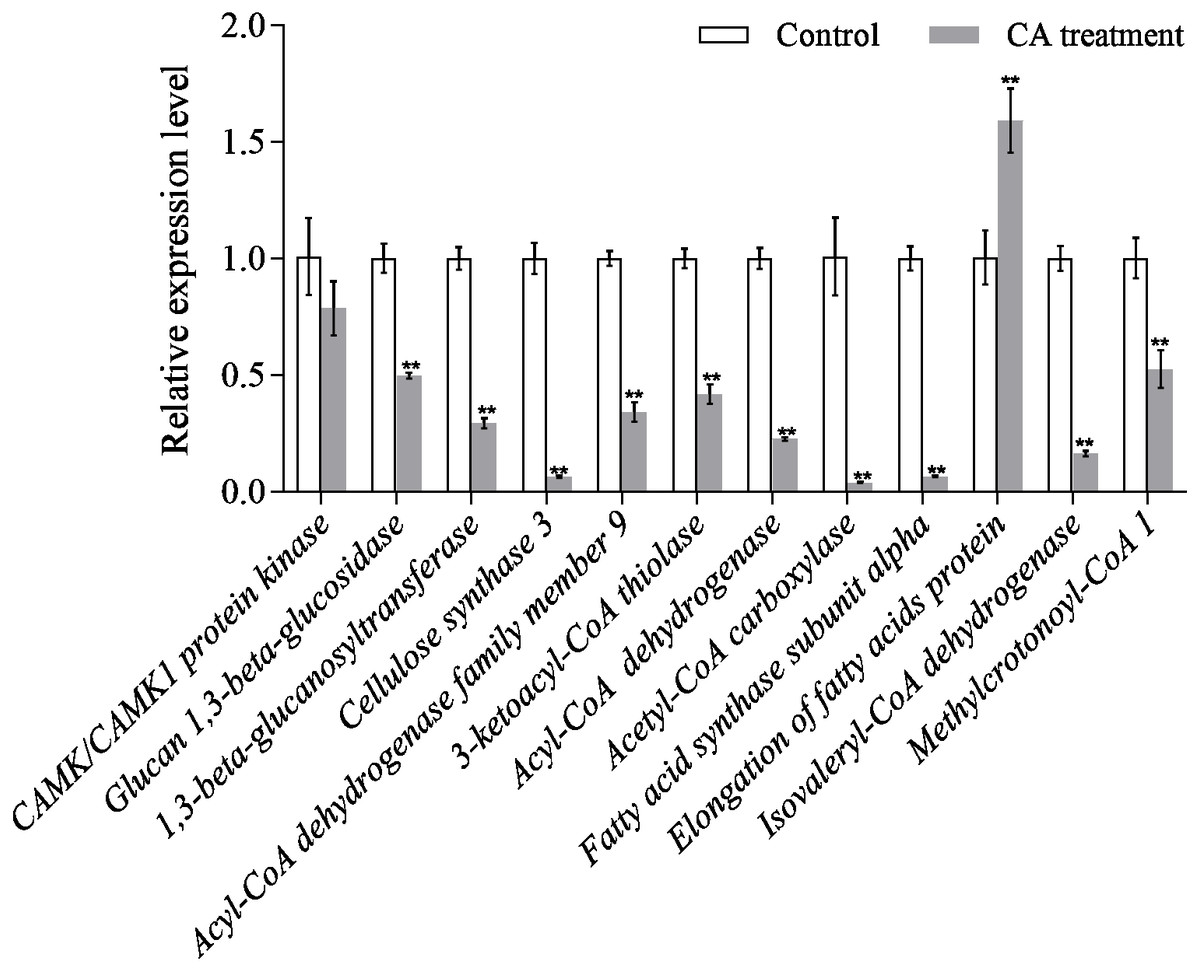
Figure 8: Relative expression of mRNAs from twelve genes as determined by qRT-PCR.
Bars represent the means ± SD (∗P < 0.05, and ∗∗P < 0.01 with compared to CA treatment).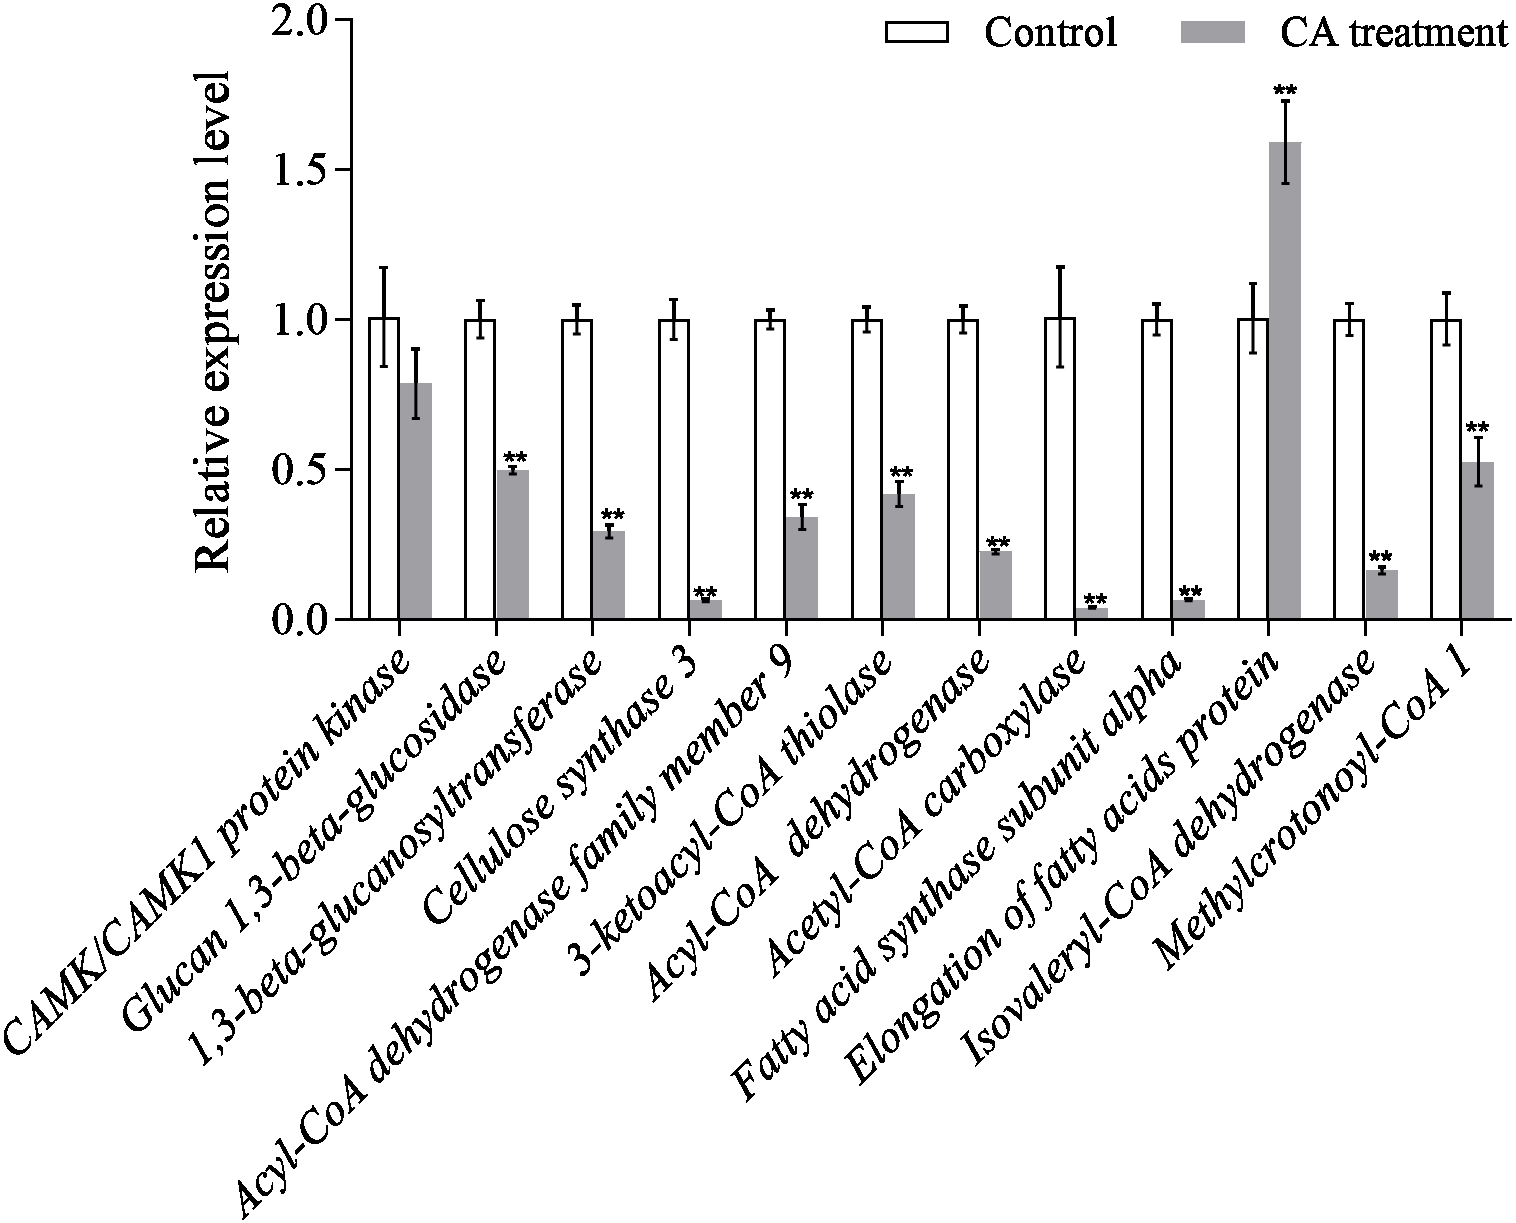
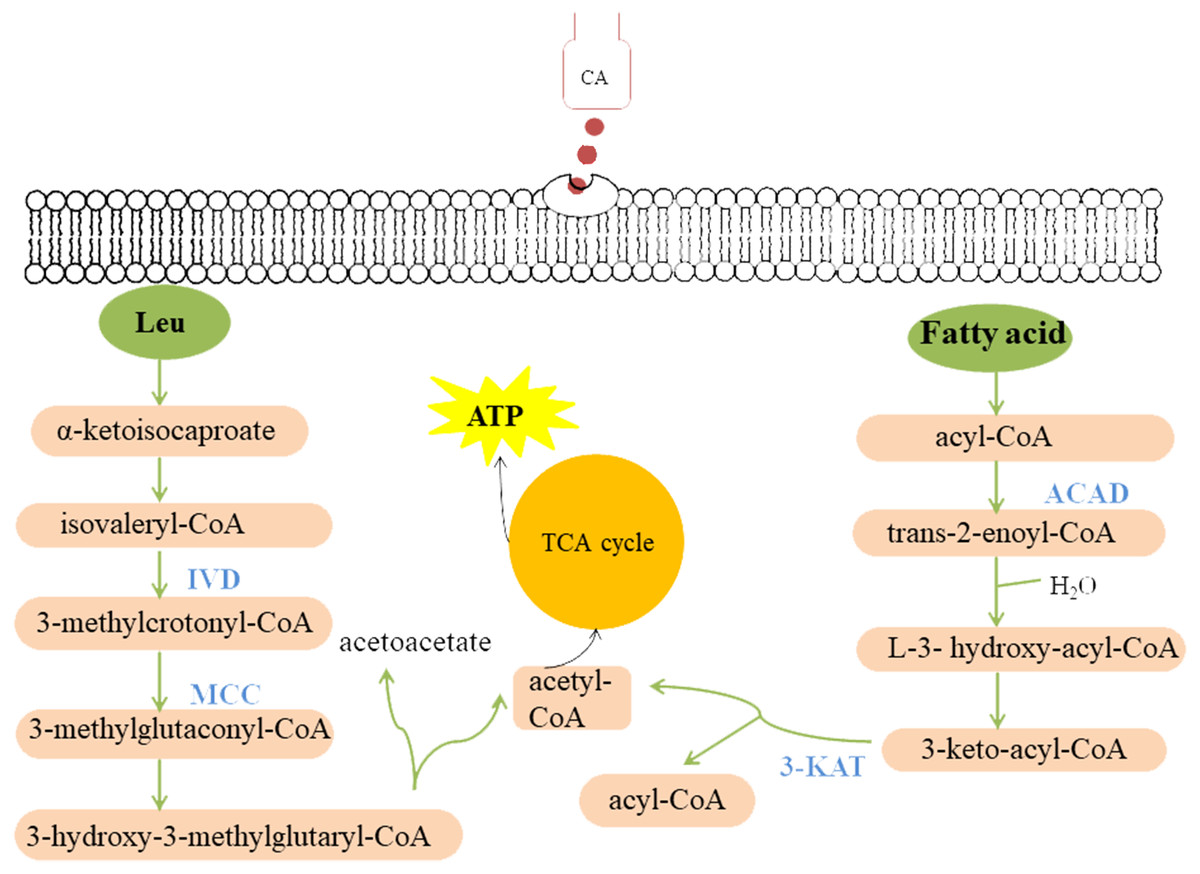
Figure 9: Model summarized antimicrobial effects of CA on P. capsici.
Each green ellipse represents a pathway, each pink box represents a substance, and the orange circle represents the TCA cycle. Blue proteins indicate down-regulated. IVD, isovaleryl-CoA dehydrogenase; MCC, methylcrotonyl-CoA carboxylase subunit alpha; 3-KAT, 3-Ketoacyl-CoA thiolase; ACAD, Acyl-CoA dehydrogenase.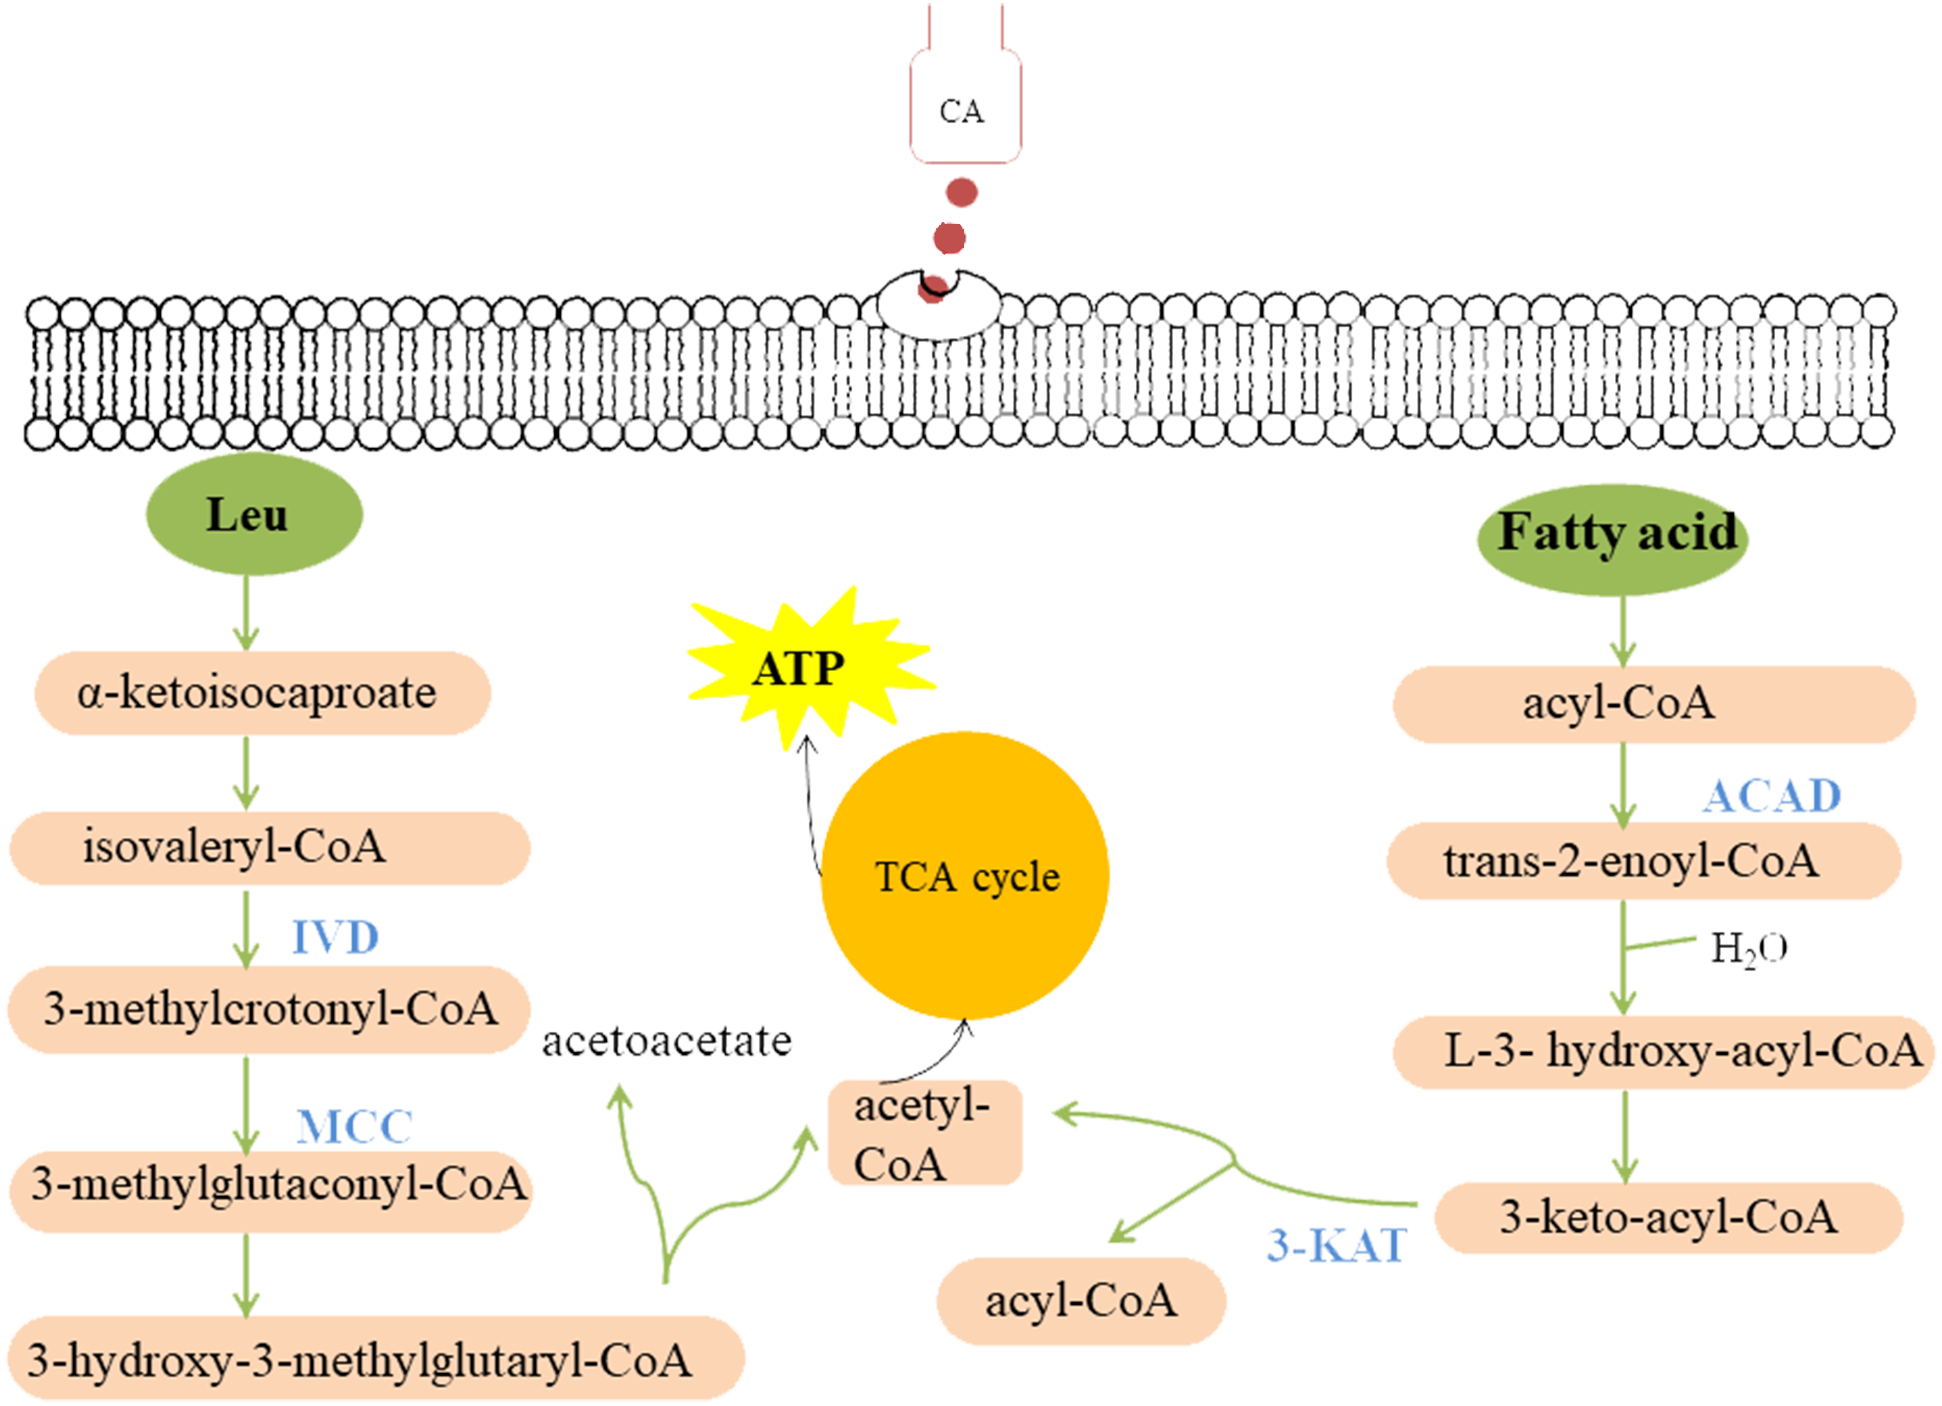
Fatty acid metabolism is closely related to fungal growth (Calvo, Gardner & Keller, 2001). In this study, both Acyl-CoA dehydrogenase (ACAD) and 3-Ketoacyl-CoA thiolase (3-KAT) were down-regulated after CA treatment of P. capsici by proteomics analysis. The results of qRT-PCR showed that 3-ketoacyl-CoA thiolase and acyl-CoA dehydrogenase were also down-regulated by CA treatment Fig. 8. And the down-regulated ACAD and 3-KAT slowed down the metabolism of fatty acids, which might lead to the increase of fatty acid content (Wang et al., 2018a; Wang et al., 2018b). In addition, the up-regulated acetyl CoA carboxylase (ACC), the up-regulated fatty acid synthase subunit alpha and the up-regulated elongation of fatty acids protein also promoted the synthesis of fatty acids. Previous studies also found that Penicillium expansum treatment with CA changed the expression of proteins related to fatty acid metabolism (Wang et al., 2018a; Wang et al., 2018b).
Cellulose, an important component of the cell wall of oomycetes (Bartnicki-Garcia, 1968), is mainly synthesized by cellulose synthetase. Down-regulated cellulose synthetase and glucan 1,3- beta-glucosidase (Igarashi et al., 2003) might disrupt cell wall metabolism in fungi. Shreaz et al. (2013) observed that the cell wall of Candida treated with CA was damaged by transmission electron microscope. CAMK/CAMK1 protein kinase 1 participates in the regulation of production of conidiation and mycelial growth (Liu et al., 2010). 1,3-beta-glucanosyltransferase, the Gel/Gas/Phr family of proteins, contributes a lot in the modification of fungal cell wall structure and it is considered to be related to the mycelial embranchment (Mouyna, Hartl & Latgé, 2013). Previous studies found (Kamei et al., 2013) that the deletion of the gel-3 in Neurospora crassa caused that the mycelium grew slowly compared with wild strain. Down-regulated CAMK/CAMK1 protein and 1,3-beta-glucanosyltransferase might result in changes in mycelia morphology. Moreover, the scanning electron microscope observed that the growth of mycelium was inhibited, and the mycelial embranchment increased. In this study, cellulose synthase 3, glucan 1,3-beta-glucosidase, CAMK/CAMK1 protein kinase and 1,3-beta-glucanosyltransferase were down-regulated in P. capsici treated with CA, which not only changed the cell morphology and mycelial morphology of P. capsici, but also disturbed the polysaccharide metabolism.
In this study, isovaleryl-CoA dehydrogenase (IVD) and methylcrotonyl-CoA carboxylase subunit alpha (MCC) are the key enzymes of mitochondrial leucine metabolism (Mentzen et al., 2008), in which IVD catalyzes the conversion of isovaleryl-CoA to 3-methylcrotonyl-CoA (Mohsen & Vockley, 1995). Down-regulated IVD might reduce the production of 3-methylcrotonyl-CoA, which is the catalytic substrate of MCC to generate 3-methylglutaconyl-CoA. The MCC can prevent the store of toxic substances and provide energy to the cell (Tomassetti et al., 2018). Rodríguez et al. (2004) indicated that one or more of the metabolites accumulating in the MCC-deficient strains are toxic to the cells. Proteomic and PRM data all demonstrated that MCC and IVD were down-regulated after treated with CA, which might lead to the accumulation of intracellular metabolites, breaking the normal cell environment and causing cell death.
Conclusion
In conclusion, CA has good antimicrobial activity against P. capsici. CA disturbs fatty acid metabolism, polysaccharide metabolism and leucine metabolism of P. capsici, which lead to cell dysfunction or even cell death. Therefore, CA is expected to become a new fungicide for the control of pepper blight.
Supplemental Information
Scanning electron microscope images (4.5 k ×) of the morphology of P. capsici with and without treatment with CA
(C) Mycelium of untreated culture (solvent control) treated for 3 days; (D) mycelium ofP. capsici treated with CA at 140 mg/L for 3 days.
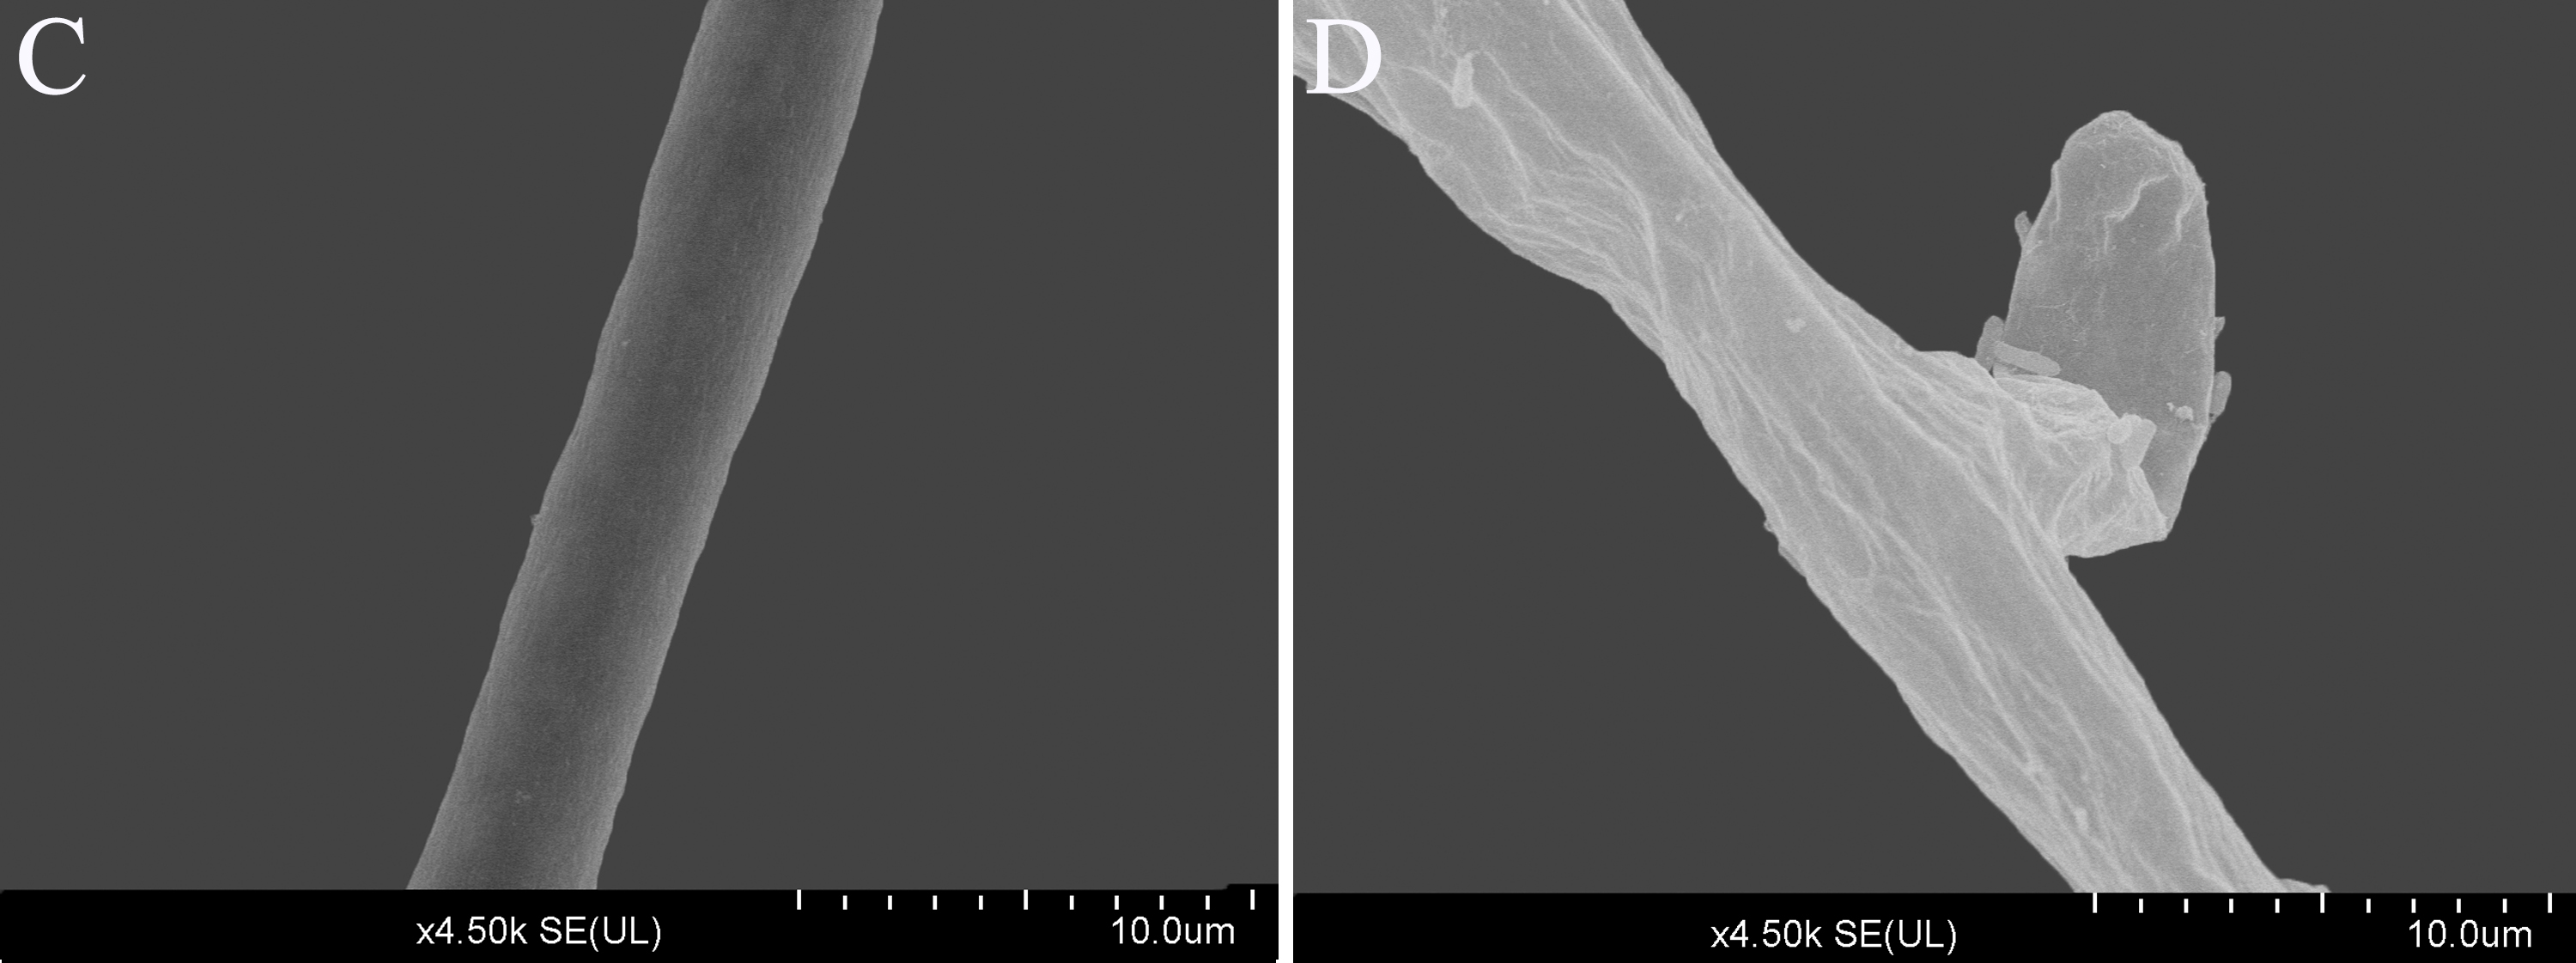