Article

Microporous Oxide-Based Surface-Enhanced Raman Scattering Film for Quadrillionth Detection of Mercury Ion (II)

1
Department of Electronic Engineering, Ming Chi University of Technology, New Taipei City 243, Taiwan
2
Organic Electronics Research Center, Ming Chi University of Technology, New Taipei City 243, Taiwan
*
Author to whom correspondence should be addressed.
Processes 2021, 9(5), 794; https://doi.org/10.3390/pr9050794
Submission received: 2 April 2021 / Revised: 23 April 2021 / Accepted: 27 April 2021 / Published: 30 April 2021
(This article belongs to the Special Issue Synthesis, Characterization, and Application of Functional Materials)

Abstract

:
A variety of chemical sensing materials and procedures for conveniently detecting mercuric ion (II) (Hg2+) have been extensively explored. The detection challenges for accomplishing a simple, fast, and low investment procedure at the ultrasensitive level are ongoing. Herein we report a quadrillionth level for detecting Hg2+ by the surface-enhanced Raman scattering (SERS) technique. There is an interaction of silver nanoparticles decorated on a zinc-oxide tetrapod structure and coated on FTO glass (Ag@ZnO-FTO) with an organic ligand. 4,4′-Dipyridyl (DPy) performed as being chemisorbed by Ag nanoparticles interacting with a pyridine ring to produce plasmonic hot spots for SERS. The morphology of the surface and porous structure of the tetrapod becomes the powerful platform for enhanced SERS performance of DPy detection. In the absence of the augmentative electrolyte, the enhancement factor for DPy is more than 107. The inhibiting of the aggregation between Ag and DPy was present following the appearance of Hg2+, demonstrated by the quenching of the SERS signal from the DPy molecules. The capability to reproduce and the selectivity of the sensing by DPy were both demonstrated. In addition, the applications for detecting Hg2+ in natural water and beverages were successfully detected. These results demonstrated the SERS sensors had the potential for detecting Hg2+ in practical use.

1. Introduction

For decades, a critical concern across the world has been the heavy metal contamination of water, air, soil, or food, chiefly from industrial processes [1] and natural phenomena [2]. In particular, mercury is one of the highly toxic elements, even at a low deficient concentration [3]. Mercury can lead to a variety of substantial problems for health and the environment. All people should be aware of the Minamata disease caused by mercury poisoning in 1956 and the case of Yili baby formula in China in 2012.
The U.S. Environmental Protection Agency (EPA) prescribed that the maximum residue of mercury ion (II) (Hg2+) in drinking water must not exceed two ppb (10 nM). The high resolution for mercury analysis is frequently operated by a wealth of precision techniques [4,5], such as inductively coupled plasma mass spectroscopy (ICP-MS), X-ray fluorescence spectrometry (XRF), neutron activation analysis (NAA), enzyme-linked immunosorbent assay (ELISA), atomic absorption spectroscopy (AAS), cold vapor atomic fluorescence spectrometry (CA-AFS), and anodic stripping voltammetry (ASV). These analyses require expensive apparatuses, time-consuming processes, and complicated sample preparation processes, making them unsuitable for in situ analysis. The great demand for the development of faster, more sensitive, and reliable techniques for detecting Hg2+ contaminant in water to improve the safety of food and protect the environment is a remarkably pressing issue.
Recently, considerable efforts have been made to diagnose and recognize signaling Hg2+, such as simple detection by chemosensing access and functionalized nanomaterials, or employing organic dyes for on-site detection of Hg2+ [6,7,8,9,10]. Various nanomaterials, including conductive nanotubes [6], luminescent quantum dot [7], and plasmonic metal nanoparticles [8], have demonstrated the capacity to quantify Hg2+ by using the optical/electrical readout. Additionally, the different characteristics of dyes also have been reported for detecting Hg2+ using fluorescent and colorimetric techniques selectively [9,10]. The capability to detect Hg2+ from most of these methods is only in the range of part-per-billion (ppb) to part-per-trillion (ppt). There is a need for improving the accuracy of the limit of detection (LOD) in detecting Hg2+ in the solution media. Nowadays, the exploration of chemosensors for detecting a higher sensitivity of Hg2+ has been progressing, proposing to prevent the harmful build-up for human health and living things after long-term accumulation.
Reported as a novel technology, including the advanced composition of non-damaged sample acquisition, ultrasensitivity, and unique spectroscopic fingerprints, surface-enhanced Raman scattering (SERS) has been a powerful technique and is the most widely used method for detection and identification of the present biological and chemical ions [11,12]. The electromagnetic (E.M.) field near the metal surface has generally amplified Raman signals to 105–1015 for the enhancement factor depending on the characteristic of the molecules at the surface and the difference in the metal nanostructures [13,14]. Not all the metal ions, including Hg2+, can be detected directly by Raman spectroscopy; thus, Hg2+ detection can be achieved by the indirect SERS technique readout [15,16,17,18,19,20]. Tagging by DNA/oligonucleotide-conjugated dye to label the metal nanoparticles is one of the most popular ways to detect Hg2+ [15,16,17]. Recently, some reports of the interaction between Hg2+ and some of the Raman-active ligands, generating the SERS effect from the aggregation of metal particles, have been published [18,19,20]. Unfortunately, all of these approaches need to be performed in the solution system or need a sophisticated labeling procedure. Moreover, the contamination from unavoidable aggregating by metal nanoparticles from various environmental factors, such as organic molecules in samples or the salt, contributes to the inaccuracy in detecting Hg2+ in real sample determinations. The simple, ultrasensitive, inexpensive, and rapid results remain a challenge to the sensor of metal ions by SERS technology.
In this study, the practical applications for high sensitivity and selectivity SERS-based on a femtomolar (fM) chemosensor of Hg2+ are reported. The preparation of the SERS chip through the ZnO tetrapod nanoparticle-coated FTO (ZnO-FTO) by the electrophoretic process, and the decoration of the silver nanoparticles on the surface of ZnO (Ag@ZnO-FTO) by the electrodecoration process are described. The concentration of DPy 6.4 × 10⁻⁵ M at 10 mL was used to evaluate the standard of pure DPy before mixing it with different concentrations of Hg2+ at 2 mL. In the case of pure DPy, the molecules of DPy are absorbed in the silver substrate and reveal the highest intensity of the Raman signal. After mixing with Hg2+, the molecules of DPy are evacuated from the silver to adhere with Hg2+ and are not absorbed on the silver again, resulting in the Raman signal of DPy decreasing proportionally with an increasing concentration of Hg2+. Unlike with normal detection, the decreasing of DPy intensities by increasing the concentration of Hg2+ in the solution is called the SERS-off technique. The high sensitivity and reliability in the real samples’ assay are exhibited from the simple and rapid SERS-based chip sensor reported here, and thus, open a novel fabricated avenue for SERS-based metal ions detectors.

2. Experimental Section

Chemicals and Materials. Dihydrogen hexachloroplatinate (IV) (H2PtCl6·6H2O), ethanol (C2H5OH), isopropanol (C3H8O), butanol(C4H10O), magnesium sulfate (MgSO4), silver nitrate (AgNO3), phosphoric acid (H3PO4, ACS reagent, 85 wt%), hydrochloride (HCl), 4,4′-Dipyridine (DPy), mercuric nitrate monohydrate (Hg(NO3)2·H2O), zinc chloride (ZnCl2), lithium chloride monohydrate (LiCl·H2O), aluminum nitrate nonahydrate (Al(NO3)3·9H2O), magnesium chloride hexahydrate (MgCl2·6H2O), copper(II) sulfate pentahydrate (CuSO4·5H2O), iron(III) nitrate nonahydrate (Fe(NO3)3·9H2O), cobalt(II) chloride hexahydrate (CoCl2·6H2O), and terbium(III) chloride (TbCl3·6H2O) were purchased from Sigma-Aldrich. The indium tin oxide (ITO) substrates (15 Ω/sq) were purchased from Lumtec Corporation. The fluorine-doped tin oxide (FTO) substrates (10 Ω/sq) were purchased from Nippon Sheet Glass. All of these reagents were used without further purification. Deionized (DI) water was produced using an Elix (Millipore) water purification system. Milk used in the research was purchased from a local supermarket, and natural water was collected from a local lake.
Fabricated Platinum Anode for Electrochemical Processes. Both electrophoretic and electrodecoration used platinum glass to be an anode for the electrochemical process. The anode preparation started by cleaning the FTO or ITO conductive glass (with the size of 2.6 mm × 3.5 mm) using an ultrasonic bath in deionized water for 10 min, followed by acetone for 10 min, and using isopropanol 10 min as the final solution for cleaning conductive glass. After finishing the cleaning process, the conductive glass flakes were dried at room temperature for 5 min. Then, dihydrogen hexachloroplatinate (IV) solutions (0.3 mM) as a Pt substance were deposited on conductive glass flakes by spin coating at 700 rpm for 30 s at room temperature. Then, the electrode was heated by a hot plate at 400 °C for 2.5 h to form a smooth and dense Pt nanocrystal surface. Lastly, the isopropanol and deionized water were used for cleansing the electrodes before drying at room temperature.
Synthesis of Ag@ZnO-FTO SERS Chips. The ZnO suspension was prepared for the electrophoretic coating process under galvanostatic conditions [21]. The mixing of ZnO powder 0.35 g with a mixture of butanol/isopropanol and ethanol (V/V/V = 4:2:1) at 10 mL was followed by ultrasonication for 30 min. A platinum glass substrate was used as anode and cleaned FTO glass (2.6 mm × 3.5 mm, 10 Ω/sq) was used as the cathode, and both substrates were vertically immersed in the suspension. The DC power supply was set at 10 V, and the distance between each pair of anode and cathode was fixed at 7 mm, appearing the current on this process about 100 µA. The voltage was applied for operation for 3 min, so that the layer of ZnO had a thickness of around 10–15 µm, followed by sintering the ZnO chip at 390 °C for 3.5 h [21].
For the electrodecoration process (present in Scheme 1), the solution was prepared by mixing 41 g of magnesium sulfate, 1 g of silver nitrate, and 1.8 mL of phosphoric acid in 1 L of DI water and scrambling by a stirring machine at 500 rpm for 5 min [22]. The platinum chip performed as an anode like in the phoretic process, and the ZnO chip was used as a cathode for decorating Ag nanoparticles on the ZnO surface. The abnormal test function for decorating silver nanoparticles on the ZnO surface was conducted using the A.C. power supply GwInstek (APB-7050B), and the parameter was set for applied voltage, as shown in Table S1, and all the periods were repeated 19 times for completely decorating the silver on the ZnO. After finishing the decoration of silver nanoparticles on ZnO, the SERS chip was cleaned for the surplus of the precursor with HCl, and three times with DI water for 20 sec. After the cleaning procedure, the SERS chip was dried by a hot air blower for approximately 10 min [23].
Raman Detection of Hg2+ in Water. Different concentration of Hg2+ solutions (20 mL) were prepared by dissolved proper Hg(NO3)2·H2O powders in DI water. Then, the constant DPY solution (6.4 × 10⁻⁵ M) of 20 mL was mixed well with each mercury precursor concentration as the samples. Micro-Raman spectroscopy was operated by using a green laser at 532 nm with a power of 25 mW and a 10× objective lens (spot size 16 μm2). The integral time was 10 s without repeating accumulations, and the front entrance was 200 μm. The experiments were measured repeatedly five times in each concentration.
Raman Measurement of Hg2+ in the Real Samples. The ultrasensitive detection of Hg2+ by modification of DPy to turn off the SERS mode was also tested in the real sample. The volume of 2 mL of Hg2+ solution with various concentrations was spiked into 20 mL of tap water, river water, and milk. The mixtures were stirred for a while and filtered through 0.45 μm Supor filters to eliminate the particulate suspension. The 10 mL of sample solution was evenly poured onto the SERS chip by a 10 mL pipet. The Raman spectra were recorded by 532 nm laser with the power of 25 mW and a 10× objective lens.
Characterization and Instruments. The concentrations of Hg2+ and DPy solutions were analyzed by inductively coupled plasma optical emission spectrometry (ICP-OES, Thermo iCAP™ 7200) and gas chromatography mass spectrometry (GC-MS, Shimadzu TQ8040), respectively. The prepared Ag@ZnO-FTO was characterized by powder X-ray diffraction (PXRD, Bruker D8 advance), and the observations about morphology and the characterized structure were completed by field-emission scanning microscopy (FE-SEM, JEOL FSM-7610F plus) and transmission electron microscopy (TEM, JEOL 2100), respectively. The crystallinity calculations were achieved by FullProf (7.30, Mar2020-ILL JRC). Raman measurements were conducted by micro-Raman spectroscopy (Horiba IHR 550). The electrochemical process was analyzed by cyclic voltammetry (CV, Metrohm).

3. Results

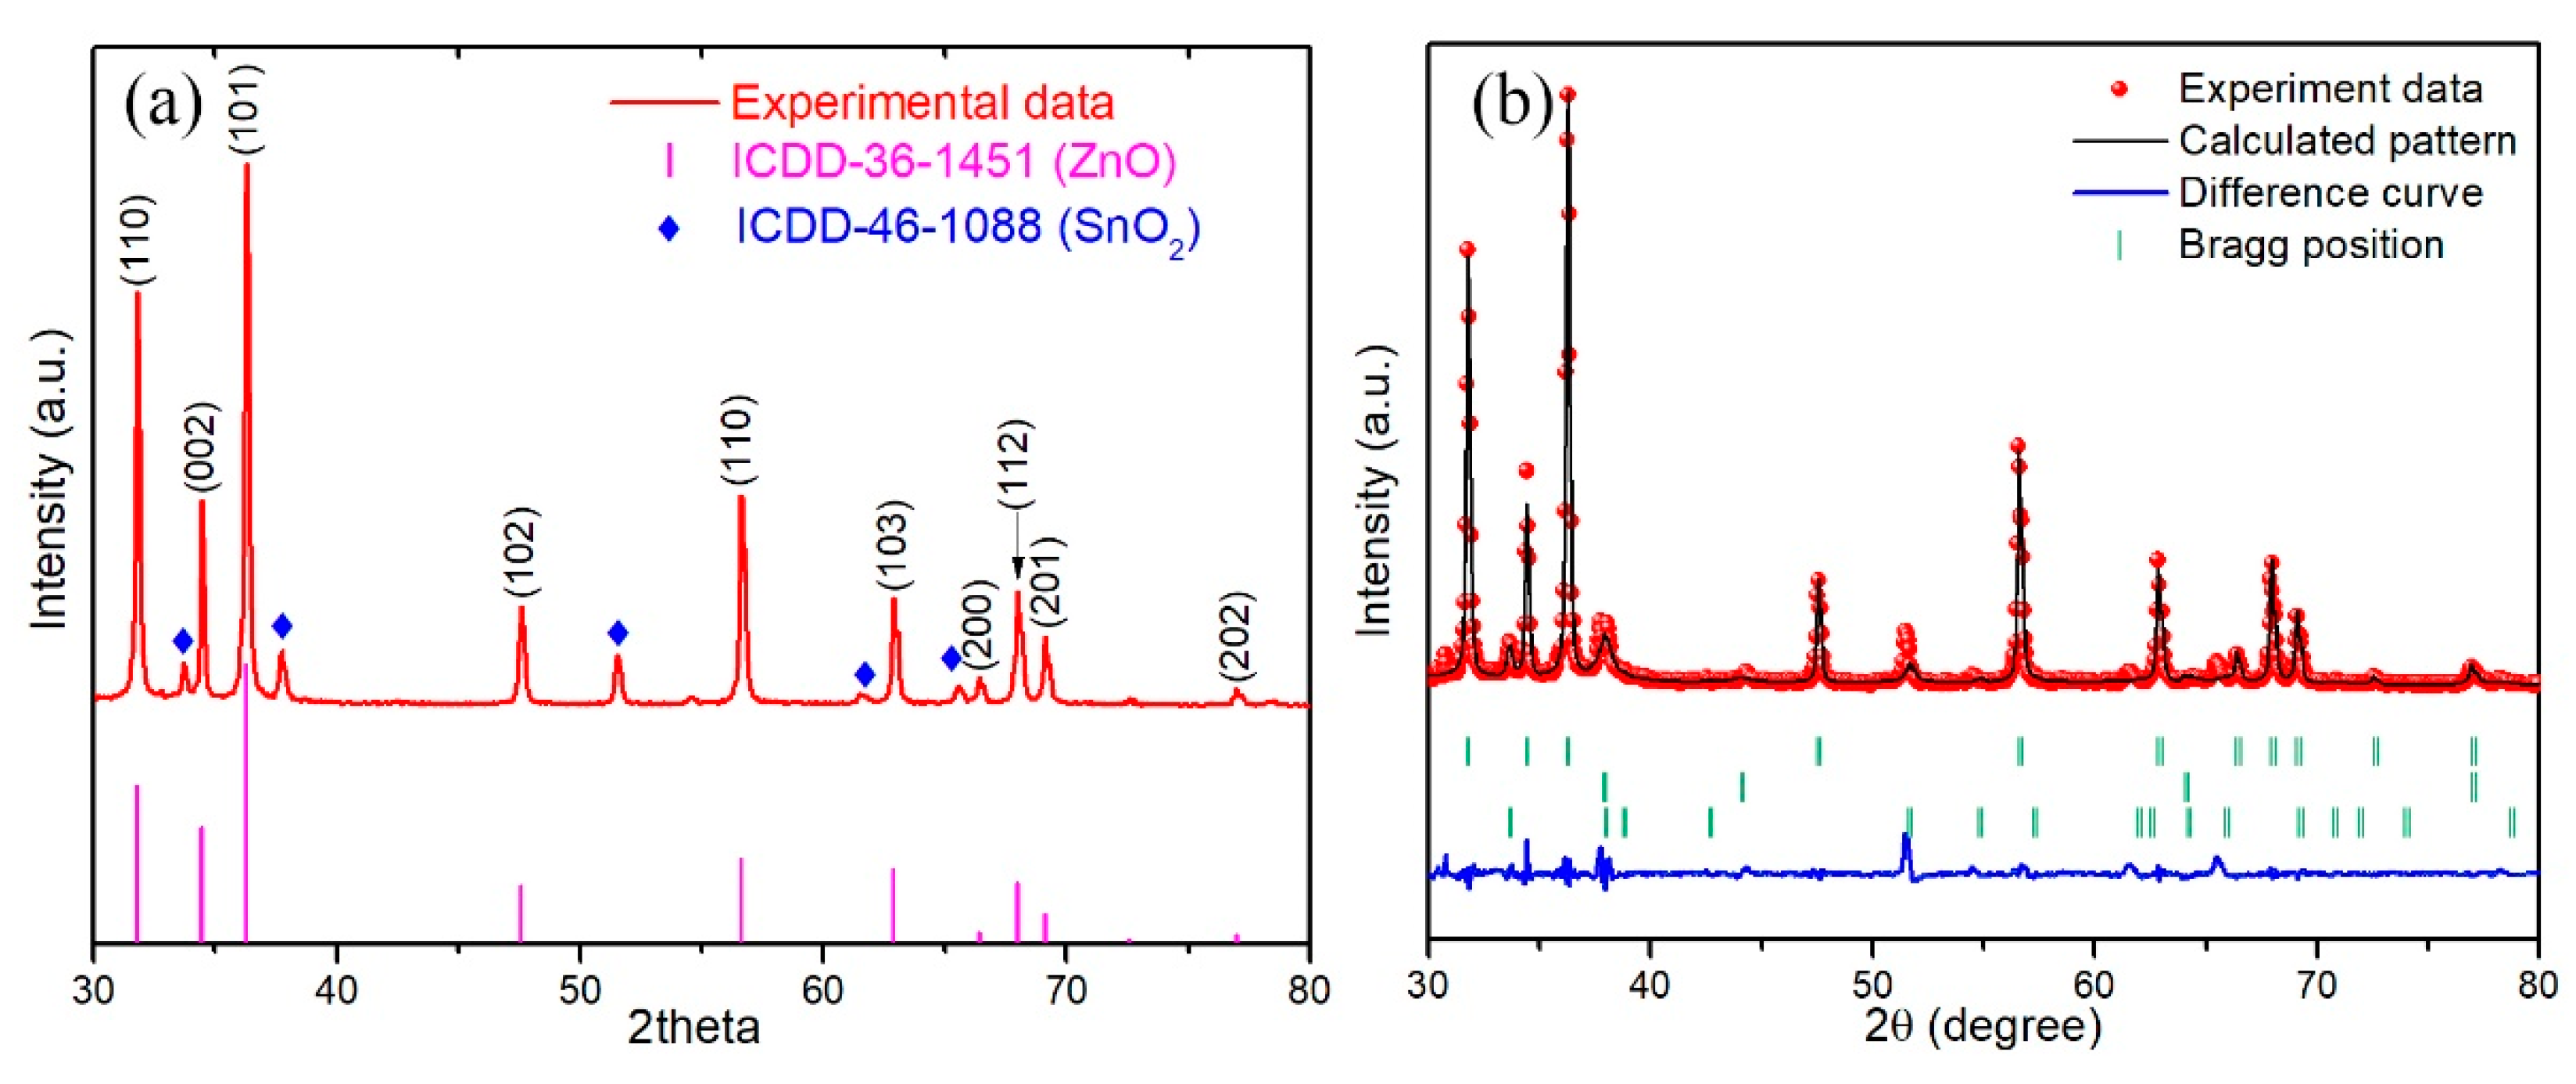
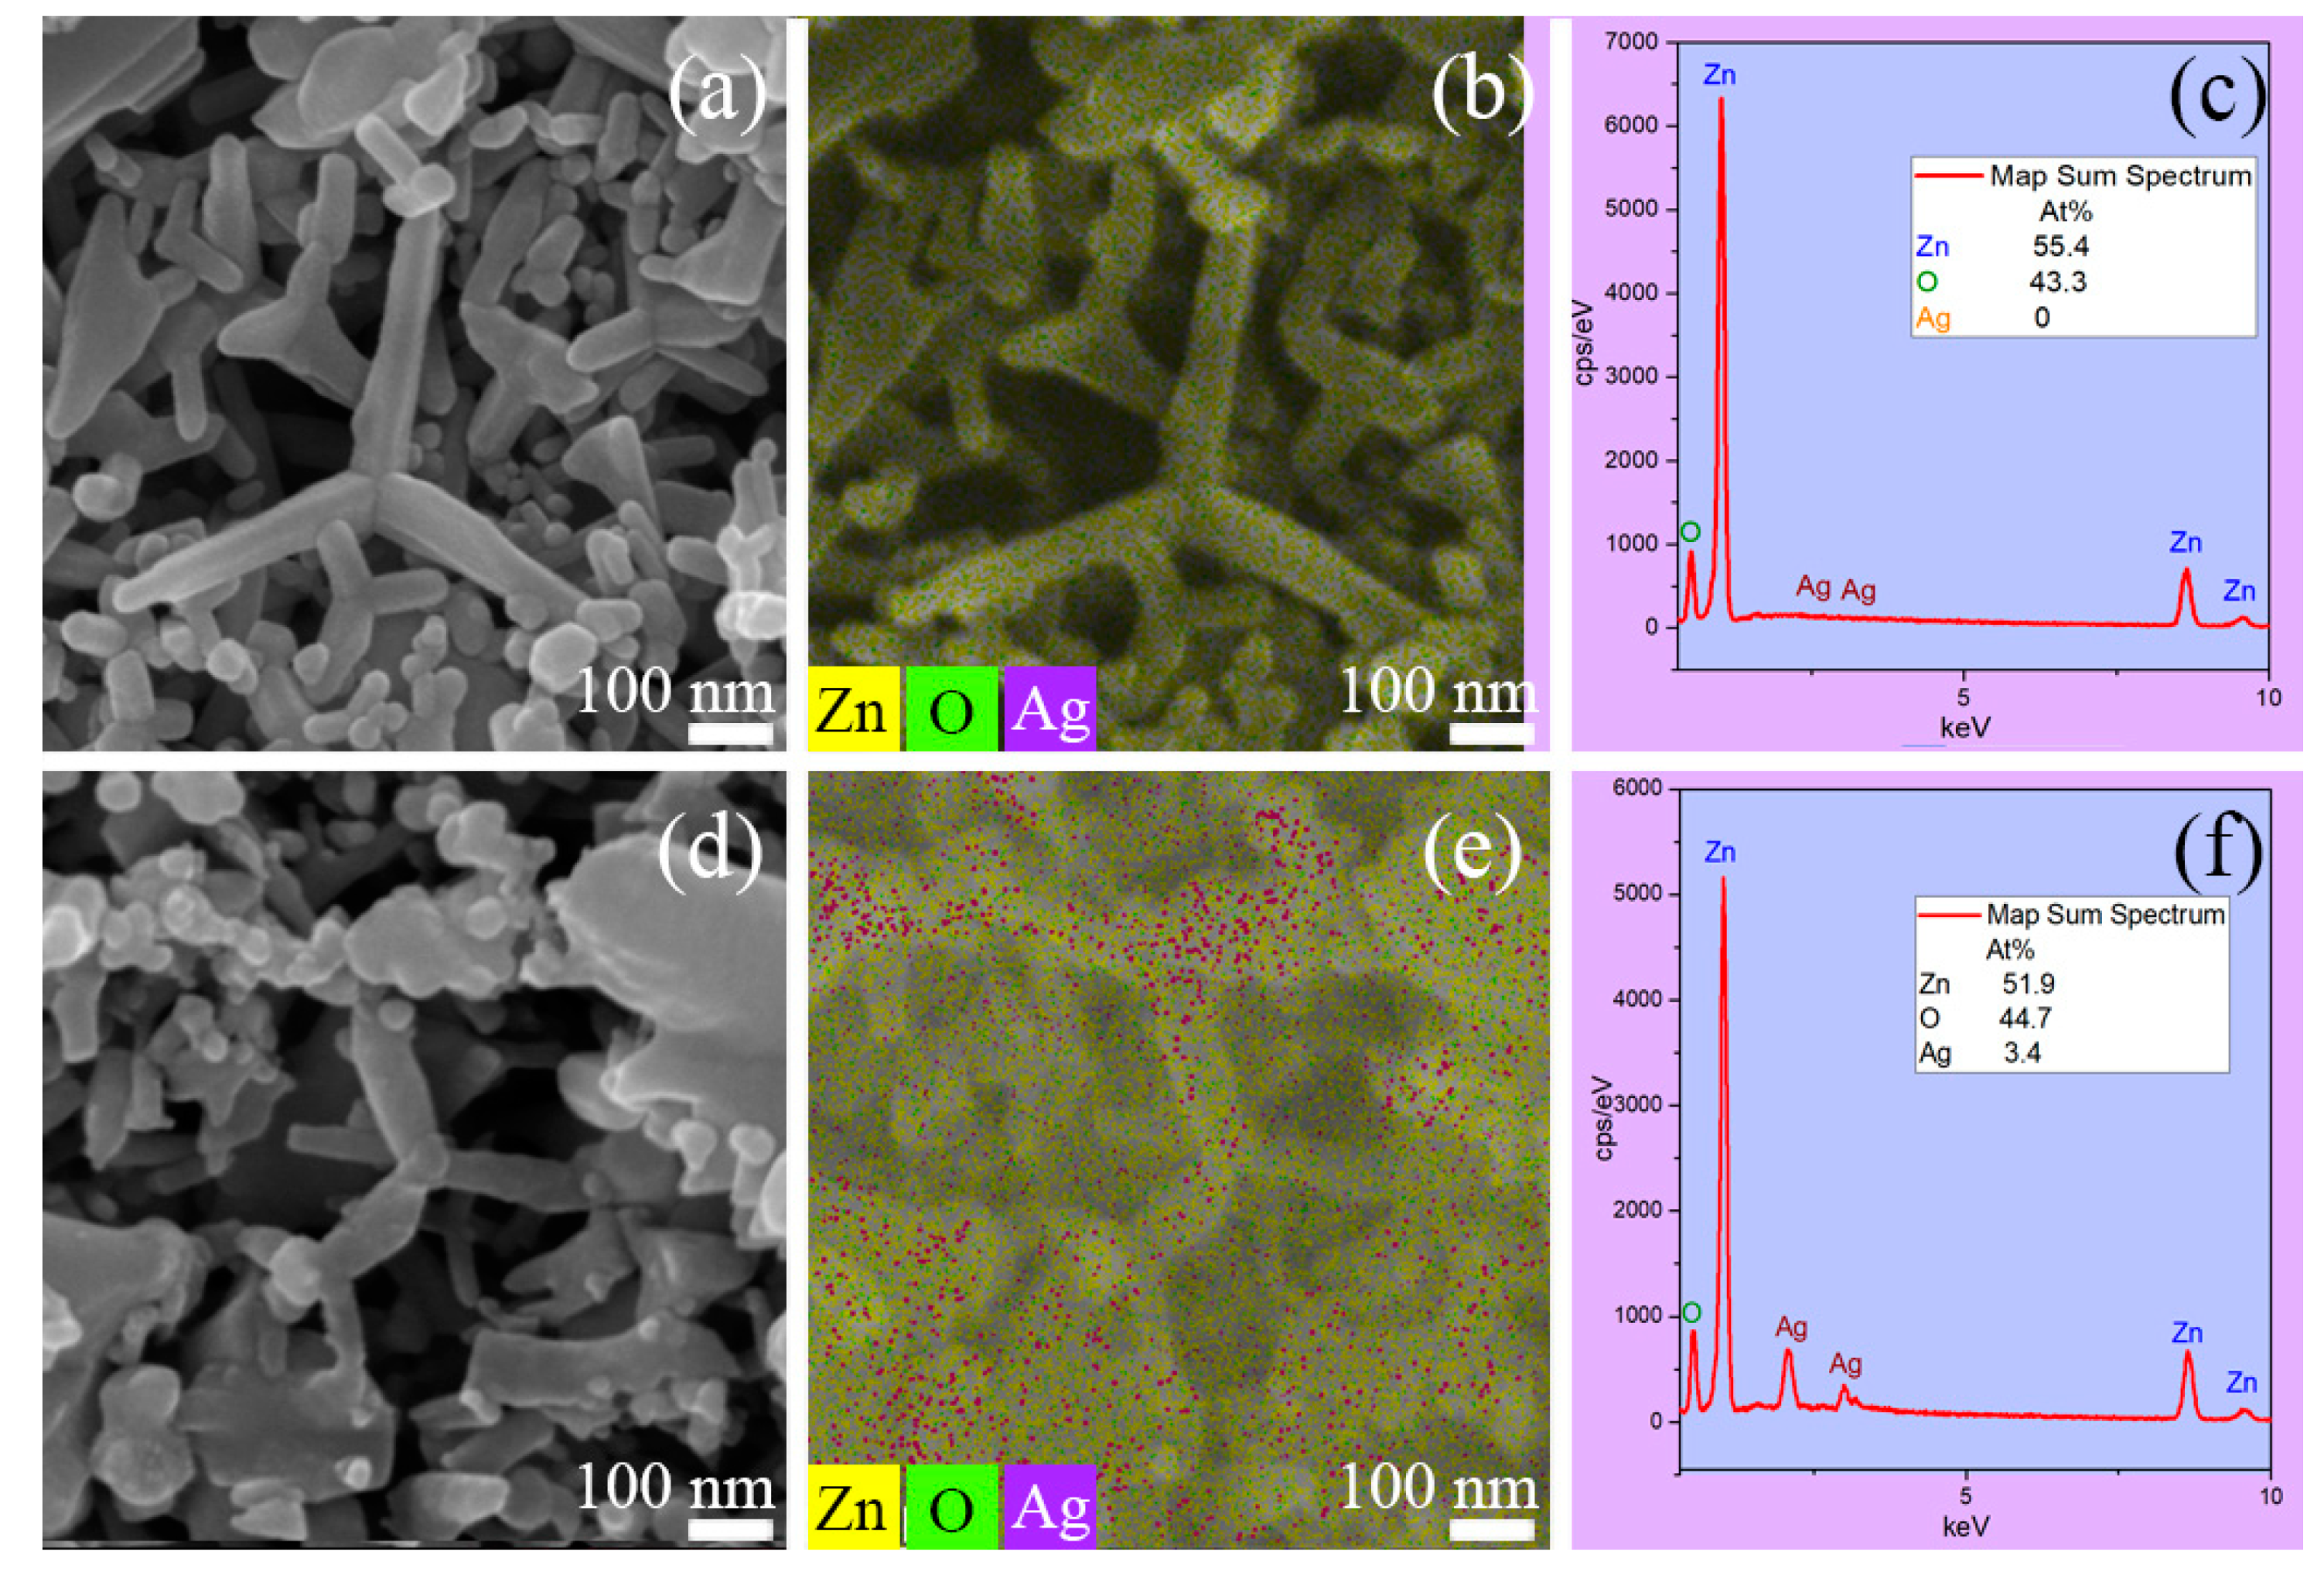
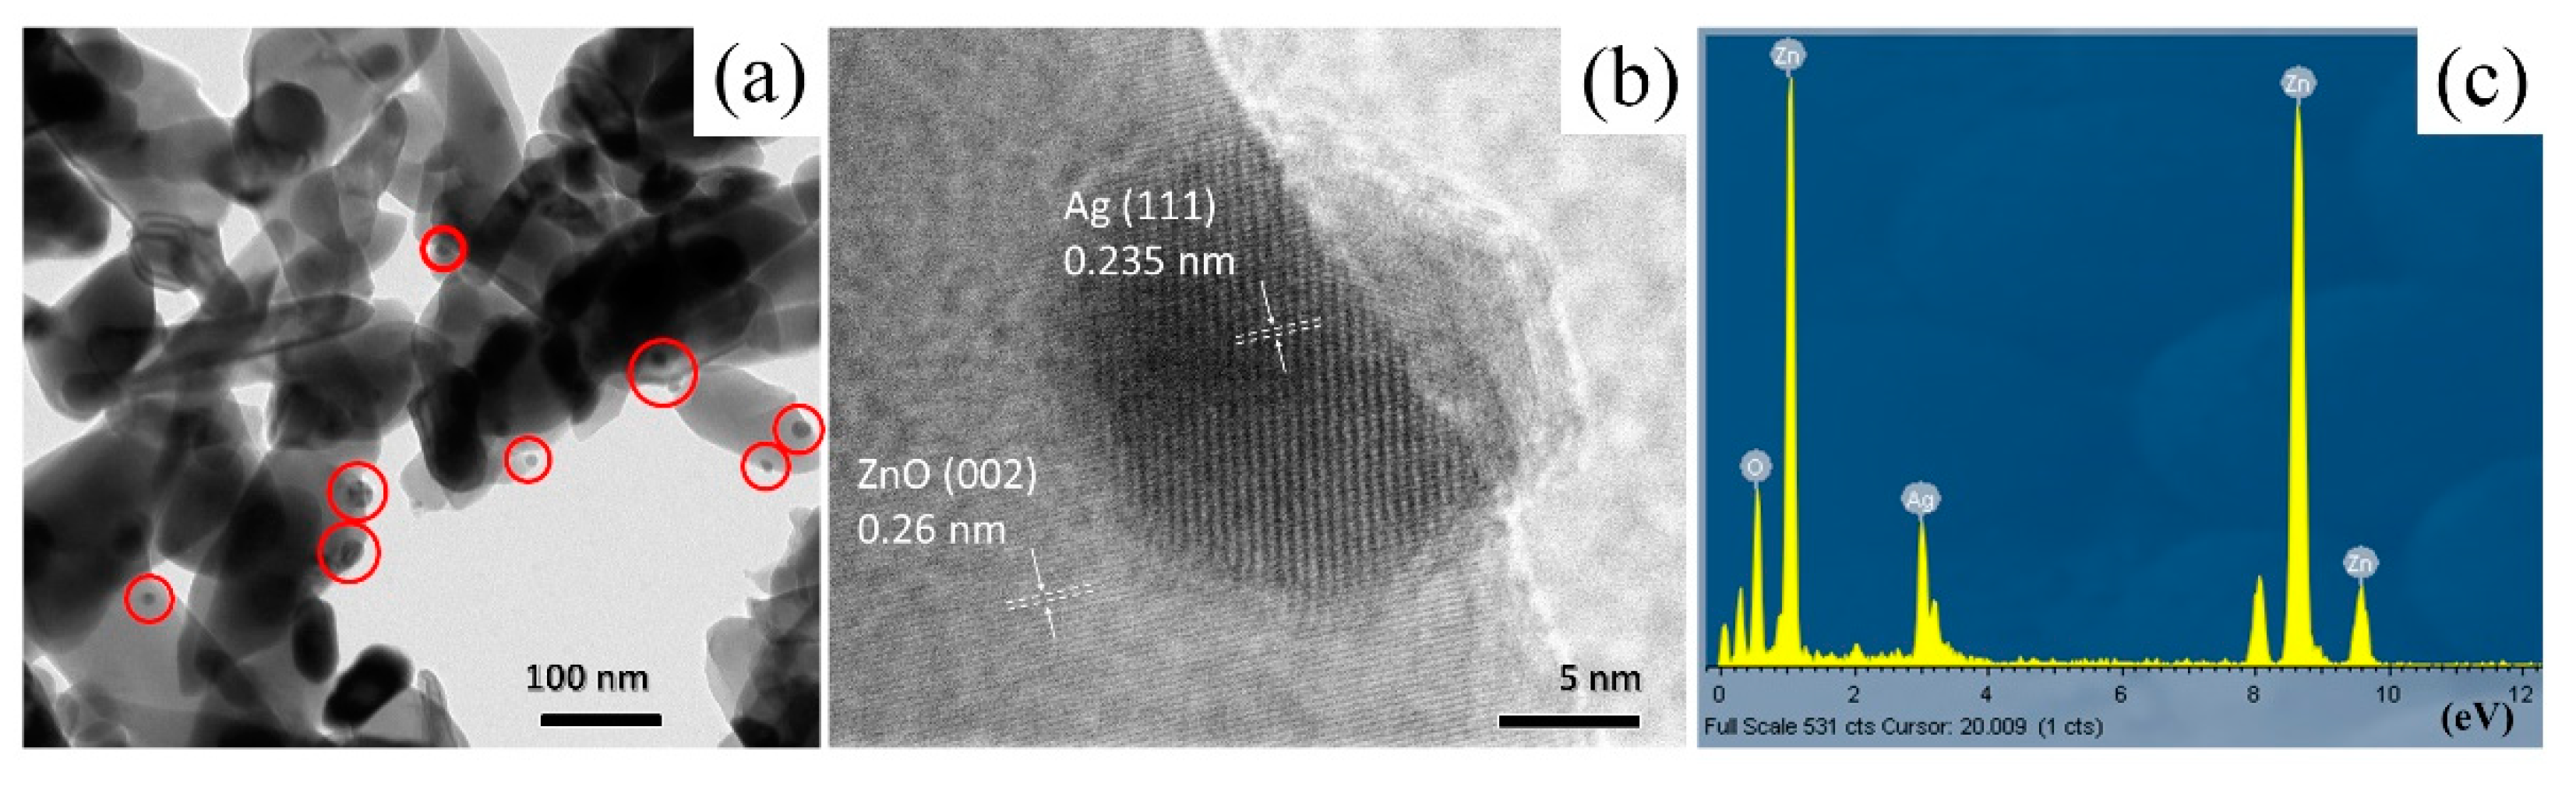
3.1. Morphology, Structure, and Composition Characterizations

The crystalline structure and chemical composition were investigated through XRD analysis. The results of the room temperature XRD patterns of the samples are shown in Figure 1a. All diffraction peaks can be indexed to hexagonal wurtzite structure of ZnO (JCPDS No. 36-1451), and no diffraction peaks at 2θ values of any others were detected except those from the FTO substrate (JCPDS No. 46-1088). All remaining peaks due to the FTO substrate are indicated by a solid blue diamond. After Ag was decorated, the three extra peaks in the XRD pattern of Ag@ZnO-FTO at 38°, 44°, and 77° appeared to be related to the plan of silver to (1 1 1), (2 0 0), and (3 1 1), respectively. Moreover, the all-diffraction peak of Ag can correspond to face-centered cubic (fcc) metallic Ag phase (JCPDS No. 04-0783) [24]. The detail structure parameters of ZnO tetrapod and Ag nanoparticles were list in Table 1. Thus, the X-ray diffraction pattern illustrated that the Ag@ZnO-FTO tetrapods were successfully achieved by the electrodecoration method.
In order to evaluate the microstructure characteristics of ZnO before and after silver decoration, the Williamson–Hall analysis, which is acknowledged as a standard method, was carried out to estimate the average crystallite size of the ZnO structure and whether it contained a microstrain [25]. The total broadening due to thesize and strain effects in a particular peak having the hkl value can be expressed as follows:
B e x p 2 B i n s t 2 Cos θ = K λ D + 2 ε × Sin θ
where Bexp is the measured broadening, Binst is the instrumental broadening, which can be obtain by measurement with a calcinated powder (large grain size) sample, θ is the peak position (in radians), λ is the incident X-ray radiation wavelength, D is the average particle size, and ε is the intrinsic strain during the synthesis.
Figure S3 reveals the plotting of this Equation (1), with the term (Sinθ) along the X-axis and the term (B Cosθ) along Y-axis corresponding to each diffraction peak for each ZnO phase. One can determine the average crystal size and microstrain from the intercept and the slope of the plotted straight line, respectively. According to fitting result based on the least-square difference, we found that the trend did not particularly contain stress, and the crystallite size of ZnO nanoparticles decreased from 73.6 to 72.8 nm before and after the electrodeposition of decorative Ag.
It has been reported in the literature that Ag+ acts as an amphoteric dopant and occupies both the interstitial and lattice site in a specific cosynthesis reaction [26]. Because of the difference in radius and ion charge between the Ag+ ion (1.29 Å) and Zn2+ ion (0.88 Å), it is preferable to perform Ag segregation in the vicinity of ZnO grains, which may contribute to the extraordinary growth of microcrystals. However, we preliminarily ruled out this phenomenon, because the diffraction spectrum did not find any spectral peak shift and other signals from the impurity phase. There was not even a diffraction peak that had a significant decrease in intensity due to the distortion of the lattice structure. Therefore, we believed that the current grain size change was only a reasonable accuracy performance of the equipment and there was an error in the statistical analysis.
Importantly, the structural information can be obtained using the Rietveld method to refine the diffraction patterns calculated by the FullProf software, as presented in Figure 2b. The red ball, black curve, and blue curve indicate the experiment data, calculated curve, and variation, respectively. The green bars illustrate the position of the Bragg reflections from each element. From the calculation, the Chi2 value was at 5.0979, and the lattice symbol was hP. The Rietveld profile presents all the structural parameters of refinement and is summarized in Table S2.
FE-SEM was used for evaluating the morphology of the ZnO chip before and after the decoration of the Ag nanoparticles. As demonstrated in Figure 2a,d, the FE-SEM image of ZnO-FTO chips, a high-magnification image, showed that the stacks of ZnO tetrapod nanostructures were built up in a porous form on the FTO glass (Figure 2a), even though some of the particles were destroyed from the deposition processes. Moreover, the images evidently showed several rod lengths and diameters of each ZnO tetrapod, and the ZnO surface was very smooth. After decorating the nanoparticles of Ag on the surface of the ZnO tetrapods, a large quantity of Ag adhered to the surface of ZnO, as shown in the high-magnification FE-SEM image presented in Figure 2d. This result can present the basis of the SERS’ electromagnetic mechanism for generating the resonance effect to improve the Raman spectrum.
The chemical analysis was obtained by mapping X-ray energy dispersive spectroscopy (EDS), demonstrating that the components of Ag on the ZnO-FTO were nothing before being decorated (Figure 2b), which was confirmed by the EDS map summary spectrum (Figure 2c). On the other hand, the strong correspondence of Ag represented by a purple pseudo-color from the EDS mapping revealed the high quantity of the Ag nanoparticles decorated on the surface of ZnO (Figure 2e) after the decorating process, as well as the decrease in the weight percentage of ZnO from 98.7% to 96.6%, and the increase in the weight percentage of Ag from 0% to 3.4%, as shown in Figure 2f.
The TEM machine was used to investigate and analyze the size, morphology, and microstructural features of the fabricated Ag@ZnO-FTO hybrid nanostructure, as shown in Figure 3. From Figure 3a, one can obviously observe that the small agglomerates of Ag on the surface of ZnO have a rather uniform near-sphere shape. The similar morphology, but wide range of particle sizes of different Ag nanoparticles and their adherence on the sample had average diameters of about 20 nm. The smallest diameter of Ag nanoparticles can be observed at approximately 8 nm, presenting the possible phenomenon for the very small Ag nanoparticles that cannot exist during the electrodecoration process and aggregate together with each other and become the bigger Ag nanoparticles [27]. In addition, the classification of particles can be easily classified into two groups by different contrasts. Therefore, the darker particle, as marked by the red ring in Figure 3a, might be identified as silver; on the other hand, the lighter particle might be assigned to ZnO. For having more acceptable evidence, high-resolution transmission electron microscopy (HRTEM) images of different contrast from two nanoparticles are shown in Figure 3b. One well-defined image showed that the high crystallinity of this particle demonstrates its contrast from the clear lattice fringes. The interplanar spacing estimation was 0.26 nm, corresponding to the (0 0 2) lattice plane of ZnO, and the interplanar spacing was 0.235 nm, corresponding to the (1 1 1) lattice plane of Ag. Therefore, it can be assured that the darker and lighter particles correspond to the Ag and ZnO particles, respectively. The XRD patterns in Figure 1 present the peak widening responsible for both the ZnO and Ag nanoparticles having pretty small grain sizes, and resulting in difficulty to find the diffraction peaks of silver nanoparticles. Figure 3c presents the EDS spectrum of Ag@ZnO nanoparticles. The strong peaks from Zn, oxygen, and Ag were clearly detected, and no other peaks from impurities were observed. Furthermore, as shown in Figure 3a, the Ag nanoparticles strongly adhered to the ZnO nanoparticles. Thus, the well-defined heterojunctions are illustrated between the Ag nanoparticles and ZnO tetrapods, which are valuable for carrying electron charge transfer.

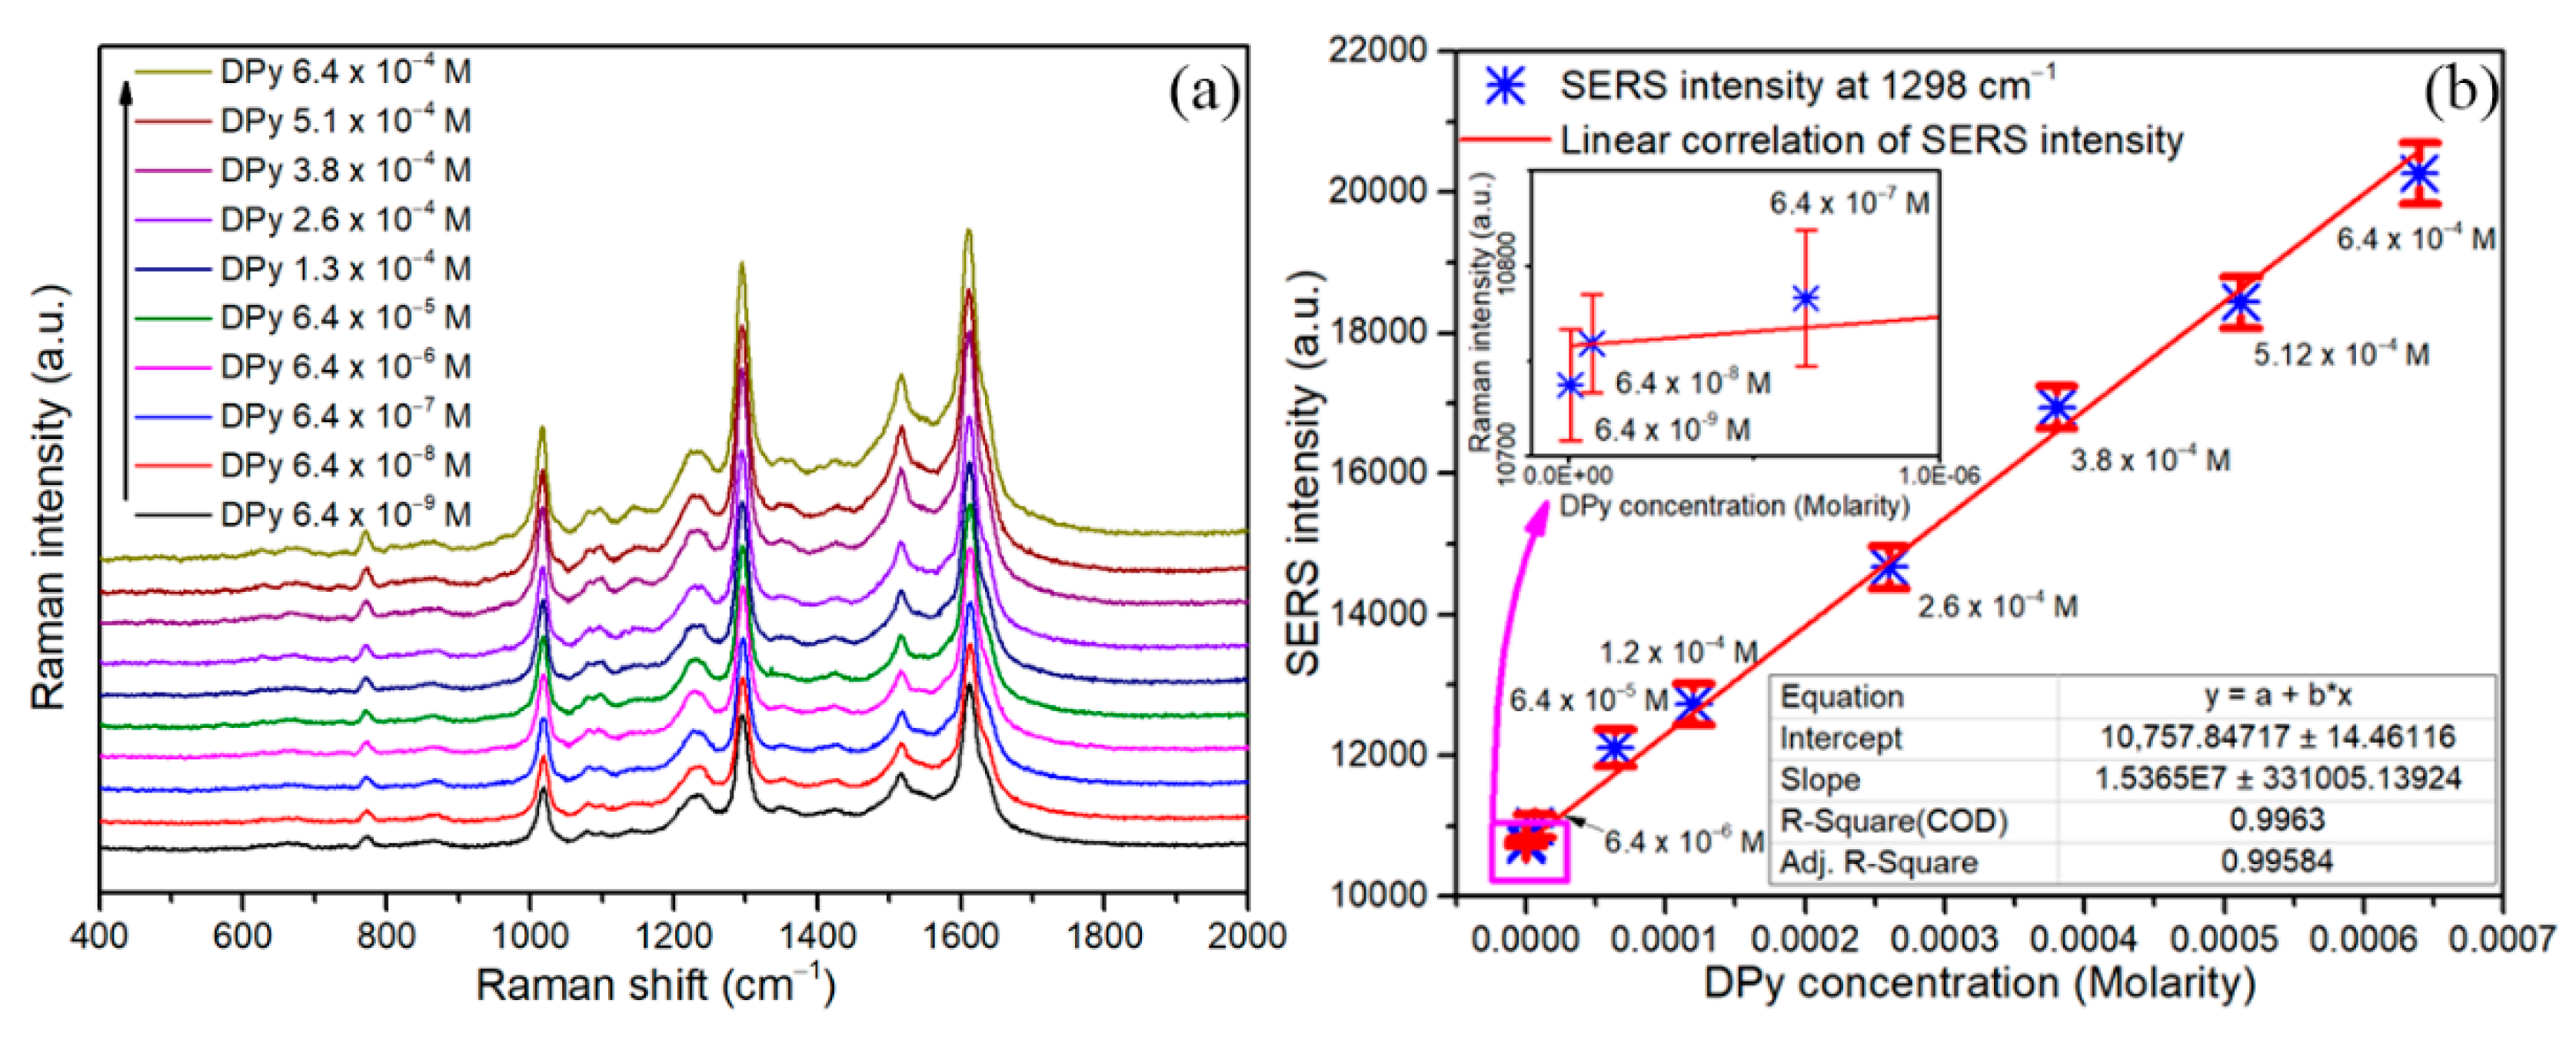
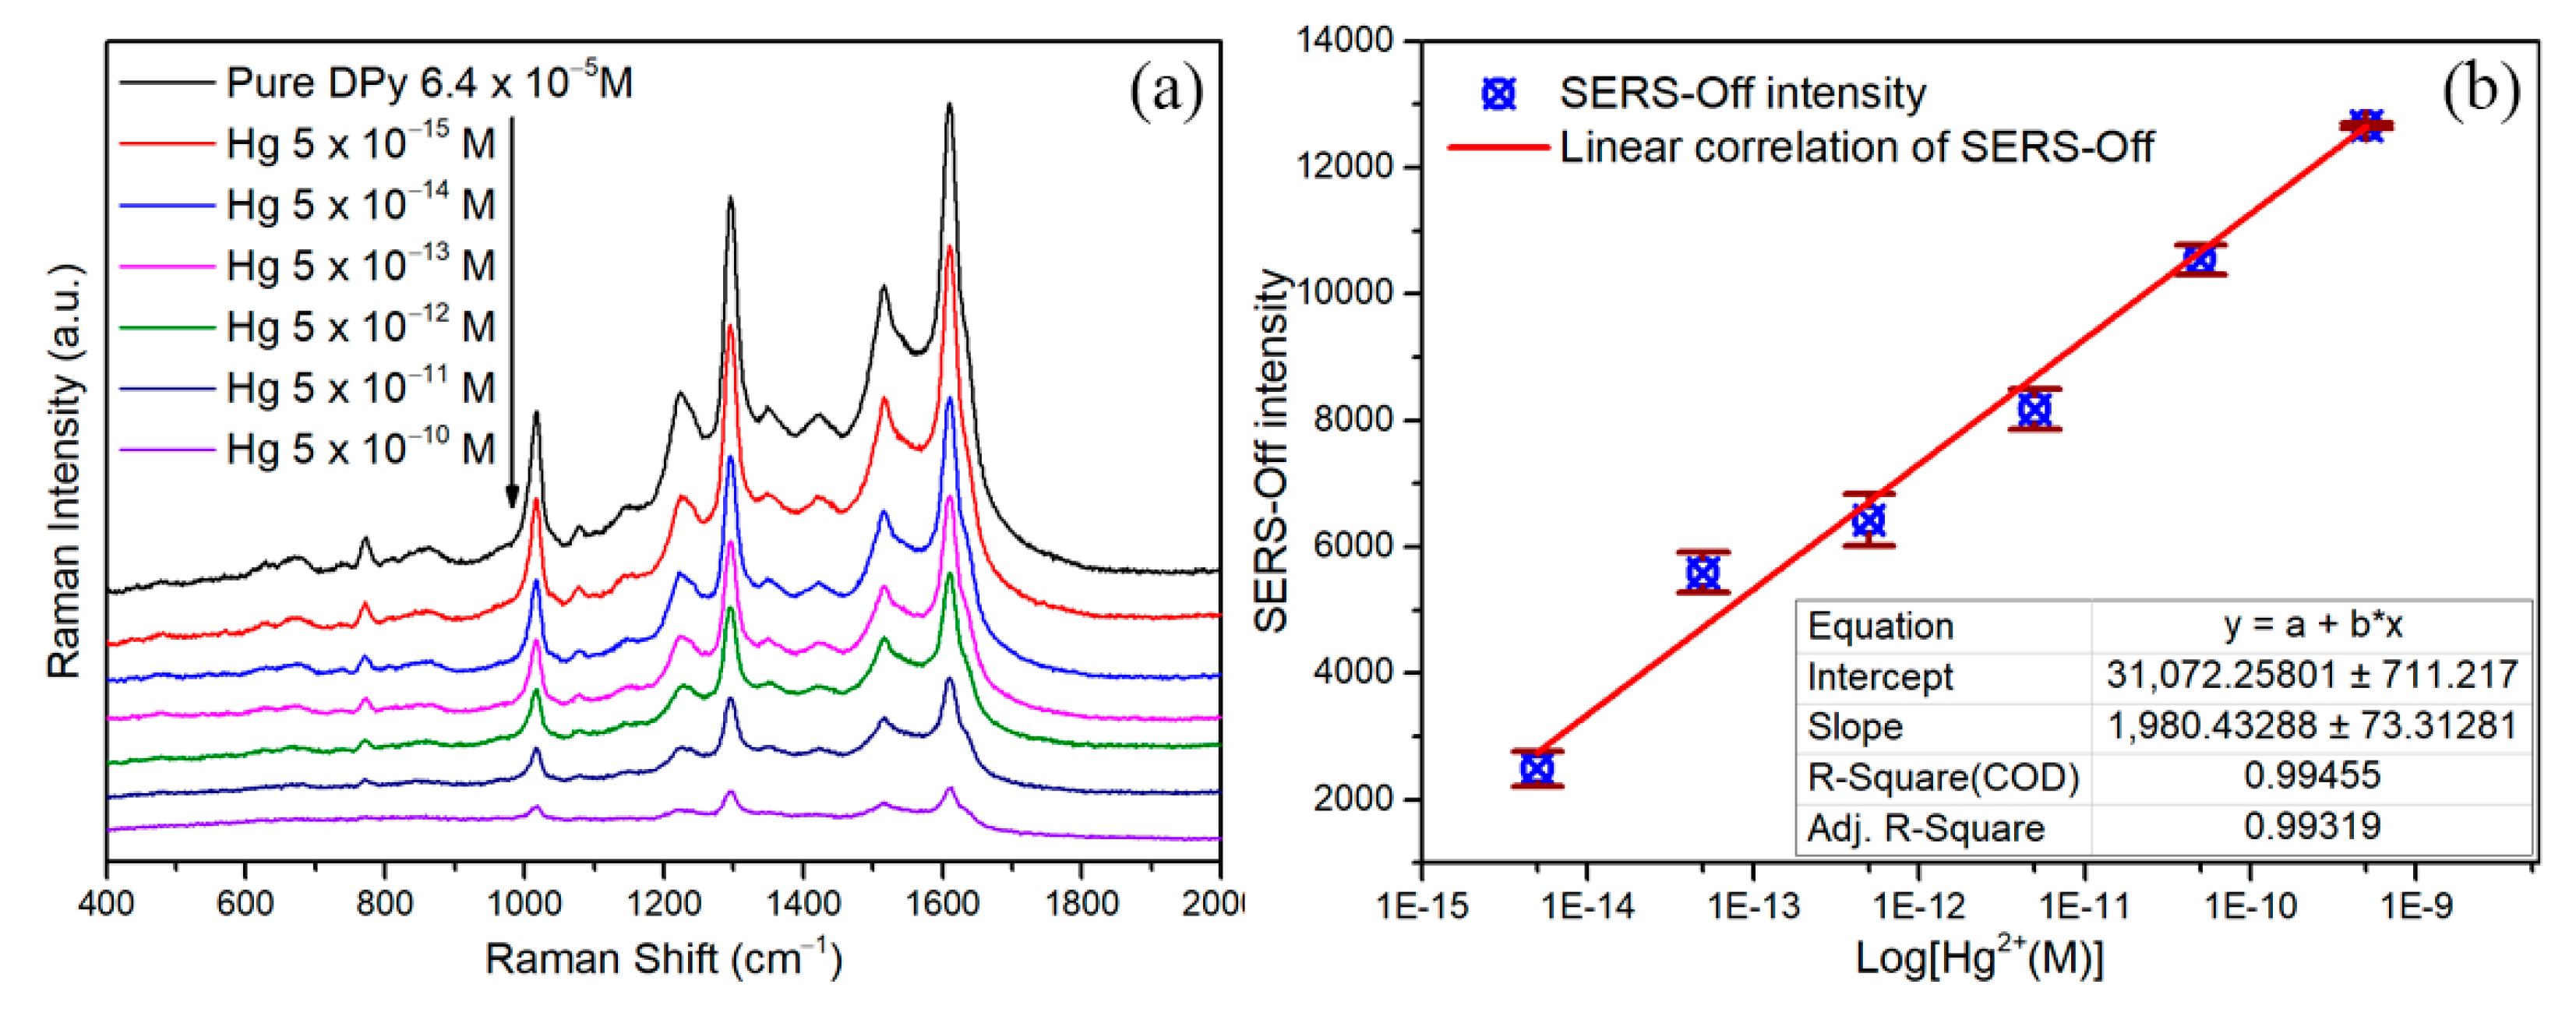
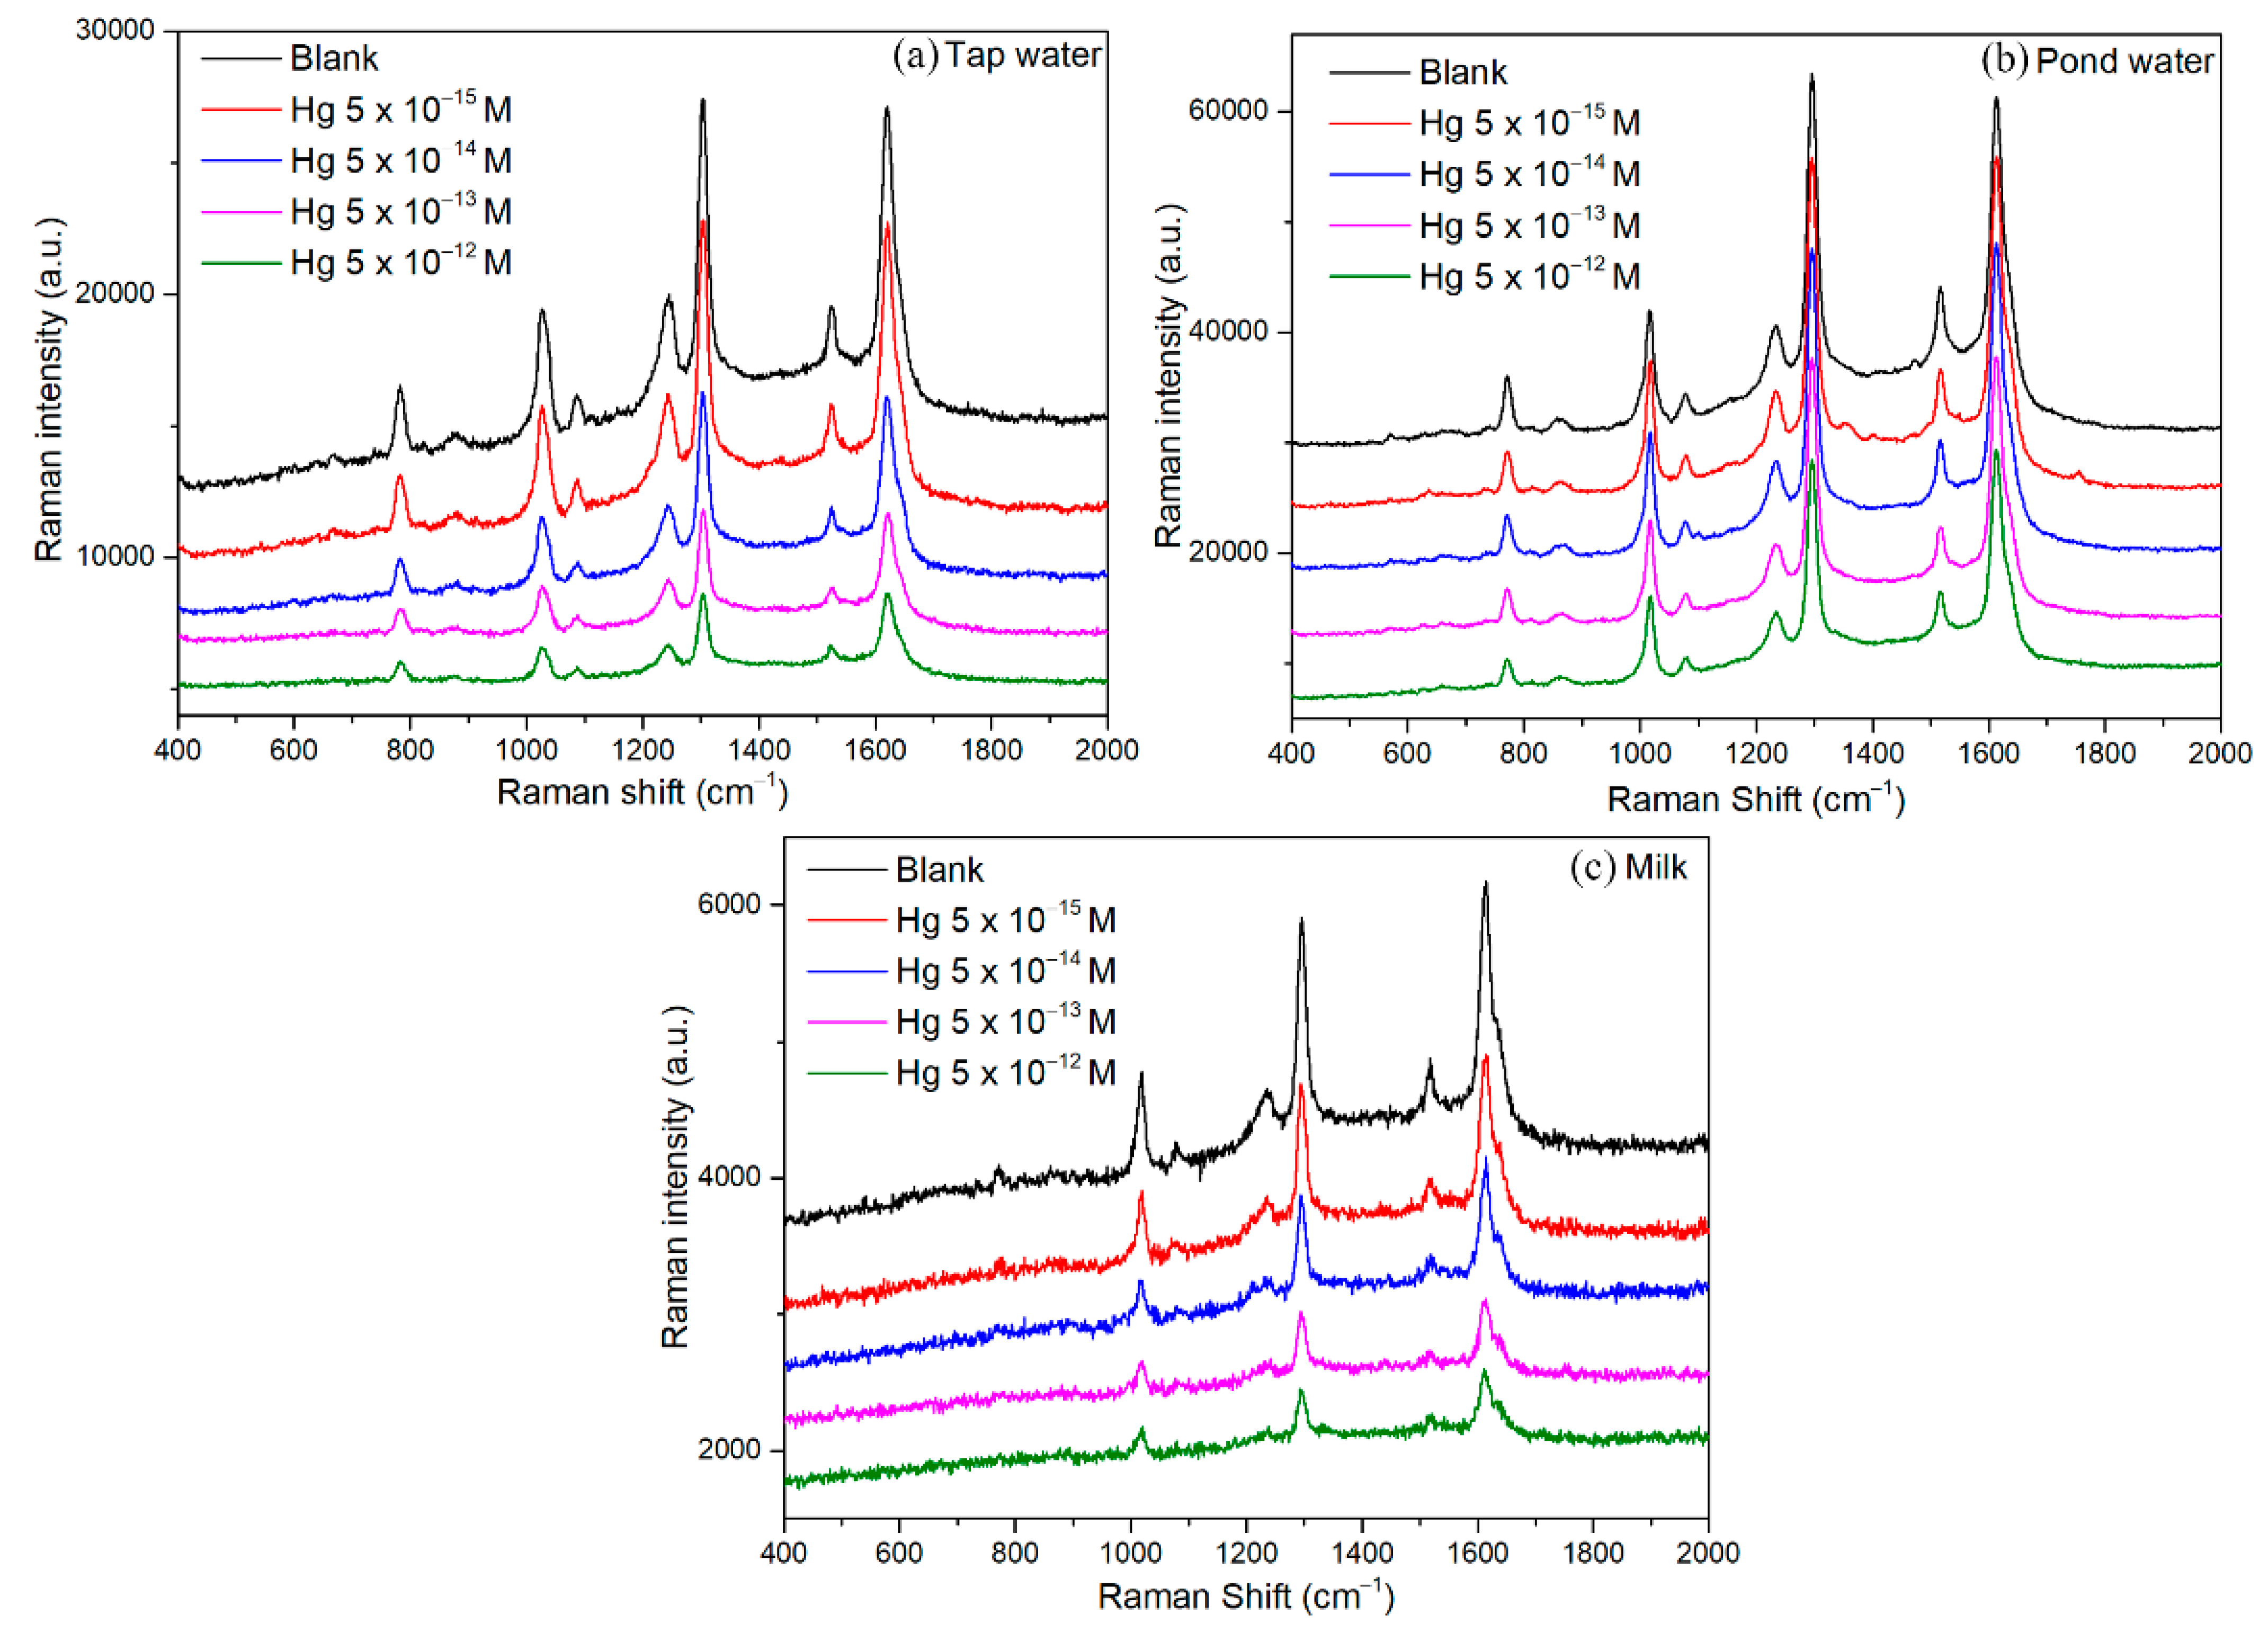
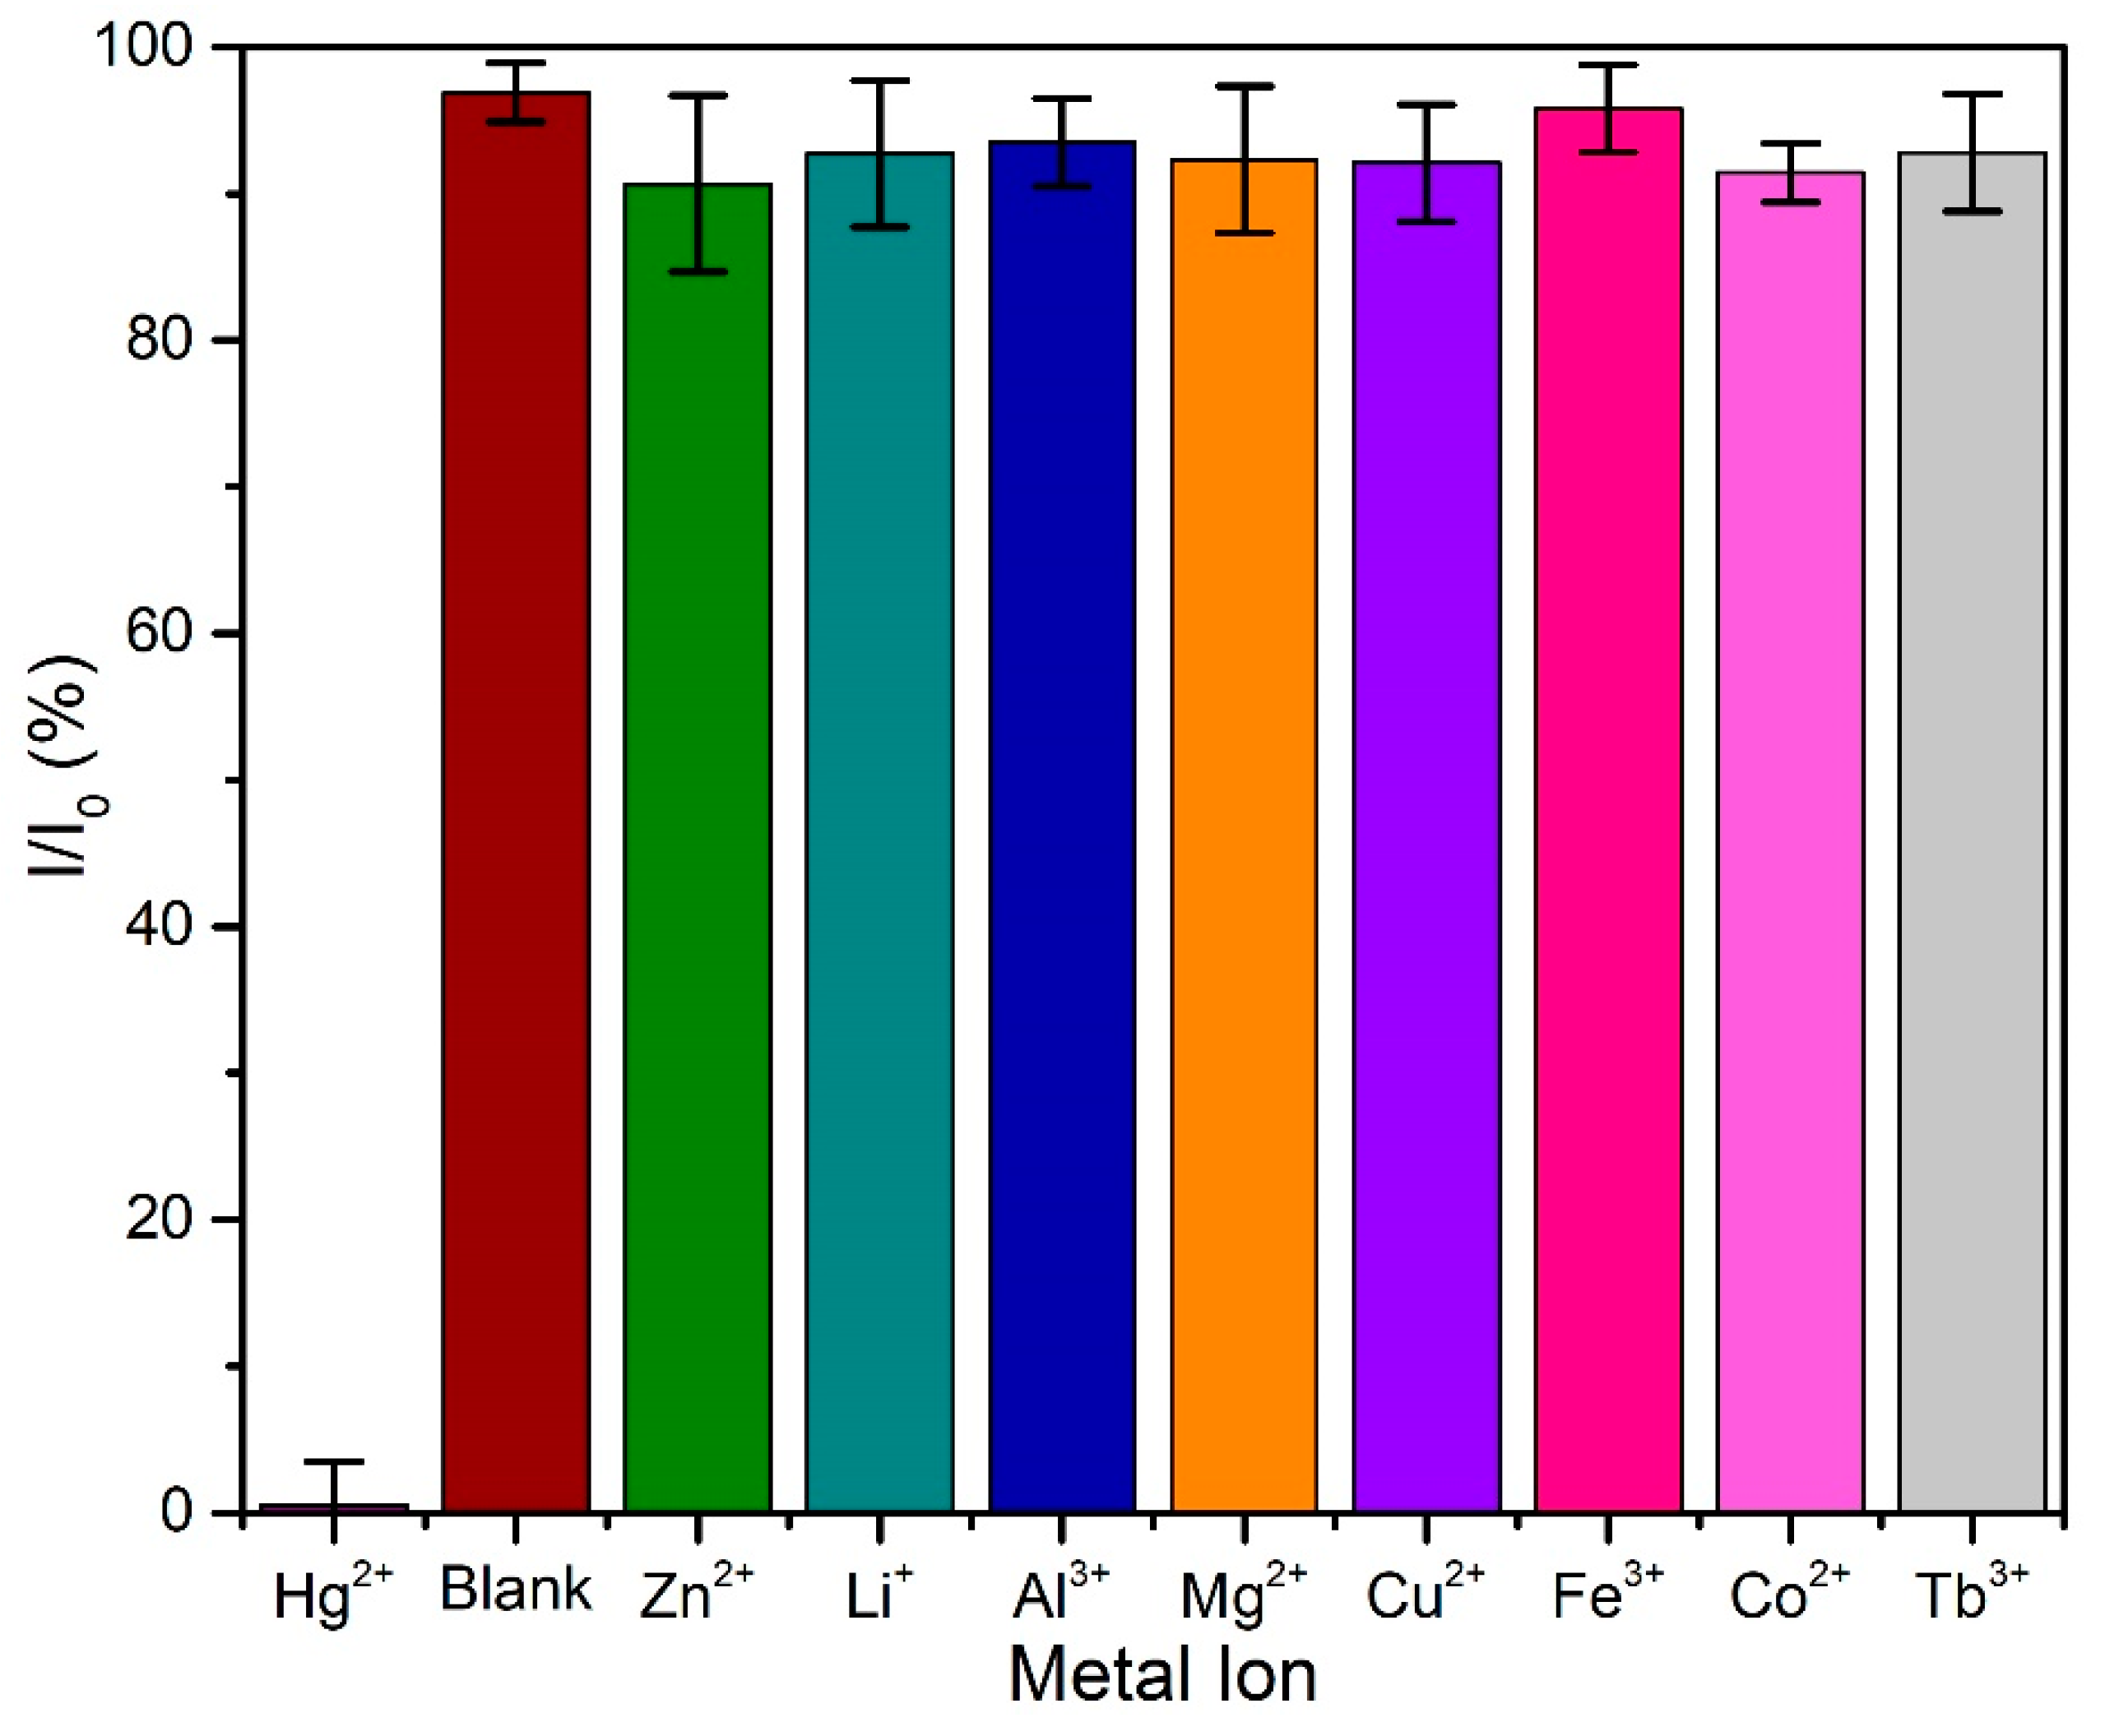
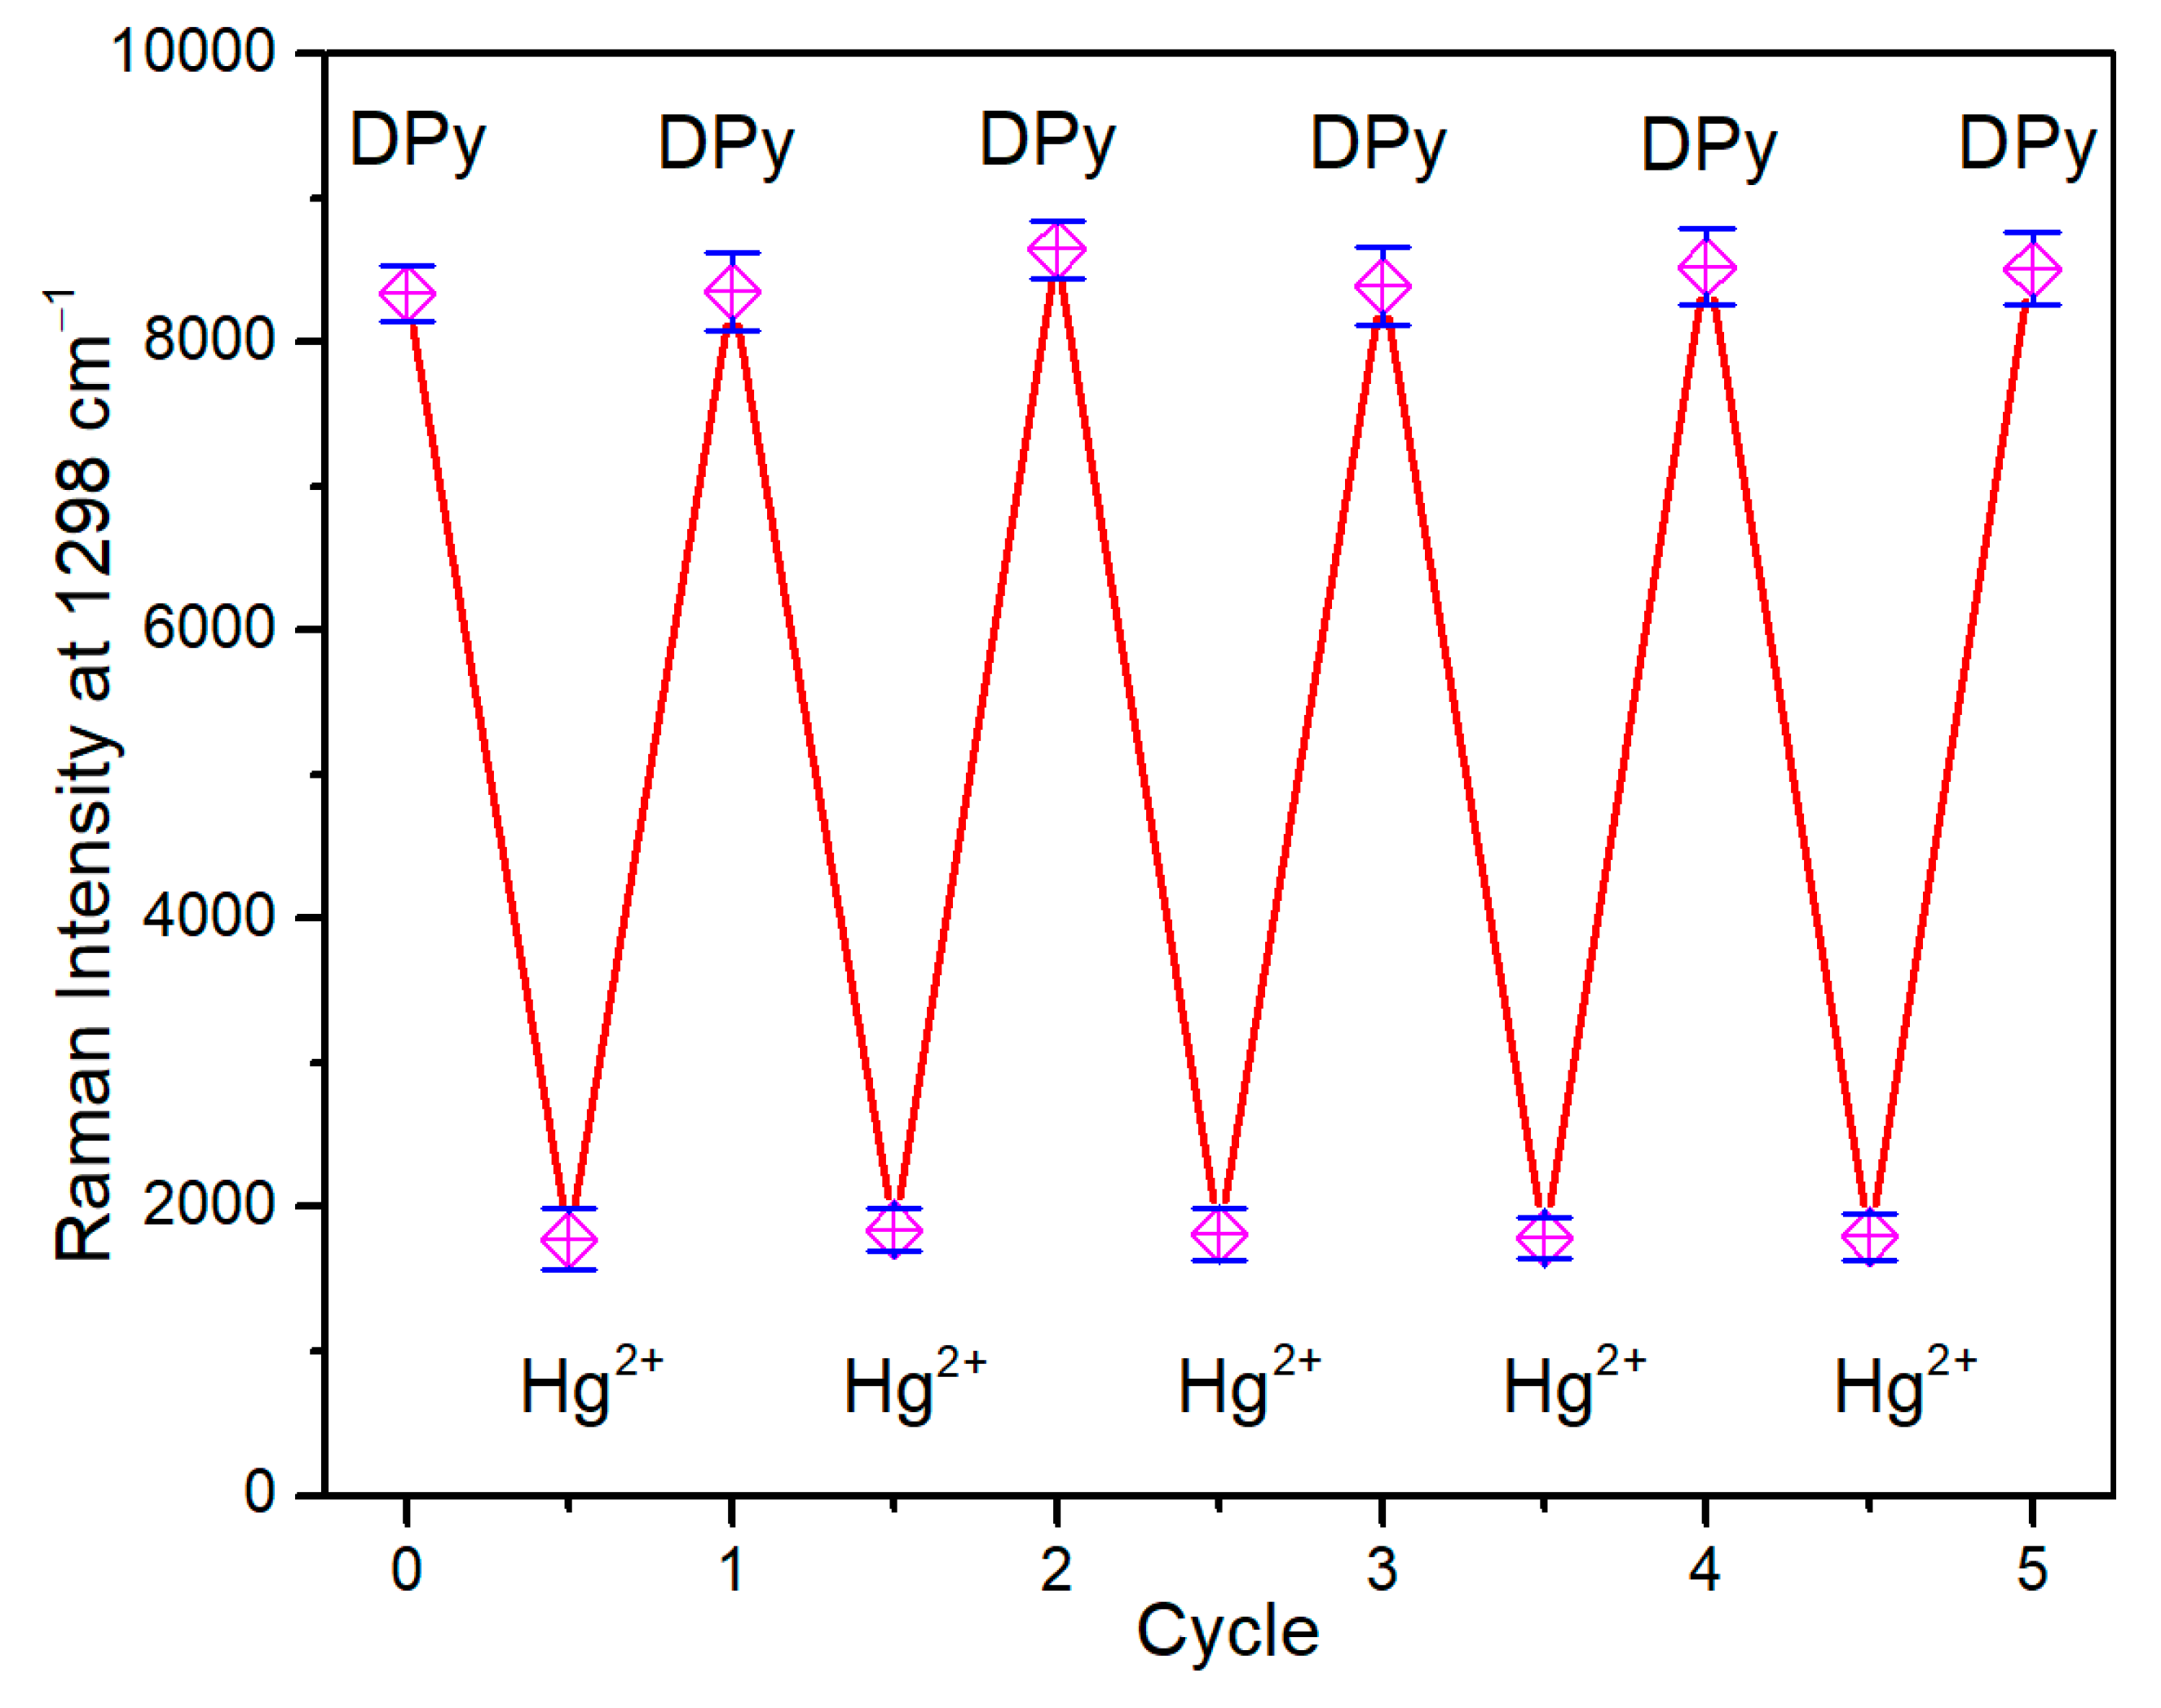
3.2. SERS Activities

Figure 4a presents the SERS spectra of DPy in the colloidal Ag@ZnO NPs. The stronger signal from Raman spectroscopy of DPy remarkably occured. Even when the DPy concentration was 6.4 × 10⁻⁹ M, the typical Raman spectra peaks of DPy, including 771, 1028, 1064, 1220, 1299, 1510, and 1612 cm−1, were clearly observed, which reveals that the reaction wat the junction of aggregating particles produced powerful hot spots [28]. Even though the behavior was similar to the Ag@Al, the effect of the enhancement of Ag@ZnO was about 10-fold that of Ag@Al (see Supplementary Figure S1). The increased enhancement effect possibly results from the coupling of the plasmon resonance of Ag nanoparticles and the porous form of ZnO [29]. On the contrary, the Raman signal of DPy using a pure ZnO substrate was almost negligible.
The contrast between micro-Raman spectra and SERS in some bands demonstrates the different structure of DPy on the silver substrate and in the solid state. As is known, the molecular structure changes when molecules are chemisorbed on a metal surface, causing the position of the band and relative intensities to be changed. On the other hand, the Raman spectrum of physisorption molecules is effectively the same as the free molecules; the small change is observed only in the band intensity and bandwidths [30]. The comparative result between Raman and SERS band position in Figure S2 indicates that the DPY was chemisorbed and had a strong interaction on the silver substrate. The peak at 999 cm−1 from the DPy powder by micro-Raman spectroscopy was similar to the symmetric ring-breathing mode of the pyridine ring in DPy, which has features that can be blue-shifted by 21 cm−1 and observed at 1020 cm−1 in the SERS spectrum. According to our assignments, this breathing vibration included the movement of the N atom from the pyridine ring. At 1610 cm−1 in the micro-Raman spectra, the vibration band had a small red-shift of 3 cm−1 up to the position at 1607 cm−1 by the SERS spectrum. This mode came from the motion between the displacement of the ring N atom and pyridyl ring C atom. The chemisorption of the silver substrate mentioned above can become the chemical enhancement for enhancing the spectra in addition to electromagnetic enhancement [30].
In order to calculate the enhancement factor (E.F.) in different DPy concentrations from the SERS spectrum, the peak position was chosen from the DPy, and had a strong in-plane deformation vibration in that peak [31], which can be defined as follows:
E F = N ( g l a s s ) × I A g N A g × I ( g l a s s )
where N(glass) and N(Ag) are the number of DPy molecules on the reference glass and the number of DPy molecules on the Ag SERS, respectively. The intensity of DPy on the silver and normal glass was also important for this equation. This became a factor that chose the peak with the interaction with silver by the pyridine ring. The plot with the calculated results is shown in Figure 4b, in which the enhancement factor of the DPy value increased proportionally to the concentration of the solution. The calculated E.F. was 2.95 × 10⁷ from the SERS intensity of the DPy solution (6.4 × 10⁻⁹ M) with regard to the normal Raman intensity of the DPy solution (6.4 × 10⁻³ M). When adding the DPy solution, the distance of Ag reduces after absorbing the DPy molecules depending on the concentration and becomes a resonance “hot spot” for the SERS spectra [32]. For this experiment, we found that the value of EF increased from 651 to 2.95 × 10⁷ M as the DPy concentration decreased from 6.4 × 10⁴ to 6.4 × 10⁹ M; because of different ion or molecular concentrations, there are different surface adsorption behaviors. The intensity of the obvious and clear peak at 1299 cm−1 was used for the quantitative evaluation of the evolution of the intensity from the Ag@ZnO-FTO SERS chip, and it exhibited an excellent linear relationship with various concentrations ranging from 6.4 × 10⁻⁷ to 6.4 × 10⁻⁴ M (R2 = 0.996).
The strong intensity of the DPy powder at 1623 cm−1 in the resonance Raman spectrum, corresponding to the C–C stretching vibration and the pyridyl ring C–N in-plane bending vibration can be observed. The symmetry mode appearing at 1612 cm−1 from the DPy solution was assigned the C-C stretching vibration. Similarly, the Raman spectra’ appearance at 1609 cm−1 was merely assigned to the C-C stretching vibration for the DPy powder. The peaks from the DPy powder at 1513 cm−1 and from the DPy solution at 1510 cm−1 illustrated the C-C and C-N vibration modes well. The vibration peaks from the DPy powder were at 1001 cm−1, 1219 cm−1, and 1298 cm−1, and from the DPy solution at 1064 cm−1, 1220 cm−1 and 1299 cm−1, which presented the strong interaction between the absorbate and silver substrate, corresponding to the C-C and C-N vibration, including the C-H in-plane bending vibration modes. The ring breathing vibration was present at 771 cm−1 for the DPy solution. The vibration modes in this study are all presented in Table S3. Besides, the symbols of each mode are indicated by the literature as well [33]. Eventually, we selected the 1298 cm−1 peak of DPy as the correct peak and quantitative analysis standard.
The function of SERS for detecting the concentration of mercury: In this work, the concentration of DPy at 6.4 × 10⁻⁵ M was used to observe the effect of Hg2+ concentration monitoring by SERS-off application. As shown in Figure 5a, there was a gradual decrease of the Raman signals of DPy and a corresponding increase in the concentration of Hg2+ from 5 × 10⁻¹⁵ to 5 × 10⁻¹⁰ M. Even at the Hg2+ concentration of 5 × 10⁻¹⁰ M, the intensity of the lowest peak at ~713 cm−1 still occurred. The intensity at the 1014 cm−1 band decreased gradually with the increasing concentration of Hg2+ ions, suggesting that DPy bases were released from the Ag NPs, because the interaction between Hg2+ and DPy is undeniably stronger than the interaction of DPy and Ag [34]. These can explain the mechanism of the SERS-off operation. For the quantitative evaluation, and the relative Raman intensity, the SERS-off intensities were used and are illustrated in Figure 5b; the capability of SERS-off continuously increased with the decreasing Raman intensity from losing DPy on the Ag surface. The reaction between DPy and Hg2+ demonstrates the capacity of the Hg2+ ion to perform as a soft acid that is efficient to form compounds with coordinated numbers at four, five, and six by two nitrogen atoms of the DPy ligand and four oxygen atoms of the two nitrate anions. This is frequently found in producing the various forms of the coordination polymer having one- and two-dimensional networks [35]. The performance of the SERS-off technique was consistent with the linear regression with a coefficient of 0.99, as shown in Figure 5b. The limit of detection (LOD) on the Hg2+ by DPy SERS-off technique was determined to be 5 × 10⁻¹⁵ M, which is a magnitude lower than the level in drinking water that the U.S. EPA specifies by a factor of 7 times.
Three specific samples using a common solution (tap water, pond water, and milk) were further chosen for practical applications to verify the optimum utilization of the proposed sensor to explore and detect Hg2+. The samples need to be pretreated by diluting them 100 times with DI water for increased transparency of the sample for obvious detection by Raman spectroscopy. The results were obtained and are illustrated as shown in Figure 6. Even if there was interference from other molecules or ions in these specific solutions, the dependence of the SERS signal on the mercury ions was still clearly identifiable. In addition, in order to study the specificity of the system to Hg2+, the SERS response by adding other metal ions such as Zn2+, Li+, Al3+, Mg2+, Cu2+, Fe3+, Co2+, and Tb3+ (ion concentration of 1.0 × 10⁻⁶ M for all) as samples were investigated. As shown in Figure 7, there as almost no quenching of the SERS signals of DPy, except for the mercury ion. The main reason for this result is the low-binding affinity of Dpy for the other metal ions [34]. It is particularly worth noting that the Ag@ZnO SERS chip can be recycled many times, We confirmed this by re-immersing the used chips in the DPy solution (6.4 × 10⁻⁵ M), and the SERS signal of DPy recovered almost the same as the first time, as shown in Figure 8. These results confirm that the SERS chip with a structure of Ag@ZnO-FTO has high specificity and reliability, and can also meet the sensitivity requirements of some specific applications.

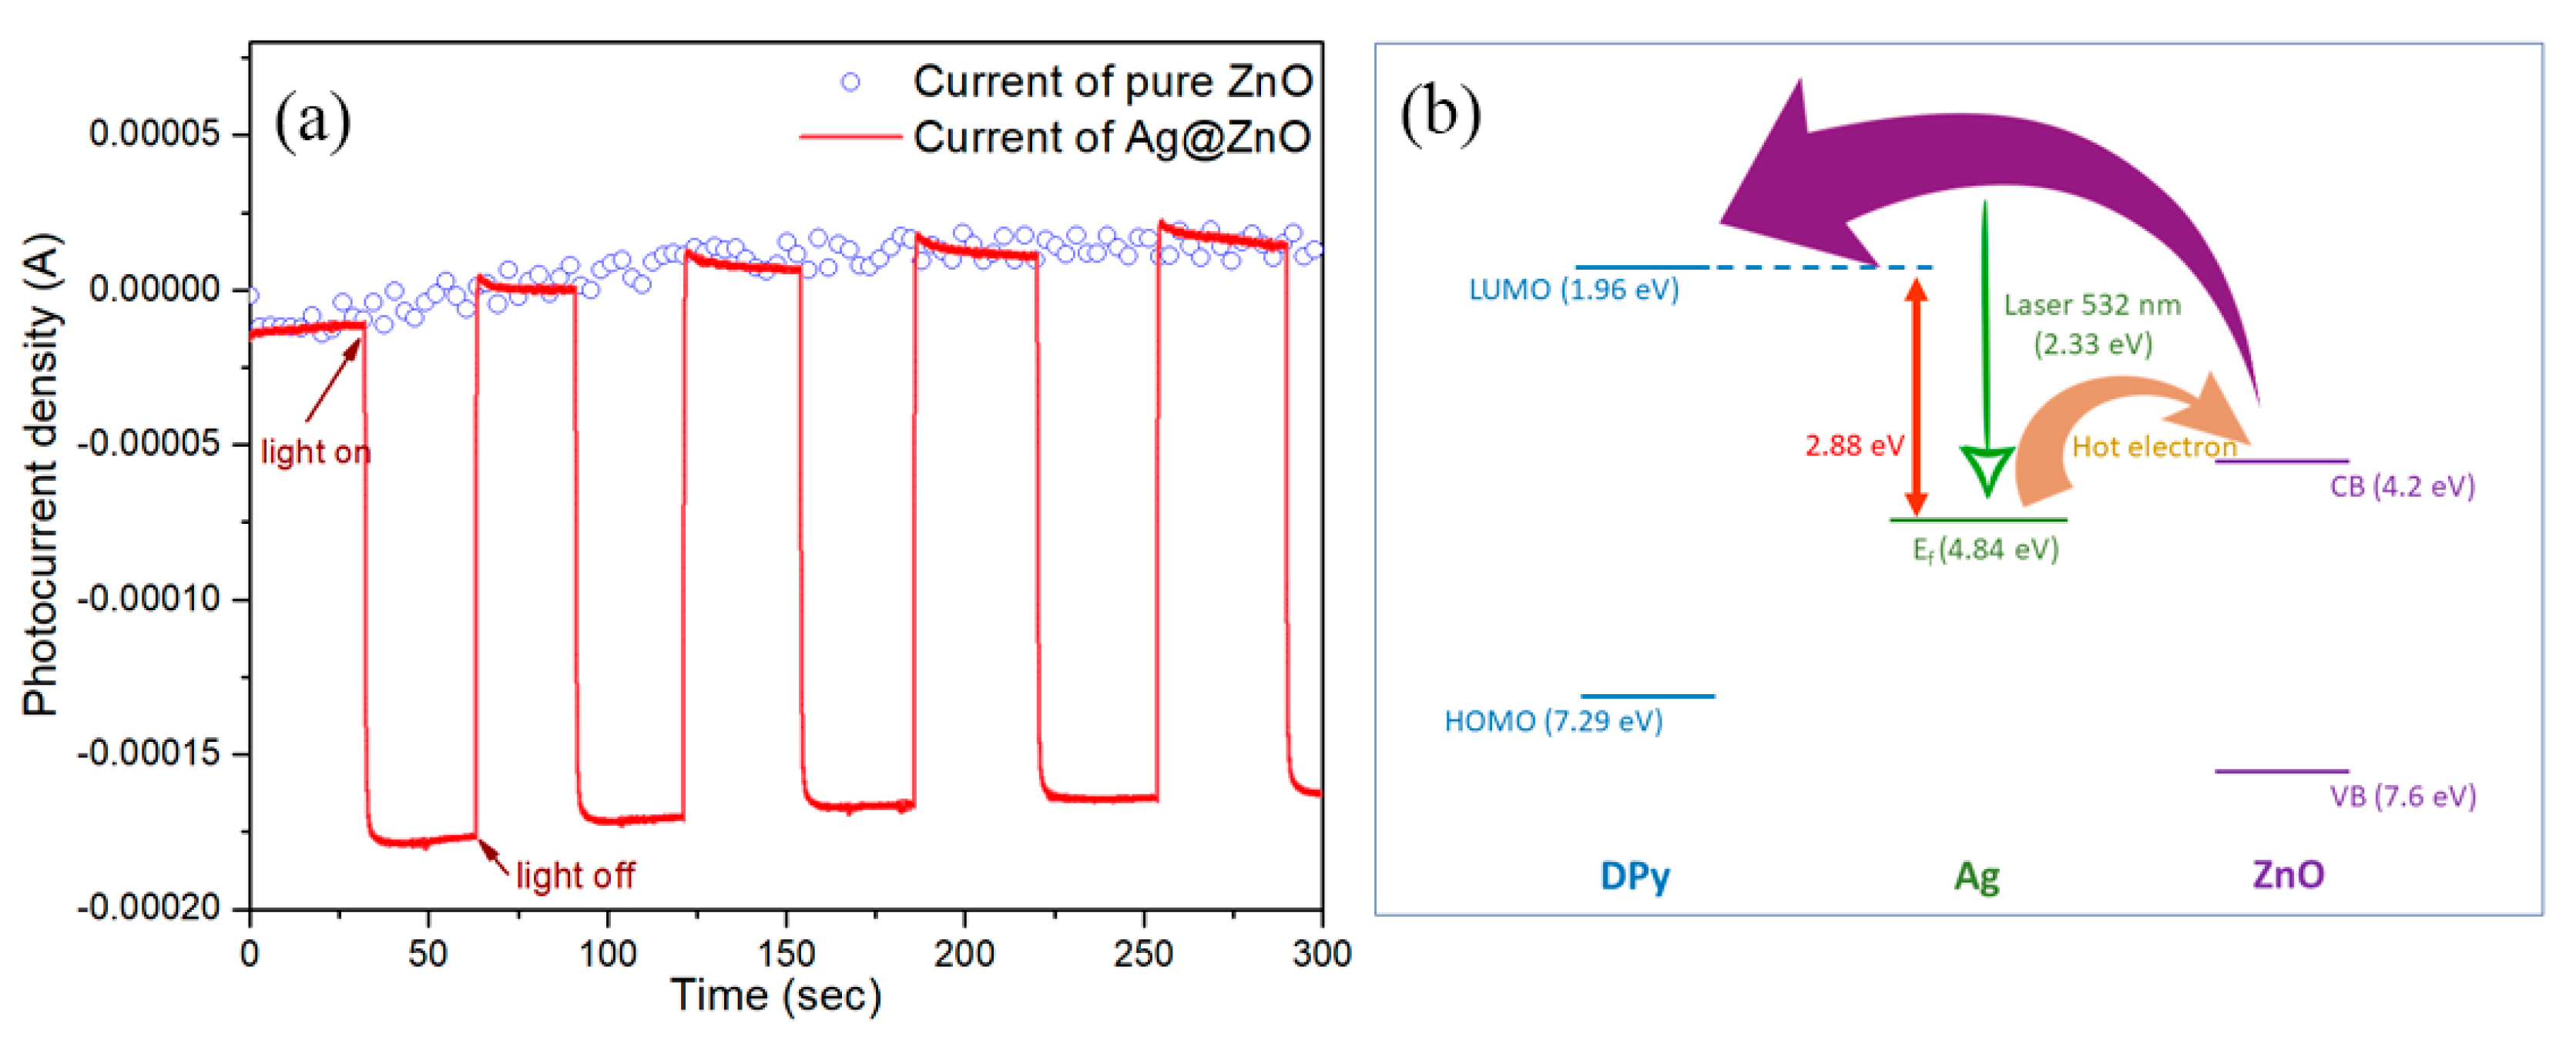
3.3. Visible-Light-Driven Photoresponse Properties

To understand the mechanism of the SERS activity in more detail, the carrier response for the SERS chip composed by hybrid nanostructures was elucidated by the photoresponse properties of Ag@ZnO-FTO and investigated by three-electrode testing under visible light illumination (λ > 420 nm). Figure 9a presents the photocurrent plotting obtained in a 0.1 M NaOH solution when the voltage of 0.5 V of the Ag/AgCl electrode was applied, and Pt was applied as a counter probe. Once turning on the light, the rapid photoresponse initiated from the Ag@ZnO hybrid nanoparticles and 17 µA cm−2 of the photocurrent density was generated. Nevertheless, for this case, under the illumination of visible light, we could not generate the electron and holes on the wide bandgap of the semiconductor ZnO tetrapod nanoparticle, which was confirmed by the properties of the photoresponse. As is well known, the strong surface plasmon resonance (SPR) from the metal Ag nanoparticles can perform under the action of light. Thus, under the irradiation of visible light, the Ag nanoparticles are excited and generate the SPR, resulting in an enhanced electromagnetic field around the nanoparticles. The enhancement of electromagnetic fields can promote the potential energy (ESPR) with the generation of “hot electrons” at the Ag nanoparticles and ZnO interface. On the other hand, a Schottky barrier (φb) occurred at the interface of Ag@ZnO nanoparticles, consistent with the energy band structure of the characteristic of ZnO and Ag [36]. Thus, the difference of potential energy between ESPR–φb was formed because ESPR was bigger than φb. These different potential energy forms can facilitate the energy transfer of the “hot electrons” to the conduction band (C.B.) of ZnO, as presented in Figure 9a [37]. Simultaneously, the Schottky barrier prevents the “hot electrons” from being transferred to the C.B. of ZnO, and from being returned to the Ag nanoparticles. Moreover, in our study the visible light was not efficient enough for the ZnO tetrapod nanoparticles to generate electrons and holes, so no holes were produced in the valence band (V.B.) of ZnO. As a result, the “hot electrons” collected in the C.B. of ZnO should use an external circuit to produce the three-electrode PEC cell photocurrent.

3.4. Mechanism for SERS of Ag@ZnO Hybrid Nanoparticles Induced by Charge Transfer

In order to clarify the activity mechanism of SERS Ag @ ZnO hybrid nanoparticles, two contributions to explain the activity of SERS Ag@ZnO hybrid nanoparticles should be mentioned: (1) the E.M. enhancing contribution of plasmonic Ag nanoparticles; (2) the charge transfer of the Fermi level of Ag nanoparticles, the C.B. level of ZnO tetrapod nanoparticles, and the highest occupied molecular orbital (HOMO) of the DPy energy level. The illumination light becomes the significant factor for measuring the strength of the resonance effect contribution and the charge transfer from these two contributions. In this work, a laser with a wavelength of 532 nm (2.33 eV) was used to illuminate the DPy on pure ZnO and Ag@ZnO-FTO substrates. The position of C.B. and V.B. of the ZnO semiconductor versus vacuum were 4.2 eV and 7.6 eV, respectively; thus, the bandgap of the ZnO semiconductor was 3.4 eV [38]. The position of the lowest unoccupied molecular orbital (LUMO) and HOMO of the DPy versus vacuum were 1.96eV and 7.29eV [39], respectively. Therefore, the energy of illumination light at 2.33 eV iwas less than the bandgap of the ZnO semiconductor. The laser wavelength 532 nm was not capable of exciting ZnO to produce electron holes from the photogenerated process. Moreover, the bandgap of DPy molecule was 5.33 eV, which initiated the laser that also cannot be excited to produce electrons and holes, so no SERS signals were detected in the system for DPy on pure ZnO, as shown in Figure 7. On the contrary, for the DPy on the Ag@ZnO system, the Fermi level of Ag nanoparticles was 4.84 eV [39] and had some capability to excite the “hot electrons” transfer to the C.B. of the ZnO tetrapod nanostructures, which was apparently confirmed by the visible-light-driven photoresponse properties, as presented in Figure 9a. The transference of “hot electrons” from C.B. of ZnO tetrapod nanoparticles to the LUMO energy level of DPy will occur under light illumination is illustrated in Figure 7b. This chemical enhancement (caused by the charge transfer between the noble metal and adjacent semiconductors) has also been published in the literature on the modification of ZnO nanorods with Ag nanoparticles and in their references [40]. Some research has reported the use of the surface states or nonstochiometeric defects of semiconductors to perform the chemical-based SERS enhancement by the incident light with the sub-band gap energy [41,42]. From the PL of tetrapod ZnO (not shown here), we did find that the zinc oxide used had some defects (located at 526 nm, 2.36 eV) from the PL spectrum. This energy position was quite close to the green laser energy (2.33 eV) used in Raman. However, it is known that different defect centers are responsible for green, yellow, and red emissions for ZnO, while the green emission could be excited only at the band edge [43]. Therefore, in this experiment, the probability of electron transition from the valence band to the intermediate defects of zinc oxide by adsorbing visible light would not be the main light absorption path. Benefiting from the efficiency of the charge transfer system, the “hot electrons” from the Fermi level of the Ag nanoparticles to the C.B. of the ZnO tetrapod nanoparticles, and then to the LUMO level of the DPy molecule, showed that the Ag@ZnO-FTO system illustrated the high efficiency for sensitive SERS activities related to DPy and that the SERS-off intensity was eventually used to detect mercury ion concentration.

4. Conclusions

The hybridization of nanostructures between ZnO tetrapod nanoparticles decorated by Ag nanoparticles and the coating of ZnO on FTO glass was fabricated by electrochemical processes combining electrodecoration and electrophoretic methods, respectively. Ultrasensitivity for Hg2+ detection mostly comes from the extremely SERS-active nanoparticles, the selection of suitable organic ligands, and determining the ideal working conditions applied for the activity of 4,4′ Bipyridine (DPy). The high sensitivity of the SERS spectra collectively involved four working factors: (1) the strong SERS effect came from the nanoparticles of the metal ion which can adsorb the organic ligand efficiently; (2) the selection of the perfect organic ligand for coordinating ability with target ions to produce a highly SERS-active ability; (3) the different potentiality of adherence between Ag with DPy and DPy with Hg2+ can quench the SERS spectra from DPy to evaluate the Hg2+ level; and (4) the mechanism of metal ions can excite electrons from the Fermi level to the conduction band for reducing bandgap between ZnO and DPy, and then the electrons have the capability to transfer to the LUMO level of the DPy molecule. The fabrication of the SERS chip successfully decorated Ag on the ZnO surface to achieve an ultrahigh sensitivity down to the quadrillionth level for detecting Hg2+, which surpasses the previously reported results. The photoresponse properties from the fabricated hybrid nanostructure were distinctly confirmed by visible-light-driven properties, as the visible light (λ > 420 nm) can transfer photogenerated electrons from Ag nanoparticles to the conduction band (C.B.) of the semiconductor ZnO tetrapod nanostructure well. The achievement of this work illustrates that the highly effective charge transfer turning by plasmonic metal nanoparticles/semiconductors/organic ligand molecules can exceptionally improve the SERS application to detect metal ions in solution. Many advantages of these SERS chips are illustrated, including anti-interference ability, long-term stability, recycling usage, portable probability, uncomplicated operation, and especially, inexpensive investment. This SERS technique may be extended to discover a novel avenue to improve and develop SERS-based chemical sensing in various conditions.

Supplementary Materials

The following are available online at https://www.mdpi.com/article/10.3390/pr9050794/s1.

Author Contributions

Conceptualization, H.-M.C.; Formal analysis, Y.-Y.C., C.-H.L., G.-T.J. and Y.-W.C.; Funding acquisition, H.-M.C.; Investigation, Sripansuang Tangsuwanjinda; Methodology, H.-M.C.; Project administration, H.-M.C.; Writing—original draft, S.T.; Writing—review & editing, H.-M.C. All authors have read and agreed to the published version of the manuscript.

Funding

This research was funded by Ministry of Science and Technology, Taiwan. Grant number is MOST 109-2112-M-131-001.

Institutional Review Board Statement

Not applicable.

Informed Consent Statement

Not applicable.

Data Availability Statement

The data presented in this study are available on request from the corresponding author.

Acknowledgments

The authors acknowledge the financial support from the Ministry of Science and Technology (Grant Nos. MOST 109-2112-M-131-001). In addition, we are thankful for the assistances of the silver-coating technique from Sajal Birin and Rahul Ram Panjalingam, and the Raman analysis skill from Jeng-Shiung Chen (Yottadeft Optoelectronics Technology Co., Ltd.) isalso appreciated.

Conflicts of Interest

The authors declare no conflict of interest.

References

  1. Barakat, M.A. New trends in removing heavy metals from industrial wastewater. Arab. J. Chem. 2011, 4, 361–377. [Google Scholar] [CrossRef] [Green Version]
  2. Nriagu, J.O. Global inventory of natural and anthropogenic emissions of trace metals to the atmosphere. Nature 1979, 279, 409–411. [Google Scholar] [CrossRef]
  3. Nolan, E.M.; Lippard, S.J. Tools and tactics for the optical detection of mercuric ion. Chem. Rev. 2008, 108, 3443–3480. [Google Scholar] [CrossRef]
  4. Clevenger, W.L.; Smith, B.W.; Winefordner, J.D. Critical Reviews in Analytical Chemistry Trace Determination of Mercury: A Review. Crit. Rev. Anal. Chem. 1997, 27, 1–26. [Google Scholar] [CrossRef]
  5. Song, C.; Yang, B.; Yang, Y.; Wang, L. SERS-based mercury ion detections: Principles, strategies and recent advances. Sci. China Chem. 2016, 59, 16–29. [Google Scholar] [CrossRef]
  6. Khani, H.; Rofouei, M.K.; Arab, P.; Gupta, V.K.; Vafaei, Z. Multi-walled carbon nanotubes-ionic liquid-carbon paste electrode as a super selectivity sensor: Application to potentiometric monitoring of mercury ion(II). J. Hazard. Mater. 2010, 183, 402–409. [Google Scholar] [CrossRef]
  7. Freeman, R.; Finder, T.; Willner, I. Multiplexed analysis of Hg2+ and Ag+ ions by nucleic acid functionalized CdSe/ZnS quantum dots and their use for logic gate operations. Angew. Chem. Int. Ed. 2009, 48, 7818–7821. [Google Scholar] [CrossRef] [PubMed]
  8. Lee, J.S.; Han, M.S.; Mirkin, C.A. Colorimetric detection of mercuric ion (Hg2+) in aqueous media using DNA-functionalized gold nanoparticles. Angew. Chem. Int. Ed. 2007, 46, 4093–4096. [Google Scholar] [CrossRef]
  9. Li, Y.; Wu, P.; Xu, H.; Zhang, Z.; Zhong, X. Highly selective and sensitive visualizable detection of Hg2+ based on anti-aggregation of gold nanoparticles. Talanta 2011, 84, 508–512. [Google Scholar] [CrossRef] [PubMed]
  10. Yang, Y.K.; Yook, K.J.; Tae, J. A rhodamine-based fluorescent and colorimetric chemodosimeter for the rapid detection of Hg2+ ions in aqueous media. J. Am. Chem. Soc. 2005, 127, 16760–16761. [Google Scholar] [CrossRef]
  11. Smith, W.E. Practical understanding and use of surface enhanced Raman scattering/surface enhanced resonance Raman scattering in chemical and biological analysis. Chem. Soc. Rev. 2008, 37, 955–964. [Google Scholar] [CrossRef]
  12. Liu, R.; Liu, B.; Guan, G.; Jiang, C.; Zhang, Z. Multilayered shell SERS nanotags with a highly uniform single-particle Raman readout for ultrasensitive immunoassays. Chem. Commun. 2012, 48, 9421–9423. [Google Scholar] [CrossRef]
  13. Jeanmaire, D.L.; Duyne, R.P. VAN Surface Raman Spectroelectrochemistry Part1. Heterocyclic. J. Electroanal. Chem. 1977, 84, 1–20. [Google Scholar] [CrossRef]
  14. Pieczonka, N.P.W.; Aroca, R.F. Single molecule analysis by surfaced-enhanced Raman scattering. Chem. Soc. Rev. 2008, 37, 946–954. [Google Scholar] [CrossRef]
  15. Kang, T.; Yoo, S.M.; Kang, M.; Lee, H.; Kim, H.; Lee, S.Y.; Kim, B. Single-step multiplex detection of toxic metal ions by Au nanowires-on-chip sensor using reporter elimination. Lab Chip 2012, 12, 3077–3081. [Google Scholar] [CrossRef] [PubMed]
  16. Han, D.; Lim, S.Y.; Kim, B.J.; Piao, L.; Chung, T.D. Mercury(ii) detection by SERS based on a single gold microshell. Chem. Commun. 2010, 46, 5587–5589. [Google Scholar] [CrossRef]
  17. Kang, T.; Yoo, D.S.M.; Yoon, D.I.; Lee, S.; Choo, P.J.; Lee, S.Y.; Kim, P.B. Au Nanowire-on-Film SERRS Sensor for Ultrasensitive Hg2+ Detection. Chem. A Eur. J. 2011, 17, 2211–2214. [Google Scholar] [CrossRef] [PubMed]
  18. Duan, J.; Yang, M.; Lai, Y.; Yuan, J.; Zhan, J. A colorimetric and surface-enhanced Raman scattering dual-signal sensor for Hg2+ based on Bismuthiol II-capped gold nanoparticles. Anal. Chim. Acta 2012, 723, 88–93. [Google Scholar] [CrossRef] [PubMed]
  19. Li, F.; Wang, J.; Lai, Y.; Wu, C.; Sun, S.; He, Y.; Ma, H. Ultrasensitive and selective detection of copper (II) and mercury (II) ions by dye-coded silver nanoparticle-based SERS probes. Biosens. Bioelectron. 2013, 39, 82–87. [Google Scholar] [CrossRef]
  20. Grasseschi, D.; Zamarion, V.M.; Araki, K.; Toma, H.E. Surface enhanced Raman scattering spot tests: A new insight on Feigl’s analysis using gold nanoparticles. Anal. Chem. 2010, 82, 9146–9149. [Google Scholar] [CrossRef] [PubMed]
  21. Yin, X.; Liu, X.; Wang, L.; Liu, B. Electrophoretic deposition of ZnO photoanode for plastic dye-sensitized solar cells. Electrochem. Commun. 2010, 12, 1241–1244. [Google Scholar] [CrossRef]
  22. Kathalingam, A.; Marimuthu, K.P.; Karuppasamy, K.; Chae, Y.S.; Lee, H.; Park, H.C.; Kim, H.S. Structural and Mechanical Characterization of Platinum Thin Films Prepared Electrochemically on ITO/Glass Substrate. Met. Mater. Int. 2019. [Google Scholar] [CrossRef]
  23. Wang, H.H.; Liu, C.Y.; Wu, S.B.; Liu, N.W.; Peng, C.Y.; Chan, T.H.; Hsu, C.F.; Wang, J.K.; Wang, Y.L. Highly raman-enhancing substrates based on silver nanoparticle arrays with tunable sub-10 nm gaps. Adv. Mater. 2006, 18, 491–495. [Google Scholar] [CrossRef]
  24. Sun, S.; Jiao, S.; Zhang, K.; Wang, D.; Li, H.; Gao, S.; Wang, J.; Yu, Q.; Guo, F.; Zhao, L.; et al. Morphology and properties of ZnO nanostructures by electrochemical deposition: Effect of the substrate treatment. J. Mater. Sci. Mater. Electron. 2013, 24, 85–88. [Google Scholar] [CrossRef]
  25. Zak, A.K.; Majid, W.H.A.; Abrishami, M.E.; Yousefi, R. X-ray analysis of ZnO nanoparticles by WilliamsoneHall and sizeestrain plot methods. Solid State Sci. 2011, 13, 251–256. [Google Scholar] [CrossRef]
  26. Dehimi, M.; Touam, T.; Chelouche, A.; Boudjouan, F.; Djouadi, D.; Solard, J.; Fischer, A.; Boudrioua, A.; Doghmane, A. Effects of low Ag doping on physical and optical waveguide properties of highly oriented sol-gel zno thin films. Adv. Condens. Matter Phys. 2015, 2015. [Google Scholar] [CrossRef] [Green Version]
  27. Yan, B.; Sun, K.; Chao, K.; Alharbi, N.S.; Li, J.; Huang, Q. Fabrication of a Novel Transparent SERS Substrate Comprised of Ag-nanoparticle Arrays and its Application in Rapid Detection of Ractopamine on Meat. Food Anal. Methods 2018, 11, 2329–2335. [Google Scholar] [CrossRef]
  28. Yan, X.; Li, P.; Zhou, B.; Tang, X.; Li, X.; Weng, S.; Yang, L.; Liu, J. Optimal Hotspots of Dynamic Surfaced-Enhanced Raman Spectroscopy for Drugs Quantitative Detection. Anal. Chem. 2017, 89, 4875–4881. [Google Scholar] [CrossRef]
  29. Zhong, F.; Wu, Z.; Guo, J.; Silicon, D.J.P. Photonic Crystals Coated with AgNanoparticles as Efficient Substrates for DetectingTrace Explosives Using SERS. Nanomaterials 2018, 8, 872. [Google Scholar] [CrossRef] [Green Version]
  30. Cheng, J.; Li, X.; Song, W.; Xu, W.; Zhao, B.; Zhang, G. Vibrational spectroscopy and density functional theory study on 1,4-bis[2-(4-pyridyl) ethenyl]-benzene. Chem. Phys. Lett. 2005, 405, 344–351. [Google Scholar] [CrossRef]
  31. Zhuang, Z.; Ruan, W.; Ji, N.; Shang, X.; Wang, X.; Zhao, B. Surface-enhanced Raman scattering of 4,4′-bipyridine on silver by density functional theory calculations. Vib. Spectrosc. 2009, 49, 118–123. [Google Scholar] [CrossRef]
  32. Wei, H.; Xu, H. Hot spots in different metal nanostructures for plasmon-enhanced Raman spectroscopy. Nanoscale 2013, 5, 10794–10805. [Google Scholar] [CrossRef]
  33. Zhuang, Z.; Cheng, J.; Wang, X.; Zhao, B.; Han, X.; Luo, Y. Surface-enhanced Raman spectroscopy and density functional theory study on 4,4′-bipyridine molecule. Spectrochim. Acta Part. A Mol. Biomol. Spectrosc. 2007, 67, 509–516. [Google Scholar] [CrossRef] [PubMed]
  34. Du, Y.; Liu, R.; Liu, B.; Wang, S.; Han, M.Y.; Zhang, Z. Surface-enhanced raman scattering chip for femtomolar detection of mercuric ion (II) by ligand exchange. Anal. Chem. 2013, 85, 3160–3165. [Google Scholar] [CrossRef] [PubMed]
  35. Morsali, A.; Zhu, L.G. (4,4′-bipyridine)mercury(II) coordination polymers, syntheses, and structures. Helv. Chim. Acta 2006, 89, 81–93. [Google Scholar] [CrossRef]
  36. Pal, A.K.; Chandra, G.K.; Umapathy, S.; Bharathi Mohan, D. Ultra-sensitive, reusable, and superhydrophobic Ag/ZnO/Ag 3D hybrid surface enhanced Raman scattering substrate for hemoglobin detection. J. Appl. Phys. 2020, 127. [Google Scholar] [CrossRef]
  37. Zhao, X.; Zhang, W.; Peng, C.; Liang, Y.; Wang, W. Sensitive surface-enhanced Raman scattering of TiO2/Ag nanowires induced by photogenerated charge transfer. J. Colloid Interface Sci. 2017, 507, 370–377. [Google Scholar] [CrossRef] [PubMed]
  38. Villani, M.; Calestani, D.; Lazzarini, L.; Zanotti, L.; Mosca, R.; Zappettini, A. Extended functionality of ZnO nanotetrapods by solution-based coupling with CdS nanoparticles. J. Mater. Chem. 2012, 22, 5694–5699. [Google Scholar] [CrossRef]
  39. Hou, S.; Zhang, J.; Li, R.; Ning, J.; Han, R.; Shen, Z.; Zhao, X.; Xue, Z.; Wu, Q. First-principles calculation of the conductance of a single 4,4 bipyridine molecule. Nanotechnology 2005, 16, 239–244. [Google Scholar] [CrossRef]
  40. Tang, H.; Meng, G.; Huang, Q.; Zhang, Z.; Huang, Z.; Zhu, C. Arrays of Cone-Shaped ZnO Nanorods Decorated with Ag Nanoparticles as 3D Surface-Enhanced Raman Scattering Substrates for Rapid Detection of Trace Polychlorinated Biphenyls. Adv.Fun. Mater. 2012, 22, 218–224. [Google Scholar] [CrossRef]
  41. Yang, L.; Jiang, X.; Ruan, W.; Zhao, B.; Xu, W.; Lombardi, J.R. Observation of Enhanced Raman Scattering for Molecules Adsorbed on TiO2 Nanoparticles: Charge-Transfer Contribution. J. Phys. Chem. C 2008, 112, 20095–20098. [Google Scholar] [CrossRef]
  42. Jiang, X.; Sun, X.; Yin, D.; Li, X.; Yang, M.; Han, X.; Yang, L.; Zhao, B. Recyclable Au–TiO2 nanocomposite SERS-active substrates contributed by synergistic charge-transfer effect. Phys. Chem. Chem. Phys. 2017, 19, 11212–11219. [Google Scholar] [CrossRef] [PubMed]
  43. Djurišić, A.B.; Leung, Y.H.; Tam, K.H. Green, yellow, and orange defect emission from ZnO nanostructures: Influence of excitation wavelength. Appl. Phys. Lett. 2006, 88, 103107. [Google Scholar] [CrossRef] [Green Version]
Scheme 1. The visual image of electrodecoration process for decorating silver on zinc-oxide tetrapod nanoparticles.
Processes 09 00794 sch001
Figure 1. (a) The X-ray diffractions (XRD) patterns of ZnO tetrapod nanoparticles deposited on FTO by electrophoretic process, and (b) the Rietveld refinement analyses of Ag@ZnO nanoparticles.
Processes 09 00794 g001
Figure 2. The FE-SEM image, EDS mapping, and EDS curve of the SERS chip (ac) before decorating the silver nanoparticles, and (df) after decorating the silver nanoparticles on the surface of zinc oxide.
Processes 09 00794 g002
Figure 3. The quality check for Ag@ZnO. (a) TEM image of Ag@ZnO nanoparticles, (b) HRTEM image of single Ag binding on ZnO, and (c) the EDS spectrum of a sample decorated at 19 periods.
Processes 09 00794 g003
Figure 4. (a) SERS spectra of DPy in colloidal Ag@ZnO with increased amount of DPy. (b) The increasing of the SERS intensity of different concentrations of DPy solution.
Processes 09 00794 g004
Figure 5. (a) The evaluation of SERS intensities of DPy (6.3 × 10⁻⁴) in colloidal Ag@ZnO with the increasing of Hg2+ concentration from 5 × 10⁻¹⁵ to 5 × 10⁻¹⁰ M, and (b) the polynomial potting of SERS intensity at a position of 1298 cm−1 in a different concentration.
Processes 09 00794 g005
Figure 6. (a) Tap water, (b) pond water, and (c) milk used as solvents to verify the response of different concentrations of Hg2+ to the signal of Ag@ZnO-FTO SERS chip.
Processes 09 00794 g006
Figure 7. Selective evaluation of SERS chip with respect to other metal ions except Hg2+. The SERS intensity at the peak of 1298 cm−1 was used to evaluate the SERS intensity.
Processes 09 00794 g007
Figure 8. The cyclic detection of DPy from Raman spectra at 1295 cm−1 by adding alternately 10 mL of 5 × 10⁻¹⁰ M Hg2+ solution and DPy 6.4 × 10⁻⁵ M onto the Ag@ZnO SERS chip and then modifying with 6.4 × 10⁻⁵ M DPy.
Processes 09 00794 g008
Figure 9. (a) J-t curve of the pure ZnO and Ag@ZnO nanostructure under visible light illumination (λ > 420 nm) with Ag/AgCl as the electrode and Pt as the counter probe. (b) The possible charge transfer process of ZnO/Ag/DPy tetrapod nanoparticles/nanoparticles/molecules structure.
Processes 09 00794 g009
Table 1. Present structure parameters for ZnO tetrapod nanoparticles calculated by Rietveld refinement of the XRD experiment results.
Element ZnO
Space Group P63 mc (186)
Lattice parameters a (Å)3.25
b (Å)3.25
c (Å)5.21
Element parametersZnx0.33
y0.67
z20.69
Ox0.33
y0.67
z21.08
Lattice symbol hP
Publisher’s Note: MDPI stays neutral with regard to jurisdictional claims in published maps and institutional affiliations.

