


1. Introduction
The melting of the Scandinavian ice sheet since the end of the last glaciation has caused a rapid relative sea-level (RSL) rise and, consequently, a continuous landward displacement of the coast within the North Sea basin. With the deceleration of the RSL rise during the mid-Holocene, alternating marine siliciclastic sediments and peat beds were deposited, documenting retrogradational and progradational shifts of the mainland coastline. This sediment succession is characteristic for the Holocene of the central Wadden Sea (Streif, Reference Streif1990a, Reference Streif2004; Behre, Reference Behre2007). Several controlling factors have been defined to describe the geological record of the coastal zone, mainly the (RSL rise, sediment supply, accommodation space and the morphology of the pre-Holocene land surface (e.g. van der Spek, Reference van der Spek1996; Baeteman, Reference Baeteman2005, Reference Baeteman2008). Additionally, morphological features such as embayments and estuarine river mouths amplify the tidal range and the height of storm surges. Differential sediment and peat compaction also significantly influences the long-term development of the coastal wetlands (Vos & van Kesteren, Reference Vos and van Kesteren2000).
During the late Holocene, human activities such as diking, drainage, and river regulations have greatly influenced the accommodation space due to peat compaction on local and regional scales. Moreover, landscape evolution and the occupation history of the coastal zone are directly related. In coastal marshes, human occupation is closely linked to changes in regional water levels and the location of waterways. Accordingly, settlement patterns provide information on local shifts of the coastline and the channel network. The availability of palaeogeographical reconstructions is of major importance for interpreting the cultural history archived in archaeological sites and find areas (Behre, Reference Behre1999; Jöns et al., Reference Jöns, Karle and Kleingärtner2013; Flemming et al., Reference Flemming, Çağatay, Chiocci, Galanidou, Lericolais, Jöns, Missiaen, Moore, Rosentau, Sakellariou, Skar, Stevenson, Weerts, Chu and McDonough2014; Goldhammer & Karle, Reference Goldhammer and Karle2015; Vos et al., Reference Vos, van der Meulen, Weerts and Bazelmans2020). Potential areas of human occupation where corresponding remains may be found today can be identified by means of palaeogeographical reconstructions, i.e. the creation of palaeogeographical maps based on a combination of geological mapping, dating and palaeoenvironmental research (e.g. Schmölcke et al., Reference Schmölcke, Endtmann, Klooss, Meyer, Michaelis and Rickert2006; Bailey & King, Reference Bailey and King2011; Peeters, Reference Peeters, Benjamin, Bonsall, Pickard and Fischer2011; Tizzard et al., Reference Tizzard, Baggaley, Firth, Benjamin, Bonsall, Pickard and Fischer2011; Goldhammer & Karle, Reference Goldhammer and Karle2015; Karle & Goldhammer, Reference Karle and Goldhammer2017). For the East Frisian peninsula several approaches have been adopted to generate palaeogeographical maps. However, all these maps are restricted to local scales (Barckhausen, Reference Barckhausen1969) or to only the last 2500 years (e.g. Homeier, Reference Homeier1964, Reference Homeier1969; Behre, Reference Behre1999; Vos & Knol, Reference Vos and Knol2015). For the Netherlands Vos et al. (Reference Vos, van der Meulen, Weerts and Bazelmans2020) recently published palaeogeographical maps from 11,000 cal BP onwards for 12 time slices based on the Pleistocene surface, geological and soil mapping studies, historical maps, lidar data and archaeological key sites. For the late Holocene of the Netherlands Pierik et al. (Reference Pierik, Cohen and Stouthamer2016) used a new GIS approach that involved unifying different map types and integrating architectural features for an even more precise reconstruction of the palaeogeography.
This study uses sedimentological core data, geological maps and Holocene sea-level data to (i) reconstruct the sedimentary response during the Holocene RSL rise along the entire East Frisian peninsula in four time intervals. We then (ii) visualise the impact of geological preconditions on the dynamics of inundation and coastal landscape changes across three cross-sections in different regional settings, which focus on the marine–terrestrial transition zone characterised by coastal marshes and adjacent tidal flats where we expect to obtain a better sedimentary record due to the significantly lower tidal reworking than in more seaward regions. In addition, three age–depth diagrams are analysed and discussed to (iii) demonstrate spatial and chronological differences in regressive phases of different tidal basins of the same coastal region.
This will fill existing gaps in knowledge about Holocene palaeogeographies along the East Frisian peninsula, both on a temporal and a spatial scale, as well as with regard to the settlement history of this dynamic landscape.
2. Regional setting
The Wadden Sea region includes coastal marshes and barrier islands (Fig. 1) which can, besides their geological evolution, be characterised (i) by their specific resilience capacity, i.e. their state of equilibrium with respect to RSL, tidal amplitude and single events, and (ii) as habitats with different characteristics and the potential for human settlement and land use during different time periods of the Holocene. Before dike building, the central Wadden Sea coast was characterised by a wide marine–terrestrial transition zone providing the landscape with the capacity to adapt to changes of creation of accommodation space and sediment supply during RSL rise.
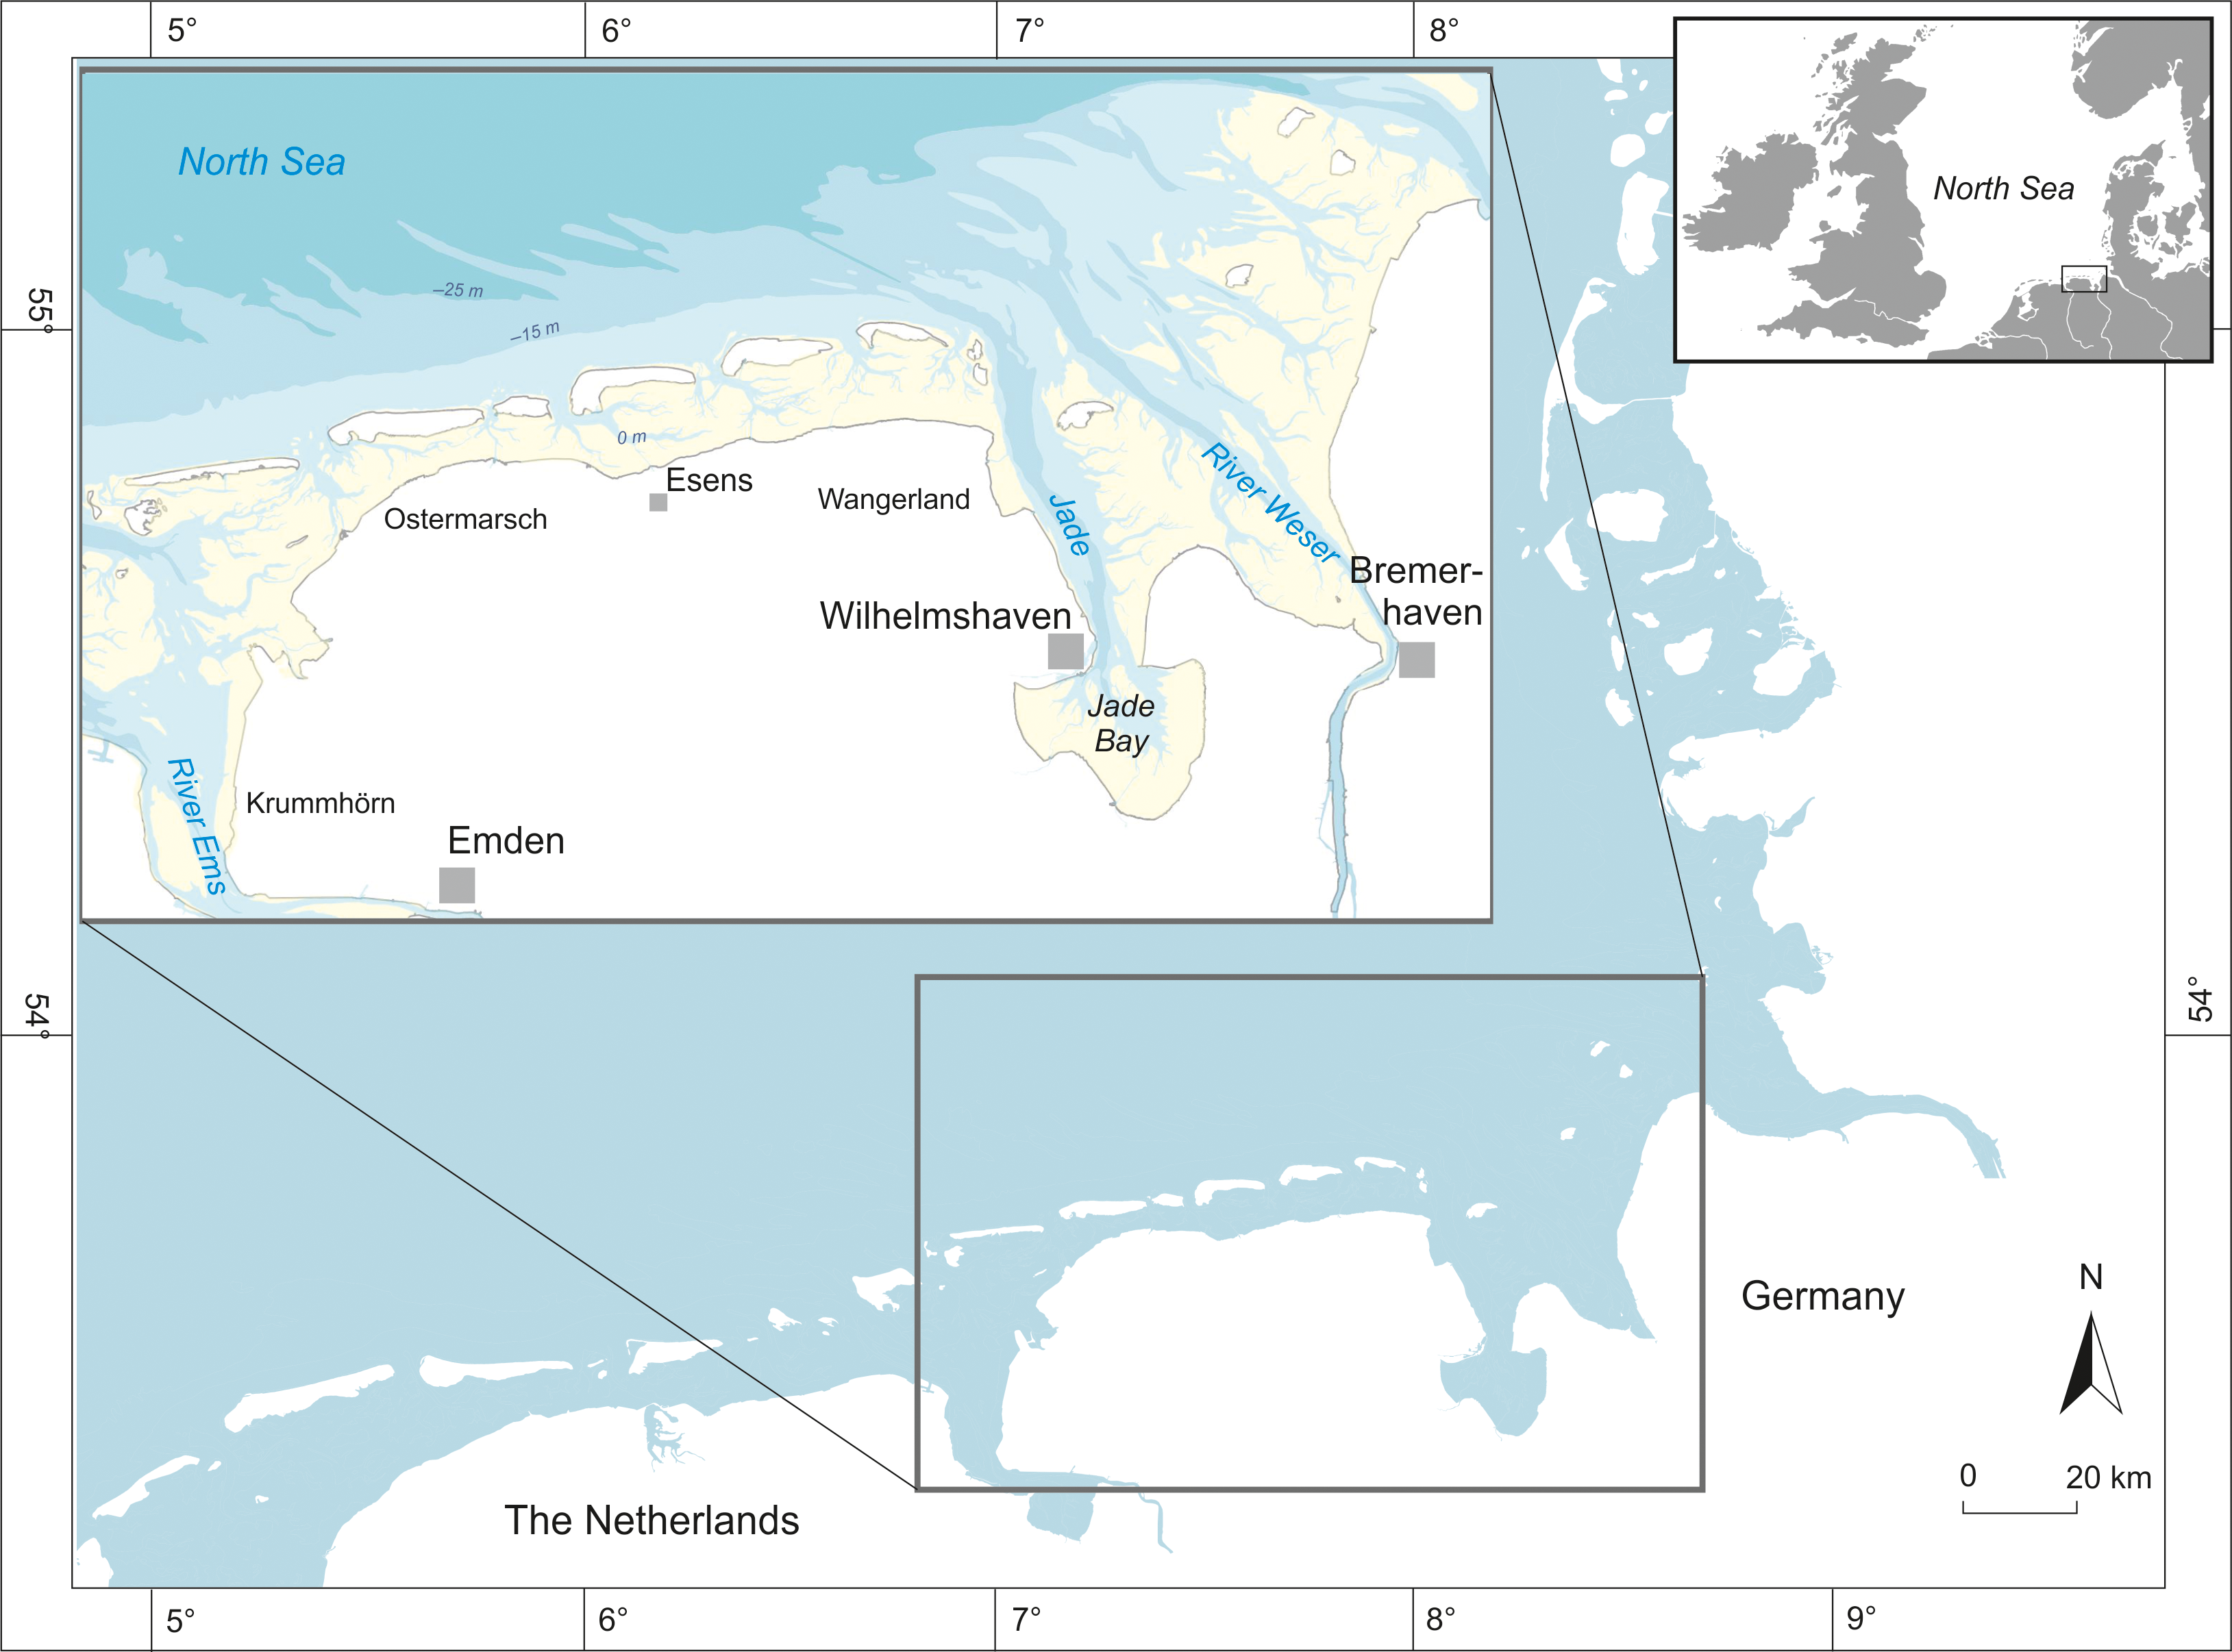
Figure 1. Map showing the location of the study area in the central Wadden Sea of the southern North Sea. A continuous dike line decouples the mainland from the present-day tidal environment (yellow = intertidal flats, blue = shallow subtidal). Coordinate system WGS 84/UTM zone 32 (EPSG 32632).
2.1. Pre-Holocene morphology
Deposits from the last two glacial, and their respective interglacial, periods are documented in the studied cores. However, since most research focused on the Holocene or the Holocene/Pleistocene boundary, the majority of the cores ended in compact Weichselian periglacial sands directly underlying the Holocene sedimentary sequence.
During the Weichselian period the southern North Sea region was influenced by periglacial conditions under a polar climate (Streif, Reference Streif1990a), resulting in the accumulation of aeolian and periglacial fluvial deposits. The latter are restricted to the channel systems of the East Frisian peninsula, where they reach a thickness of several metres (Barckhausen & Streif, Reference Barckhausen and Streif1978; Streif, Reference Streif1990a). Outcrops of Pleistocene deposits along this ridge-like peninsula occur above 2 m NHN (German Normal Height Zero: corresponds approximately to the mean sea level). Beneath this level, the outcrops are covered by Holocene coastal deposits. In general, the ridge is dipping northward under the present-day tidal flats and barrier islands. Further offshore, the continuation of the Pleistocene surface is only poorly defined. Locally, the Pleistocene base is steeply sloping under marine deposits north of the islands due to Holocene marine erosion (Streif, Reference Streif1990a). In the more landward region between the islands and the Pleistocene outcrops, the pre-Holocene base shows an irregular morphology, shaped by the drainage systems of numerous rivers and their tributaries draining the East Frisian peninsula (Fig. 2). Within the large palaeovalleys of the rivers Ems, Jade and Weser, the geological boundary between Pleistocene and Holocene deposits varies between 15 and 35 m below NHN (Streif, Reference Streif2004). In the areas in between, this boundary ís generally found between −4 and −15 m NHN. Here, the Pleistocene–Holocene contact is widely identical to the late Pleistocene surface. Fossil podsolic soil horizons which often cover the Pleistocene deposits indicate the occurrence of pedogenetic processes during the Late Pleistocene or early Holocene. Additionally, widely occurring basal peat proves the low erosional energy of the subsequent marine transgression. Within the palaeovalleys and closer to the islands the surface was often reworked by tidal erosion, so that the geological boundary is not easy to define.

2.2. Coastal palaeoenvironments: sedimentary record and depositional processes
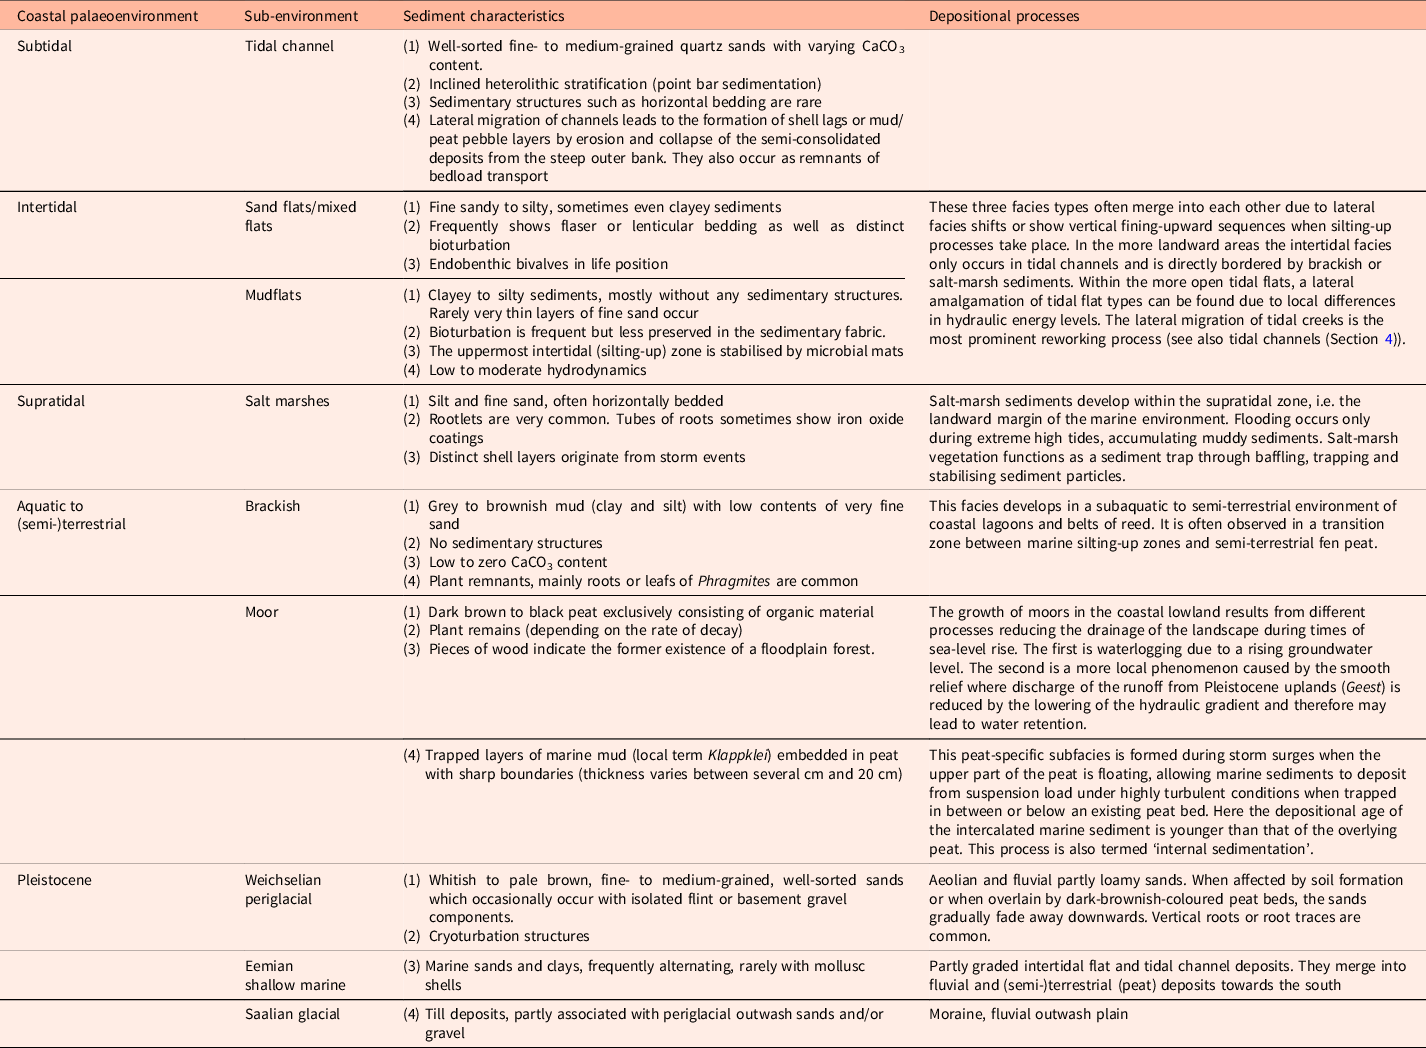
The East Frisian Island chain and its associated sheltered back-barrier tidal flats and salt marshes were formed when postglacial sea-level rise decelerated ˜7–6 ka BP. Several local shifts of the coastline occurred during the sea-level rise. This resulted in the lateral interlocking of different coastal environments (Table 1) characterised by peat formation, brackish–lagoonal deposits, salt marshes, and intertidal flats with tidal channels (Streif, Reference Streif1990a; van der Spek, Reference van der Spek1996; Vos & van Kesteren, Reference Vos and van Kesteren2000; Bungenstock & Schäfer, Reference Bungenstock and Schäfer2009; Karle et al., Reference Karle, Frechen and Wehrmann2017; Elschner et al., Reference Elschner, Scheder, Bungenstock, Bartholomä, Becker, Capperucci, Enters, Karle, Schlütz, Wehrmann and Hoffmann2021).
Table 1. Late Pleistocene to Holocene coastal palaeoenvironment of the central Wadden Sea, their sedimentary characteristics, and processes under which they were deposited (modified after Streif, Reference Streif1990a; van der Spek, Reference van der Spek1996; Chang et al., Reference Chang, Flemming, Tilch, Bartholomä and Wöstmann2006; Karle et al. Reference Karle, Frechen and Wehrmann2017)
2.3. Holocene relative sea-level rise
The sedimentary record of the present-day Wadden Sea area and the coastal marshland is directly related to the Holocene RSL rise. After the Last Glacial Maximum the main phase of deglaciation and the consequent eustatic sea-level rise started occurring from ˜16.5 ka BP as a consequence of the melting of the Fennoscandian and Laurentide ice sheets (e.g. Streif, Reference Streif2004; Lambeck et al., Reference Lambeck, Rouby, Purcell, Sun and Sambridge2014). Eustasy, as well as the glacio-isostatic adjustment, led to a sea-level rise of 110 to 130 m until today, resulting in a southward shift of the North Sea coast of about 600 km until today (e.g. Jelgersma, Reference Jelgersma1961, Reference Jelgersma1979; Streif, Reference Streif, Brosche and Sundermann1990b, Reference Streif2004; Flemming, Reference Flemming, Wefer, Berger, Behre and Jansen2002; Kiden et al., Reference Kiden, Denys and Johnston2002; Behre, Reference Behre2007). Trend curves for the Holocene RSL in Northwest Germany were given by Freund & Streif (Reference Freund and Streif1999), Freund et al. (Reference Freund, Gerdes, Streif, Dellwig and Watermann2004), Streif (Reference Streif2004), Behre (Reference Behre2007)and Vink et al. (Reference Vink, Steffen, Reinhardt and Kaufmann2007). The rate of RSL rise during the Holocene varied. After Streif (Reference Streif2004), the RSL rise amounted to around 0.75 m per century between 18,000 and 10,250 BP, accelerated to ˜1.5 m per century between 10,250 and 6500 BP (Streif, Reference Streif2004) and has decreased to 0.2 m since then (Vink et al., Reference Vink, Steffen, Reinhardt and Kaufmann2007). For the last 2000 years, an average rate of only 0.05 m per century can be assumed (van der Spek, Reference van der Spek1996). For this study we combined and referred to Freund et al. (Reference Freund, Gerdes, Streif, Dellwig and Watermann2004) and Vink et al. (Reference Vink, Steffen, Reinhardt and Kaufmann2007), as these studies provided the most recent RSL curves for Northwestern Germany based on geoscientific data covering the timespan from around 8000 cal BP until the present (Fig. 3).

Figure 3. Holocene mean sea level (MSL) from error bands for Northwest Germany, modified from Vink et al. (Reference Vink, Steffen, Reinhardt and Kaufmann2007) and Freund et al. (Reference Freund, Gerdes, Streif, Dellwig and Watermann2004), referring to local mean high water and/or the upper limit of the MSL.
2.4. Tidal range
Today, the tidal range varies between 3.5 m in the Ems estuary, 4 m in the Jade Bay and 2.3 to 3.0 m in the back-barrier tidal flats (BSH, 2020). However, research on changing tidal range during the Holocene RSL rise in the southern North Sea has consistently shown an increase in the tidal range since the early Holocene. While the major changes occurred prior to 6000 cal BP, only minor changes (dm-scale) have occurred subsequently during the middle and late Holocene (Franken, Reference Franken1987; Shennan et al., Reference Shennan, Lambeck, Flather, Horton, McArthur, Innes, Lloyd, Rutherford, Wingfield, Shennan and Andrews2000; van der Molen & de Swart, Reference van der Molen and de Swart2001).
2.5. Distortion due to compaction
Compaction, as a combined effect of autocompaction and compression by overlying sediments, has a major influence on fine-grained lithoclastic sediments and an even greater one on peat deposits. Autocompaction may increase the sedimentation rate often considerably above the rate at which accommodation space is created by sea-level rise (Long et al., Reference Long, Waller and Stupples2006). Rates of compaction are difficult to quantify, especially because these have been continuous over the whole Holocene time period (e.g. Baeteman, Reference Baeteman1994; Pizzuto & Schwendt, Reference Pizzuto and Schwendt1997; Schmedemann et al., Reference Schmedemann, Schafmeister and Hoffmann2006; Brain et al., Reference Brain, Long, Woodroffe, Petley, Milledge and Parnell2012), and therefore sediment compaction complicates the reconstruction of the morphology of a former land surface. For example, the preserved thickness of peat horizons may comprise only 10–20% of their original thickness (Kaye & Barghoorn, Reference Kaye and Barghoorn1964; Weerts, Reference Weerts1996; Long et al., Reference Long, Waller and Stupples2006). Also, the fine-grained siliciclastic deposits in the Holocene geological record are subject to continuous compaction (Paul & Barras, Reference Paul and Barras1998; Allen, Reference Allen1999, Reference Allen, Pye and Allen2000). Consequently, the correlation of core data can be misleading as altitude–age relationships prevailing at deposition are subsequently lost. A profile section in the area of Woltzeten in the western part of the East Frisian peninsula shows a peat layer varying by up to 2 m in depth within a 200 m distance due to a sandy lens occurring in the underground (Streif, Reference Streif1971; Barckhausen & Streif, Reference Barckhausen and Streif1978; Preuss, Reference Preuss1979). Similar rates of vertical displacement are shown for peat layers as well as for a Bronze Age settlement layer for the Weser marshes in Rodenkirchen (Bungenstock, Reference Bungenstock2008). Variations in the elevation of peat beds between 2 and 5 m in the study area have been reported by Streif (Reference Streif1972), Barckhausen & Streif (Reference Barckhausen and Streif1978) and Preuss (Reference Preuss1979). Since the construction of a continuous dike line along the East Frisian coast from the 13th century onwards the development of the tidal flats and adjacent salt marshes has been subjected to intense human influences. The drainage of coastal marshland by humans has had a major effect on the lowering of the surface level of the marshes, making the reconstruction of rates of compaction even more unpredictable (Allen, Reference Allen, Pye and Allen2000).
3. Database and methods
The Holocene deposits along the East Frisian coast have been extensively investigated since the 1960s. Geological mapping as well as sea-level research has been carried out, resulting in a large database of core descriptions and thematic maps. Therefore, the regional Holocene coastal development presented here is based on those geological archive data, historical maps and literature (Barckhausen et al., Reference Barckhausen, Preuss and Streif1977; Streif, Reference Streif1979, Reference Streif1990a,b; Flemming & Davis, Reference Flemming and Davis1994; Freund et al., Reference Freund, Gerdes, Streif, Dellwig and Watermann2004; Chang et al., Reference Chang, Flemming, Tilch, Bartholomä and Wöstmann2006; Behre, Reference Behre2007; NIBIS® Map Server, 2014). The approach applied in this study aims to combine stratigraphical, sedimentological and radiocarbon data together with the contour maps of the Pleistocene surface and the sequence maps of Holocene deposits as well as historical maps. The available data were connected and interpreted in terms of the spatial evolution of different sedimentary environments of the coastal zone.
3.1. Core data
The Authority for Mining, Energy and Geology (Landesamt für Bergbau, Energie und Geologie – LBEG) provided core data stemming from a variety of geoscientific fields via the NIBIS® Map Server (2014). This information forms a very extensive, but also a heterogeneous, dataset. Within the coastal marshes and the Wadden Sea of Lower Saxony over which 30,000 sediment cores were documented, about 3000 of these were from the intertidal area of the Wadden Sea and the barrier islands, c.1200 of them reaching the Pleistocene–Holocene boundary (Fig. 4). These data have been inherited from both regular geological research and from applied geotechnical coring activities. Therefore, the quality and contents of the core data differ widely and data need to be evaluated regarding their significance for identifying depositional environments. Since most archive cores were extracted for engineering purposes, facies interpretation is an uncommon issue for a large part of the core data. Wherever possible, information on sedimentary structures and macrofossils, deposits such as peat, and marine/brackish siliciclastic and organic-rich sediments was used for an environmental classification.

Figure 4. Core locations in the study area provided by the Authority for Mining, Energy and Geology (Landesamt für Bergbau, Energie und Geologie – LBEG).
Three cross-sections are presented here as examples of different coastal regions. However, the processes discussed below include numerous cross-sections that have been published previously (Streif, Reference Streif1990a, Reference Streif2004).
Cross-sections presented in Figures 2 and (further below) 6–8 show the change of the tidal basin’s architecture and facies distribution. The cross-sections are mainly restricted to the areas landward of the dikes, to depict the complete Holocene succession not affected by tidal reworking and erosion due to enhanced hydrodynamics after dike building (cf. Fig. 7 further below; van der Spek, Reference van der Spek1996).
The radiocarbon dates referred to in this study are stored within the LBEG core database. They are associated with sediment cores from mainly three regions along the East Frisian coast with a total number of 206 radiocarbon datings (Fig. 2; see also table in the Supplementary Material available online at https://doi.org/10.1017/njg.2021.10).
3.2. Map of pre-Holocene surface
A contour map in 2 m intervals relative to NHN of the top of pre-Holocene deposits reflects the pre-transgression morphology of the Holocene sedimentary basin (Streif, Reference Streif1998), primarily shaped by late- and postglacial drainage patterns (see Fig. 2). The relief shows height differences of up to 28 m in the present-day coastal zone, naturally with maximum values in channels, thinning out to the southern Pleistocene uplands (Geest). This map is not representative of the topographic situation at the end of the Pleistocene. It instead displays the actual state of the relief of the stratigraphic boundary between the Pleistocene and Holocene epochs (Schaumann et al., Reference Schaumann, Capperucci, Bungenstock, McCann, Enters, Wehrmann and Bartholomä2021). For the early Holocene the pre-Holocene morphology is crucial for the expansion of marine conditions. It has to be considered that middle to late Holocene marine erosional processes might have changed the level of the pre-Holocene surface.
3.3. Sequence map of Holocene deposits
For general information on facies successions, the lateral distribution map of different stratigraphic profile types (generally called sequence maps; Baeteman, Reference Baeteman2005) by Streif (Reference Streif1998) is used (Fig. 5). Barckhausen et al. (Reference Barckhausen, Preuss and Streif1977), Streif (Reference Streif1979, Reference Streif1998) and Hoselmann & Streif (Reference Hoselmann and Streif2004) proposed a classification system for mapping the coastal plain deposits based on comprehensive data analyses. The Holocene sediments are subdivided according to a hierarchical system based on the vertical succession and lateral interfingering of siliciclastic sediments and peat deposits. This classification system clearly reflects the depositional history of the Holocene coastal plain deposits in relation to the rate of relative sea-level changes, sediment budgets and accommodation space. Furthermore, the position and geometry of sedimentological units in spatial maps often help to distinguish, for example, channel facies from open tidal-flat deposits.

Figure 5. Scheme of coastal sequence types (simplified after Hoselmann & Streif Reference Hoselmann and Streif2004).
Using this sequence map to reconstruct a palaeogeography map allows the difference between the original sediment distribution and the preserved sequence to be determined. In addition, younger erosional events may have considerably changed the former palaeomorphology and original facies distributions. This map is also used to recommend a combined litho-chronological classification since lithostratigraphical units are not necessarily synchronous along the entire coastal area (Streif, Reference Streif2004). Areas of siliciclastic deposition on top of former peat areas could be detected from the map of profile types (Streif, Reference Streif1998). Determining active and inactive sediment surfaces within siliciclastic units on a local scale is very difficult because features such as soil formation are rarely documented or even dated.
The distribution of basal peat is directly shown by distinct sequence types (Fig. 5: x2, x4, y2, y4, z1–3). The occurrence of intercalated peat can indicate a local seaward expansion of salt marshes with subsequent freshwater conditions. Profile type x1 with solely siliciclastic deposits in the landward area reflects the existence of channel deposits while in more seaward regions there is usually no differentiation between channel fill and open tidal-flat deposits.
3.4. Peat distribution
Besides the mapping of peat deposits as described above, a description of the original spatial distribution of surficial peat bogs in the Geest areas and fens in the marsh is given by the Campsche Karte von Ostfriesland from 1806 (Willem Camp 1761–1855, republished by Henninger et al., Reference Henninger, Kappelhoff and Schumacher2005) and the compiled map of the original peat distribution by the LBEG.
3.5. Archaeological data
In order to distinguish salt marshes from open tidal flats in the youngest time slice, archaeological data are used as a proxy assuming that settling activity only took place on salt marshes. The mapping of dated settlements in the marshland indicating the extent of the 1500 to 1000 cal BP supratidal marshland was performed using data from the Lancewadplan Project (Behre, Reference Behre1999; Wadden Academy & CWSS Reference Wadden and Common2012) provided by the Common Wadden Sea Secretariat. The distribution of settlements in the marshland shows areas that were cut off from tidal flooding for quite a long time and are therefore interpreted as marshland areas occurring above the spring tide level. For the last 1000 years, changes in sedimentary environments have mainly been driven by land reclamation and dike construction.
4. Results
4.1. Stratigraphy in different tidal basins
The three cross-sections from different locations of the central Wadden Sea coast represent different sedimentary successions depending on the Pleistocene surface elevation, relief, and exposure to waves and tidal currents. All cross-sections are located on the mainland, because the Holocene sequence there is more complete than in the more proximal part of the Wadden Sea, where sediment reworking by migrating tidal channels is more intense and erosional gaps are very common. The channels can be considered as a landward continuation of the tidal channels of the more seaward Wadden Sea sequence. The Krummhörn cross-section shows a low-lying (−20 m NHN) and west-facing palaeovalley, while the Ostermarsch cross-section is located at the seaward margin of an elevated Pleistocene upland (−3 m NHN). The Wangerland cross-section shows an eastward-oriented channel system with the channel base at around −15 m NHN being connected to the outer Jade (see Fig. 2).
4.2.1. Krummhörn
The cross-section from the Krummhörn peninsula (Fig. 6) shows a low-lying palaeovalley c.500 m wide and 10 m deep. A maximum thickness of 20 m of Holocene deposits occurs within the palaeovalley. Eleven radiocarbon datings allowed the reconstruction of the chronology of the sedimentary channel infill. Core G424-725 shows fluvial Weichselian medium sands overlain by an up to 11 m thick layer of calcareous sandy to silty channel deposits, and the presence of wood fragments at the base of cross-bedded layers of fine to medium sands. A fining-upward sequence consists of brackish silt and clay with Phragmites roots on top of these channel deposits. At around −10 m NHN the beginning of basal fen peat on top of Pleistocene sand is dated to 6308–5601 cal BP in core G427-705 on top of the channel flanks. Peat formations that covered the channel deposits even at 5054–5656 cal BP (core G422-703) indicate that valley fills were completed at that time. This brackish environment with Phragmites peat and the deposition of humic mud existed for c.4000 years, as proved by the dating of uneroded peat top layers at −5 m NHN (2362–2738 cal BP in core G427-705; 2736–2977 cal BP in core G416-713). Trapped mud layers within the peat beds along the channel document frequent storm floods that reached the peatland through the channel, and for this reason they prove a connection of the peatland with the tidal environment, evidencing a marine transgression event into the coastal plain. In most cores, the top of the peat is erosively overlain by sand and silt that were formed in a tidal environment, followed by salt-marsh deposits. A soil formation in the marshlands at −1 m to −1.5 m NHN occurs around the beginning of the Common Era, representing the final stage of the silting-up of the Krummhörn palaeovalley. This soil is dated to 1736–2292 cal BP in the Siedlung Rysum G 416-712 core.

Figure 6. Cross-section of the coastal plain at Krummhörn illustrating the Holocene sedimentary succession. See Figure 2 for the position of the cross-section.
The top of a peat bed in core G425-704 is dated to 1948–2697 cal BP, being the youngest date of peat formations in this cross-section. If the dated material is a relocated peat clast or autochthonous, it could not have been derived from the given sediment description.
Until dike construction, 1.5 m of salt-marsh deposits were accumulated on top of the soil within the following 1000 years, indicating frequent flooding of the salt marshes without reactivation of the former tidal channel.
4.2.2. Ostermarsch
The Holocene sedimentation sequence differs fundamentally from that of the Krummhörn area at the seaward margin of the Pleistocene upland at the mainland Ostermarsch north of Norden (Fig. 7). The elevated level of the Pleistocene land surface with a channel base lying not deeper than −3 m NHN resulted in a delayed marine influence. Basal peat formed in a large morphological depression independent of RSL. Even bog peat is described in the Ostermarsch BD 251 and 256 cores. Although the base of the peat has not been dated, radiocarbon ages from the erosive top of the peat have been dated to 5316–5575 cal BP (core W4) and 5299–5567 cal BP, respectively (core W5), indicating the maximum age of the end of peat formation. In the seaward part of the coastal plain the basal peat is erosively overlain by tidal flat deposits. The transgressional contact of the intertidal environment in mixed flat facies at a depth of c.−1.5 m NHN is widely expanding over the former peat-dominated coastal plain (dated 970–1158 cal BP). Vast salt marshes with soil formations evolved in the elevated landward areas from −0.5 m NHN upwards. Due to an increase in tidal energy in the tidal flats after dike construction (Bartholomä & Flemming, Reference Bartholomä and Flemming1995) and tidal reworking by shifting tidal creeks, the ancient salt marshes preserved landward of the dike underwent substantial erosion on the seaward side of the dike.

Figure 7. Cross-section of the coastal plain of the Ostermarsch region illustrating the Holocene sedimentary succession. See Figure 2 for the position of the cross-section.
4.2.3. Wangerland
The cross-section through a tidal basin in the Wangerland region (Fig. 8) is located at the landward margin of the drainage system around the Crildumer Deep, which was directly connected to the tidal system of the outer Jade channel. The Wangerland cross-section shows Holocene deposits that are up to 15 m thick overlying late glacial sands. The channel geometry is wide with shallow banks, and the channel fill shows at least three phases of marine ingression. The first marine ingression took place after a freshwater phase with peat formation and lacustrine clay deposition, which has been dated to have formed 7336–7650 cal BP on the northern flank of the channel structure observed in the Nenndorf 35 core. A narrow channel with reworked peat and wood remains expanded laterally with an increase of tidal influence. This first marine ingression into the channel system ended around 6415–6748 cal BP (core Nenndorf 14) when freshwater conditions with peat formation at −9 m NHN expanded from the elevated flanks over the former tidal creeks. A second marine ingression with 4 m of mudflat deposits followed after 5663–6303 cal BP (core Nenndorf 17), being only locally preserved due to lateral channel erosion. Cores Nenndorf 30 and 34 show erosive channel lag deposits cutting into the marine deposits of the first ingression. Another silting-up event occurred in the central and southern parts of the cross-section around 3699–4514 cal BP (core Nenndorf 30) and 4418–4848 cal BP (core Nenndorf 17), respectively, when again, thin peat layers at −5 m NHN give evidence for the presence of freshwater conditions in the former tidal environment. The radiocarbon dates of this peat layer document a timespan of a maximal 1100 years before a third landward expansion of the marine environment took place. Erosional contacts on top of freshwater deposits with subsequent sandy sedimentation in shallow channels prove the occurrence of a higher tidal dynamic than before. This ingression resulted in 5 m of marine sandy to silty intertidal deposits with a fining-upward trend due to a salt-marsh development. A soil formation is described in the southern part of the cross-section, indicating supratidal conditions. The soil again is covered with approximately half a metre of marine mud belonging to the last ingression, creating the tidal basin of the so-called Crildum Bay. With the beginning of land reclamation and dike construction since the 11th century this region was cut off from marine depositional processes.

Figure 8. Cross-section of the coastal plain of the Wangerland region illustrating a thick Holocene sedimentary succession. See Figure 2 for the position of the cross-section.
4.2. Reconstructed palaeogeography
As seen in the cross-sections, coastal environments form a dynamic system that can shift landward or seaward, and/or one above the other, in response to several controlling factors such as the rate of sea-level rise, coastal morphology, sediment supply, and accommodation space. For the early Holocene, the additional depth and relief of the pre-Holocene land surface played an important role in controlling the spatial extent of the marine environment. During the middle and late Holocene, when the palaeorelief was mostly filled, other factors such as the position and size of tidal channels, which acted as local sediment suppliers and drainage networks, dominated the development of local tidal basins (Baeteman, Reference Baeteman2005, Reference Baeteman2008). Therefore, the chronology of environmental transition cannot be generalised for the entire coastal plain (van der Spek, Reference van der Spek1996). The maps (shown in Figs 9, 10, 12 and 13) of four relatively broad time intervals combine knowledge of stratigraphy as well as facies evolution with local chronological data along the tidal flats and coastal marsh belt.
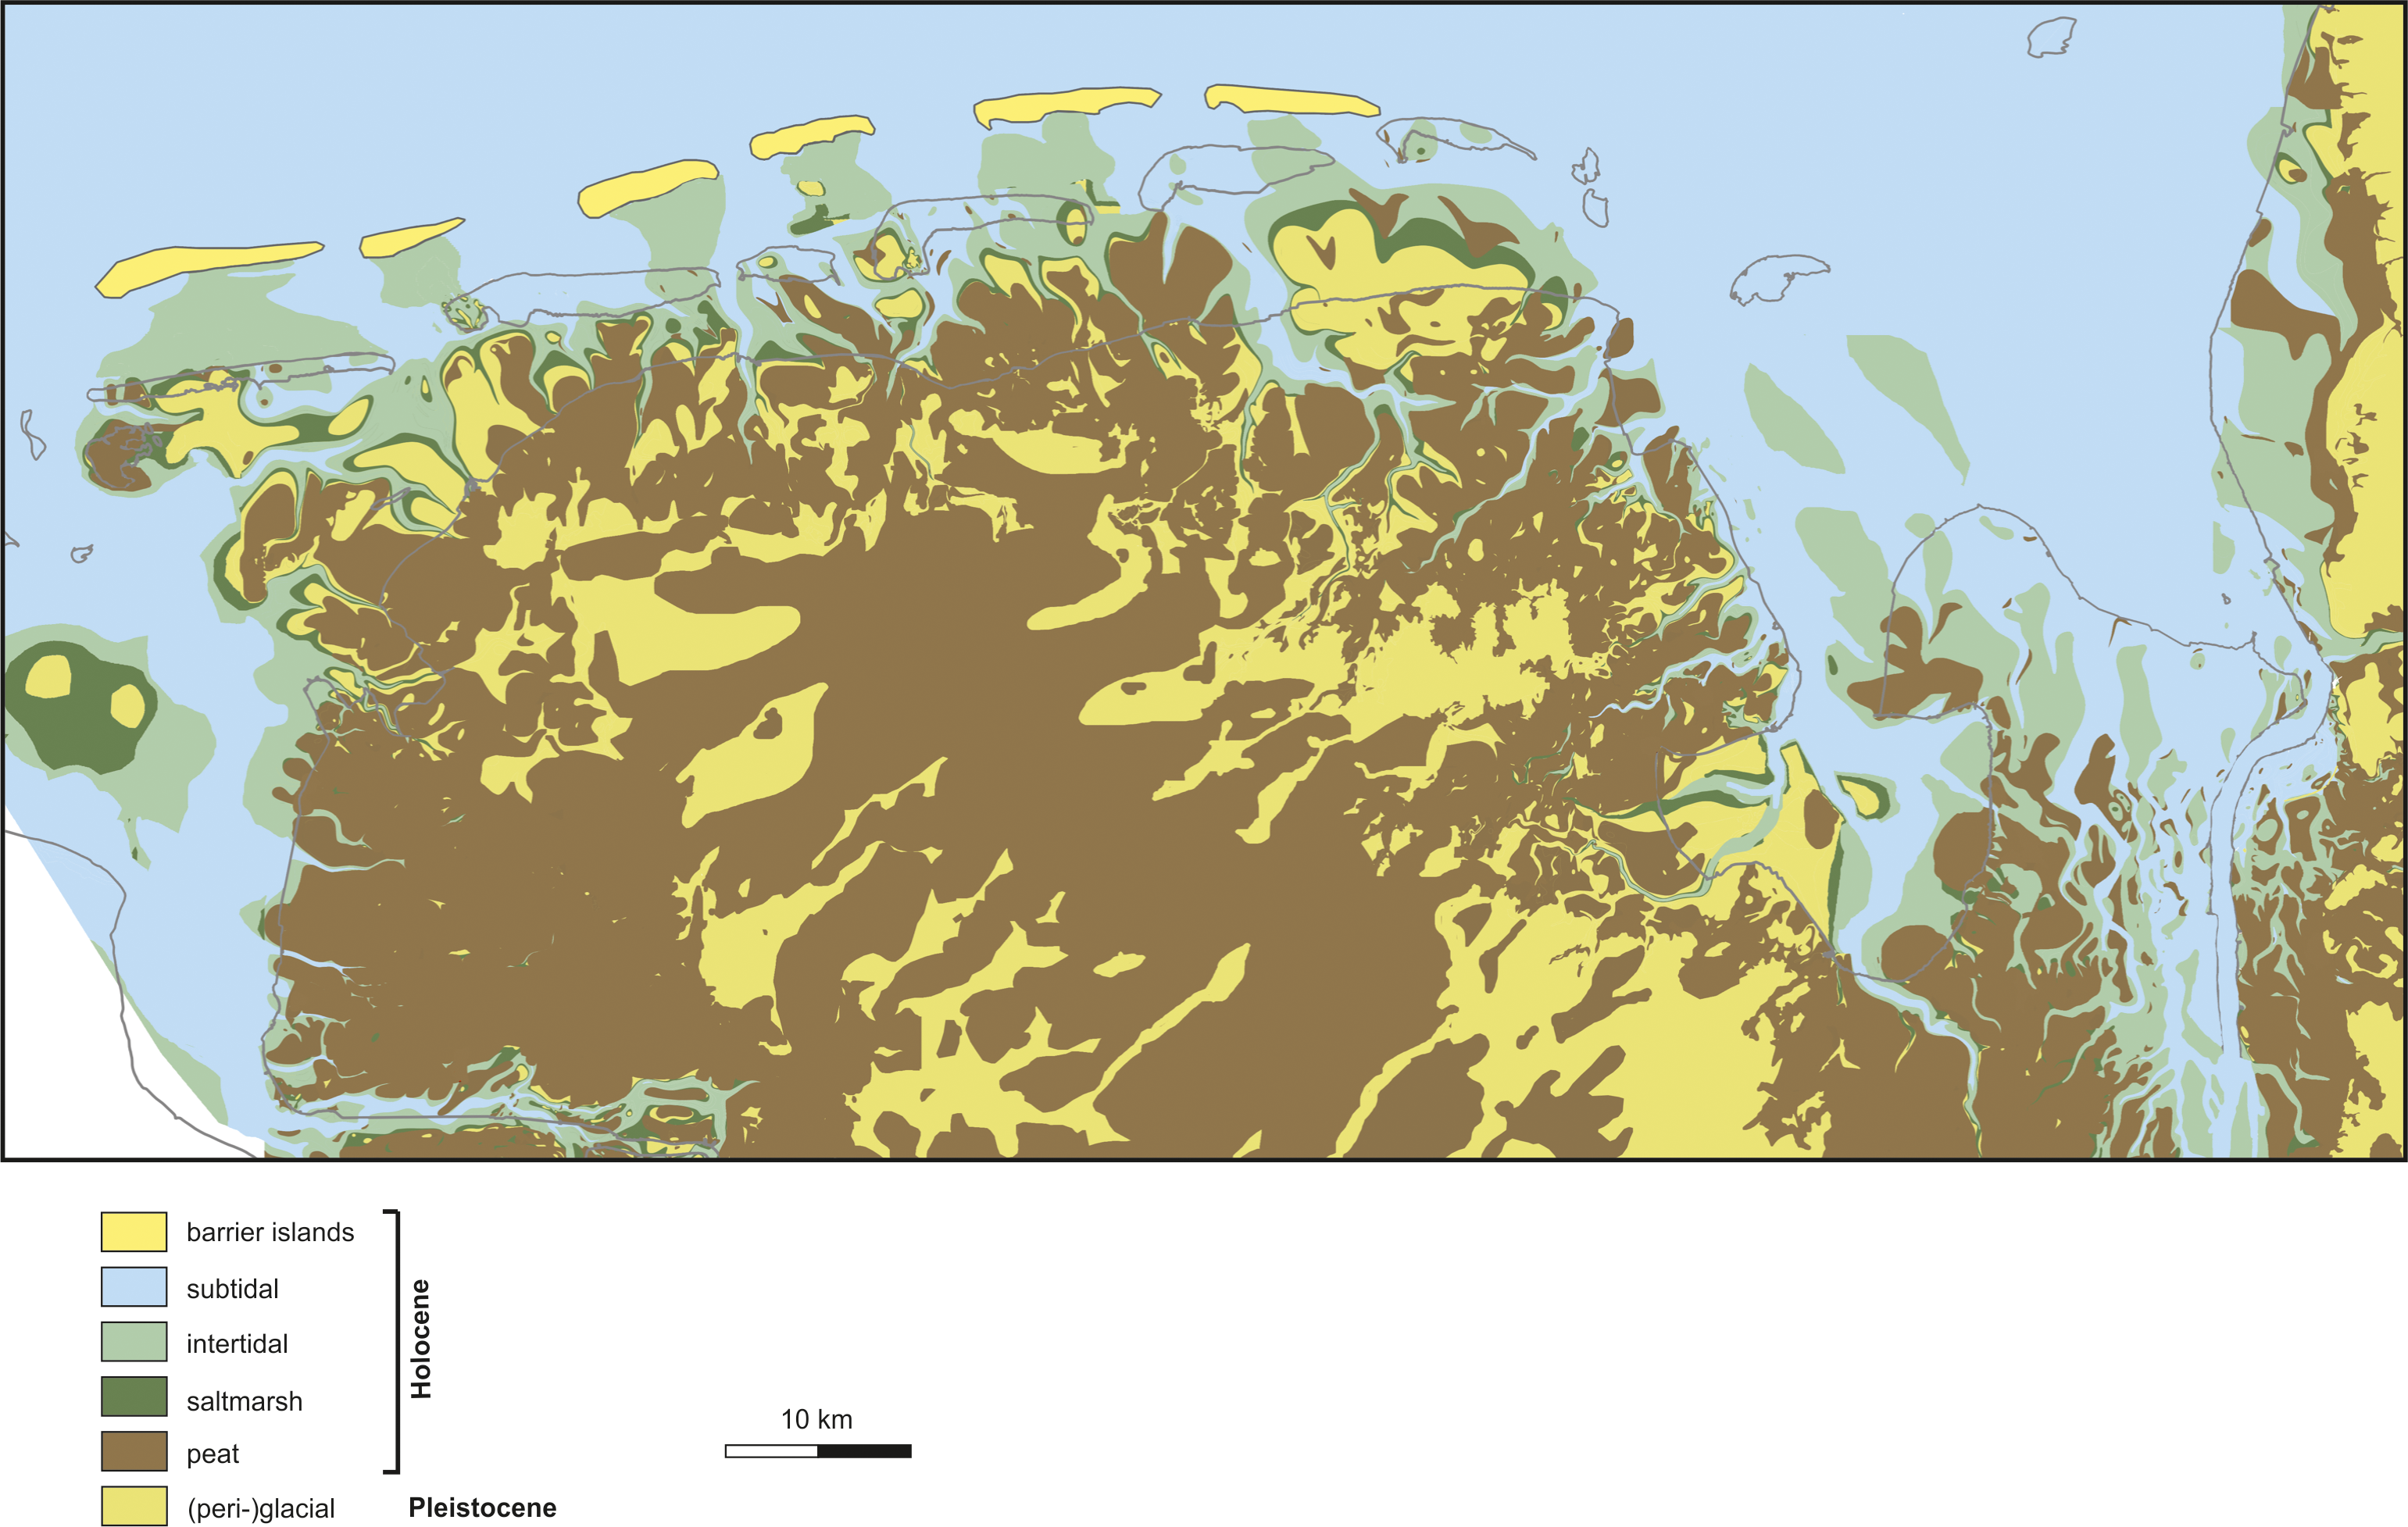
Figure 9. Palaeogeographic map of the East Frisian peninsula (central Wadden Sea region) for 8600–6500 cal BP.

Figure 10. Palaeogeographic map of the East Frisian peninsula (central Wadden Sea region) for 6500–2700 cal BP.
8600–6500 cal BP
According to Harnisch (Reference Hanisch1980) and Streif (Reference Streif1990a), the evolution of the present-day coastal landscape started around 7900 BP, based on indicators in sediment cores from −24 m NHN for a brackish environment. At this time the sea level rose from about −25 m to −8 m below its present level, with a mean rate of 2.1 m per century (Streif, Reference Streif1990a, Reference Streif2004) (Fig. 9).
Brackish and marine environments, protected by a chain of barrier islands, developed seaward from the present-day Wadden islands and extended further inland through the existing channels, turning them into estuaries (Flemming & Davis, Reference Flemming and Davis1994; Streif, Reference Streif2004). The transgression caused the erosion of Pleistocene and early Holocene sediments mainly in the present-day offshore area, while closer to the mainland, reworking was limited to palaeovalleys, which developed into estuaries and tidal channels.
Extended peat formation indicates that the groundwater level was rising due to sea-level rise. Low-lying areas especially, like Krummhörn in the west or the Jade region, show extended basal peat formation. Due to their proximity to the outer Ems channel, the occurrence of trapped mud layers along the coastline and the margins of tidal channels indicates a cliff-like transition from fen peat areas to tidal flats or channels due to a coastline retreat (Behre & Kučan, Reference Behre and Kučan1999; Bruns et al., Reference Bruns, Bungenstock, Wolters and Freund2015).
The oldest known basal peat along the East Frisian coast is c.8000 years old (Preuss, Reference Preuss1979). However, the growth of basal peat is not necessarily connected to the rising sea level but also occurs in local depressions of the Pleistocene hinterland due to high groundwater levels (Streif, Reference Streif2004). The first sediments indicative of brackish or marine environments covering the basal peat in −10 to −14 m NHN were deposited around 7000 cal BP (Streif, Reference Streif2004). An earlier marine influence might have been operating through the fluvial channels of Pleistocene age, but due to erosion within the still open palaeochannel network the change from fluvial to estuarine or marine environment has not yet been dated. Tidal flats evolved along the channels with an ongoing rise in sea level. From 7500 cal BP onwards, the barrier island chain started to develop (Streif, Reference Streif1990a; Flemming, Reference Flemming1991, Reference Flemming, Wefer, Berger, Behre and Jansen2002; Chang et al., Reference Chang, Flemming, Tilch, Bartholomä and Wöstmann2006).
6500–2700 cal BP
This period is characterised by a deceleration of RSL rise. According to Vink et al. (Reference Vink, Steffen, Reinhardt and Kaufmann2007), the mean sea level (MSL) rose from −8 to −3 m NHN (see Fig. 3). Until c.5000 cal BP, the palaeovalleys were almost completely filled and the Pleistocene plateaus also existed at a higher level, being covered with basal peat and reached by brackish or distal tidal environments. Brackish environments spread from channel margins into the coastal plain and channels infilled with tidal deposits. Subsequently, salt marshes which were out of reach of tidal inundation evolved into freshwater marshes, with peat formation leading to a regressive coastal evolution while the MSL rise decelerated (Fig. 10). These intercalated peat beds occur along the entire coast, but with only a limited spatial distribution and having formed during different time periods, depending on local hydrological effects and sediment dynamics. According to Streif (Reference Streif2004), two main phases of intercalated peat formations can be distinguished around 4800–4200 BP and 3300–2300 BP.
In regions where the Pleistocene surface is at a low level, the Holocene sequence often contains more than one intercalated peat bed. Areas like Krummhörn are dominated by an interfingering of salt-marsh and peat environments, depending on the channel position and the rate of compaction of the thick sequence of underlying highly compressive sediments, which led to an increase of accommodation space. Wood fragments have been incorporated into the deposits on channel margins documenting the supply from adjacent banks where floodplain forests existed (Streif, Reference Streif1971). This silting-up of the tidal basin shows that the sediment supply exceeded the increase in accommodation space, which resulted in a progradation of the coastline. The silting-up until high water level resulted in a decrease in inundation frequency, which changed the drainage dynamics of the tidal creeks. Peat was forming until c.2700 cal BP, on top of which supratidal mud overlying even channel sands indicates a sediment supply which was sufficient to keep pace with the rising sea level (see Fig. 6). No distinct phases of intercalated peat formation can be distinguished. Lateral shifts of active tidal channels and creeks resulted in local variations in the connection to the tidal channel system. Salt marshes disconnected from the sediment supply therefore developed into the freshwater environment with subsequent peat formation.
In the tidal flats north of Bensersiel, a recently dated sediment core S60 (for location see Fig. 2) contains a marine sequence that is underlain by basal peat and overlain by Phragmites peat. The beginning of marine conditions has been dated back to 4295–4522 cal BP at −3.6 m NHN. The analysis of botanical remains indicates that salt marshes were formed on top of the lower peat formation without any erosion. The environmental conditions changed from the lower to the upper salt marsh, additionally indicated by soil formation in the upper part. Due to the decrease in the tidal inundations of the salt marshes, fen peat formation began around 3239–3444 cal BP at −1.65 m NHN, extending about 2.5 km seawards (Streif, Reference Streif1990a). The resulting mean sedimentation rate in this area is c.2 m per 1000 years. The coastal peat reached its northernmost position during this time. Tidal influence reached this area again around 3003–3321 cal BP, when spreading salt marshes covered the peat bogs (Fig. 11).

Figure 11. Core log from stations S60 and S61. See Figure 2 for the positions of the core stations.
In contrast, three regressive phases can be observed in the Wangerland cross-section which are marked by peat or soil formation (see Fig. 8). However, their ages coincide only for the interval 4800–4200 BP (see Section 5 below). Coastline progradation in this area is most probably driven by sediment supply through the complex channel system, which is open to the north as well as to the east, and affected by a higher salt marsh on top of a Pleistocene upland seaward of the tidal basin (Fig. 10).
2700–1500 cal BP
After c.2700 cal BP a significant change occurred, resulting in a landward shift of the tidal-channel network and the expansion of intertidal flats. Sea level rose from −3 to −0.5 m NHN during this time interval (Vink et al., Reference Vink, Steffen, Reinhardt and Kaufmann2007). Consequently, the tidal channel network shifted landward (Fig. 12). Peat was often eroded, and therefore the change from a freshwater to a tidal environment could often not be dated (Waller et al., Reference Waller, Long and Schofield2006). Salt-marsh deposits and peat were covered with sandy or muddy tidal deposits along the entire coastal plain due to this tidal expansion. A transgressive onlap is observed in the Krummhörn cross-section at −5 m NN (2362–2738 cal BP) and at −4m NN (2736–2977 cal BP), respectively (see Fig. 6). Soil formation is dated to have occurred around 1736–2292 cal BP at −1 m NHN. Regardless of the extension of the tidal environment, these higher salt marshes stayed predominantly free of frequent inundations. Archaeological finds demonstrate that the salt marsh north of Bensersiel was settled from Roman until medieval times (Niederhöfer, Reference Niederhöfer2013; Karle & Goldhammer, Reference Karle and Goldhammer2017).

Figure 12. Palaeogeographic map of the East Frisian peninsula (central Wadden Sea region) for 2700–1500 cal BP.
1500–1000 cal BP
Due to the deceleration of the rate of RSL rise, the silting-up of the salt marshes kept pace, and therefore the landward migration of tidal environments stopped. Since around 1000 AD, the evolution of the Wadden Sea has been severely influenced by human interventions in the form of land reclamation and dike construction (Streif, Reference Streif1990a; Flemming, Reference Flemming, Wefer, Berger, Behre and Jansen2002). Extended salt marshes were settled by humans, and terps were built to prevent high=water events inundating the marshes. Archaeological mapping of terps shows how widely settled the salt marshes were in this period (Behre, Reference Behre1999; The Wadden Academy & CWSS Reference Wadden and Common2012). The shoreline stayed stable (Fig. 13), but event-driven marine ingressions locally induced the extension of tidal basins far into salt-marsh areas, especially where thick sequences of compaction-prone sediments, such as the Harle Bight, the Crildumer Bight or the Schwarzes Brack, occur. Therefore, former channels were preferred locations for erosional events due to storm floods (Karle et al., Reference Karle, Frechen and Wehrmann2021). In these newly created tidal basins, erosion due to tidal currents and waves often led to the reworking and loss of salt marshes and peat until the natural silting-up and finally the construction of dikes were detracted from tidal processes.

Figure 13. Palaeogeographic map of the East Frisian peninsula (central Wadden Sea region) for 1500–1000 cal BP.
The migration of tidal channels in the modern tidal flats led and still leads to the reworking of middle to late Holocene deposits. As shown in Figure 7, the dike line marks the northernmost border of fossil mudflats and salt marshes. While the tidal flats have been described as being relatively stable (Reineck, Reference Reineck1958; Tilch, Reference Tilch2003), the channel margins and tidal creeks exhibit the most mobile patterns, with erosion depth depending on the depth of the channels varying with the neep–spring cycles and storm events (van Straaten, Reference van Straaten1952; Reineck, Reference Reineck1958). The outer sandbanks situated along the channel margins play a significant role as a local source of sand (Chang et al., Reference Chang, Flemming, Tilch, Bartholomä and Wöstmann2006). Morphological differences of up to 80 cm within 1 month have been observed in the Spiekeroog back-barrier flats (Tilch, Reference Tilch2003).
5. Discussion
5.1. Controlling factors of Holocene sediment deposition
The pre-Holocene relief as geological precondition
It is obvious that the moment of inundation by the Holocene RSL was dependent on the morphology of the pre-transgressional relief. Moreover, the palaeovalleys originating from the Weichselian and older epochs (cf. Dechend, Reference Dechend1950; Hepp et al., Reference Hepp, Hebbeln, Kreiter, Keil, Bathmann, Ehlers and Mörz2012, Reference Hepp, Romero, Mörz, De Pol-Holz and Hebbeln2019; Bogemans et al., Reference Bogemans, Roe and Baeteman2016) provided pathways for the transgressing sea. The geological record of different areas along the coast documents that marine transgressions reached these palaeovalleys long before an intertidal environment covering the coastal plain prograded landwards (e.g. Streif, Reference Streif2004; Bungenstock & Schäfer, Reference Bungenstock and Schäfer2009; Wartenberg et al., Reference Wartenberg, Vött, Freund, Hadler, Frechen, Willershäuser, Schnaidt, Fischer and Obrocki2013; Karle et al., Reference Karle, Frechen and Wehrmann2021). Also, younger channels often followed the course of the palaeovalleys (Baeteman, Reference Baeteman1999, Reference Baeteman2005). Even land loss during storm surges often occurred along reactivated palaeochannels, paving the way into landward marshes and peat land as exemplified by the Harle Bay, the Crildum Bay and the Jade Bay (cf. Figs 2 and 13; Behre, Reference Behre1999; Karle et al., Reference Karle, Frechen and Wehrmann2021).
Sediment supply through tidal channels
During the early Holocene RSL rise, channels were filled with sandy to muddy tidal deposits depending on their distal or proximal position in relation to the high-water coastline. With the ongoing RSL rise the accommodation space increased in tidal basins. However, sediment supply and the deposition of sediments led to the silting-up of the tidal channels, and tidal flats developed as a result. The silting-up of distal tidal channels and creeks of the mudflats and salt marshes led to a decline of drainage, and finally to an increasingly freshwater environment (Pons, Reference Pons and Verhoeven1992; Vos, Reference Vos2015). Locally, peat was able to prograde into the former tidal areas. Because of the silting-up of the area and the very weak RSL rise, accommodation space was no longer created. Therefore, the channels started to migrate laterally through meandering (van der Spek & Beets, Reference van der Spek and Beets1992). This caused shallow erosion and the reworking of the latest channel infill and the adjacent intertidal flats. During aggradational phases, when the creation of accommodation space (AS) and the sediment supply (SS) were in equilibrium, meandering channels, the shift of the tidal drainage network during the ongoing RSL rise, which was possibly enhanced by storm surge events, caused a change in the local sediment supply, resulting in the formation, as well as submergence, of peat areas, producing the intercalated peats observed in the sedimentary record.
Compaction and erosion of peat
Another factor triggering the landward extension of tidal flats is the compaction of the peat areas. An abrupt climate change around 2800 cal BP caused a shift to colder and wetter climate conditions in the northwest of Europe (van Geel et al., Reference van Geel, Buurman and Waterbolk1996; Engels & van Geel, Reference Engels and van Geel2012). Indeed, for the areas of the Ems estuary and the Jade Bay, a shift of fens to raised bogs has been documented for this time (Streif, Reference Streif2004). Baeteman (Reference Baeteman2005) described how this abrupt climate change with accelerated precipitation caused excessive run-off from the hinterland, eroding the mid-Holocene channels and thus allowing tidal waters to enter the area again. Subsequently, peat was inundated in the vicinity of the channels and eroded along the channels. Inundation finally stopped the peat growth and caused its decay and autocompaction. Channel scouring and entering of tidal waters initiated the erosion of the peat cliffs by currents (Baeteman, Reference Baeteman2005) and, especially during stormy weather, by waves (Karle, Reference Karle2008). Palaeo-peat cliffs can be mapped all along the East Frisian mainland coastline by trapped mud layers (Behre & Kuçan, Reference Behre and Kučan1999; Bruns et al., Reference Bruns, Bungenstock, Wolters and Freund2015; van Dijk et al., Reference van Dijk, Fritz, Straathof, van de Riet, Hogeweg, Harpenslager, Roelofs, Behre and Lamers2018; NIBIS® Kartenserver, 2020). Storm surges especially caused the cutting-off and floating away of extensive peatland, as first reported by Pliny the Elder (Plinius Secundus, Reference Plinius Secundus1764 [AD 77]).
Finally, both the compaction and erosion of the peat led to inundation and a landward shift of the tidal environment, or even to locally restricted marine ingressions probably corresponding to historical phases of increased storm activity for the time (1900–1050 cal BP; Sorrel et al., Reference Sorrel, Debret, Billeaud, Jaccard, McManus and Tessier2012). Additionally, the compression of peat by the deposition of sediments on top of it resulted in a positive feedback to create new accommodation space leading to further tidal sedimentation (van der Spek, Reference van der Spek1995; Long et al., Reference Long, Waller and Stupples2006). This compression process seems to have finished before the formation of a salt-marsh soil around the Common Era, which is mapped on a consistent horizontal level as shown for the area between southern Jade Bay and the Weser river (Bungenstock, Reference Bungenstock2008).
The youngest peat data collected in the study sites are dated around 1500 cal BP (Fig. 14) and indicate that the peatlands were covered by tidal flats along the entire East Frisian coast at that time. This is in accordance with the studies by Baeteman (Reference Baeteman2005) for the Belgian coast.

Figure 14. Age–depth diagrams of radiocarbon-dated intercalated peat samples from the Krummhörn, Esens and Wangerland regions.
5.2. Formation of intercalated peat
The Holocene depositional records of each of the three regions shown in Figures 6, 7 and 8 are the result of the local prevailing controlling factors. As we could show, these differ along the coast of the East Frisian peninsula, finally leading to local regressive phases with peat formation varying in number, age and depth throughout the entire middle to late Holocene, from ˜6500 cal BP until 1500 cal BP (Streif, Reference Streif2004). Age–depth diagrams of the available 14C peat data from the Krummhörn, Esens and Wangerland regions (Fig. 14) demonstrate that a high-resolution correlation of the Holocene depositional record based on intercalated peat layers is therefore not possible.
5.3. Holocene coastal depositional phases
The depositional history of the East Frisian coastal plain exhibits different phases of coastal progradation and retrogradation depending on the rate of RSL rise, sedimentological controlling factors, and single events, i.e. accommodation space (AS), sediment supply (SS) and storm surges. The pacing and development of coastal change due to a shifting coastline and infill of tidal basins does not necessarily coincide in the different regions as shown in the cross-sections (Figs 6, 7 and 8) and the maps (Figs 9, 10, 12 and 13). Nevertheless, phases of general coastal development can be distinguished based on the RSL curve provided by Vink et al. (Reference Vink, Steffen, Reinhardt and Kaufmann2007) (Fig. 3) and the coastal cross-sections (Figs 6, 7 and 8):
-
phase 1: steep RSL rise until ˜6500 cal BP and the creation of AS exceeds the SS. The consequence is a landward progradation of the sea, mainly driven by the rate of sea-level rise and the pre-transgressional relief (Fig. 9)
-
phase 2: decelerated RSL rise until ˜2700 cal BP. The creation of AS and SS is in equilibrium, and the consequence is a sediment aggradation process and a relatively stable mainland coastline. Nevertheless, local progradations and retrogradations of the mainland coastline can be observed due to local variations in the AS/SS ratio, which is mainly controlled by the tidal channel position, sediment supply and shifts in the tidal channel network.
-
phase 3: Although the continuing RSL rise is still slow from 2700 cal BP onwards, AS exceeds SS, and the palaeoenvironmental record shows a retrogradation of the coastline (Fig. 12). This is due to two factors: (a) the continued depletion of sediment sources from the offshore area after c.3000 cal BP and therefore a deficit of SS. To compensate for this, shoreface sediments were reworked and tidal basins as well as the shoreline migrated landward (Flemming & Davis, Reference Flemming and Davis1994; Bartholomä & Flemming, Reference Bartholomä and Flemming1995; Flemming & Bartholomä, Reference Flemming and Bartholomä1997; Flemming, Reference Flemming, Wefer, Berger, Behre and Jansen2002), which has been described for the coasts of the Netherlands and Belgium (Baeteman et al., Reference Baeteman, Scott and van Strydonck2002; Baeteman, Reference Baeteman2005; Pierik et al., Reference Pierik, Cohen, Vos, van der Spek and Stouthamer2017; de Haas et al., Reference De Haas, Pierik, van der Spek, Cohen, van Maanen and Kleinhans2018); (b) peat compaction led to the creation of AS and, consequently, the landward progradation of the tidal environment (Baeteman, Reference Baeteman2005). Again, the overall transgressional phase is regionally discontinuous, and therefore local soil formation occurred in areas with high salt marshes around 2000 BP (Fig. 6).
Overall, the Holocene sedimentological record started with a transgression, which was followed by an aggradational phase which has taken place since around 6500 cal BP, characterised by alternating phases of local transgressions and regressions. From 3000 cal BP onwards, a new transgressional phase followed, characterised by peat inundation and the reactivation of silted-up channels (Baeteman, Reference Baeteman2005; Karle et al., Reference Karle, Frechen and Wehrmann2021), mudflats, and salt-marsh deposits which are unconformably overlain by sand-dominated intertidal successions (Fig. 11; Chang et al., Reference Chang, Flemming, Tilch, Bartholomä and Wöstmann2006).
The cross-sections (Figs 6, 7 and 8) show all of the phases in different detail and different local occurrence and, according to their geographical position, dominated by different controlling factors (see Section 5.1):
In the Krummhörn cross-section (Fig. 6) the first transgression (phase 1) starting from the main channel is followed by two cycles of coastal progradation – two intercalated peats – (phase 2) and by a second erosional transgression younger than 2700 cal BP (phase 3). The second transgression was most probably initiated by the drainage and compaction of the uppermost peat layer and the underlying compaction-prone deposits, controlled by the channel drainage. The channel was, in turn, reactivated during the late Holocene (Fig. 6).
The Ostermarsch cross-section (Fig. 7) shows the latest transgression (phase 3) on top of a basal peat formation. Since the relief of the pre-transgressional surface is not deeper than −2.5 m NHN, only the uppermost part of the Holocene sedimentary record has been documented. Besides, the Ostermarsch cross-section clearly shows the conservation of late Holocene deposits landward of the dikes, whereas at the seaward side tidal reworking and erosion of late Holocene deposits has taken place. This is a consequence of dike construction that has been ongoing since the 13th century (van der Spek, Reference van der Spek1996; Flemming, Reference Flemming, Wefer, Berger, Behre and Jansen2002).
All three phases are preserved in the Wangerland cross-section (Fig. 8). The deposits of the first transgressional phase cover the basal peat without erosion on top of the Pleistocene relief. The aggradational phase with two intercalated peat beds comprises c.5 m. The third phase is characterised by intense channel shifting.
The deposition in all cross-sections is a result of all controlling factors since pre-transgressional relief, the SS by tidal channels, and peat compaction and erosion, all of which are naturally interlinked. Nevertheless, these factors have different impacts on the three depicted regions. While the Pleistocene relief mainly characterises the Ostermarsch cross-section, SS by shifting tidal channels essentially influences the Krummhörn and Wangerland cross-sections. The Krummhörn cross-section is additionally strongly regulated by peat compaction and erosion.
5.4. Mapping Holocene coastal development
The presented maps provide a general picture of the landscape types and spatial distribution over a given time interval based on the record we currently hold. The existing data give a rough idea of what Holocene landscape evolution might have looked like in a low temporal resolution, defining the expanding salt marshes as potential areas for human land use. However, the LBEG database for creating palaeogeographical maps lacks absolute chronologies and dating, as well as environmental information. Only a few, mostly conventional, radiocarbon dates have been provided. Therefore, these maps are stratigraphic and serve as a tuning tool for future data. Nevertheless, they represent a general picture of the respective time frames. Due to the lack of absolute dates, time intervals of 500 to 4400 years were chosen based on the age–depth information deduced from the RSL curve by Vink et al. (Reference Vink, Steffen, Reinhardt and Kaufmann2007). These time intervals adapt to different phases of RSL rise and depositional processes. The wide time intervals may hopefully avoid the frequently observed misapplication of palaeogeographical maps, when users with strong local interests just zoom into those maps to get more detailed information, which is absolutely not recommended. Using those maps, one always has to keep in mind the dimension of mapping, the data quantity and quality, as well as the content of the database and the correlated information.
The mainland coastlines presented by Behre (Reference Behre1999) for AD 0 and AD 800 differ from the 2700 to 1500 cal BP and 1500 to 1000 cal BP maps in this paper. While Behre (Reference Behre1999) presents smooth coastlines representing a general position, in our maps an uneven pattern of the marshland rim is depicted, interrupted by local channel networks. Vos & Knol (Reference Vos and Knol2015) merged available open source geological and historical data for the maps of the East Frisian peninsula. The time intervals given by Vos & Knol (Reference Vos and Knol2015) started at 500 cal BC and provided a very detailed analysis for the last 2000 years showing also maps for medieval and modern times. The peat areas shown in our maps differ slightly from those mapped by Homeier (Reference Homeier1969) on the basis of field structure analyses, while our maps were based on the historical charts by Camp (Henninger et al., Reference Henninger, Kappelhoff and Schumacher2005) and the peat map was based on NIBIS® Kartenserver (2020) which also included the interpretation of filed names.
However, more specific data from geological and archaeological research need to be generated to improve these palaeogeographic landscape reconstructions, to finally identify areas with evidence of former surface preservation, implicating potential settling sites for different time intervals.
6. Conclusions
We have generated detailed palaeogeographic maps of distinct periods which display the development of coastal landscapes during the Holocene sea-level rise along the central Wadden Sea coast from 8600 cal BP to 1000 cal BP from core log data of more than 1200 cores. These maps have a high spatial resolution, cover the entire East Frisian peninsula and are based exclusively on sedimentological, lithological and litho-chronostratigraphical data.
Along cross-sections from three different coastal regions, each of them representing different hydrodynamic positions and morphological prerequisites, we were able to demonstrate the non-synchronous formation of sedimentary sequences during the Holocene transgression on a regional scale. The main controlling factors were the pre-existing palaeorelief, sediment supply, accommodation space, and sedimentation rates. Additionally, the relative position within the tidal environment, i.e. distal vs proximal, and the connection to tidal channels, significantly influenced the development of the local sedimentation. Consequently, shifts of the mainland coastline could be contrary to the respective (absolute) sea-level change.
The formation of the intercalated peats showed a general trend of ages and altitudes, ranging from 6500 BP to 1500 BP, and −10 to 0 m NHN, respectively. However, their occurrence was restricted to more landward positions of the entire system.
For future research, systematic surveys as well as a refinement of landscape reconstruction by bridging gaps in the subsurface data are still needed, in order to get a higher temporal and spatial resolution of landscape changes, especially for the past 2000 years. Unfortunately, the sedimentary record is very complex due to multiple retrogradational and progradational shifts of the coastline. For a detailed and reliable reconstruction of the palaeoenvironment and the former positions of the mainland coastline, a high-resolution grid of absolute dates and other abiotic and biotic indicative factors such as diatoms or plant remains is essential. Since the coastal zone along the southern North Sea has undergone non-uniform depositional processes with different dominating controlling factors, these studies must be regarded on a regional scale in terms of controlling factors and processes.
Further investigation will profit from a multidisciplinary approach to fill those gaps and reach a higher level of data quality by means of spatial and temporal resolution improvements and a better understanding of the close relationships between sedimentary processes, sea-level change, and landscape evolution in this regional context. Merging local data of different sources/disciplines will lead to a broader insight into the interplay of natural changes and human adaptation strategies. This could also help pinpoint potential archaeological sites, which may be endangered by the activities of coastal engineering and offshore renewable energy projects.
Supplementary material
To view supplementary material for this article, please visit https://doi.org/10.1017/njg.2021.10
Acknowledgements
The investigations reported here were funded by the Lower Saxony Ministry for Science and Culture under grant number ZN3197 (WASA) and the project ‘Settlement and cultural history of the Wadden Sea area in Lower Saxony’. We are particularly thankful to the following institutions which provided additional data, assistance and permits: Nationalparkverwaltung Niedersächsisches Wattenmeer, Landesamt für Bergbau, Energie und Geologie (LBEG, Hannover), Niedersächsischer Landesbetrieb für Wasserwirtschaft, Küsten- und Naturschutz (NLWKN, Betriebsstelle Norden-Norderney). We thank Felix Bittmann for the botanical analyses of samples from cores S60 and S61. The Common Wadden Sea Secretariat is acknowledged for providing data from the Lancewadplan project. The reviewers Cecile Baeteman and Ad van der Spek are gratefully acknowledged; the manuscript benefited greatly from their critical comments and constructive remarks.


 Open access