Chemical Similarity of Co-occurring Trees Decreases With Precipitation and Temperature in North American Forests
 Brian E. Sedio1,2*
  Marko J. Spasojevic3
  Jonathan A. Myers4
  S. Joseph Wright2
  Maria D. Person5
  Hamssika Chandrasekaran5 Jack H. Dwenger1 María Laura Prechi2 Christian A. López2
  David N. Allen6
  Kristina J. Anderson-Teixeira7
  Jennifer L. Baltzer8
  Norman A. Bourg7
  Buck T. Castillo9
  Nicola J. Day10 Emily Dewald-Wang11
  Christopher W. Dick2,9
  Timothy Y. James9
  Jordan G. Kueneman2 Joseph LaManna12
  James A. Lutz13
  Ian R. McGregor7 Sean M. McMahon14
  Geoffrey G. Parker14
  John D. Parker14
  John H. Vandermeer9
- 1Department of Integrative Biology, University of Texas at Austin, Austin, TX, United States
- 2Smithsonian Tropical Research Institute, Panama City, Panama
- 3Department of Evolution, Ecology, and Organismal Biology, University of California, Riverside, Riverside, CA, United States
- 4Department of Biology, Washington University in St. Louis, St. Louis, MO, United States
- 5Proteomics Facility, University of Texas at Austin, Austin, TX, United States
- 6Department of Biology, Middlebury College, Middlebury, VT, United States
- 7Conservation Ecology Center, Smithsonian Conservation Biology Institute, Front Royal, VA, United States
- 8Department of Biology, Wilfrid Laurier University, Waterloo, ON, Canada
- 9Department of Ecology and Evolutionary Biology, University of Michigan, Ann Arbor, MI, United States
- 10School of Biological Sciences, Victoria University of Wellington, Wellengton, New Zealand
- 11Department of Integrative Biology, University of California, Berkeley, Berkeley, CA, United States
- 12Department of Biological Sciences, Marquette University, Milwaukee, WI, United States
- 13Department of Wildland Resources, Utah State University, Logan, UT, United States
- 14Forest Ecology Group, Smithsonian Environmental Research Center, Edgewater, MD, United States
Plant diversity varies immensely over large-scale gradients in temperature, precipitation, and seasonality at global and regional scales. This relationship may be driven in part by climatic variation in the relative importance of abiotic and biotic interactions to the diversity and composition of plant communities. In particular, biotic interactions may become stronger and more host specific with increasing precipitation and temperature, resulting in greater plant species richness in wetter and warmer environments. This hypothesis predicts that the many defensive compounds found in plants’ metabolomes should increase in richness and decrease in interspecific similarity with precipitation, temperature, and plant diversity. To test this prediction, we compared patterns of chemical and morphological trait diversity of 140 woody plant species among seven temperate forests in North America representing 16.2°C variation in mean annual temperature (MAT), 2,115 mm variation in mean annual precipitation (MAP), and from 10 to 68 co-occurring species. We used untargeted metabolomics methods based on data generated with liquid chromatography-tandem mass spectrometry to identify, classify, and compare 13,480 unique foliar metabolites and to quantify the metabolomic similarity of species in each community with respect to the whole metabolome and each of five broad classes of metabolites. In addition, we compiled morphological trait data from existing databases and field surveys for three commonly measured traits (specific leaf area [SLA], wood density, and seed mass) for comparison with foliar metabolomes. We found that chemical defense strategies and growth and allocation strategies reflected by these traits largely represented orthogonal axes of variation. In addition, functional dispersion of SLA increased with MAP, whereas functional richness of wood density and seed mass increased with MAT. In contrast, chemical similarity of co-occurring species decreased with both MAT and MAP, and metabolite richness increased with MAT. Variation in metabolite richness among communities was positively correlated with species richness, but variation in mean chemical similarity was not. Our results are consistent with the hypothesis that plant metabolomes play a more important role in community assembly in wetter and warmer climates, even at temperate latitudes, and suggest that metabolomic traits can provide unique insight to studies of trait-based community assembly.
Introduction
Plant diversity varies immensely over large-scale climatic gradients at regional and global scales. Climates that are wetter, warmer, and less seasonal consistently exhibit greater species richness than climates that are drier, colder, and more seasonal. At global scales, tree diversity at the 0.25 km2-scale increases by two orders of magnitude over 60° latitude from the Canadian Taiga Plains to the Amazon Basin (Anderson-Teixeira et al., 2015; Chu et al., 2019; Davies et al., 2021). At regional scales, woody plant diversity increases with precipitation and temperature (Gentry, 1988; Hawkins et al., 2003; Kreft and Jetz, 2007; Esquivel-Muelbert et al., 2017). Prominent hypotheses for these large-scale diversity gradients propose that environmental filtering reduces community membership, and hence diversity, in abiotically stressful climates and that increased specialization of biotic interactions increases species richness in less stressful climates (Schemske et al., 2009; Lamanna et al., 2014; Chu et al., 2019). These hypotheses make testable predictions regarding relationships between climatic gradients and the traits that mediate plant interactions with the abiotic and biotic environment.
Morphological and physiological traits mediate plant interactions with the abiotic and biotic environment and define fundamental tradeoffs in resource-use and life history strategy (Wright et al., 2004; Rüger et al., 2018). Variation in community weighted mean trait values can reveal climatically driven variation in suitable morphological traits. Dispersion and richness of morphological traits may reveal diversity in resource-use and life-history strategies among species that co-occur at a site, or the effects of environmental filters that limit the breadth of trait values with which plants can tolerate a climate (Lamanna et al., 2014; Harrison et al., 2020). For decades, researchers have sought to link community variation in plant functional traits to the processes of community assembly (Weiher and Keddy, 1995), yet a focus on coarse morphological traits (e.g., specific leaf area) that are only loosely correlated with ecological functions (Shipley et al., 2016) has resulted in some cases where there are strong trait-environmental linkages, and other cases where the same traits are weakly linked to the environment, making generalizations challenging.
In addition to morphological variation, much of the functional trait variation found in plant communities is due to variation in small organic molecules that make up the metabolome of the plant (Kursar et al., 2009; Salazar et al., 2018; Sedio et al., 2020, 2017). The plant metabolome includes primary metabolites involved in core metabolic processes and the basic building blocks of large organic polymers such as nucleotides, amino acids, and mono- and disaccharides. However, much of the astonishing diversity of plant metabolomes is made up of secondary metabolites that are typically not involved in core metabolism, but rather in specialized functions. Secondary metabolites can mediate plant response to abiotic stresses, such as those exerted by ultraviolet radiation and freezing temperatures (Close and McArthur, 2002; Rasmann et al., 2014; Schneider et al., 2019), as well as biotic stresses imposed by herbivores and microbial pathogens (Coley, 1983; Wink, 2003; Fine et al., 2006; Salazar et al., 2018; Sedio et al., 2020). Unlike abiotic stressors, biotic agents of selection on plant defenses are capable of reciprocal coevolution, that is, counter-adaptations on the part of herbivores and pathogens to the chemical defenses evolved by plant hosts (Schemske et al., 2009) (Schemske et al., 2009). Ehrlich and Raven (1964) proposed that such coevolution of plants and their natural enemies is a major driver of diversification in both groups. Hence, variation over climatic gradients in the relative importance of natural enemies as agents of selection on plants may contribute to the parallel diversity gradients in woody plants and their natural enemies (Dyer et al., 2007; Schemske et al., 2009), with consequences for variation in plant metabolomes (Defossez et al., 2018; Moreira et al., 2018; Sedio et al., 2018b; Volf et al., 2020).
In light of large-scale climate-associated diversity gradients, biologists have long assumed that plant investment in chemical defenses would increase with pest and pathogen pressure, and hence increase with precipitation and temperature and decrease with seasonality (Coley and Aide, 1991; Coley and Barone, 1996; Dirzo and Boege, 2008; Pellissier et al., 2014; Sam et al., 2020). However, at regional scales, plants tend to invest more in defense in environments in which the cost of tissue loss to natural enemies is greater (Givnish, 1999; Fine et al., 2006; Defossez et al., 2018; Volf et al., 2020). Hence, recent studies suggest that the cost of tissue loss to herbivores or pathogens runs counter to that of pest and pathogen abundance, and hence decreases with precipitation, temperature and edaphic resources (Fine et al., 2006; Sam et al., 2020; Volf et al., 2020). The fitness landscape of plant secondary metabolites likely varies with multiple biotic and abiotic gradients over broad climatic gradients at global and regional scales, and plant responses may favor greater investment in stressful abiotic environments where tissue loss is costly, yet greater diversity or interspecific divergence in chemical defense composition in less stressful abiotic environments with high herbivore and pathogen pressure (Volf et al., 2020). Few studies have examined the relationship between plant metabolomic composition and major climatic or environmental gradients for specific woody plant lineages (Fine et al., 2006; Sam et al., 2020; Volf et al., 2020) and even fewer have done so at the community scale (Sedio et al., 2018b).
Here, we compare metabolomic and morphological traits among 140 species from seven forests in the US and Canada, representing 218 unique species-site combinations. We use untargeted metabolomics methods based on data generated with liquid chromatography-tandem mass spectrometry to identify, classify, and compare foliar metabolites and to quantify the metabolomic similarity of species in each forest community. We compare metabolomic variation with that of morphological traits to ask: (i) do metabolomic and morphological traits co-vary among species or communities?; (ii) do metabolomic and morphological traits show similar patterns of phylogenetic signal across species?; and (iii) do metabolomic and morphological traits show similar associations with large-scale gradients in precipitation and temperature? Finally, we test the hypotheses that abiotic stress reduces morphological and metabolomic trait diversity but increases investment in foliar metabolites in cold and dry climates and that biotic interactions increase metabolomic diversity and decrease similarity in warm and wet climates in North American tree communities.
Materials and Methods
Study Sites and Species
We studied the chemical and functional ecology of seven large-scale (median 20 ha) forest dynamics plots coordinated by the Smithsonian Forest Global Earth Observatory (hereafter ForestGEO) in the U.S. and Canada. In each plot, all free-standing woody stems ≥1 cm diameter at breast height (dbh, defined as 1.3 m height) are identified, measured, and mapped at regular census intervals (Anderson-Teixeira et al., 2015; Davies et al., 2021). The seven plots span 23.6° latitude, 16.2°C mean annual temperature, and 2,115 mm mean annual precipitation, and support from 10 to 68 free-standing woody species ≥1 cm dbh (Table 1; Davies et al., 2021).
Table 1. Variation in latitude, mean annual temperature, mean annual precipitation, census area, and species richness of seven forest plots.
Three western forests are characterized by predominantly coniferous overstories. Scotty Creek, Northwest Territories (NT), Canada is a subarctic boreal forest dominated by Picea mariana (black spruce) on permafrost plateaus and Larix laricina (larch) on permafrost-free wetlands, with dense patches of Betula glandulosa (dwarf birch) (Dearborn et al., 2020). Cedar Breaks, UT, is a subalpine spruce-fir forest dominated by Abies bifolia (subalpine fir), Populus tremuloides (quaking aspen), Picea engelmannii (Engelmann spruce), Pinus flexilis (limber pine), Pinus longaeva (bristlecone pine), and Picea pungens (blue spruce) (Furniss et al., 2017). Wind River, WA, is a moist montane forest characterized by an overstory of Tsuga heterophylla (western hemlock) and Pseudotsuga menziesii (Douglas-fir) and an understory of diverse Ericaceae (Gaultheria, Menziesia, Rhododendron, and several Vaccinium) (Lutz et al., 2013).
Four eastern forests are characterized by predominantly broad-leaved overstory trees. Tyson Research Center, MO, and Michigan Big Woods, MI, are both characterized by several species of Quercus (oaks) and Carya (hickories) in the overstory (Spasojevic et al., 2016; Allen et al., 2020, 2018), though the Michigan plot may be undergoing a shift in composition, as recruitment is dominated by Acer rubrum (red maple) and Prunus serotina (black cherry) (Allen et al., 2018). The Smithsonian Conservation Biology Institute (SCBI) forest plot represents the eastern deciduous forest of the Blue Ridge, with abundant Liriodendron tulipifera (tulip poplar), Quercus and Carya (Bourg et al., 2013). The Smithsonian Environmental Research Center (SERC) forest plot is composed of upland secondary forest characterized by Liriodendron tulipifera, Quercus, Carya, Fagus grandifolia (beech), and Liquidambar styraciflua (sweetgum) in the overstory, but is bisected by a floodplain forest distinguished by a canopy of Fraxinus (ashes), Platanus occidentalis (sycamore), and Ulmus americana (elm).
Sampling and Extraction
We collected expanding, unlignified leaves that were between 50 and 90% fully expanded from saplings, shrubs, and small trees in the forest understory where possible at each site between June 2018 and July 2019. Three to five leaves from an individual were placed in a manila coin envelope and immediately flash frozen in liquid nitrogen in the field using a portable dewar (PrincetonCryo, Pipersville, PA, United States). Where possible, we sampled 5 individuals of each species recorded in each forest plot. In total, we sampled 140 species from the seven forest plots, representing 218 unique species-site combinations (Supplementary Table 1). In each of the seven plots, the species we sampled represented ≥64.0% of the species (median 91.1%) and ≥98.8% of the individuals (median 99.9%) recorded.
Leaf samples were stored at −80°C and shipped on dry ice to the Sedio Lab at the University of Texas at Austin, where they were freeze-dried and a 50–100-mg sample was pulverized using a Qiagen TissueLyser ball mill (Hilden, Germany). A 10-mg subsample was weighed and extracted with 1.8 ml 90:10 v/v methanol:water pH 5 overnight at 4°C and 300 rpm, centrifuged at 14,000 rpm for 30 min, and the supernatant removed and filtered for analysis using LC-MS.
Liquid Chromatography-Mass Spectrometry
We optimized UHPLC-MS parameters to detect and fragment metabolites representing a wide range in polarity and mass (Sedio et al., 2018a). Metabolomic extracts were separated using a Thermo Fisher Scientific (Waltham, MA, United States) Vanquish Horizon Duo ultra-high performance liquid chromatography (UHPLC) system with an Accucore C18 column with 150 mm length, 2.1 mm internal diameter, and 2.6-μm particle size. UHPLC buffer A (0.1% v/v formic acid in water) and buffer B (0.1% v/v formic acid in methanol) were employed in a solvent gradient from 5 to 100% buffer B over 18 min.
Separation of metabolites by UHPLC was followed by heated electrospray ionization (HESI) in positive mode using full scan MS1 and data-dependent acquisition of MS2 (dd-MS2) on a Thermo Fisher Scientific Q Exactive hybrid quadrupole-orbitrap mass spectrometer. We analyzed samples of three types: individual trees; species pools, consisting of pooled aliquots of all conspecific individuals for each species; and quality controls (QC), consisting of pools of aliquots of all species pools analyzed concurrently. For individuals, we collected an MS1 scan (115–1,725 m/z) at a resolution of 140,000. For species pools and QC samples, the MS1 full scan was at 70,000 resolution, followed by dd-MS2 at 17,500 resolution on the five most abundant precursors found in the MS1 spectrum. Automatic gain control target values were 1e6 for full scan MS1 and 1e5 for dd-MS2. Maximum ion injection times were 200 ms for full scan MS1, 100 ms for QC MS1, and 50 ms for MS2. For dd-MS2, we set the isolation window to 1.5 m/z and stepped collision energy at 20, 40, and 60. QC pooled samples were used to account for fluctuations in total ion intensity due to changes in temperature and atmospheric pressure over time.
Metabolomics Data Analysis
Raw data from the UHPLC-MS analyses were centroided and processed for peak detection, peak alignment, and peak filtering using MZmine2 (Pluskal et al., 2010), which groups chromatographic features into putative compounds based on molecular mass and LC retention time. We used the following parameter settings: mass detector method “centroid” with MS1 noise threshold 50,000 ion counts and MS2 noise threshold 0 ion counts; chromatogram builder module minimum highest intensity 35,000, absolute m/z tolerance 0.002 and ppm tolerance 10.0; deconvolution module method “local minimum search” with chromatographic threshold 0.9, minimum relative height 0.05, and peak duration range 0.0–0.3 min; isotope grouper module using absolute m/z tolerance 0.0015, ppm tolerance 7.0, retention-time tolerance 0.5; join aligner module using absolute m/z tolerance 0.0015, ppm tolerance 7.0, retention-time tolerance 0.5, weight for m/z vs. retention time 3:1, isotope absolute m/z tolerance 0.001, ppm tolerance 5.0, minimum absolute intensity 3,000, minimum score 0.6; Sirius export module merge mode “do not merge,” absolute m/z tolerance 0.001, ppm tolerance 20.0; GNPS export module filter rows “only with MS2.”
MZmine2 processing was performed for 11 batches of species. Each batch was uploaded to the Global Natural Products Social (GNPS) Molecular Networking platform (Wang et al., 2016) and used to generate a molecular network using the “feature-based molecular networking” method (Nothias et al., 2020) using the following parameter settings: precursor ion mass tolerance 0.02 Da, fragment ion mass tolerance 0.2 Da, minimum pairs cosine 0.7, minimum matched fragment ions 6, maximum shift between precursors 500 Da, network topK 10, maximum connected component size 100.
Each batch was then re-analyzed in GNPS using the “qemistree” tool to simultaneously infer molecular structures using Sirius (Dührkop et al., 2019) and CSI:FingerID (Dührkop et al., 2015), classify metabolites using ClassyFire (Djoumbou Feunang et al., 2016) and build a hierarchical dendrogram that reflects the structural similarity of unique metabolites using Qemistree (Tripathi et al., 2021). The output of the 11 batch analyses was integrated using the Qemistree plugin for Qiime (Bolyen et al., 2019; Tripathi et al., 2021). Compounds that occurred in blanks, such as contaminants and industrial surfactants, were removed from further analyses. The complete, combined foliar metabolome and Qemistree dendrogram can be found in Supplementary Tables 2, 3, respectively. The complete dataset is available as a MassIVE dataset on GNPS1. Links to the Feature-Based Molecular Network and Qemistree results on GNPS for each of the 11 batches can be found in Supplementary Table 4.
ClassyFire’s chemotaxonomic scheme places heterocyclic alkaloids in the superclass “organoheterocyclic compounds” rather than “alkaloids and derivatives.” Hence, to reorganize the alkaloids and reduce the number of chemical classes for downstream analyses, we modified the chemotaxonomic classes provided by ClassyFire to derive our own classes as follows: First, we defined “lipids” as the ClassyFire superclass “lipids and lipid-like molecules,” including terpenes and steroids. Second, we defined “organic acids” as the ClassyFire superclass “organic acids and derivatives.” Third, we defined “benzenoids” as all compounds in the ClassyFire superclasses “benzenoids” and “phenylpropanoids and polyketides,” including phenols, polyphenols, and flavonoids. Fourth, we defined “alkaloids” as all compounds in the ClassyFire superclass “alkaloids and derivatives,” as well as compounds in the superclass “organoheterocyclic compounds” that contain nitrogen. Finally, we defined “heterocyclic compounds” as all remaining compounds in the ClassyFire superclass “organoheterocyclic compounds.” The classifications we used can be found in the column “customclass” in Supplementary Table 2. Chemical superclasses and relative ion intensity of compounds that occurred in each forest plot were visualized on the Qemistree hierarchical dendrogram (Tripathi et al., 2021) using the Interactive Tree of Life web tool (Figure 1; Letunic and Bork, 2019). We did not define “lignans, neolignans, and related compounds” as a distinct superclass in downstream calculations because they were absent from many species in the young, expanding leaves we analyzed. Other chemical superclasses we included only in the whole-metabolome analyses included “allenes,” “carbides,” “hydrocarbon derivatives,” “hydrocarbons,” “nucleosides, nucleotide, and analogs,” “organic 1,3-dipolar compounds,” “organic oxygen compounds,” “organophosphorus compounds,” “organosulfur compounds,” and unclassified compounds. All five of the superclasses we examined include numerous defensive compounds, as common defenses such as polyphenols and flavonoids are included in the “benzenoids” superclass; terpenes, terpenoids, and steroids are included in the “lipids” superclass, and other anti-herbivore and antimicrobial compounds are included in the “heterocyclic compounds”and “organic acids” superclasses.
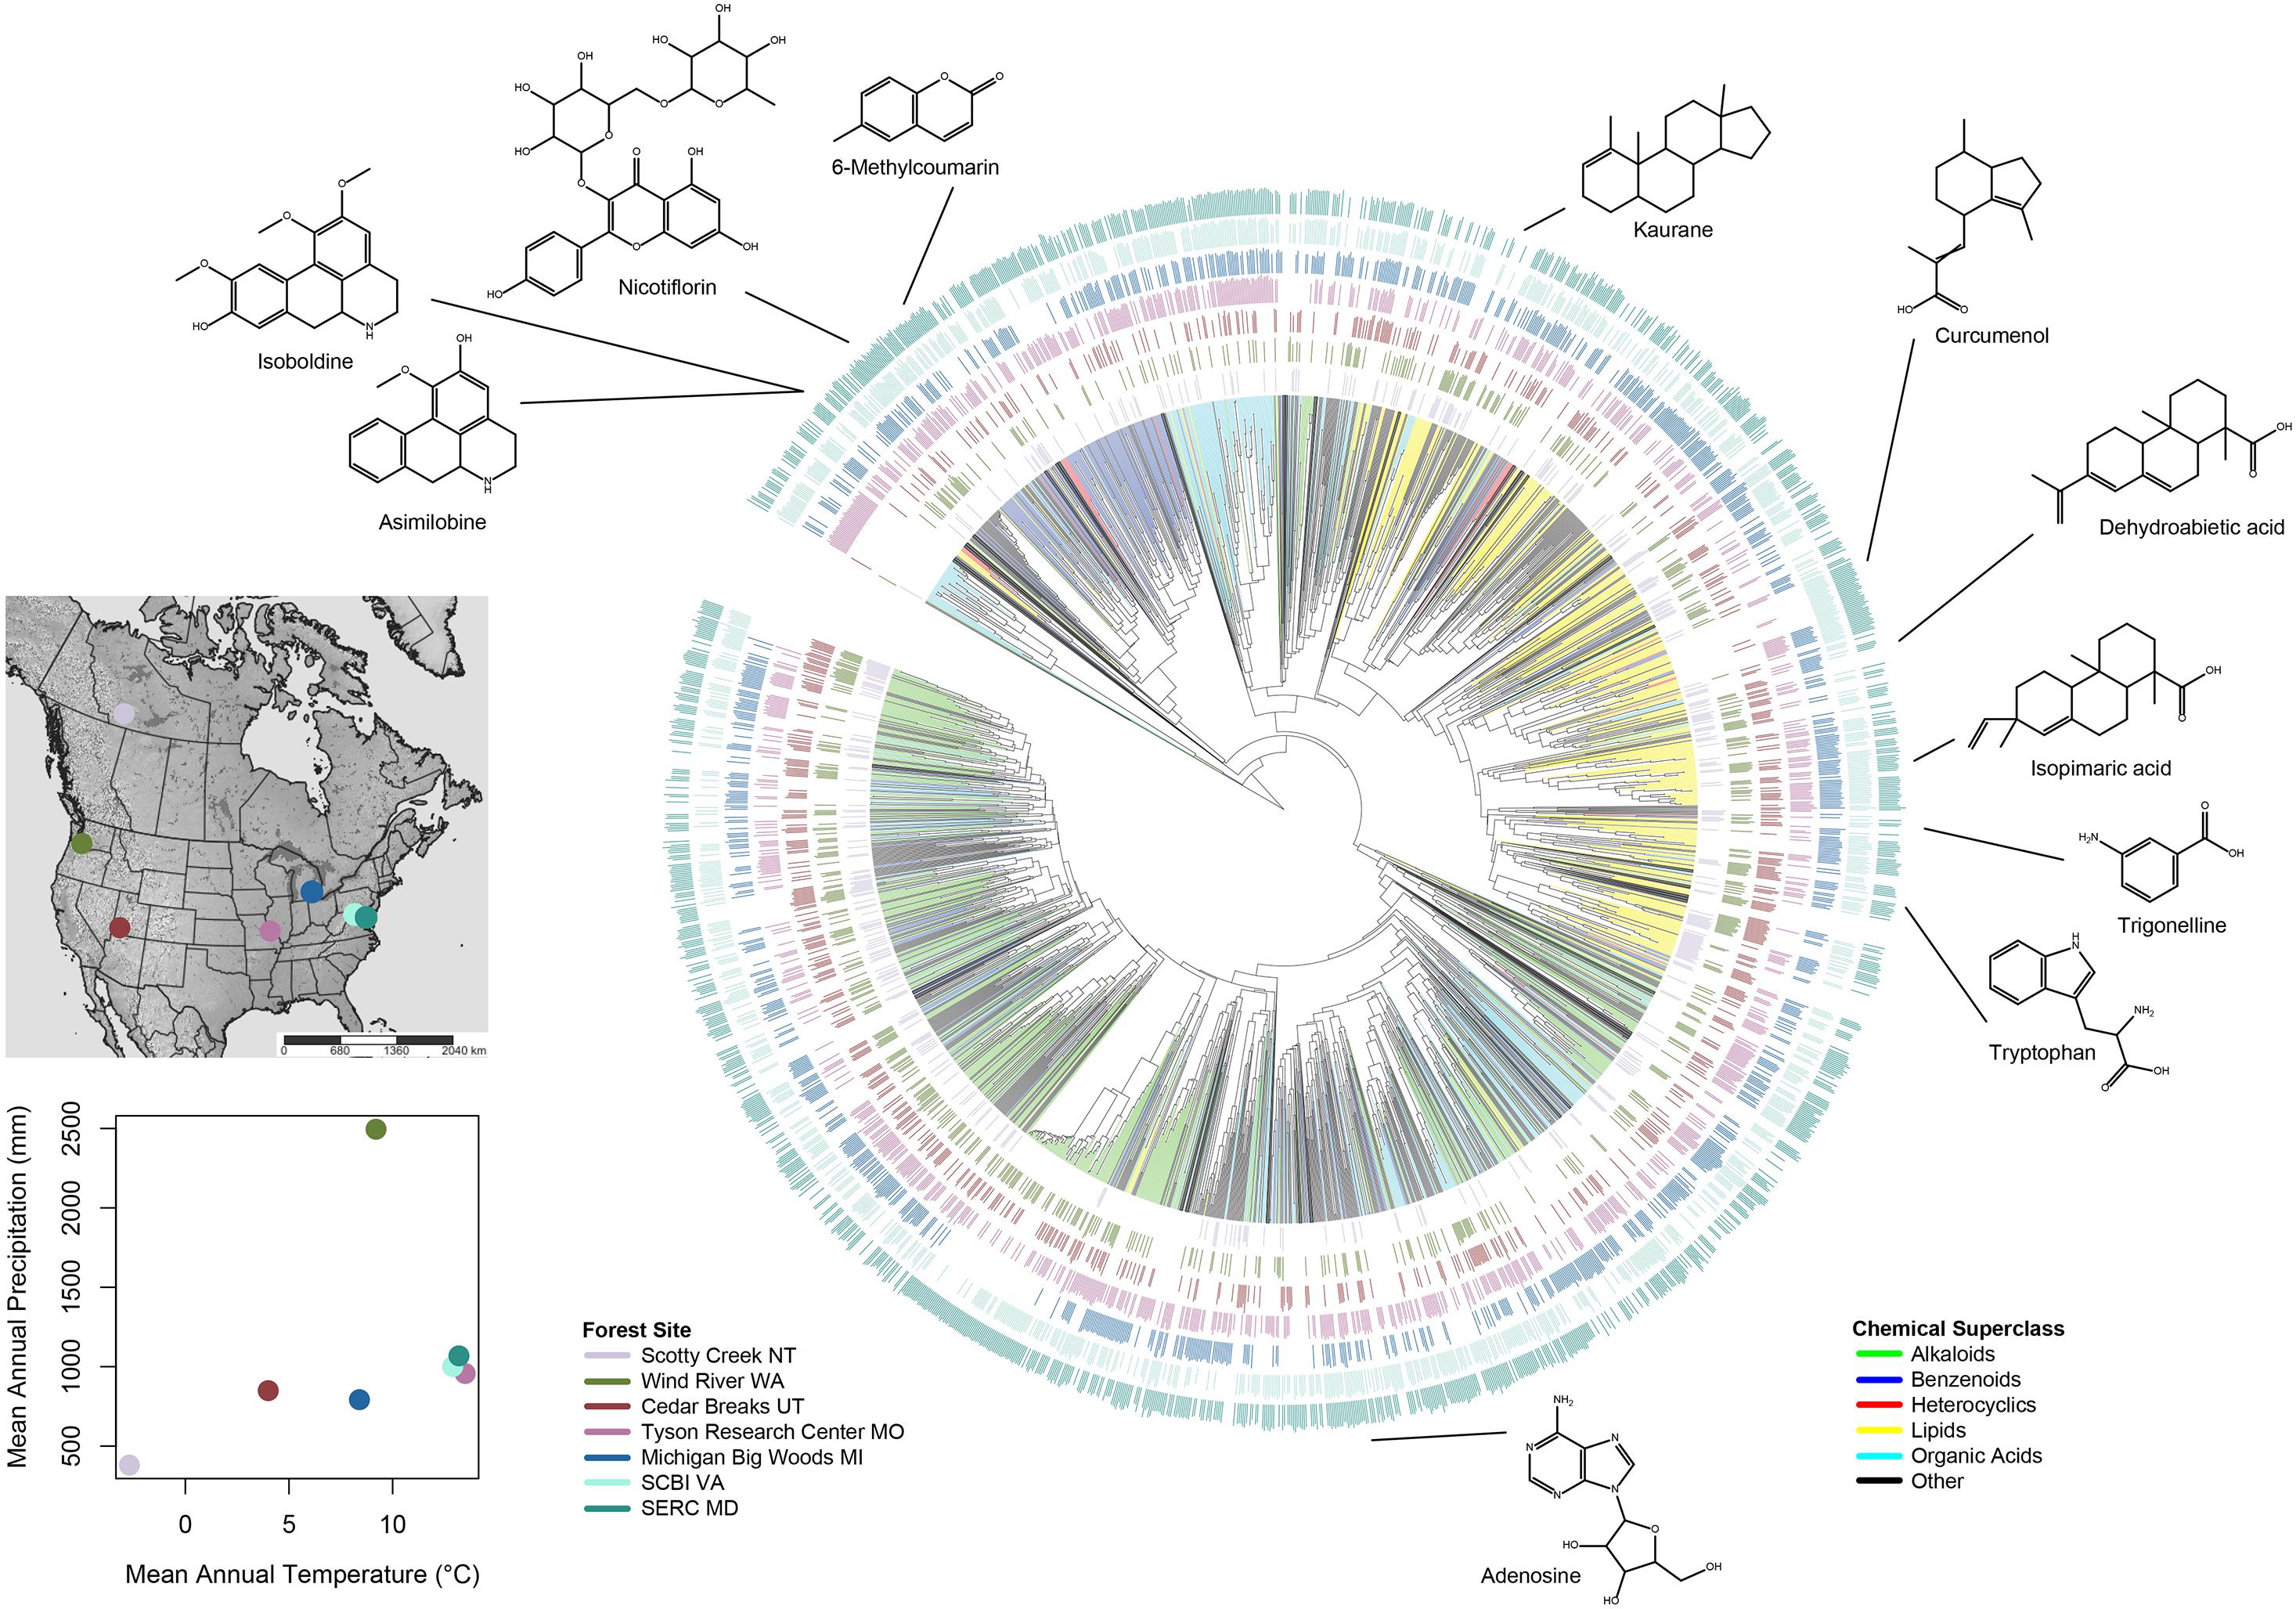
Figure 1. Hierarchical dendrogram of 13,480 foliar metabolites. Qemistree (Tripathi et al., 2021) represents the structural similarity of unique metabolites in the form of a “phylogeny,” a hierarchical dendrogram in which structurally related metabolites form sister pairs and clades. Branch color indicates the chemotaxonomic classification of the metabolite in one of five major chemical superclasses; black branches represent all other chemical classes. Colored interior branches represent branches for which all “descendent” branches were classified as the same superclass. Seven concentric bar plots represent the relative log ion intensity of metabolites in each of seven forest plots. The geographic location of each forest plot, mean annual precipitation (mm), and mean annual temperature (°C) are indicated in the inset.
Sedio et al. (2017) developed the chemical structural-compositional similarity (CSCS) metric to quantify the similarity of samples or species in a manner that accounts for the presence of identical compounds as well as the presence of structurally similar unique compounds in two samples. Here, we calculated CSCS for each species pair as the mean structural similarity of every pair of compounds found in either species, weighted by the ion intensity of each compound pair in the species compared. We calculated CSCS chemical similarity for every species pair in each forest plot for the whole metabolome and for each of the five major chemical classes.
Morphological Traits
To compare patterns in metabolomic trait diversity with patterns of morphological trait diversity we focused on three putatively important morphological traits: specific leaf area (SLA), wood density, and seed mass. Specific leaf area is associated with resource uptake strategy and tissue N, where high SLA represents a strategy to maximize carbon gain and relative growth rate (Reich et al., 1997). Wood density is associated with mortality rate, hydraulic lift and the relative mechanical strength of the plant (Enquist et al., 1999). Seed mass is related to dispersal ability and a reproductive strategy where species that produce few large seeds are thought to better tolerate poor site conditions and those that produce many small seeds are thought to be better dispersers (Muller-Landau, 2010).
Between 2012 and 2014 we measured morphological traits at three of our seven sites: Wind River, Tyson and SERC. At these three sites we collected sun-exposed leaves with minimal damage or senescence from each of 5 to 10 representative individuals of each species and fully hydrated the leaves in water tubes. For all species except conifers, we collected 3 leaves per individual. Due to the small size of conifer leaves (needles) we collected approximately 0.5 g of leaves (between 40 and 70 needles) per individual per species. We calculated leaf area (cm2) from scanned leaves and petioles using Image-J (Rasband, 2018). For compound species, we calculated leaf area as the mean leaflet area per leaf including petiolules (Pérez-Harguindeguy et al., 2016). For needle leaves we calculated the total area of all leaves and divided that area by the number of leaves collected. We calculated SLA (cm2/g) as leaf area per unit dry mass after leaves were dried in an oven at 60°C for 4 days. Using the branches from which leaves were collected we cut out a section that was 2.5 cm long and at least 1 cm in diameter. We calculated wood density (g/cm3) as the volume of the branch section per unit of dry mass after branch sections were dried in an oven at 60°C for 4 days. Seed mass data were compiled from the Kew Royal Botanical Gardens Seed Information Database2. For the other four sites morphological trait data was either downloaded from existing databases (Harrison et al., 2020; Kattge et al., 2020) or we used species means from other sites (i.e., mean trait values for Fraxinus americana at Tyson were applied to Michigan Big Woods as this species is found at both sites). Trait values used in the present study can be found in Supplementary Table 5.
Statistical Analysis
To examine patterns of covariance among metabolomic and morphological traits and describe variation in species traits among sites we conducted a principal components analysis (PCA). Total ion abundance of all compounds in each superclass was summed for each species-by-site and all traits were scaled prior to analysis. Principal components analysis was conducted using the “principal” function in R version 3.6.2 (R Core Team, 2020). Species scores and trait loadings can be found in Supplementary Tables 5, 6, respectively. For comparison, we conducted a phylogenetic PCA using the R package phytools (Revell, 2012). However, this necessitated excluding species with missing values.
To generate a phylogeny representing all 140 species in the seven forest plots, we queried the Zanne et al. (2014) megaphylogeny using “phylomatic” (Webb and Donoghue, 2005). We then used phylogenetically independent contrasts (PICs) to examine the relationship between chemical similarity and phylogeny, and to test for phylogenetic signal. We calculated the PIC for each node in the phylogeny as the mean CSCS for all pairs of species for which the node represents the most recent common ancestor. Sedio et al. (2018b) refer to this metric as CSCSmrca. Here, we calculated 1–CSCSmrca to represent metabolomic disparity for ease of comparison with morphological disparity, which we calculated as the difference between the trait values of the descendent nodes or terminal taxa for each node in the phylogeny (i.e., the phylogenetic contrast in trait values). To evaluate phylogenetic signal, we regressed metabolomic phylogenetic contrasts (1- CSCSmrca) and morphological phylogenetic contrasts against log-transformed phylogenetic distance. Tests of phylogenetic signal have little statistical power when applied to samples with few taxa (Revell, 2010), hence we assessed phylogenetic signal for metabolic and morphological traits for 140 species, rather than for each community. We corroborated our CSCSmrca method by measuring Blomberg’s K (Blomberg et al., 2003) for the three morphological traits.
To examine the differences in interspecific variation and the chemical space occupied by species in each forest plot and in taxonomic clades, we used non-metric multidimensional scaling (NMDS) to reduce the chemical space into two dimensions using the MASS package in R (Ripley et al., 2013).
For each plot, we calculated complementary metrics of functional trait diversity that are appropriate for metabolomic and morphological traits, respectively. For the metabolomic traits we calculated the abundance-weighted mean CSCS among co-occurring species (CSCSmean). First, we calculated the mean CSCS for each species to all other species, weighted by abundance. We then calculated the mean of these species-level similarity scores, weighted by abundance. We also considered metabolomic richness, which we defined as the number of compounds detected in each forest community.
For morphological traits we calculated three complementary metrics of functional diversity: Community weighted mean (CWM) trait values, functional richness (FRic), and functional dispersion (FDis). Community-weighted mean (CWM) trait values describe the functional composition of a community and are calculated as the abundance-weighted trait averages (Garnier et al., 2004) of each trait. Functional richness measures the ranges of trait values in a community, and is calculated as the standardized difference between the maximum and minimum functional values present in the community (Mason et al., 2005). Functional dispersion, which indicates the degree of trait dissimilarity among species, is calculated as the abundance-weighted mean distance of each species in trait space to the centroid of all species and is statistically independent of species richness (Laliberté and Legendre, 2010). We repeated metabolomic and morphological community calculations using species basal area to weight the CSCS, CWM, and FDis scores and found similar patterns as the abundance weighted patterns, so we focus only on abundance weighted results for simplicity.
To assess relationships among chemical and morphological traits of woody plant assemblages and climatic variables, we regressed plot-level measures of the diversity and similarity of traits with log-transformed mean annual precipitation (log10MAP), mean annual temperature (MAT), and species richness. We reported significant relationships for p < 0.05 and marginally significant relationships for p < 0.07.
Results
We detected 13,480 compounds, ranging from 116.0705 to 1181.8350 Daltons (Da), in foliar extracts from all 140 species. We generated a predicted molecular structure and a chemotaxonomic classification for 11,415 and 10,376 of these compounds, respectively. A total of 8,323 classified compounds were represented by the superclasses “alkaloids,” “benzenoids,” “lipids,” “organic acids,” and “heterocyclic compounds” as we defined them (62%; Figure 1 and Supplementary Table 2). Among compounds classified into one of these five superclasses, we generated a predicted molecular structure for 8,323 compounds (99.6%), but retrieved an MS2 library match from GNPS spectral libraries for only 1,032 compounds (12.3%).
We found that the five metabolomic superclasses and the three morphological traits we considered represented largely orthogonal axes of variation in the PCA (Figure 2 and Supplementary Table 6), but there was some covariation among metabolomic and morphological traits (particularly on PC3). Alkaloids, lipids, and organic acids loaded positively on the first PCA axis, which explained 26% of the variation among species. SLA and wood density loaded on PCA axis 2, which explained 16% of the variation among species. Lastly, heterocyclic compounds, seed mass and benzenoids loaded on PCA axis 3, which explained another 16% of the variation among species (Supplementary Table 6). Phylogenetic PCA carried out on a subset of species for which all traits were measured or available was broadly concordant with non-phylogenetic PCA, as metabolomic and morphological traits represented orthogonal axes of variation (Supplementary Figure 1).
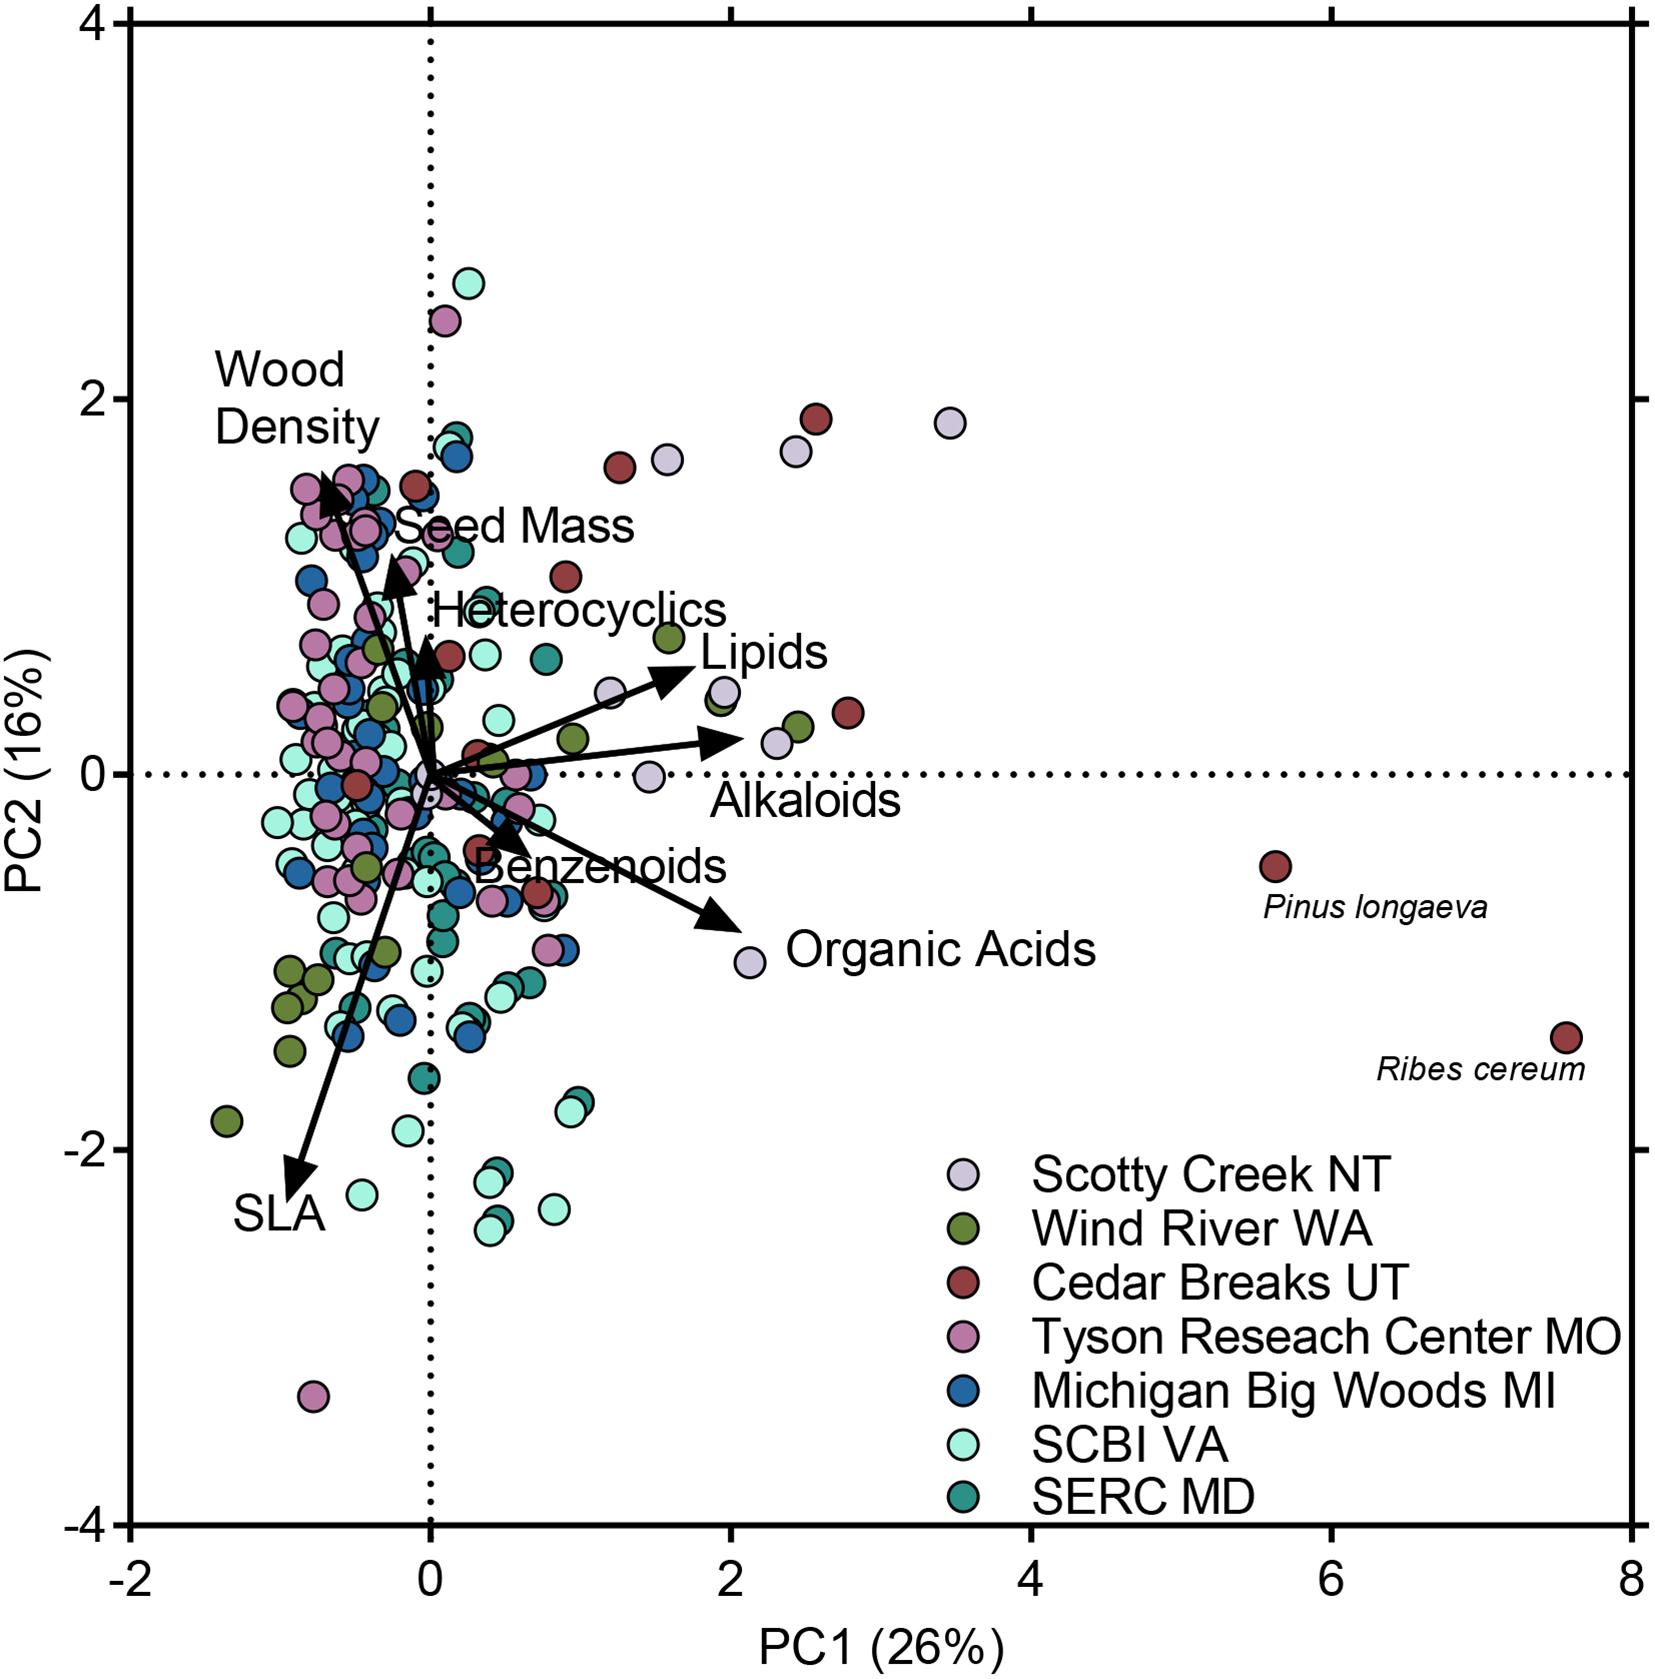
Figure 2. Principal components analysis of variation among species in three morphological traits and in total ion intensity in five chemical superclasses. Loadings for chemical superclasses reflect species means in total ion intensity of all compounds classified in each superclass. Loadings for morphological traits reflect species means. Points represent 140 unique species; colors represent species occurrences in seven forest plots. Species that occurred in >1 forest plot contributed only a single observation (the species mean) to the principal components analysis, but are visually represented by jittered points, the colors of which reflect the species incidence in each forest plot. See Supplementary Table 5 for species scores and Supplementary Table 6 for trait loadings.
Phylogenetic signal varied among metabolomic and morphological traits. Metabolomic disparity for all foliar metabolites increased with log phylogenetic distance (Figure 3A). Likewise, disparity increased with log phylogenetic distance when measured in terms of alkaloids, benzenoids, lipids, and SLA (Figures 3B,C,E,G). In contrast, metabolomic or morphological disparity was unrelated to phylogeny for heterocyclic compounds, organic acids, seed mass, and wood density (Figures 3D,F,H,I). Blomberg’s K and test for phylogenetic signal for morphological traits corroborated our approach, as SLA exhibited weak, but significant phylogenetic signal (K = 0.086, p = 0.002), whereas seed mass (K = 0.034, p = 0.573) and wood density (K = 0.024, p = 0.213) did not.
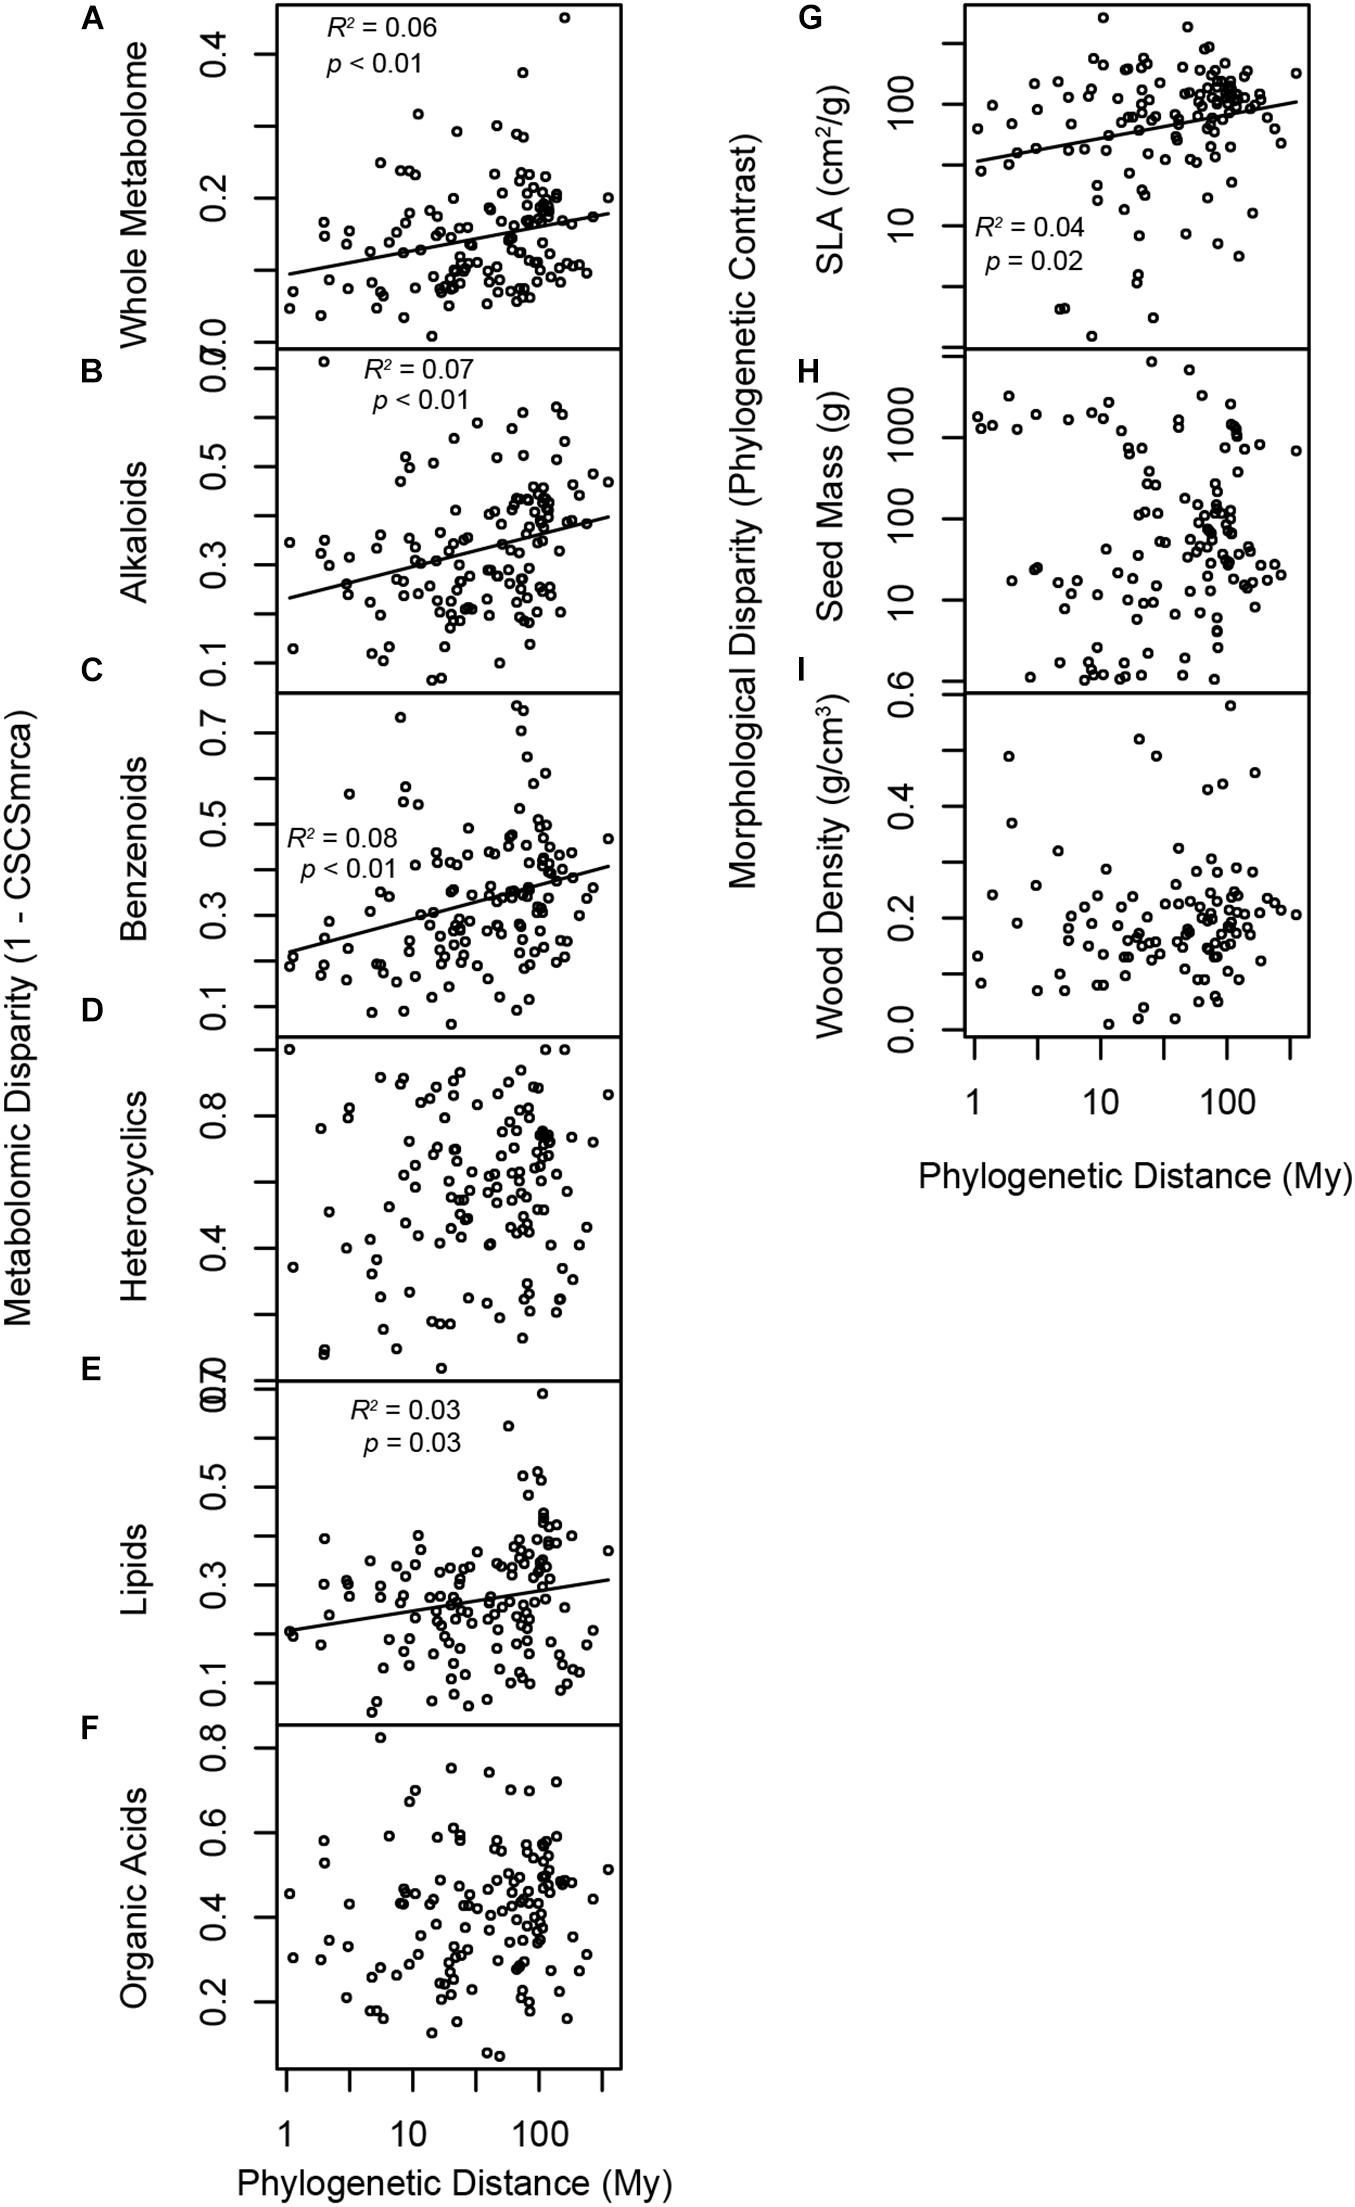
Figure 3. Phylogenetic signal in the species pool and morphological traits. Panels illustrate relationships between phylogenetic distance and species disparity with respect to (A) the whole metabolome, (B) alkaloids, (C) benzenoids, (D) heterocyclic compounds, (E) lipids, (F) organic acids, (G) SLA, (H) seed mass, and (I) wood density. Metabolomic disparity is 1-CSCSmrca, where CSCSmrca is the mean chemical similarity of species for which a phylogenetic node represents the most recent common ancestor. Morphological disparity is the phylogenetic contrast in trait values at a phylogenetic node. Traits that evolve according to Brownian motion, or phenotypic drift after cladogenesis permits departure from a shared ancestral state, are expected to exhibit increasing disparity with log-transformed phylogenetic distance.
The NMDS ordination illustrates the chemical space represented by the 218 unique species-by-site combinations (Figures 4, 5), as well as highlighted clades (Figure 4) and each forest community (Figure 5). Clades varied considerably in the breadth of the chemical space they occupied. Gymnosperms occupied a consistent neighborhood in NMDS chemical space, with the exception of the chemically very distinct Taxus brevifolia (Figure 4A). In contrast, Betulaceae and Ericaceae occupied broad areas of chemical space, reflecting the low metabolomic similarity among species in those families (Figures 4C,D).
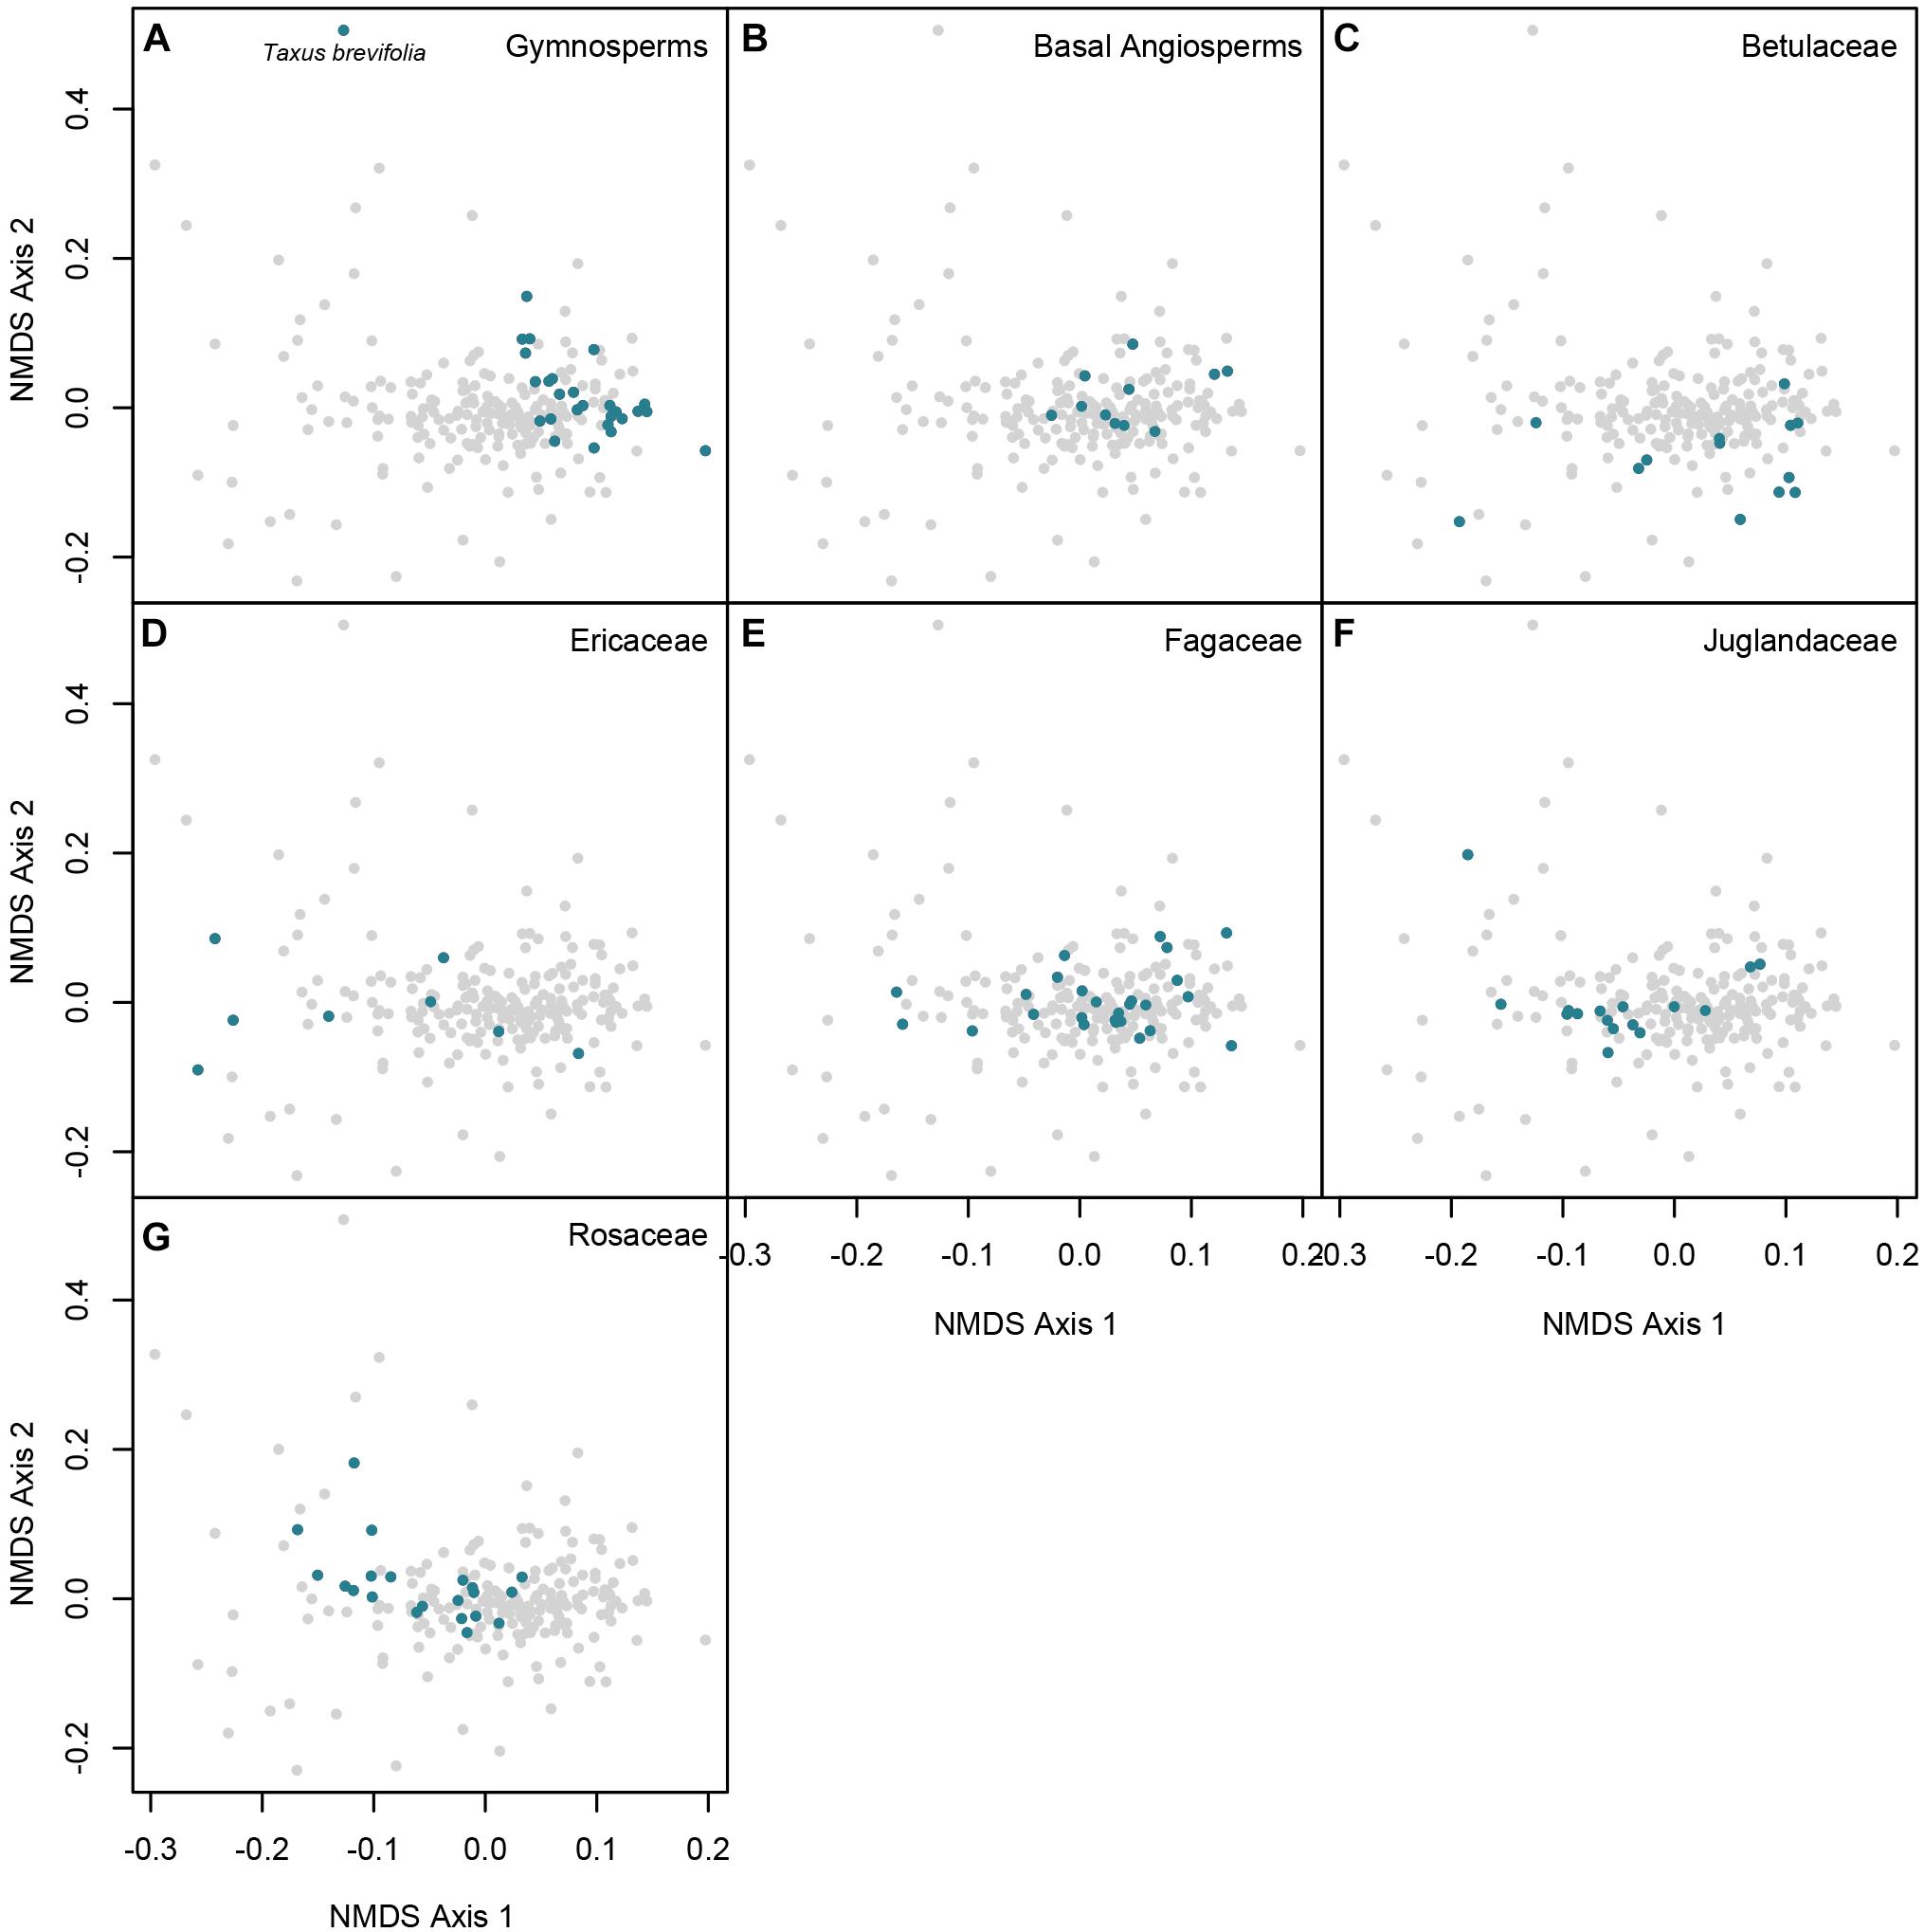
Figure 4. Non-metric multidimensional scaling of pairwise CSCS chemical similarity for 218 populations of 140 woody plant species. Panels highlight species that are (A) gymnosperms, (B) basal Angiosperms, (C) Betulaceae, (D) Ericaceae, (E) Fagaceae, (F) Juglandaceae, and (G) Rosaceae. Each point represents a species-site population, and the distances between points reflect the pairwise CSCS chemical similarity between all pairs of species-site populations, represented in two dimensions. Colors represent the taxonomic family or clade of the species.
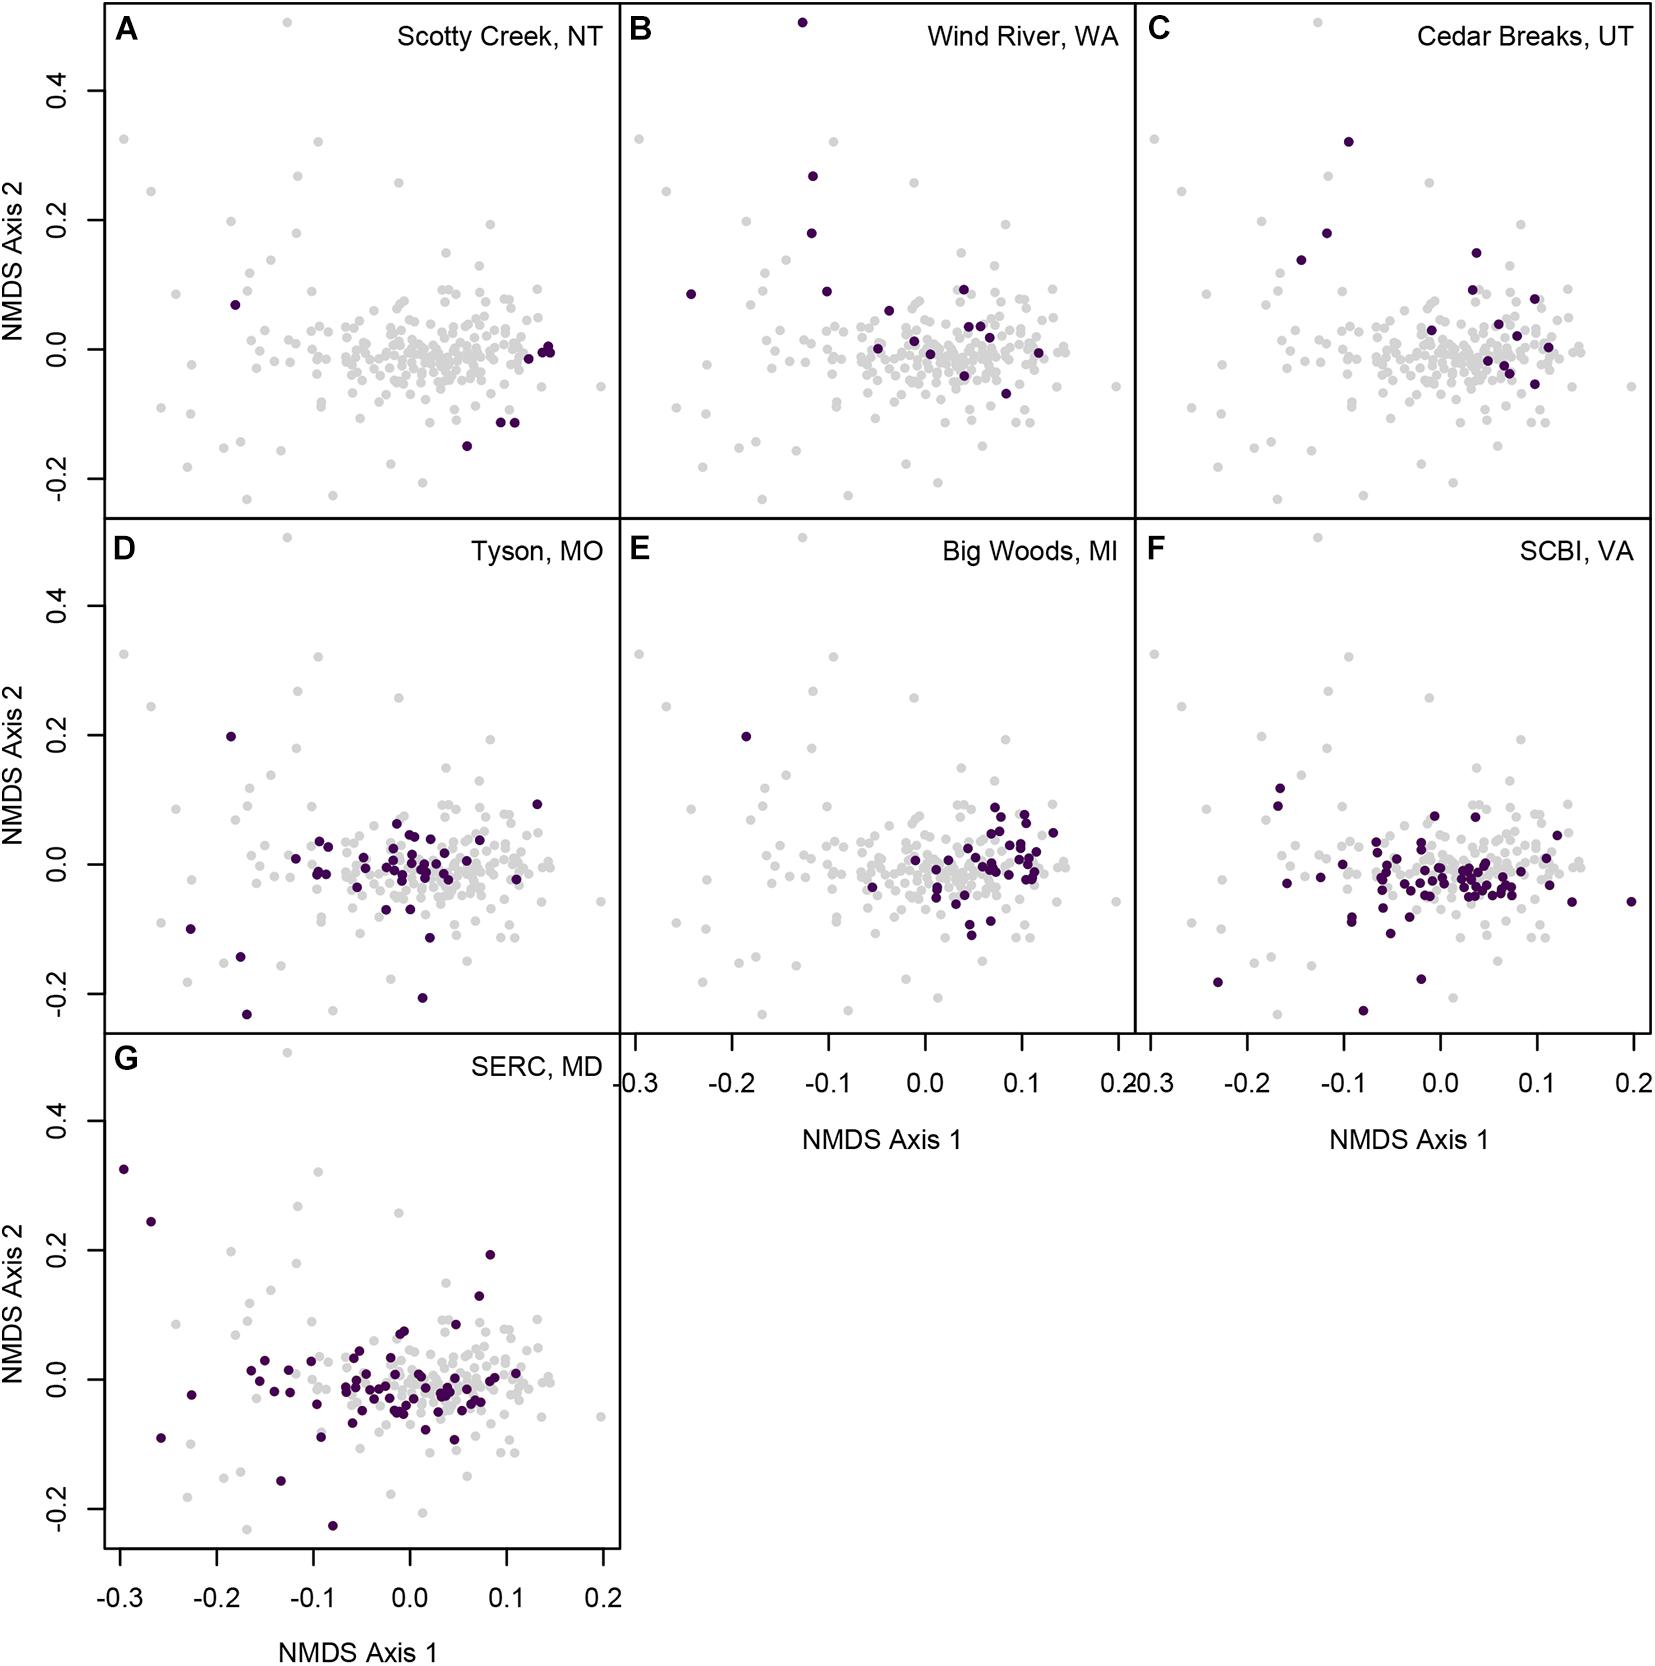
Figure 5. Non-metric multidimensional scaling of pairwise CSCS chemical similarity for 218 populations of 140 woody plant species. Panels illustrate the chemical similarity of species that occur at (A) Scotty Creek, NT, (B) Wind River, WA, (C) Cedar Breaks, UT, (D) Tyson Research Center, MO, (E) Michigan Big Woods, Michigan, (F) SCBI, VA, and (G) SERC, MD. Each point represents a species-site population, and the distances between points reflect the pairwise CSCS chemical similarity between all pairs of species-site populations, represented in two dimensions. Colors represent the forest plot in which the species population occurred.
Abundance-weighted metabolomic similarity of co-occurring species decreased with MAP among the seven forest plots (Figure 6A). Results for chemical superclasses largely reflected those for the whole metabolome (Supplementary Figure 2). Species were less similar with respect to alkaloids in forest plots with greater MAP (Supplementary Figure 2A). However, co-occurring species were only marginally less similar with respect to heterocyclic compounds and organic acids in forests with greater MAP (Supplementary Figure 2C,E), and similarity with respect to benzenoids and lipids was not related to precipitation among the seven sites (Figures 6B,D).
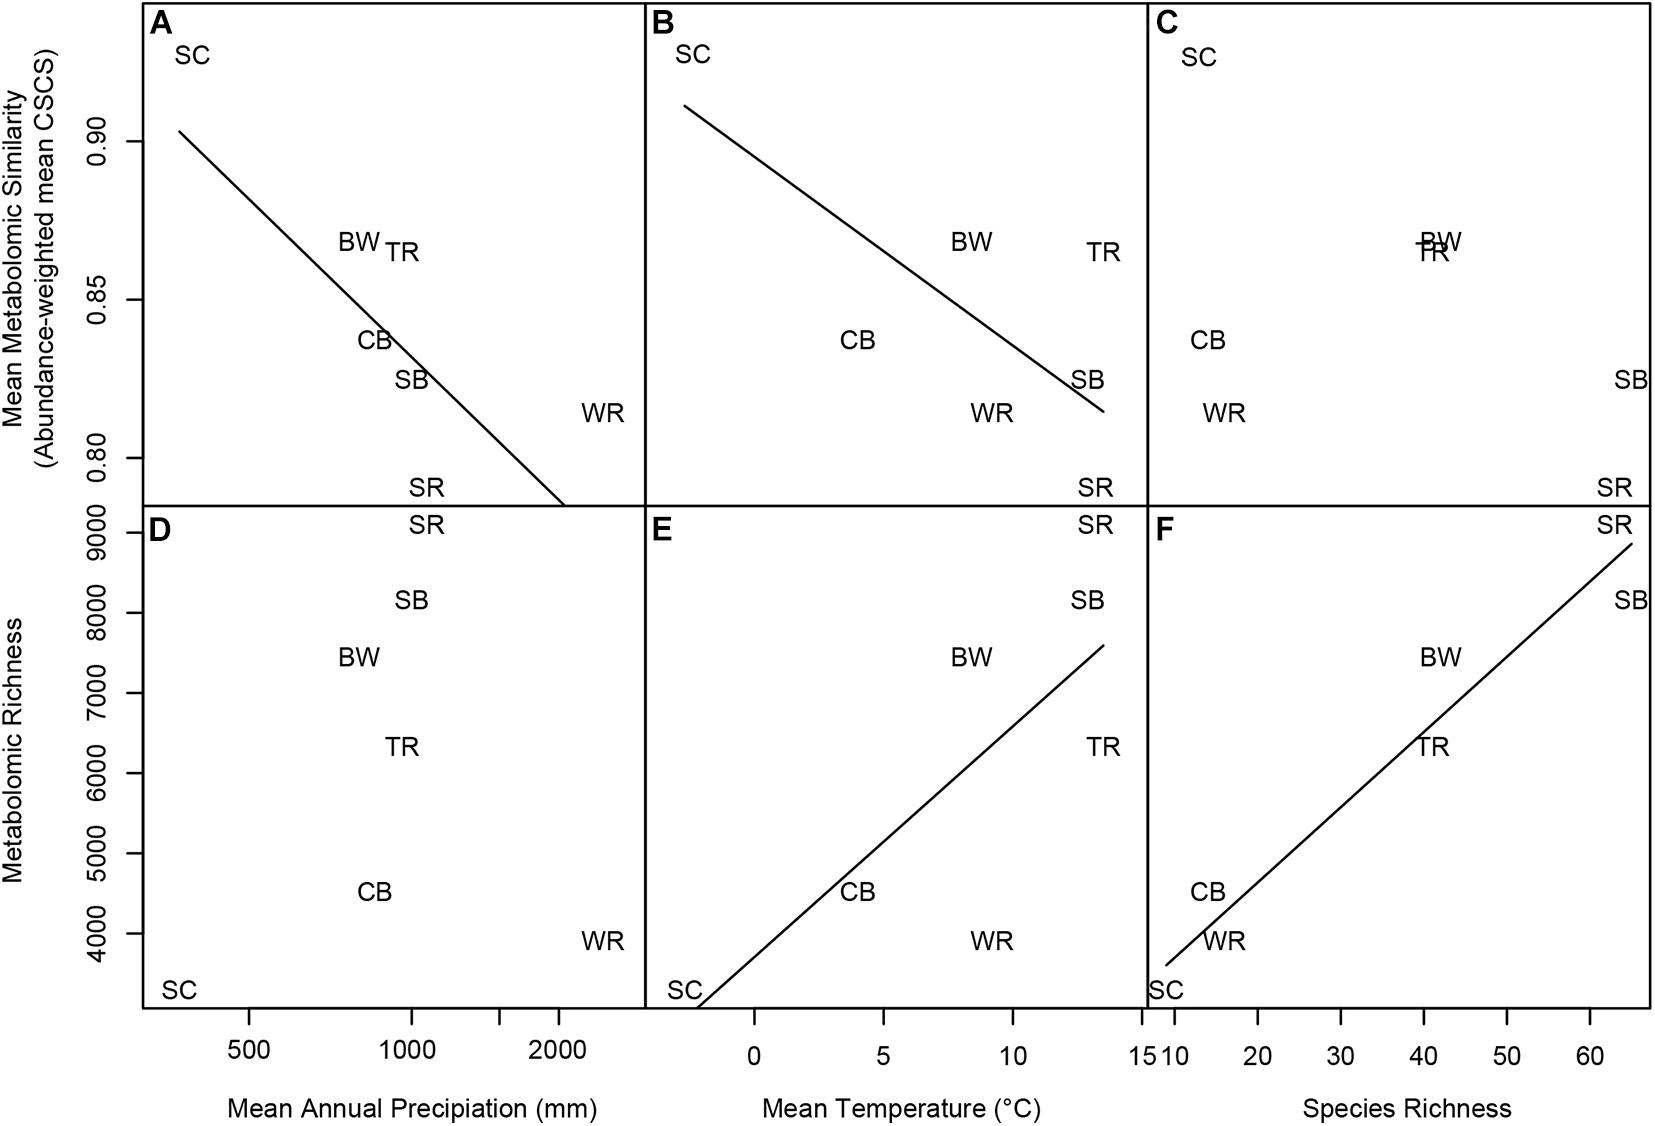
Figure 6. Variation in metabolomic similarity and richness vs. log10 MAP, MAT, and species richness. Panels represent linear regressions between (A) mean metabolomic similarity and MAP, (B) mean metabolomic similarity and MAT, (C) mean metabolomic similarity and species richness, (D) metabolomic richness and MAP, (E) metabolomic richness and MAT, and (F) metabolomic richness and species richness. Panels a, b, and c represent regressions of abundance-weighted CSCS metabolomic similarity of co-occurring species at each site vs. log10 MAP, MAT, and species richness, respectively. Panels d, e, and f represent regressions of metabolite richness with log10 MAP, MAT, and species richness, respectively. Significant regressions are indicated by a solid line. Forest plot codes are: SC, Scotty Creek, NT; WR, Wind River, WA; CB, Cedar Breaks, UT; TR, Tyson Research Center, MO; BW, Michigan Big Woods, MI; SB, Smithsonian Conservation Biology Institute (SCBI), VA; and SR, Smithsonian Environmental Research Center (SERC), MD.
Abundance-weighted metabolomic similarity of co-occurring species also decreased with MAT among the seven forest plots (Figure 6B). Likewise, similarity with respect to all five chemical superclasses decreased with MAT among the forest sites (Supplementary Figures 2F–J). In contrast, abundance-weighted metabolomic similarity was not related to species richness (Figure 6C), though similarity with respect to benzenoids and lipids decreased with species richness among the sites (Supplementary Figures 2L,N).
Metabolomic richness was unrelated to MAP among the seven sites (Figure 6D). Likewise, richness of compounds in all five chemical superclasses was unrelated to MAP (Supplementary Figures 3A–E). In contrast with MAP, metabolomic richness increased significantly with MAT among the seven forest plots (Figure 6E). Alkaloid richness and that of benzenoids also increased with MAT (Supplementary Figures 3F,G), while the increase in richness of heterocyclic compounds and organic acids was marginally significant with MAT among sites (Supplementary Figures 3H,J). Only lipid richness was unrelated to variation in MAT (Supplementary Figure 3I). Metabolic richness as a whole (Figure 6F), and with respect to all five chemical superclasses (Supplementary Figures 3K–O), increased significantly with species richness among forest plots.
Morphological trait dispersion with respect to SLA increased significantly with MAP among the seven forest plots (Figure 7A). However, dispersion with respect to seed mass and wood density was unrelated to MAP (Figures 7B,C). Morphological trait dispersion was unrelated to MAT for all three morphological traits (Figures 7D–F).
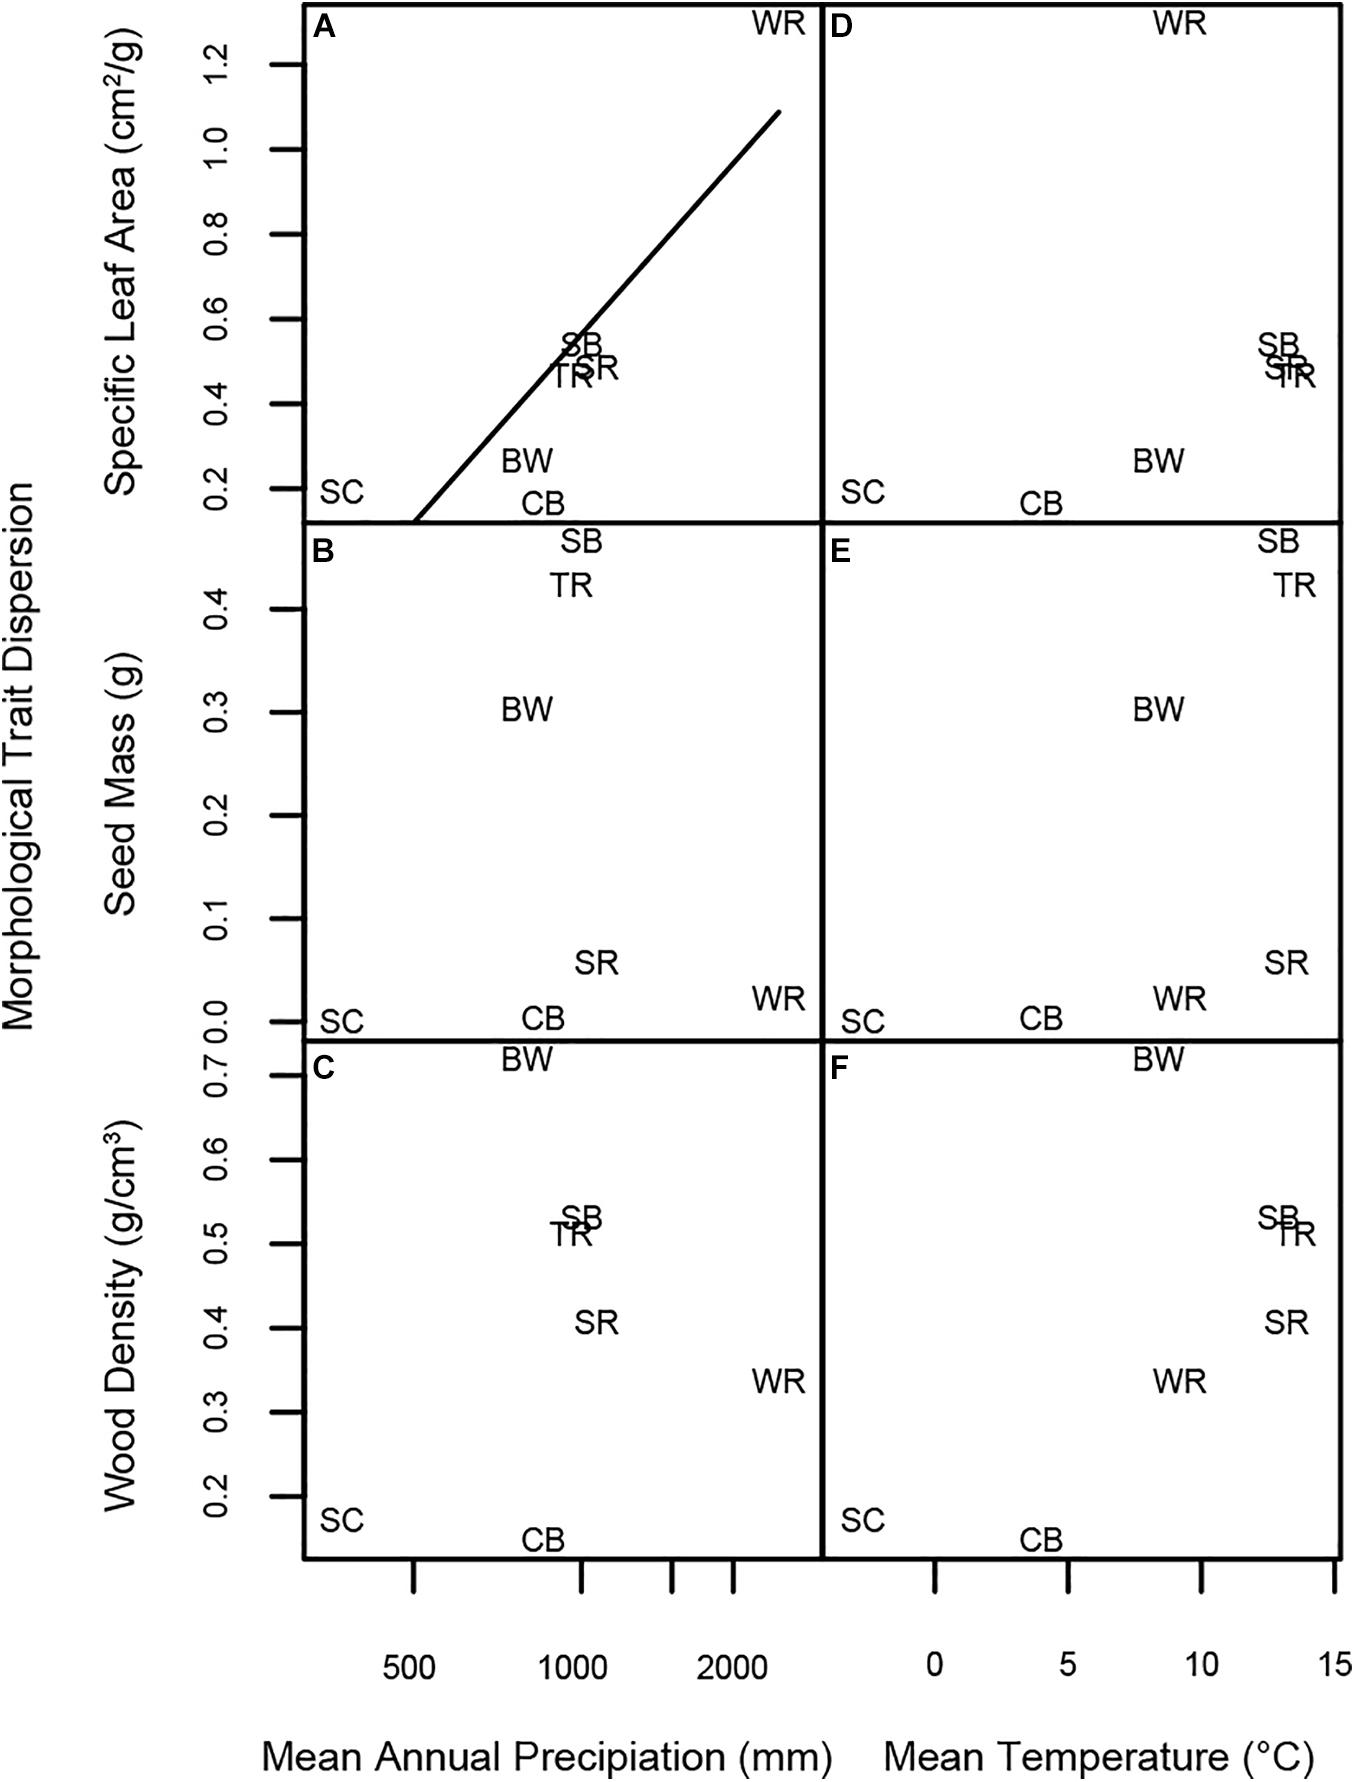
Figure 7. Linear regressions of morphological trait dispersion at each forest site vs. log MAP, MAT, and species richness. Panels represent linear regressions between trait dispersion of (A) SLA and MAP, (B) seed mass and MAP, (C) wood density and MAP, (D) SLA and MAT, (E) seed mass and MAT, and (F) wood density and MAT, respectively. Significant regressions are indicated by a solid line; non-significant regressions with p < 0.08 are represented by a dashed line. Forest plot codes are: SC, Scotty Creek, NT; WR, Wind River, WA; CB, Cedar Breaks, UT; TR, Tyson Research Center, MO; BW, Michigan Big Woods, MI; SB, Smithsonian Conservation Biology Institute (SCBI), VA; and SR, Smithsonian Environmental Research Center (SERC), MD.
Morphological trait richness was unrelated to MAP for all three morphological traits (Figures 8A–C). Trait richness defined in terms of SLA was unrelated to MAT (Figure 8D). However, seed mass richness increased marginally significantly with MAT (Figure 8E), and wood density richness increased significantly with MAT (Figure 8F).
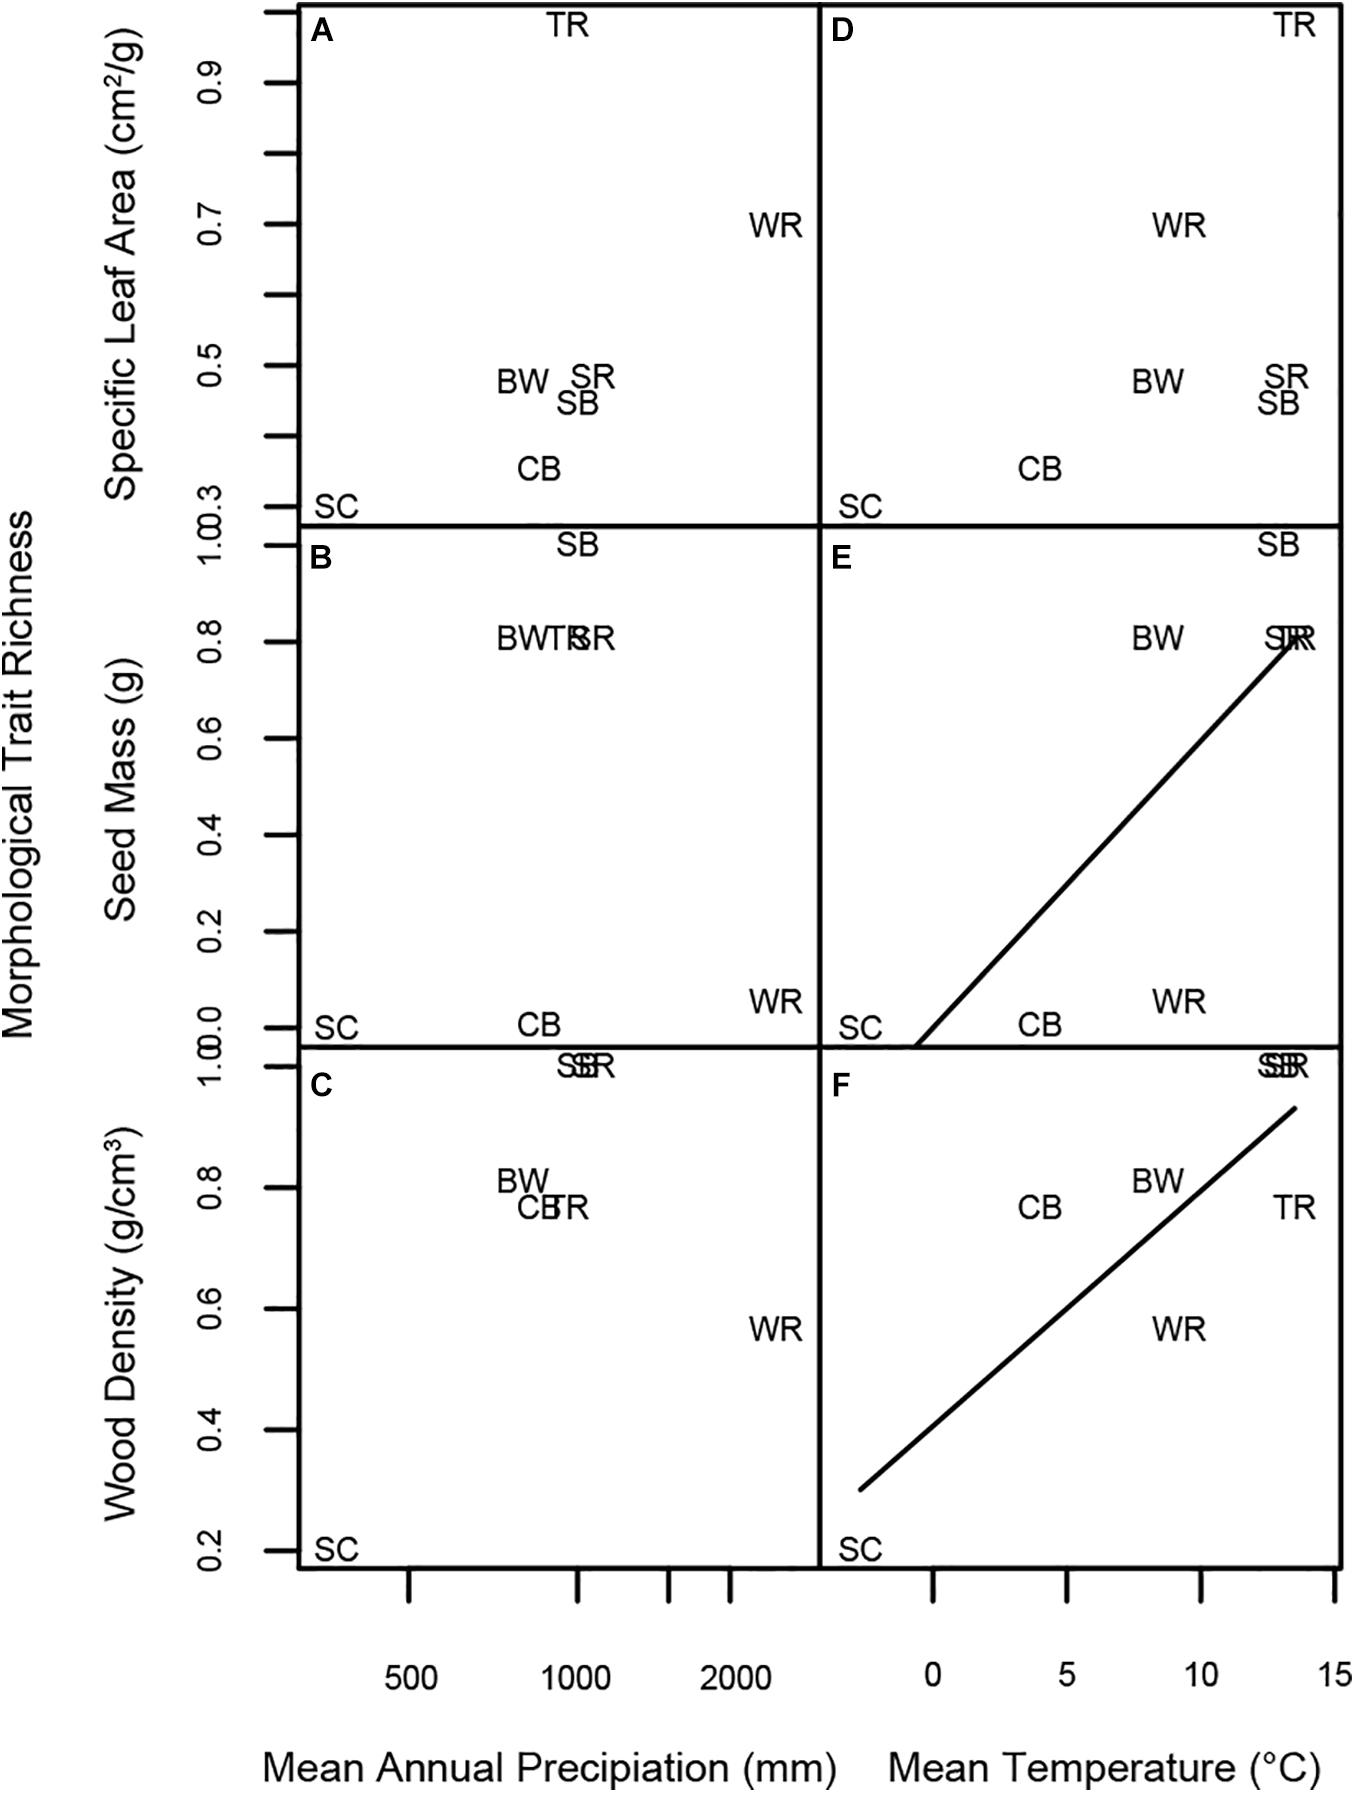
Figure 8. Linear regressions of morphological trait richness at each forest site vs. log MAP, MAT, and species richness. Panels represent linear regressions between trait richness of (A) SLA and MAP, (B) seed mass and MAP, (C) wood density and MAP, (D) SLA and MAT, (E) seed mass and MAT, and (F) wood density and MAT, respectively. Significant regressions are indicated by a solid line; non-significant regressions with p < 0.08 are represented by a dashed line. Forest plot codes are: SC, Scotty Creek, NT; WR, Wind River, WA; CB, Cedar Breaks, UT; TR, Tyson Research Center, MO; BW, Michigan Big Woods, MI; SB, Smithsonian Conservation Biology Institute (SCBI), VA; and SR, Smithsonian Environmental Research Center (SERC), MD.
Discussion
A Comparison of Metabolomic and Morphological Trait Variation
The seven forest plots represented a wide range of variation in precipitation, temperature and species richness within the temperate and boreal zones (Table 1; Anderson-Teixeira et al., 2015). Accordingly, the functional strategies of species present at each of these seven sites varied along these major gradients. This was reflected in variation in both the morphological traits, and in quantitative investment in broad chemical superclasses, which represent largely orthogonal axes of variation (Figure 2). Alkaloids, lipids, and organic acids loaded on the first PCA axis. All three superclasses include numerous anti-herbivore and antimicrobial defense compounds. These include terpenes, terpenoids, and steroids classified among the lipids. The lipid superclass also contains fatty acids that make up oils and waxes that are important mediators of tolerance to abiotic stresses such as drought and freezing temperatures (Uemura and Steponkus, 1994). Interestingly, two key morphological traits, SLA and wood density, both loaded on PCA axis 2 (Figure 2) representing an uncorrelated orthogonal axis to the metabolomic traits on PC1. Specific leaf area is typically associated with resource uptake strategy, where high SLA represents a strategy to maximize carbon gain and relative growth rate (Reich et al., 1997), while wood density is associated with mortality rate, hydraulic lift and the relative mechanical strength of the plant (Enquist et al., 1999). These patterns of orthogonal chemical and morphological trait axes suggest that there is little covariation between chemical defense strategies represented by investment in alkaloids, lipids, and organic acids and growth and resource allocation strategies represented by SLA and wood density, and hence that metabolomic traits represent novel functional space that is not captured by commonly measured morphological traits (Díaz et al., 2016). However, other morphological traits we did not consider here may yet exhibit correlations with metabolomic features.
Benzenoids, heterocyclic compounds, and seed mass all loaded on the third PCA axes (Figure 2), with benzenoids and heterocyclic compounds positively covarying with each other and both negatively covarying with seed mass. The chemical superclass benzenoids includes defensive compounds such as polyphenols, as well as secondary metabolites that serve multiple functions, such as flavonoids that function in both defense from herbivory and protection against ultraviolet light (Close and McArthur, 2002; Schneider et al., 2019). Heterocyclic compounds, as we have defined them, include many compounds with potential defensive functions that lack the characteristic functional groups or metabolic origins used to define the other superclasses. Seed mass is generally associated with recruitment life history strategy, where large-seeded species tolerate suboptimal conditions for recruitment, but small-seeded species achieve greater fecundity (Muller-Landau, 2010). The association between seed mass, and quantitative investment in benzenoids and heterocyclics is likely driven by the abundance of broad-leafed, deciduous, large-seeded angiosperm trees, such as Carya and Quercus, in the four eastern forests, and the greater investment in benzenoid metabolites and heterocyclic compounds in more environmentally and climatically stressful boreal and alpine forests.
In general, we found that phylogenetic signal varied among metabolomic and morphological traits, supporting research demonstrating that phylogenetic signal is dependent on both the taxonomic and spatial scales studied (Cavender-Bares et al., 2006). While wood density (Swenson and Enquist, 2007), SLA (Ackerly and Reich, 1999), and seed mass (Moles et al., 2007) are all generally phylogenetically conserved when examining broad scale phylogenetic patterns involving thousands of species, wood density and seed mass did not exhibit phylogenetic signal among the 140 species in our study. Interestingly, these results suggest that phylogenetic signal for wood density and seed mass may be weaker than for the foliar secondary metabolome at the community scale in North America. However, the relative phylogenetic signal displayed by morphological and metabolomic traits in temperate forests may be reversed in tropical forests, which exhibit much less metabolomic phylogenetic signal than their temperate counterparts (Sedio et al., 2018b).
Variation in the species composition of the seven forest plots resulted in striking differences in the chemical space occupied by each site. For example, the Scotty Creek community was represented by chemically similar gymnosperms and birches (Betulaceae) (Figure 5A) despite the much broader chemical space represented by species in those lineages at other sites (Figures 4A,C). In contrast, western coniferous forests at Wind River and Cedar Breaks, while relatively species poor (Table 1), were highly chemically diverse and composed of chemically distinct species. This was a result of two factors. First, the understory flora of these forests is composed of chemically distinctive shrubs, particularly species in the Rosaceae such as species of Amelanchier and Holodiscus, and species in the Ericaceae such as species of Gaultheria, Menziesia, Rhododendron, and Vaccinium (Figures 4C,G, 5). Second, abundant overstory trees such as Abies and Pinus species were less chemically similar in the temperate rainforest at Wind River than at the drier and colder Cedar Breaks and Scotty Creek (Figures 5B,C, 6A,B).
In contrast to the western North American plots, many species in the four eastern forest plots occupied the center of chemical space (Figures 5D–G). This pattern was driven by the species richness and relative chemical similarity of species in the families Fagaceae, Juglandaceae, and some Rosaceae (Figures 4E–G). However, the density of points in the center of chemical space that represent the four eastern forest plots in the NMDS may overrepresent the chemical similarity of species in those forests, as the NMDS ordination relies only on species pairwise CSCS chemical similarity and does not account for or visually represent variation in abundance.
Forest Metabolomes and Climatic Gradients
Abundance-weighted whole metabolomic similarity of co-occurring species strongly declined with log MAP and MAT among the seven forest plots (Figures 6A,B). This result is consistent with the prediction that chemically mediated biotic interactions are more specialized in abiotically mild, wetter and warmer climates (Mittelbach et al., 2007; Schemske et al., 2009). In contrast, the PCA (Figure 2 and Supplementary Table 5) illustrates that quantitative investment in most classes of metabolites was greatest in species inhabiting abiotically stressful environments such as the boreal forest at Scotty Creek, NT, or the subalpine forest at Cedar Breaks, UT, which includes one of the most extreme stress tolerators, bristlecone pine (Pinus longaeva). Together, these results are consistent with the prediction that quantitative investment in chemical defense is greatest is stressful environments in which tissue loss to herbivores and pathogens is costly, but qualitative divergence in the composition of chemical defense is greatest in relatively benign environments where plant-enemy coevolution may occur at an accelerated rate (Rasmann et al., 2014; Volf et al., 2020).
Sedio et al. (2018b) found that tree species were more chemically similar in the temperate forest at SERC than in a tropical moist forest at Barro Colorado Island (BCI), Panama. Furthermore, species of Quercus (oaks), Carya (hickories), and Viburnum were chemically similar at SERC, whereas congeneric species in the seven most-diverse tree genera at BCI were chemically dissimilar (Sedio et al., 2018b). The metabolomic differences observed among closely related species of Eugenia, Inga, Ocotea, Piper, Protium, and Psychotria at BCI suggest that interspecific variation in foliar secondary metabolites may directly promote greater species richness by reducing host ranges of insect herbivores and microbial pathogens (Kursar et al., 2009; Salazar et al., 2018; Volf et al., 2018), and thereby reducing enemy-mediated competitive interactions and imposing stronger conspecific negative density-dependent effects on recruitment relative to the effects of heterospecific neighbors (Sedio and Ostling, 2013; Forrister et al., 2019). Whereas the results of Sedio et al. (2018b) suggest that the metabolomic similarity of co-occurring woody plant species may differ profoundly between the temperate and tropical regions, our results suggest that metabolomic similarity among co-occurring plant species decreases with precipitation and temperature even within the boreal and temperate regions of North America and hence may contribute to latitudinal and climatic diversity gradients even outside the tropics.
Future Directions
Our results indicate that metabolomic diversity and disparity increased with precipitation and temperature (Figures 6A,G, 7A,G). Although these gradients are associated with increased species richness at regional and global scales, in our results metabolomic richness and disparity were not directly related to species richness among our seven forest sites (Figures 6M, 7M). Linking community variation in the metabolome to mechanisms that may drive variation in species richness over ecological and evolutionary timescales will require the integration of metabolomics with the study of plant-enemy associations and plant performance at community scales over broad climatic gradients. Nevertheless, our results illustrate the scalability of metabolomics methods based on mass spectrometry (Dührkop et al., 2015, 2019; Wang et al., 2016; Nothias et al., 2020; Tripathi et al., 2021) and suggest their utility in the pursuit of chemical community ecology of global gradients in diversity and climate.
Data Availability Statement
The datasets presented in this study can be found in online repositories. The names of the repository/repositories and accession number(s) can be found in the article/Supplementary Material.
Author Contributions
BES, MJS, JAM, and SJW designed the research. BES, MDP, HC, JHD, CAL, and MLP developed chemical and instrumental methods. DNA, KJA-T, JLB, NAB, BTC, NJD, ED-W, CWD, TYJ, JGK, JAL, IRM, SMM, JAM, GGP, JDP, and JHV collected forest community data, identified species, and collected samples. BES, MJS, JAM, MDP, HC, and JHD collected chemical and trait data. BES and MJS analyzed the data and wrote the manuscript. All authors revised the manuscript.
Funding
This work was supported by a Corteva Agrisciences grant to the Smithsonian Tropical Research Institute and by the University of Texas at Austin. The Wind River Forest Dynamics Plot is a collaborative project of Utah State University and the USDA Forest Service Pacific Northwest Research Station. Funding was provided by the Smithsonian ForestGEO, Utah State University, the Utah Agricultural Experiment Station, and the National Science Foundation. We acknowledge the Gifford Pinchot National Forest and the Forest Service Wind River Field Station for providing logistical support, and the students, volunteers and staff individually listed at http://wfdp.org for data collection. The Utah Forest Dynamics Plot is a collaborative project of Utah State University and the Utah Agricultural Experiment Station. Funding was provided by Utah State University, the Ecology Center at Utah State University, and the Utah Agricultural Experiment Station. We thank Cedar Breaks National Monument for providing logistical support, and the students, volunteers and staff individually listed at http://ufdp.org for data collection. The plot census at the Michigan Big Woods Forest Dynamics Plot was supported by a USDA McIntire-Stennis Grant and the Edwin S. George Reserve Fund at the University of Michigan. Funding for the Tyson Research Center Plot was provided by the International Center for Advanced Renewable Energy and Sustainability (I-CARES) at Washington University in St. Louis, the National Science Foundation (DEB 1557094 to JAM and MJS), the Smithsonian ForestGEO, and Tyson Research Center. We thank the Tyson Research Center staff for providing logistical support, and the more than 100 high school students, undergraduate students, and researchers that have contributed to the project. Funding for trait-data collection at the Smithsonian Environmental Research Center, Tyson Research Center, and Wind River was provided by a ForestGEO Research Grants Program award to MJS and JAM. Funding for chemical-ecology research at Tyson Research Center was provided by a Washington University Environmental Studies Grant for Student Research awarded to ED-W. Funding for the Scotty Creek Forest Dynamics Plot was provided to JLB by the Natural Sciences and Engineering Research Council of Canada Discovery Grants program, Global Water Futures project Northern Water Futures, Canada Foundation for Innovation, Canada Foundation for Climate and Atmospheric Sciences, the Northern Student Training Program (support for field assistants), and the Smithsonian ForestGEO program. Funding for the SCBI ForestGEO plot was provided by ForestGEO, the Smithsonian Institution, and the HSBC Climate Partnership.
Conflict of Interest
The authors declare that the research was conducted in the absence of any commercial or financial relationships that could be construed as a potential conflict of interest.
Acknowledgments
We thank P. Dorrestein, E. A. Herre, J.-P. Salminen, V. Swamy, A. Tripathi, and M. Volf for helpful discussion and D. Espinoza, K. Greig, L. Hart, F. MacNeill, and K. Richardson for assistance in the laboratory; MiAmbiente Ministry of the Environment of the Republic of Panama for supporting the broader research endeavor of which this study is a part; the Texas Advanced Computing Center for assistance and support of high-performance computing for metabolomics; C. Catano, R. Swing, and D. Vela Díaz for assistance with trait sampling at Wind River and SERC, and Erika Gonzalez-Akre for assistance with leaf sampling at SCBI. We thank Scotty Creek Research Station, which provided accommodations during fieldwork. and the Government of the Northwest Territories—Wilfrid Laurier University partnership, which provided logistical support for fieldwork. We are grateful to the Dehcho First Nations for permission to conduct research on their lands (Aurora Research Institute license numbers 15413 and 16431). Finally, R. Patankar, K. Dearborn, and C. Wallace were central to successful establishment and remeasurement of the Scotty Creek plot.
Supplementary Material
The Supplementary Material for this article can be found online at: https://www.frontiersin.org/articles/10.3389/fevo.2021.679638/full#supplementary-material
Supplementary Figure 1 | Phylogenetic principal components analysis of variation among species in three morphological traits and in total ion intensity in five chemical superclasses. Loadings for chemical superclasses reflect species means in total ion intensity of all compounds classified in each superclass. Loadings for morphological traits reflect species means. Points represent 91 unique species; colors represent species occurrences in seven forest plots. Species that occurred in >1 forest plot contributed only a single observation (the species mean) to the principal components analysis, but are visually represented by jittered points, the colors of which reflect the species incidence in each forest plot. Only species for which every trait was recorded are included.
Supplementary Figure 2 | Linear regressions of metabolomic similarity of five chemical superclasses vs. log10 MAP, MAT, and species richness. Significant regressions are indicated by a solid line; non-significant regressions with p < 0.07 are represented by a dashed line. Forest plot codes are: SC, Scotty Creek, NT; WR, Wind River, WA; CB, Cedar Breaks, UT; TR, Tyson Research Center, MO; BW, Michigan Big Woods, MI; SB, Smithsonian Conservation Biology Institute (SCBI), VA; and SR, Smithsonian Environmental Research Center (SERC), MD.
Supplementary Figure 3 | Linear regressions of metabolomic richness of five chemical superclasses vs. log10 MAP, MAT, and species richness. Significant regressions are indicated by a solid line; non-significant regressions with p < 0.07 are represented by a dashed line. Forest plot codes are: SC, Scotty Creek, NT; WR, Wind River, WA; CB, Cedar Breaks, UT; TR, Tyson Research Center, MO; BW, Michigan Big Woods, MI; SB, Smithsonian Conservation Biology Institute (SCBI), VA; and SR, Smithsonian Environmental Research Center (SERC), MD.
Supplementary Figure 4 | Linear regressions of community abundance-weighted mean morphological trait values at each forest site vs. log MAP, MAT, and species richness. Significant regressions are indicated by a solid line. Forest plot codes are: SC, Scotty Creek, NT; WR, Wind River, WA; CB, Cedar Breaks, UT; TR, Tyson Research Center, MO; BW, Michigan Big Woods, MI; SB, Smithsonian Conservation Biology Institute (SCBI), VA; and SR, Smithsonian Environmental Research Center (SERC), MD.
Supplementary Table 1 | Sampling and species composition at seven forest sites. Columns represent: Latin, each species taxonomic name; Code, six-character species code; Plot Sampled, the site where the species/population was sampled. Seven columns labeled with forest plots contain a binary value (1/0) that indicates which sampled population was used to represent the species at the site (e.g., Populus grandidentata sampled at Michigan Big Woods was used to represent the species at Michigan Big Woods and SERC).
Supplementary Table 2 | Combined foliar metabolome of 140 species sampled in seven forest plots. Columns represent: id, unique alphanumeric compound identifier; ms2_library_match, named compound matched in a public mass spectral library queried using GNPS; parent_mass, the mass of the compound prior to MS2 fragmentation; retention_time, the time at which the compound was eluted from the UHPLC column during liquid chromatography; smiles, a SMILES text string representing the molecular structure inferred using either CSI:fingerID and Sirius or the MS2 library match; structure_source, whether the SMILES structure was inferred using CSI:fingerID and Sirius or represents that of the compound matched in the MS2 library on GNPS. Subsequent columns represent chemotaxonomic classifications at five levels of organization (kingdom, superclass, class, subclass, and direct_parent) made using ClassyFire. The column “customclass” reflects the five chemotaxonomic superclasses the authors defined for analyses presented for publication. The columns “ScottyCreek,” “WindRiver,” “CedarBreaks,” “Tyson,” “MichiganBigWoods,” “SCBI,” and “SERC” indicate whether the compound occurred in a plant species recorded in each of the seven forest plots. The remaining columns, with column names ending in “mzXML,” indicate the ion abundance of each compound in each species-by-site pooled sample.
Supplementary Table 3 | Hierarchical dendrogram of 13,480 foliar metabolites. Qemistree (Tripathi et al., 2021) represents the structural similarity of unique metabolites in the form of a “phylogeny,” a hierarchical dendrogram in which structurally related metabolites form sister pairs and clades. Tip labels correspond to compound identifiers in Supplementary Table 2.
Supplementary Table 4 | Links to GNPS Feature-Based Molecular Network and Qemistree results for 11 batches of species.
Supplementary Table 5 | Trait values for specific leaf Area (SLA), wood density and seed mass and PCA scores (PCA axes 1–3) for each unique site by species combination. Measurements that were not taken at each site have their source listed. All seed mass data is from the KEW seed information database.
Supplementary Table 6 | Trait loadings for each of three axes from a Principal Components Analysis.
Footnotes
References
Ackerly, D. D., and Reich, P. B. (1999). Convergence and correlations among leaf size and function in seed plants: a comparative test using independent contrasts. Am. J. Bot. 86, 1272–1281. doi: 10.2307/2656775
Allen, D., Dick, C. W., Strayer, E., Perfecto, I., and Vandermeer, J. (2018). Scale and strength of oak–mesophyte interactions in a transitional oak–hickory forest. Can. J. For. Res. 48, 1366–1372. doi: 10.1139/cjfr-2018-0131
Allen, D., Dick, C., Burnham, R. J., Perfecto, I., and Vandermeer, J. (2020). The Michigan Big Woods Research Plot at the Edwin s. George Reserve. Pinckney, MI: University of Michigan.
Anderson-Teixeira, K. J., Davies, S. J., Bennett, A. C., Gonzalez-Akre, E. B., Muller-Landau, H. C., and Joseph Wright, S. (2015). CTFS-ForestGEO: a worldwide network monitoring forests in an era of global change. Glob. Change Biol. 21, 528–549.
Blomberg, S. P., Garland, T., and Ives, A. R. (2003). Testing for phylogenetic signal in comparative data: behavioral traits are more labile. Evolution 57, 717–745. doi: 10.1111/j.0014-3820.2003.tb00285.x
Bolyen, E., Rideout, J. R., Dillon, M. R., Bokulich, N. A., Abnet, C. C., Al-Ghalith, G. A., et al. (2019). Reproducible, interactive, scalable and extensible microbiome data science using QIIME 2. Nat. Biotechnol. 37, 852–857.
Bourg, N. A., McShea, W. J., Thompson, J. R., McGarvey, J. C., and Shen, X. (2013). Initial census, woody seedling, seed rain, and stand structure data for the SCBI SIGEO large forest dynamics plot. Ecology 94, 2111–2112. doi: 10.1890/13-0010.1
Cavender-Bares, J., Keen, A., and Miles, B. (2006). Phylogenetic structure of Floridian plant communities depends on taxonomic and spatial scale. Ecology 87, S109–S122.
Chu, C., Lutz, J. A., Král, K., Vrška, T., Yin, X., and Myers, J. A. (2019). Direct and indirect effects of climate on richness drive the latitudinal diversity gradient in forest trees. Ecol. Lett. 22, 245–255.
Close, D. C., and McArthur, C. (2002). Rethinking the role of many plant phenolics – protection from photodamage not herbivores? Oikos 99, 166–172. doi: 10.1034/j.1600-0706.2002.990117.x
Coley, P. D. (1983). Herbivory and defensive characteristics of tree species in a Lowland tropical forest. Ecol. Monogr. 53, 209–233. doi: 10.2307/1942495
Coley, P. D., and Aide, T. M. (1991). “Comparisons of herbivory and plant defenses in temperate and tropical broad-leaved forests,” in Plant-Animal Interactions: Evolutionary Ecology in Tropical and Temperate Regions, eds P. W. Price, T. M. Lewinsohn, G. W. Fernandes, and W. W. Benson (New York: Wiley), 25–49.
Coley, P. D., and Barone, J. A. (1996). Herbivory and plant defenses in tropical forests. Annu. Rev. Ecol. Syst. 27, 305–335. doi: 10.1146/annurev.ecolsys.27.1.305
Davies, S. J., Abiem, I., Abu Salim, K., Aguilar, S., Allen, D., and Alonso, A. (2021). ForestGEO: understanding forest diversity and dynamics through a global observatory network. Biol. Conserv. 253:108907.
Dearborn, K. D., Wallace, C. A., Patankar, R., and Baltzer, J. L. (2020). Permafrost thaw in boreal peatlands is rapidly altering forest community composition. J. Ecol. 109, 1452–1467. doi: 10.1111/1365-2745.13569
Defossez, E., Pellissier, L., and Rasmann, S. (2018). The unfolding of plant growth form-defence syndromes along elevation gradients. Ecol. Lett. 21, 609–618. doi: 10.1111/ele.12926
Díaz, S., Kattge, J., Cornelissen, J. H., Wright, I. J., Lavorel, S., Dray, S., et al. (2016). The global spectrum of plant form and function. Nature 529, 167–171.
Dirzo, R., and Boege, K. (2008). “Patterns of herbivory and defense in tropical dry and rain forests,” in Tropical Forest Community Ecology, eds W. P. Carson and S. A. Schnitzer (Oxford: Wiley-Blackwell).
Djoumbou Feunang, Y., Eisner, R., Knox, C., Chepelev, L., Hastings, J., Owen, G., et al. (2016). ClassyFire: automated chemical classification with a comprehensive, computable taxonomy. J. Cheminformatics 8:61.
Dührkop, K., Fleischauer, M., Ludwig, M., Aksenov, A. A., Melnik, A. V., Meusel, M., et al. (2019). SIRIUS 4: a rapid tool for turning tandem mass spectra into metabolite structure information. Nat. Methods 16, 299–302. doi: 10.1038/s41592-019-0344-8
Dührkop, K., Shen, H., Meusel, M., Rousu, J., and Böcker, S. (2015). Searching molecular structure databases with tandem mass spectra using CSI: FingerID. Proc. Natl. Acad. Sci. 112, 12580–12585. doi: 10.1073/pnas.1509788112
Dyer, L. A., Singer, M. S., Lill, J. T., Stireman, J. O., Gentry, G. L., Marquis, R. J., et al. (2007). Host specificity of Lepidoptera in tropical and temperate forests. Nature 448, 696–U9.
Ehrlich, P. R., and Raven, P. H. (1964). Butterflies and plants - a study in coevolution. Evolution 18, 586–608. doi: 10.2307/2406212
Enquist, B. J., West, G. B., Charnov, E. L., and Brown, J. H. (1999). Allometric scaling of production and life-history variation in vascular plants. Nature 401, 907–911. doi: 10.1038/44819
Esquivel-Muelbert, A., Baker, T. R., Dexter, K. G., Lewis, S. L., Steege, H., and Lopez-Gonzalez, G. (2017). Seasonal drought limits tree species across the Neotropics. Ecography 40, 618–629.
Fine, P. V. A., Miller, Z. J., Mesones, I., Irazuzta, S., Appel, H. M., Stevens, M. H. H., et al. (2006). The growth-defense trade-off and habitat specialization by plants in Amazonian forests. Ecology 87, S150–S162.
Forrister, D. L., Endara, M. J., Younkin, G. C., Coley, P. D., and Kursar, T. A. (2019). Herbivores as drivers of negative density dependence in tropical forest saplings. Science 363, 1213–1216. doi: 10.1126/science.aau9460
Furniss, T. J., Larson, A. J., and Lutz, J. A. (2017). Reconciling niches and neutrality in a subalpine temperate forest. Ecosphere 8:e1847.
Garnier, E., Cortez, J., Billès, G., Navas, M.-L., Roumet, C., Debussche, M., et al. (2004). Plant functional markers capture ecosystem properties during secondary succession. Ecology 85, 2630–2637. doi: 10.1890/03-0799
Gentry, A. H. (1988). Changes in plant community diversity and floristic composition on environmental and geographical gradients. Ann. Mo. Bot. Gard. 75, 1–34. doi: 10.2307/2399464
Givnish, T. J. (1999). On the causes of gradients in tropical tree diversity. J. Ecol. 87, 193–210. doi: 10.1046/j.1365-2745.1999.00333.x
Harrison, S., Spasojevic, M. J., and Li, D. (2020). Climate and plant community diversity in space and time. Proc. Natl. Acad. Sci. 117, 4464–4470. doi: 10.1073/pnas.1921724117
Hawkins, B. A., Field, R., Cornell, H. V., Currie, D. J., Guégan, J.-F., Kaufman, D. M., et al. (2003). Energy, water, and broad-scale geographic patterns of species richness. Ecology 84, 3105–3117. doi: 10.1890/03-8006
Kattge, J., Bönisch, G., Díaz, S., Lavorel, S., Prentice, I. C., Leadley, P., et al. (2020). TRY plant trait database–enhanced coverage and open access. Glob. Change Biol. 26, 119–188.
Kreft, H., and Jetz, W. (2007). Global patterns and determinants of vascular plant diversity. Proc. Natl. Acad. Sci. 104, 5925–5930. doi: 10.1073/pnas.0608361104
Kursar, T. A., Dexter, K. G., Lokvam, J., Pennington, R. T., Richardson, J. E., Weber, M. G., et al. (2009). The evolution of antiherbivore defenses and their contribution to species coexistence in the tropical tree genus Inga. Proc. Natl. Acad. Sci. U. S. A. 106, 18073–18078. doi: 10.1073/pnas.0904786106
Laliberté, E., and Legendre, P. (2010). A distance-based framework for measuring functional diversity from multiple traits. Ecology 91, 299–305. doi: 10.1890/08-2244.1
Lamanna, C., Blonder, B., Violle, C., Kraft, N. J. B., Sandel, B., and Imova, I. (2014). Functional trait space and the latitudinal diversity gradient. Proc. Natl. Acad. Sci. 111, 13745–13750.
Letunic, I., and Bork, P. (2019). Interactive tree of life (iTOL) v4: recent updates and new developments. Nucleic Acids Res. 47, W256–W259.
Lutz, J. A., Larson, A. J., Freund, J. A., Swanson, M. E., and Bible, K. J. (2013). The importance of large-diameter trees to forest structural heterogeneity. PLoS One 8:e82784. doi: 10.1371/journal.pone.0082784
Mason, N. W. H., Mouillot, D., Lee, W. G., and Wilson, J. B. (2005). Functional richness, functional evenness and functional divergence: the primary components of functional diversity. Oikos 111, 112–118. doi: 10.1111/j.0030-1299.2005.13886.x
Mittelbach, G. G., Schemske, D. W., Cornell, H. V., Allen, A. P., Brown, J. M., and Bush, M. B. (2007). Evolution and the latitudinal diversity gradient: speciation, extinction and biogeography. Ecol. Lett. 10, 315–331.
Moles, A. T., Ackerly, D. D., Tweddle, J. C., Dickie, J. B., Smith, R., Leishman, M. R., et al. (2007). Global patterns in seed size. Glob. Ecol. Biogeogr. 16, 109–116.
Moreira, X., Nell, C. S., Katsanis, A., Rasmann, S., and Mooney, K. A. (2018). Herbivore specificity and the chemical basis of plant–plant communication in Baccharis salicifolia (Asteraceae). New Phytol. 220, 703–713. doi: 10.1111/nph.14164
Muller-Landau, H. C. (2010). The tolerance–fecundity trade-off and the maintenance of diversity in seed size. Proc. Natl. Acad. Sci. 107, 4242–4247. doi: 10.1073/pnas.0911637107
Nothias, L.-F., Petras, D., Schmid, R., Dührkop, K., Rainer, J., Sarvepalli, A., et al. (2020). Feature-based molecular networking in the GNPS analysis environment. Nat. Methods 17, 905–908.
Pellissier, L., Roger, A., Bilat, J., and Rasmann, S. (2014). High elevation Plantago lanceolata plants are less resistant to herbivory than their low elevation conspecifics: is it just temperature? Ecography 37, 950–959. doi: 10.1111/ecog.00833
Pérez-Harguindeguy, N., Díaz, S., Garnier, E., Lavorel, S., Poorter, H., and Jaureguiberry, P. (2016). Corrigendum to: New handbook for standardised measurement of plant functional traits worldwide. Aust. J. Bot. 64, 715–716. doi: 10.1071/bt12225_co
Pluskal, T., Castillo, S., Villar-Briones, A., and Orešič, M. (2010). MZmine 2: modular framework for processing, visualizing, and analyzing mass spectrometry-based molecular profile data. BMC Bioinform. 11:395.
R Core Team (2020). R: a Language and Environment for Statistical Computing. Vienna: R Foundation for Statistical Computing.
Rasband, W. S. (2018). ImageJ. U. S. National Institutes of Health. MD, United States: Bethesda. Available online at: https://imagej.nih.gov/ij/
Rasmann, S., Buri, A., Gallot-Lavallée, M., Joaquim, J., Purcell, J., and Pellissier, L. (2014). Differential allocation and deployment of direct and indirect defences by Vicia sepium along elevation gradients. J. Ecol. 102, 930–938. doi: 10.1111/1365-2745.12253
Reich, P. B., Walters, M. B., and Ellsworth, D. S. (1997). From tropics to tundra: global convergence in plant functioning. Proc. Natl. Acad. Sci. 94, 13730–13734. doi: 10.1073/pnas.94.25.13730
Revell, L. J. (2010). Phylogenetic signal and linear regression on species data. Methods Ecol. Evol. 1, 319–329. doi: 10.1111/j.2041-210x.2010.00044.x
Revell, L. J. (2012). Phytools: an R package for phylogenetic comparative biology (and other things). Methods Ecol. Evol. 3, 217–223. doi: 10.1111/j.2041-210x.2011.00169.x
Ripley, B., Venables, B., Bates, D. M., Hornik, K., Gebhardt, A., Firth, D., et al. (2013). Package ‘mass.’. Cran R 538, 113–120.
Rüger, N., Comita, L. S., Condit, R., Purves, D., Rosenbaum, B., Visser, M. D., et al. (2018). Beyond the fast–slow continuum: demographic dimensions structuring a tropical tree community. Ecol. Lett. 21, 1075–1084. doi: 10.1111/ele.12974
Salazar, D., Lokvam, J., Mesones, I., Pilco, M. V., Zuñiga, J. M. A., Valpine, P., et al. (2018). Origin and maintenance of chemical diversity in a species-rich tropical tree lineage. Nat. Ecol. Evol. 2, 983–990. doi: 10.1038/s41559-018-0552-0
Sam, K., Koane, B., Sam, L., Mrazova, A., Segar, S., Volf, M., et al. (2020). Insect herbivory and herbivores of Ficus species along a rain forest elevational gradient in Papua New Guinea. Biotropica 52, 263–276. doi: 10.1111/btp.12741
Schemske, D. W., Mittelbach, G. G., Cornell, H. V., Sobel, J. M., and Roy, K. (2009). Is there a latitudinal gradient in the importance of biotic interactions? Annu. Rev. Ecol. Evol. Syst. 40, 245–269. doi: 10.1146/annurev.ecolsys.39.110707.173430
Schneider, G. F., Coley, P. D., Younkin, G. C., Forrister, D. L., Mills, A. G., and Kursar, T. A. (2019). Phenolics lie at the centre of functional versatility in the responses of two phytochemically diverse tropical trees to canopy thinning. J. Exp. Bot. 70, 5853–5864. doi: 10.1093/jxb/erz308
Sedio, B. E., and Ostling, A. M. (2013). How specialised must natural enemies be to facilitate coexistence among plants? Ecol. Lett. 16, 995–1003. doi: 10.1111/ele.12130
Sedio, B. E., Boya, P. C. A., and Rojas Echeverri, J. C. (2018a). A protocol for high-throughput, untargeted forest community metabolomics using mass spectrometry molecular networks. Appl. Plant Sci. 6:e1033. doi: 10.1002/aps3.1033
Sedio, B. E., Devaney, J. L., Pullen, J., Parker, G. G., Wright, S. J., and Parker, J. D. (2020). Chemical novelty facilitates herbivore resistance and biological invasions in some introduced plant species. Ecol. Evol. 10, 8770–8792. doi: 10.1002/ece3.6575
Sedio, B. E., Echeverri, J. C. R., Boya, P. C. A., and Wright, S. J. (2017). Sources of variation in foliar secondary chemistry in a tropical forest tree community. Ecology 98, 616–623. doi: 10.1002/ecy.1689
Sedio, B. E., Parker, J. D., McMahon, S. M., and Wright, S. J. (2018b). Comparative foliar metabolomics of a tropical and a temperate forest community. Ecology 99, 2647–2653. doi: 10.1002/ecy.2533
Shipley, B., De Bello, F., Cornelissen, J. H. C., Laliberté, E., Laughlin, D. C., and Reich, P. B. (2016). Reinforcing loose foundation stones in trait-based plant ecology. Oecologia 180, 923–931. doi: 10.1007/s00442-016-3549-x
Spasojevic, M. J., Turner, B. L., and Myers, J. A. (2016). When does intraspecific trait variation contribute to functional beta-diversity? J. Ecol. 104, 487–496. doi: 10.1111/1365-2745.12518
Swenson, N. G., and Enquist, B. J. (2007). Ecological and evolutionary determinants of a key plant functional trait: wood density and its community-wide variation across latitude and elevation. Am. J. Bot. 94, 451–459. doi: 10.3732/ajb.94.3.451
Tripathi, A., Vázquez-Baeza, Y., Gauglitz, J. M., Wang, M., Dührkop, K., and Nothias-Esposito, M. (2021). Chemically informed analyses of metabolomics mass spectrometry data with Qemistree. Nat. Chem. Biol. 17, 146–151. doi: 10.1038/s41589-020-00677-3
Uemura, M., and Steponkus, P. L. (1994). A contrast of the plasma membrane lipid composition of Oat and Rye leaves in relation to freezing tolerance. Plant Physiol. 104, 479–496. doi: 10.1104/pp.104.2.479
Volf, M., Laitila, J. E., Kim, J., Sam, L., Sam, K., and Isua, B. (2020). Compound specific trends of chemical defences in Ficus along an elevational gradient reflect a complex selective landscape. J. Chem. Ecol. 46, 442–454. doi: 10.1007/s10886-020-01173-7
Volf, M., Segar, S. T., Miller, S. E., Isua, B., Sisol, M., and Aubona, G. (2018). Community structure of insect herbivores is driven by conservatism, escalation and divergence of defensive traits in Ficus. Ecol. Lett. 21, 83–92. doi: 10.1111/ele.12875
Wang, M. X., Carver, J. J., Phelan, V. V., Sanchez, L. M., Garg, N., and Peng, Y. (2016). Sharing and community curation of mass spectrometry data with global natural products social molecular networking. Nat. Biotechnol. 34, 828–837.
Webb, C. O., and Donoghue, M. J. (2005). Phylomatic: tree assembly for applied phylogenetics. Mol. Ecol. Notes 5, 181–183. doi: 10.1111/j.1471-8286.2004.00829.x
Weiher, E., and Keddy, P. A. (1995). Assembly rules, null models, and trait dispersion: new questions from old patterns. Oikos 74, 159–164. doi: 10.2307/3545686
Wink, M. (2003). Evolution of secondary metabolites from an ecological and molecular phylogenetic perspective. Phytochemistry 64, 3–19. doi: 10.1016/s0031-9422(03)00300-5
Wright, I. J., Reich, P. B., Westoby, M., Ackerly, D. D., Baruch, Z., and Bongers, F. (2004). The worldwide leaf economics spectrum. Nature 428, 821–827.
Keywords: metabolomics, chemical ecology, ForestGEO, species diversity gradient, climate, biotic interactions, functional traits, temperate forest
Citation: Sedio BE, Spasojevic MJ, Myers JA, Wright SJ, Person MD, Chandrasekaran H, Dwenger JH, Prechi ML, López CA, Allen DN, Anderson-Teixeira KJ, Baltzer JL, Bourg NA, Castillo BT, Day NJ, Dewald-Wang E, Dick CW, James TY, Kueneman JG, LaManna J, Lutz JA, McGregor IR, McMahon SM, Parker GG, Parker JD and Vandermeer JH (2021) Chemical Similarity of Co-occurring Trees Decreases With Precipitation and Temperature in North American Forests. Front. Ecol. Evol. 9:679638. doi: 10.3389/fevo.2021.679638
Received: 12 March 2021; Accepted: 29 April 2021;
Published: 26 May 2021.
Edited by:
Danilo M. Neves, Federal University of Minas Gerais, BrazilReviewed by:
Emmanuel Defossez, Université de Neuchâtel, SwitzerlandJose Eduardo Meireles, University of Maine, United States
Copyright © 2021 Sedio, Spasojevic, Myers, Wright, Person, Chandrasekaran, Dwenger, Prechi, López, Allen, Anderson-Teixeira, Baltzer, Bourg, Castillo, Day, Dewald-Wang, Dick, James, Kueneman, LaManna, Lutz, McGregor, McMahon, Parker, Parker and Vandermeer. This is an open-access article distributed under the terms of the Creative Commons Attribution License (CC BY). The use, distribution or reproduction in other forums is permitted, provided the original author(s) and the copyright owner(s) are credited and that the original publication in this journal is cited, in accordance with accepted academic practice. No use, distribution or reproduction is permitted which does not comply with these terms.
*Correspondence: Brian E. Sedio, sediob@utexas.edu