Variability of Microbial Particulate ATP Concentrations in Subeuphotic Microbes Due to Underlying Metabolic Strategies in the South Pacific Ocean
 Kaycie B. Lanpher
 Kimberly J. Popendorf
- Department of Ocean Sciences, Rosenstiel School of Marine and Atmospheric Science, University of Miami, Miami, FL, United States
Adenosine triphosphate (ATP) is the primary energy storage molecule in metabolic pathways. It is common in marine studies to use particulate ATP (PATP) concentrations as representative of microbial biomass. However, there is growing evidence from culture studies, models, and transcriptional data that PATP concentration varies across microbes and conditions, thus compromising interpretations in environmental settings. Importantly, there is a lack of open ocean studies assessing variations in PATP concentrations and thus a deficiency of information on the key biogeochemical drivers for variability in microbial PATP independent of biomass. In sampling the U.S. GO-SHIP P06E zonal transect (32.5°S) across the eastern South Pacific, from the subtropical gyre to the upwelling waters off Chile, we conducted the first comprehensive transect survey quantifying PATP. PATP concentrations increased toward the upwelling region of the transect, but varied vertically when normalized against three measures of biomass: particulate phosphorus, microbial abundance, and microbial biovolume. Generally, greater biomass-normalized PATP concentrations were observed below the deep chlorophyll maximum. Subdividing the P06E transect into four biogeochemical regimes highlighted distinct metabolic strategies used by microbes. Between these regimes, we found PATP concentrations were representative of biomass in upper surface waters. However, below the deep chlorophyll maximum we observed higher biomass normalized PATP concentrations that we hypothesize were due to less availability of energy sources in those subeuphotic zone waters and abundances of chemoautotrophs in the microbial community. This finding suggests that stored energy was more important for these deeper microbes.
Introduction
Adenosine triphosphate (ATP) is the primary energy trafficking molecule used in the metabolic pathways of all living cells. Thus, measures of particulate ATP (PATP) have been used as a direct indicator of the presence of living microbes in the ocean (Karl, 1980, 1993; Hodson et al.,1981a,b; McGrath and Sullivan, 1981; Balkwill et al., 1988). PATP has additionally been used as a conversion proxy for live microbial carbon biomass across various marine environments (Holm-Hansen and Booth, 1966; Karl, 1980, 1999; Fellows et al., 1981; Balkwill et al., 1988; White, 1988). However, this use of PATP assumes little variability in cellular PATP concentrations between different microbes, microbial communities, and across environmental conditions (Karl, 1980). To date there have been few oceanographic surveys of PATP concentrations across marine environments and depth profiles to assess its variation relative to other measures of microbial biomass. There is evidence that PATP varies across microbial communities due to variations in community functional groups and responses to environmental conditions, including nutrient availability (Morey et al., 2011; Alhasawi et al., 2014), suggesting that PATP may not be a reliable measure of biomass across all marine environments.
Several independent studies have reported influences of environmental conditions on PATP concentrations in microbes (Wilson et al., 1981; Morey et al., 2011; Jin, 2012; Alhasawi et al., 2014; Wan et al., 2017; Zhang et al., 2017; Berg et al., 2018; Czajka et al., 2018). Temperature impacted PATP concentrations in a salt marsh, where the average per cell bacterial PATP concentrations increased in warmer months (Wilson et al., 1981). A model simulation of cyanobacterial metabolism determined that light had direct effects on PATP production as the cyanobacteria had to rely on oxidative phosphorylation to maintain their PATP stocks under dark conditions (Wan et al., 2017). As such, cyanobacteria would be expected to have high concentrations of PATP during photosynthesis and lower values under dark conditions. In addition to the impact of light, changes in microbial PATP is attributed to oxygen availability as PATP production is greater in aerobic respiration than in anaerobic metabolisms, including ferric iron respiration, sulfate respiration, and methanogenesis (Jin, 2012).
Microbial PATP concentrations differed between diverse microbes in a salt marsh (Wilson et al., 1981). In addition to temperature influences, the bacterial PATP concentrations decreased during high tide due to increasing abundance of oceanic bacteria exhibiting lower PATP per cell than the salt marsh bacteria. A metatranscriptomic study conducted during a cyanobacterial bloom observed upregulation in ATP synthesis when there was a shift in the microbial community from one dominated by cyanobacteria to a mixed community including picoeukaryotes and heterotrophic bacteria (Berg et al., 2018). This finding further supports the influence of microbial community composition on PATP concentrations. Additionally, a culture study found that the cold adapted microbe Colwellia psychrerythraea had inherently lower concentrations of PATP during normal growth than the non-cold adapted Escherichia coli (Czajka et al., 2018).
Nutrient impacts on microbial PATP concentrations have also been identified during studies of single microbial species. Cultured Pseudomonas fluorescens had distinct alterations in cellular pathways when under zinc stress that led to an overall increase in ATP production (Alhasawi et al., 2014). In a combined culture and transcriptomic study, Karenia brevis increased PATP synthase after the addition of nitrogen due to a transition in metabolic state to actively dividing (Morey et al., 2011). In a combined genomic and culture study PATP production increased in Karenia mikimotoi relying on organic sources of phosphorus rather than inorganic phosphate, likely due to the required upregulation and production of hydrolytic enzymes used to consume organic nutrients (Zhang et al., 2017).
Although there are numerous independent studies indicating that underlying metabolic strategies play a role in intracellular ATP concentrations there is not a unified conceptual model for expected variations in PATP across open ocean environments due to the prevalence of single-species investigations, targeted research environments, and diverse approaches utilized across prior studies. Additionally, there are few observations of variations of PATP in marine microbes in the open ocean (Ferla et al., 1995; Björkman and Karl, 2001; Naganuma et al., 2006) resulting in a deficiency of comprehensive datasets necessary to resolve the question of whether PATP scales with biomass in the open ocean; and if not, what factors are most important in driving variations in PATP concentrations.
To address the gap in understanding open ocean PATP variability, and whether it is representative of variations in biomass, we quantified PATP across the South Pacific, finding horizontal and vertical patterns in PATP concentrations. To assess if variations in PATP represented variations in biomass we analyzed multiple measures of biomass, including cell counts, estimates of cell biovolume, and concentrations of particulate phosphorus. In addition, to assess possible microbial and environmental drivers of variation in PATP, we measured dissolved inorganic and organic nutrient concentrations, microbial abundance and broad functional groups, as well as hydrography. First, we used the data to investigate the hypothesis that there would be variations in the relationship between PATP and biomass across the South Pacific transect. Secondly, we investigated the hypothesis that variations in PATP not associated with biomass would be due to variations in nutrient availability and the microbial community functional groups.
Materials and Methods
Sample Collection and Shipboard Analyses
Seawater samples were collected from the Global Ocean Ship-Based Hydrographic Investigations Program (GO-SHIP) P06 transect leg two, P06E, along 32.5°S on the R/V I/B Nathaniel B. Palmer traversing from Tahiti to Chile, from August 20 to September 30, 2017 (Figure 1A). Through the GO-SHIP program (Swift et al., 2019), depth profiles for hydrographic and geochemical data were collected and analyzed shipboard at 106 stations from 149 to 71°W. The general hydrography data collected using the CTD sensor package included salinity, temperature, oxygen, and chlorophyll fluorescence. Additionally, water was directly sampled from the CTD rosette for shipboard analyses of nitrate, nitrite, phosphate (DIP), silicate, oxygen, salinity, alkalinity, pH, dissolved inorganic carbon (DIC), and laboratory analysis of dissolved organic carbon (DOC). For full methods on GO-SHIP analyses see Swift et al. (2019).
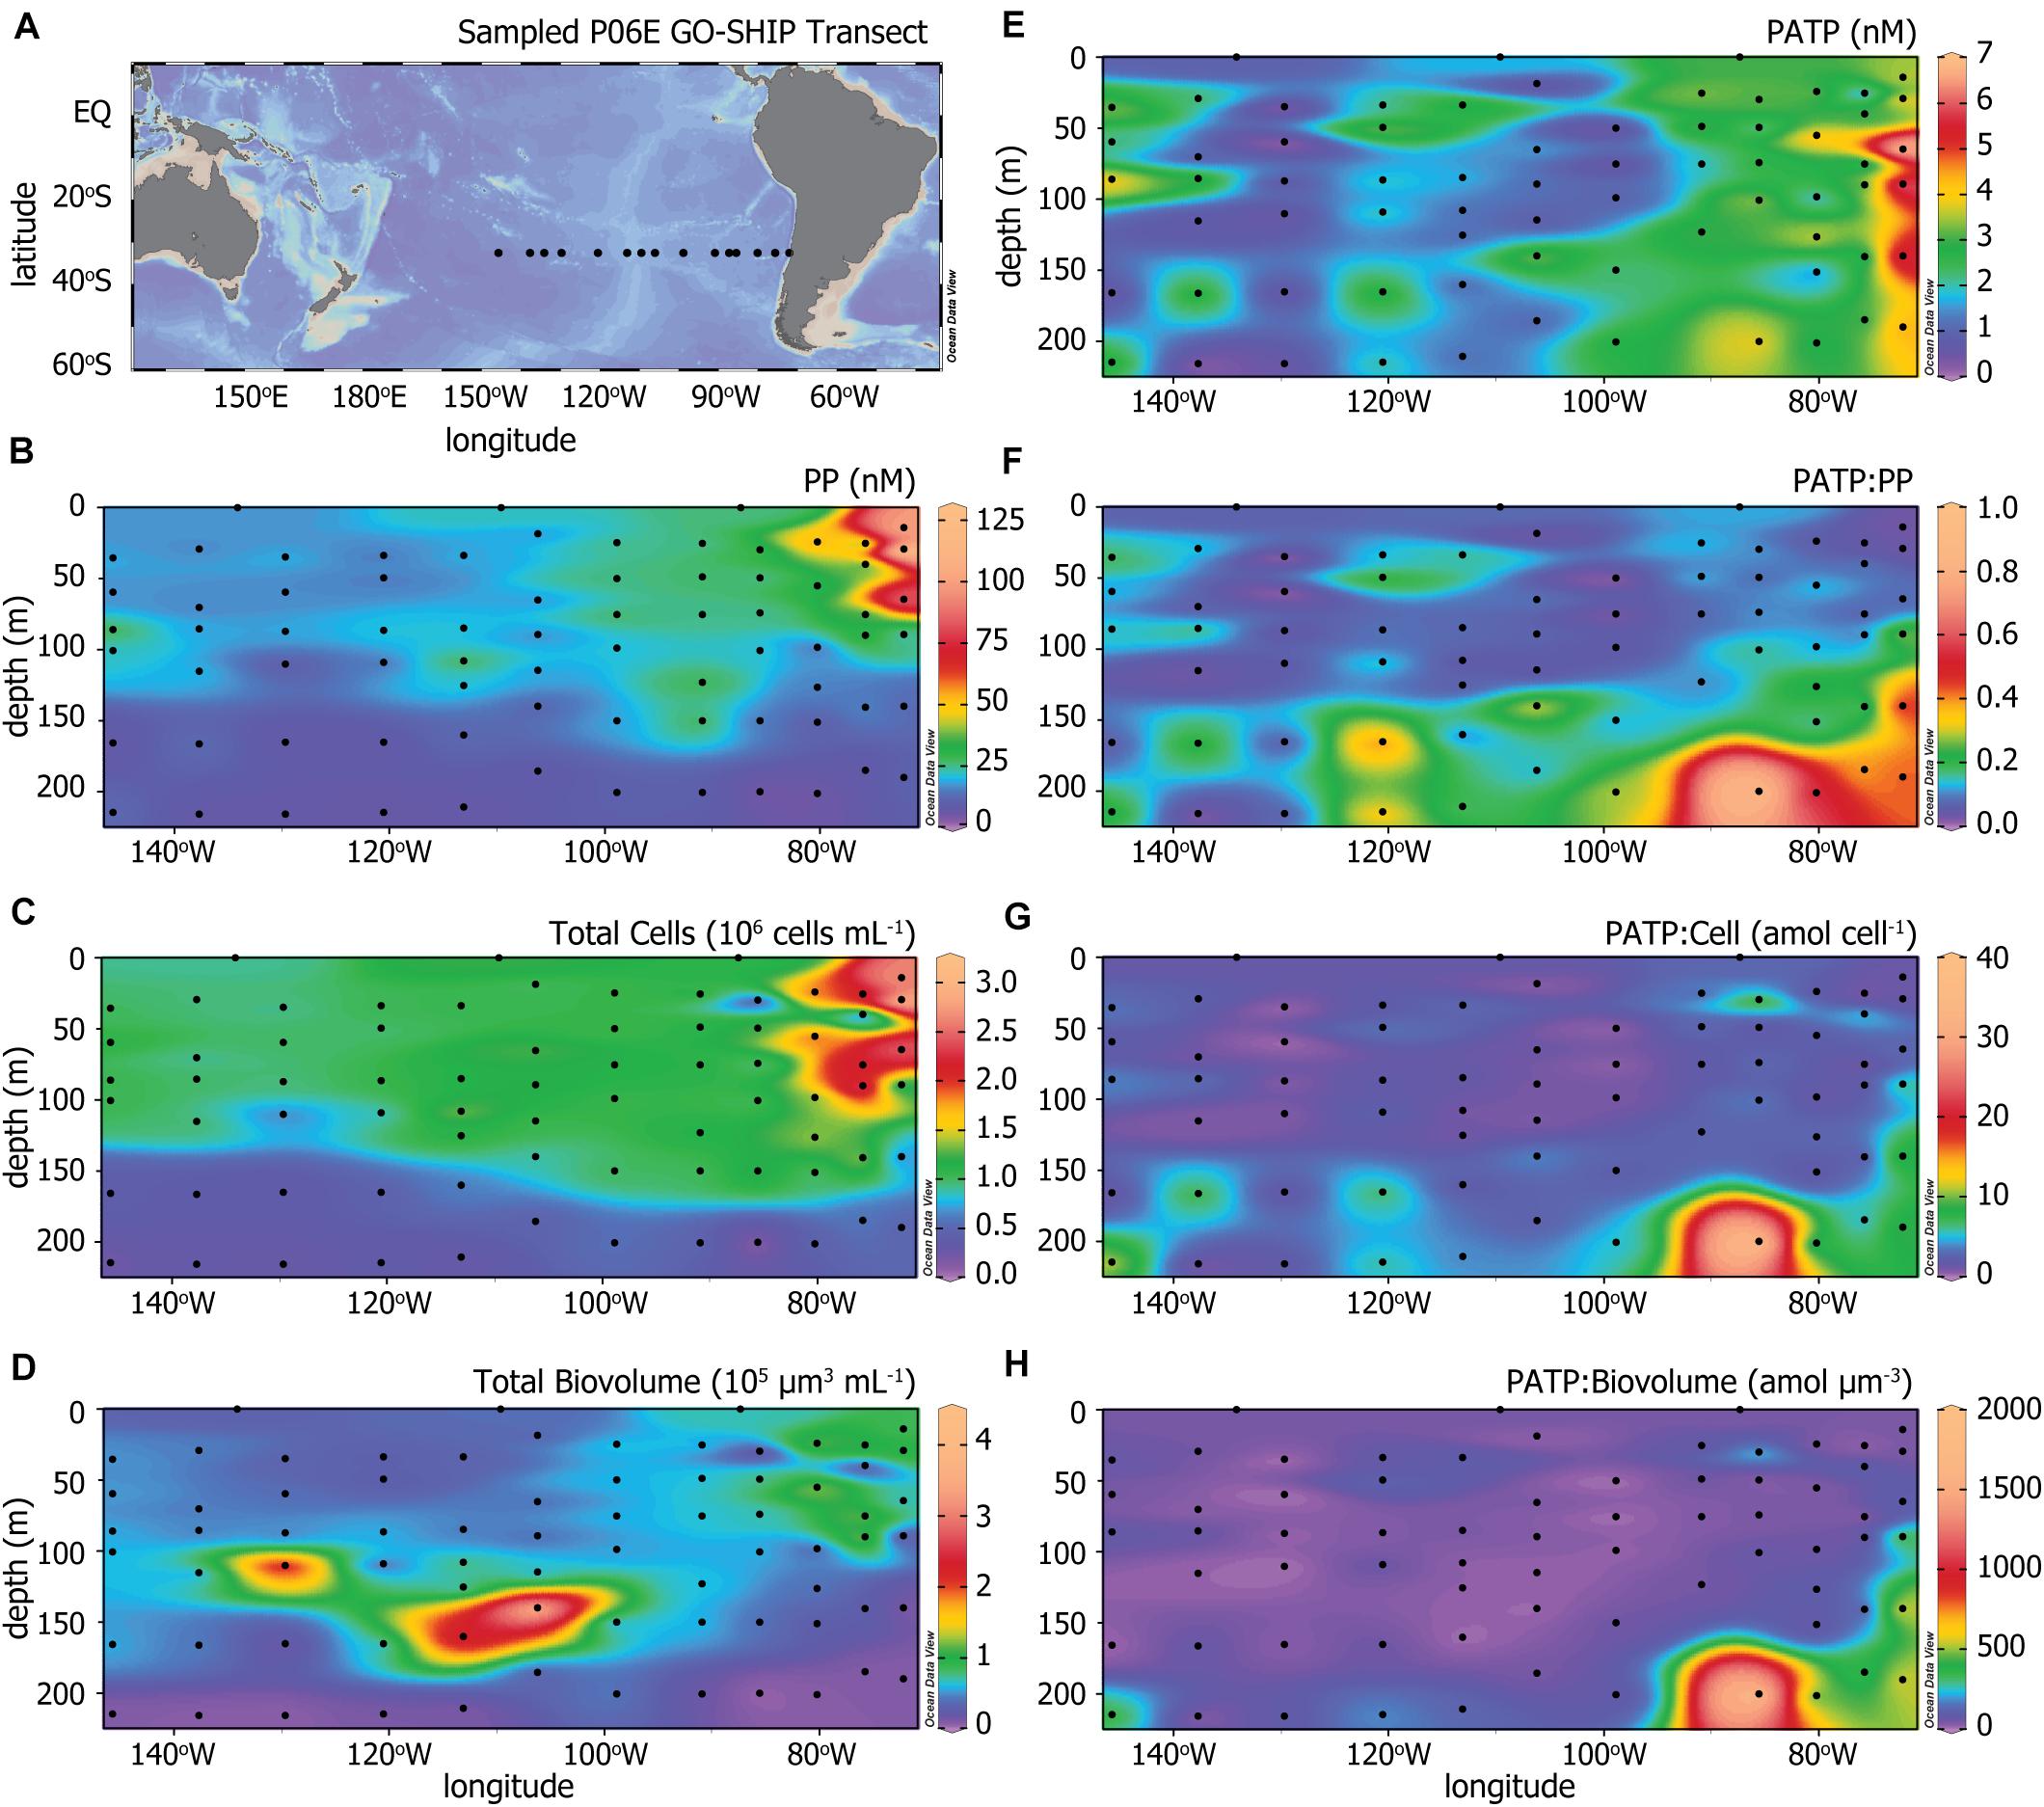
Figure 1. (A) The P06E GO-SHIP Transect (2017) along 32.5°S in the Pacific Ocean. Colored heat maps of (B) particulate phosphorus (PP) concentrations, (C) total microbial cell abundances, (D) total microbial biovolume, (E) particulate adenosine triphosphate (PATP) concentrations, (F) ratios of PATP to PP (PATP:PP), (G) ratios of PATP to total microbial cell abundances (PATP:Cell), and (H) ratios of PATP to total microbial biovolume (PATP:Biovolume).
We collected additional water samples to measure PATP, cell counts, particulate phosphorus (PP), and total dissolved phosphorus (TDP) which was used to calculate dissolved organic phosphorus (DOP) at 15 of those 106 stations. Of these 15 stations, 12 stations were sampled as depth profiles from the CTD Niskin rosette at 6 depths ranging from 10 to 225 m. The remaining 3 stations were sampled from the shipboard flow-through seawater system to obtain triplicate samples of surface water for data validation. The samples we collected were minimally processed shipboard and brought back to lab for complete analyses.
Particulate ATP
PATP was collected and extracted shipboard and then quantified in the shore laboratory using a high pressure liquid chromatography (HPLC) method. For each PATP sample, 1 L of whole seawater was collected from the CTD or flow-through seawater system and vacuum filtered (<−0.2 bar) using combusted 0.3 μm poresize, 47 mm glass fiber filters (Advantec GF-75). PATP was extracted using established methods (Holm-Hansen and Booth, 1966; Karl and Bossard, 1985; Karl, 1993), immediately submerging the filters into 5 mL of boiling 20 mM tris(hydroxymethyl)aminomethane (Tris) buffer at pH 7.7 in 15 mL glass vials. After 5 min, the vials were removed from heat, cooled to room temperature, and stored in a −80°C freezer until laboratory-based analyses were completed. In the laboratory, PATP samples were thawed and centrifuged for 10 min at 4°C and 1,200×g. The supernatant was collected into duplicate 2 mL glass vials and analyzed with 50 μL injections onto an Agilent 1100 HPLC using reverse phase chromatography with a Kinetex 5 μm EVO C18 150 × 4.6 mm LC column (Phenomenex). Eluent A was an aqueous phosphate buffer containing 0.06 M dipotassium hydrogen phosphate and 0.04 M potassium dihydrogen phosphate, pH adjusted to 7.0, and eluent B was 100% acetonitrile (Özogul et al., 2000; Liu et al., 2006). HPLC separation was achieved using the following elution gradient: 0.0 min, 100:0%A:%B, 1.2 mL/min; 0.9 min, 100:0%A:%B, 1.2 mL/min; 1.0 min, 100:0%A:%B, 0.7 mL/min; 3.0 min 95:5%A:%B, 0.7 mL/min; 3.1 min, 95:5%A:%B, 1.2 mL/min; 5.0 min, 80:20%A:%B, 1.2 mL/min; 6.3 min, 75:25%A:%B, 1.2 mL/min; 7.0 min, 100:0%A:%B, 1.2 mL/min; 8 min, 100:0%A:%B, 1.2 mL/min. Peaks were detected and analyzed at 254 nm by an Agilent 1100 diode array detector.
Stocks of ATP standards were made in 20 mM Tris buffer to concentrations of 20 and 2 μM. Aliquots of working ATP standard solutions were prepared by diluting these stocks into 20 mM Tris buffer for final ATP concentrations between 0.08 and 10.00 μM. Each standard concentration was run on the HPLC with 50 μL injections and quantified with the diode array detector at 254 nm for ATP calibration curves. The standard error of the method was 6%, determined by analysis of replicate ATP standards. The limit of quantification for the HPLC method was 8 pmol of ATP on column. The average percent standard error for the triplicate flow-through samples collected during the P06E transect was 30.9% for particulate ATP.
Dissolved Phosphorus Analyses
Total dissolved phosphorus (TDP) samples were collected as whole seawater at the CTD or flow-through seawater system in acid clean 250 mL HDPE bottles that were immediately transferred into the −80°C freezer. These samples were stored frozen until analysis for TDP could be completed in laboratory. TDP was quantified in triplicate 40 mL aliquots in glass screw top vials with Teflon-lined caps beginning with a 0.03 M potassium persulfate hydrolysis in an autoclave for 30 min at 121°C (Thomson-Bulldis and Karl, 1998). Following the acid digestion, the TDP was concentrated using magnesium induced co-precipitation (MAGIC) through the addition of 1 mL of 3 M sodium hydroxide, centrifugation for 30 min at 1,000 × g, and re-dissolution of the resulting pellet into 9 mL of 0.1 M hydrochloric acid (Karl and Tien, 1992). The phosphorus-free supernatant was collected post centrifugation and used to make standards for the calibration curve. After MAGIC, the samples underwent an arsenate reduction (Johnson, 1971) before quantification with the molybdenum blue spectrophotometric analysis (Strickland and Parsons, 1972). Sample absorbances were read on a Shimadzu UV-vis 1800 spectrophotometer at 880 nm in a 1 cm quartz cuvette.
Standard curves were made with both glycerophosphate and potassium phosphate to control for the efficiency of the hydrolysis reaction. Stocks of both standards were made from their respective salts dissolved into the phosphorus-free supernatant remaining from the MAGIC procedure. The calibration curves for glycerophosphate and potassium phosphate were made in triplicate and ranged from 0.1 to 6.0 μM. All standards underwent the entire analysis procedure as completed on the seawater samples. The TDP method had a limit of detection below the lowest standard in the curve, all samples were within the range of the standard curve. Triplicate standards had an average percent error of 1.5%, and we observed a 99.9% hydrolysis efficiency based on the glycerophosphate standards. The average percent standard error for the triplicate flow-through TDP samples collected during the P06E transect was 0.9%.
DOP concentrations were calculated by subtracting the DIP concentrations (analyzed shipboard by the GO-SHIP program) from the corresponding TDP concentrations quantified in the laboratory. The shipboard concentrations of DIP were verified in our laboratory by quantifying a subset of samples for DIP using MAGIC and the molybdenum blue spectrophotometric analysis with arsenate reduction, as done for TDP (Johnson, 1971; Strickland and Parsons, 1972; Karl and Tien, 1992). The DIP concentrations were within a 3% error, on average, for corresponding samples analyzed shipboard and in our lab.
Microbial Community Biomass Measurements
Particulate Phosphorus
For each particulate phosphorus (PP) sample, 1 L of whole seawater collected from the CTD or flow through seawater system was vacuum filtered (<−0.2 bar) onto combusted 0.3 μm poresize, 47 mm glass fiber filters (Advantec GF-75), washed with 1 mL of 0.17 M sodium sulfate, and flash frozen in liquid nitrogen to be returned to lab. In the laboratory, PP was extracted and hydrolyzed from the filters by adding 2 mL of 5% potassium persulfate solution in glass screw top centrifuge vials with Teflon-line caps and autoclaving at 121°C for 30 min (Thomson-Bulldis and Karl, 1998; Suzumura, 2008). After undergoing this wet hydrolysis, samples were brought to a total volume of 20 mL using MilliQ (18 MΩ) water. The PP samples were then analyzed using the molybdenum blue spectrophotometric analysis with arsenate reduction, as done for TDP and DIP (Johnson, 1971; Strickland and Parsons, 1972). PP samples were read on a Shimadzu UV-vis spectrophotometer at 880 nm in a 1 cm quartz cuvette.
As done for the TDP analysis, both glycerophosphate and potassium phosphate standards were used to test the efficiency of the hydrolysis reaction and for quantification of the PP samples. The calibration curves of both standards were analyzed in triplicate for concentrations ranging from 0.2 to 5.0 μM. The limit of detection for this procedure was 1.6 nM PP in seawater and triplicate standards had an average percent error of 2.9%. The average percent standard error for the triplicate flow-through samples collected during the P06E transect was 6.9%.
Microbial Abundances
Duplicate whole seawater samples of 2 mL were collected for microbial cell abundances from the CTD or flow-through seawater system were fixed with 0.5% paraformaldehyde, final concentration, at 4°C for 15–30 min before being flash frozen in liquid nitrogen. Samples were stored at −80°C until analysis. In the lab, samples were thawed and analyzed for the cell abundances of phytoplankton and non-pigmented picoplankton using a BD Accuri C6 flow cytometer. Total cells were quantified by staining samples with SYBR Green I nucleic acid stain (Lonza) and measuring based on chlorophyll fluorescence (excitation 488 nm, emission above 670 nm) and SYBR fluorescence (excitation 488 nm, emission at 533 nm +/− 15 nm), with a 533 nm SYBR fluorescence threshold of 200.
Autofluorescent phytoplankton cells were quantified based on forward scatter and chlorophyll fluorescence (excitation at 488 nm, emission above 670 nm), with a 670 nm autofluorescent threshold of 500. The phytoplankton community was further broken down into Prochlorococcus, Synechococcus, and picoeukaryotic phytoplankton based on forward scatter, chlorophyll fluorescence, and phycoerythrin fluorescence (excitation at 488 nm, emission at 585 nm +/− 20 nm). Non-pigmented picoplankton abundance was calculated as total SYBR-stained cells per milliliter minus total phytoplankton per milliliter.
Polystyrene standard beads of 1.0 and 0.2 μm diameters (Fluoresbrite YG beads, Polysciences) were analyzed in forward scatter and side scatter to verify instrument performance and consistency. Autofluorescent debris was accounted for and removed from the total phytoplankton counts using the threshold setting given previously. Flow cytometry data analysis was done with the Accuri software. The average percent standard error for the triplicate flow-through samples collected during the P06E transect was 2.8%. Although a course categorization of community structure, based on broad functional groups, the flow cytometry data provided a measure of diversity in the microbial community in the seawater samples.
Biovolume Calculations
Total microbial biovolume estimates were calculated assuming spherical cells and using average cell diameters for each of the defined microbial communities assigned during microbial abundance quantification. The average cell diameter used for the biovolume calculations were: 0.9 μm for Synechococcus (Raven, 1998), 0.6 μm for Prochlorococcus (Raven, 1998), 0.3 μm for non-pigmented picoplankton (Rappe et al., 2002), and 2.3 μm for picoeukaryotic phytoplankton (Campbell et al., 1997). The average cell volumes for each microbial category was multiplied by the respective microbial cell abundances determined through flow cytometry. The total biovolume for each sample was then calculated by summing the estimated biovolume for Synechococcus, Prochlorococcus, non-pigmented picoplankton, and picoeukaryotic phytoplankton.
Biomass Normalization
PATP concentrations were normalized to each of the three measures of microbial biomass to create three unique data parameters that removed the influence of biomass variation from the PATP data. The normalized data are presented as the ratio of PATP normalized to PP (PATP:PP), to total microbial abundance (PATP:Cell), and to total microbial biovolume (PATP:Biovolume). These normalized PATP ratios provide a meaningful relative value to investigate variations in PATP concentrations across the P06E transect that differ from the variations in biomass. However, the absolute values of biomass-normalized PATP ratios (PATP:Biomass) should not be quantitatively extrapolated beyond this study due to the likely overestimation of absolute PATP concentrations quantified, as described in the Discussion.
Data Summarization and Statistics
Data were analyzed and visualized using RStudio® version 4.0.2 (R Core Team, 2020), Ocean Data View (ODV) version 5.3.0 (Schlitzer, 2018), Microsoft® Excel® (2013), and Adobe® Illustrator® CC 2020 (version 24.3). The “psych” package in RStudio® (Revelle, 2020) was used to calculate the average percent standard error for the triplicate flow-through samples collected during the P06E transect.
The data were divided into biogeochemical regimes across the P06E transect as detailed in the Discussion. The data within the biogeochemical regimes did not meet the assumptions for normality due to unequal variance between these data groupings, as determined by the Levene test (R Core Team, 2020). Therefore, non-parametric statistical analyses were performed for comparisons within and between these biogeochemical regimes. As such, data were summarized using medians and interquartile ranges (IQR), calculated as quantile 3 minus quantile 1 using the package “rcompanion” (Mangiafico, 2020) in RStudio®. The Mann-Whitney-Wilcoxon Test was conducted by the “stats” package in RStudio® (R Core Team, 2020) to test for significant differences in the medians for each data variable between the defined regime pairings: regime 1 vs. 2, regime 1A vs. 1B, and regime 2A vs. 2B. These median comparisons were visually represented with boxplots from the “ggplot2” package (Wickham, 2016), with whiskers extending to 1.5 times the IQR of the data and outliers plotted as points. Boxplots were arranged with the “ggpubr” packaged (Kassambara, 2020).
Within regime 1 and regime 2, linear regressions were conducted between the PATP:Biomass ratios and the dissolved nutrient concentrations, microbial community, and transect hydrography. The model II regressions, which address measurement error in the repressors, were performed in RStudio® (R Core Team, 2020) using the “lmodel2” package (Legendre, 2018). The slope coefficients were determined with the major axis method, which minimizes the sum of squared normal distances, and permutation based 1-tailed p-values were determined with 1000 permutations. The regression results, and scatterplots were visually illustrated with the “ggplot2” package and “ggpubr” package (Wickham, 2016; Kassambara, 2020).
Results
Biomass and PATP Distributions
Figure 1A illustrates the station locations along the 32.5°S U.S. GO-SHIP P06E transect sampled for this study to test our hypothesis that PATP would have patterns of variation different from that of microbial biomass in the open ocean. PATP concentrations were greatest in upwelling region of the transect, located east of 90°W (Figure 1E). Three measures of biomass were made across the transect: microbial cell abundance, microbial cell biovolume, and concentrations of particulate phosphorus (PP). PP was elevated in the upper 80 m of the water column, declined between 80 to 150 m, and was lowest below 150 m (Figure 1B). In addition to the depth trends, PP concentrations were greatest along the eastern side of the transect in the upper 80 m, coincident with the upwelling region. Total microbial cell abundance (Figure 1C) followed very similar trends as PP, with greatest abundances in surface waters and in the eastern-most region. Biovolumes for the microbial community were calculated from average cell diameters for four microbial groups, as described in the methods section. These biovolume values (Figure 1D) diverged from the trends of PP and total microbial abundance as they were more heavily influenced by the abundance of picoeukaryotic phytoplankton than the other measure of biomass. The highest biovolume concentrations were found between 100 and 200 m in the western portion of the transect, likely coinciding with a large abundance of picoeukaryotic phytoplankton within the deep chlorophyll maximum (Figure 2D). The lowest biovolume estimates were found at >200 m.
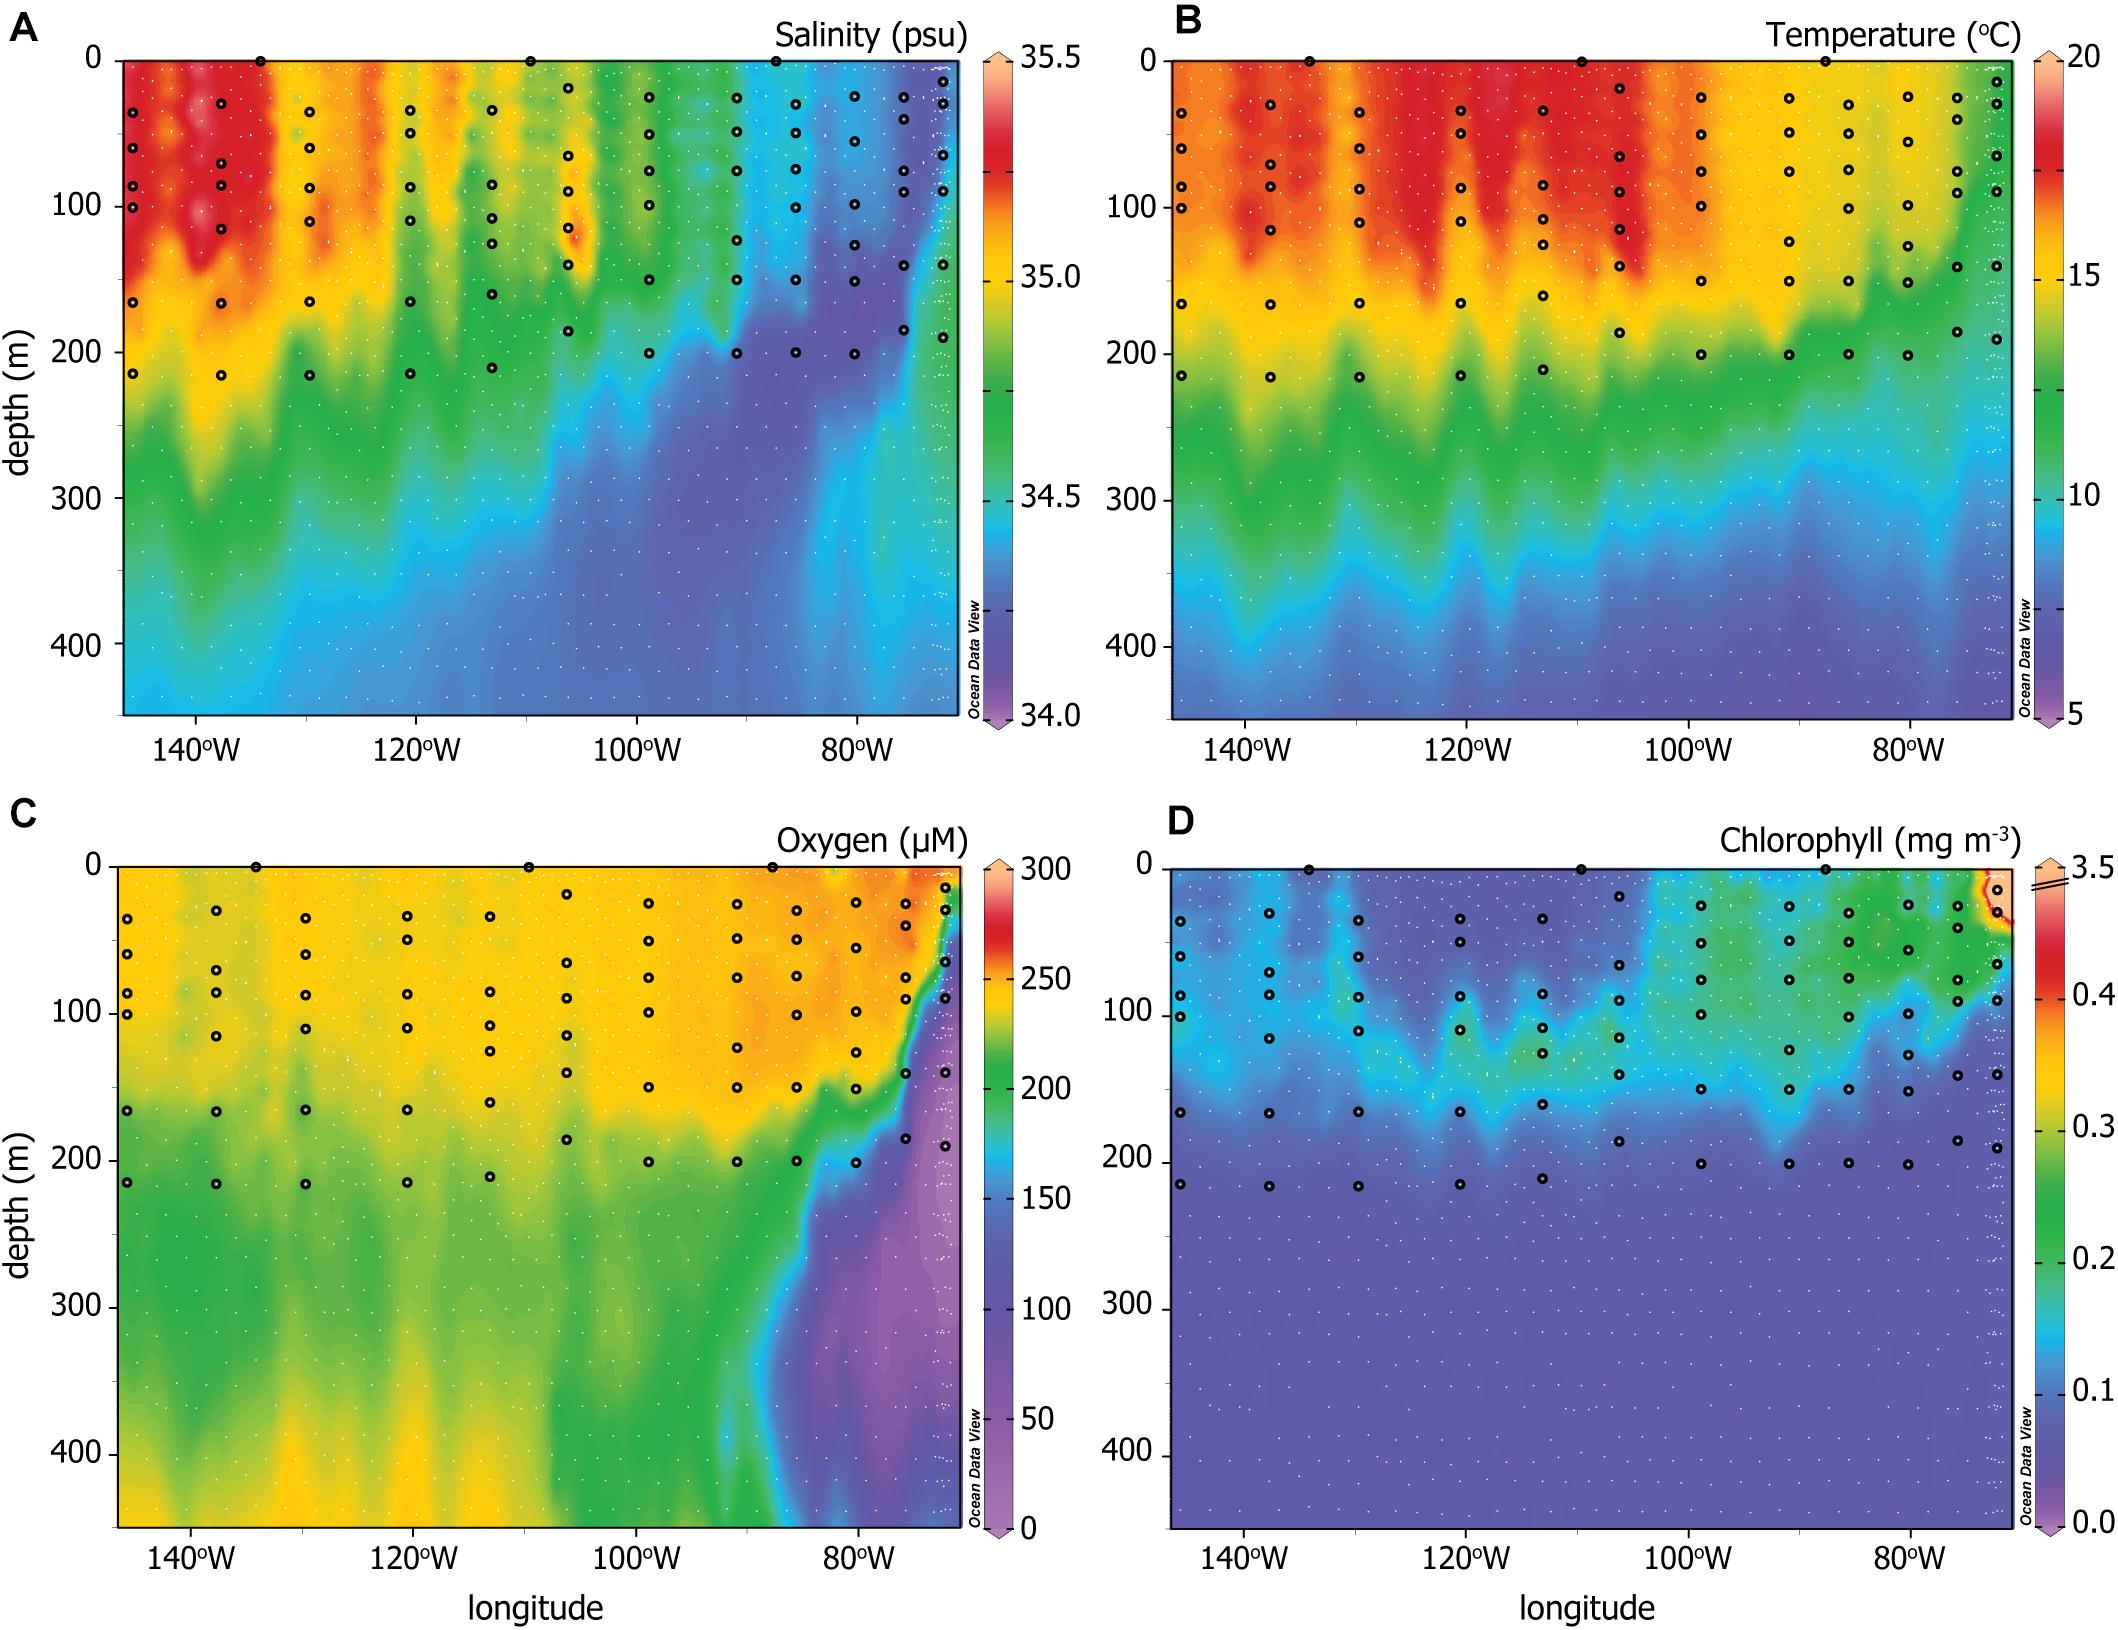
Figure 2. CTD data for (A) Salinity, (B) temperature, (C) oxygen, and (D) chlorophyll across the P06E transect. White dots indicate all sampling depths and locations for the U.S. GO-SHIP P06E data plotted here (Swift et al., 2019). The black circles indicate the sampling depths and locations that correspond to the PATP and biomass data from Figure 1. Note the extended depth of the y-axis is intended to visualize the different water masses more effectively than the sampled depths depicted in Figures 1, 3.
Biomass-normalized PATP values (PATP:PP, PATP:Cell, PATP:Biovolume distributions in Figures 1F–H, respectively) demonstrated systematic patterns with depth and across the transect. Consistent trends in all three PATP:Biomass ratios were observed across the transect. Uniformly low ratios of PATP:Biomass were observed within the upper euphotic zone for all three measures of biomass. We observed generally higher ratios at >150 m depth, and the highest ratios at depth in the east, nearest the upwelling region. The fact that there was variation across the transect within each PATP:Biomass parameter, particularly patterns with depth and with the upwelling region east of 90°W, indicate that PATP does not simply represent biomass across the transect. Furthermore, the consistent trends in the three PATP:Biomass ratios confirm our first hypothesis that variability in PATP concentrations in the open ocean are not controlled by changes in biomass alone, and the systematic patterns invite further exploration.
P06E Transect Hydrography, Nutrients, and Microbial Community
To investigate our second hypothesis, that variations in PATP relative to biomass would reflect changes in the microbial community and environmental conditions, we compared PATP:Biomass ratios with hydrography, nutrient concentrations, and the microbial community. The hydrographic system ranged from a convergence zone in the west to an upwelling system east of 90°W. These contrasting hydrographic features are visualized through gradients in salinity, temperature, oxygen, and chlorophyll fluorescence (Figures 2A–D), all measured from CTD sensors (Swift et al., 2019). Salinity and temperature patterns for the upper 450 m of the water column, decreasing with depth and to the east, emphasized the distinction between the water masses of the convergence zone and upwelling region (Figures 2A,B). Oxygen concentrations were high across the upper 220 m of the transect except in the upwelling region, where concentrations decreased rapidly in the subsurface from 200 to 12 μM in the oxygen minimum zone (OMZ) at depth (Figure 2C). Only the upper portion of the OMZ was sampled for PATP and biomass, as indicated by the black dots in Figure 2C. There was a deep chlorphyll maximum in the western, convergence zone portion of the transect located between 100 and 170 m. In contrast, chlorophyll concentrations were high from the surface to 100–150 m east of 100°W (Figure 2D).
All available data for concentrations of DIC, DOC, DIP, DOP, nitrate, and nitrite in the upper 220 m of the water column across the transect are shown in Figures 3A–F. DIC, DIP, and nitrate increased with depth and toward the eastern, upwelling region (Figures 3A,C,E). DOC concentrations had high spatial variability but were generally greatest in the convergent surface waters and decreased with depth and toward the east, with the lowest upper layer DOC concentrations found in the upwelling region (Figure 3B). DOP concentrations were greatest in the euphotic zone, with a maximum in the upwelling region, and decreased with depth (Figure 3D). Nitrite followed a distribution pattern unique from the other nutrients as it paralleled trends in chlorophyll instead of depth (Figure 3F), peaking just below the deep chlorophyll maximum (Figure 2D) as is commonly observed in open ocean profiles (Adornato et al., 2005; Meeder et al., 2012). Nitrate and nitrite were largely non-detectable to the west, down to approximately 125 m depth.
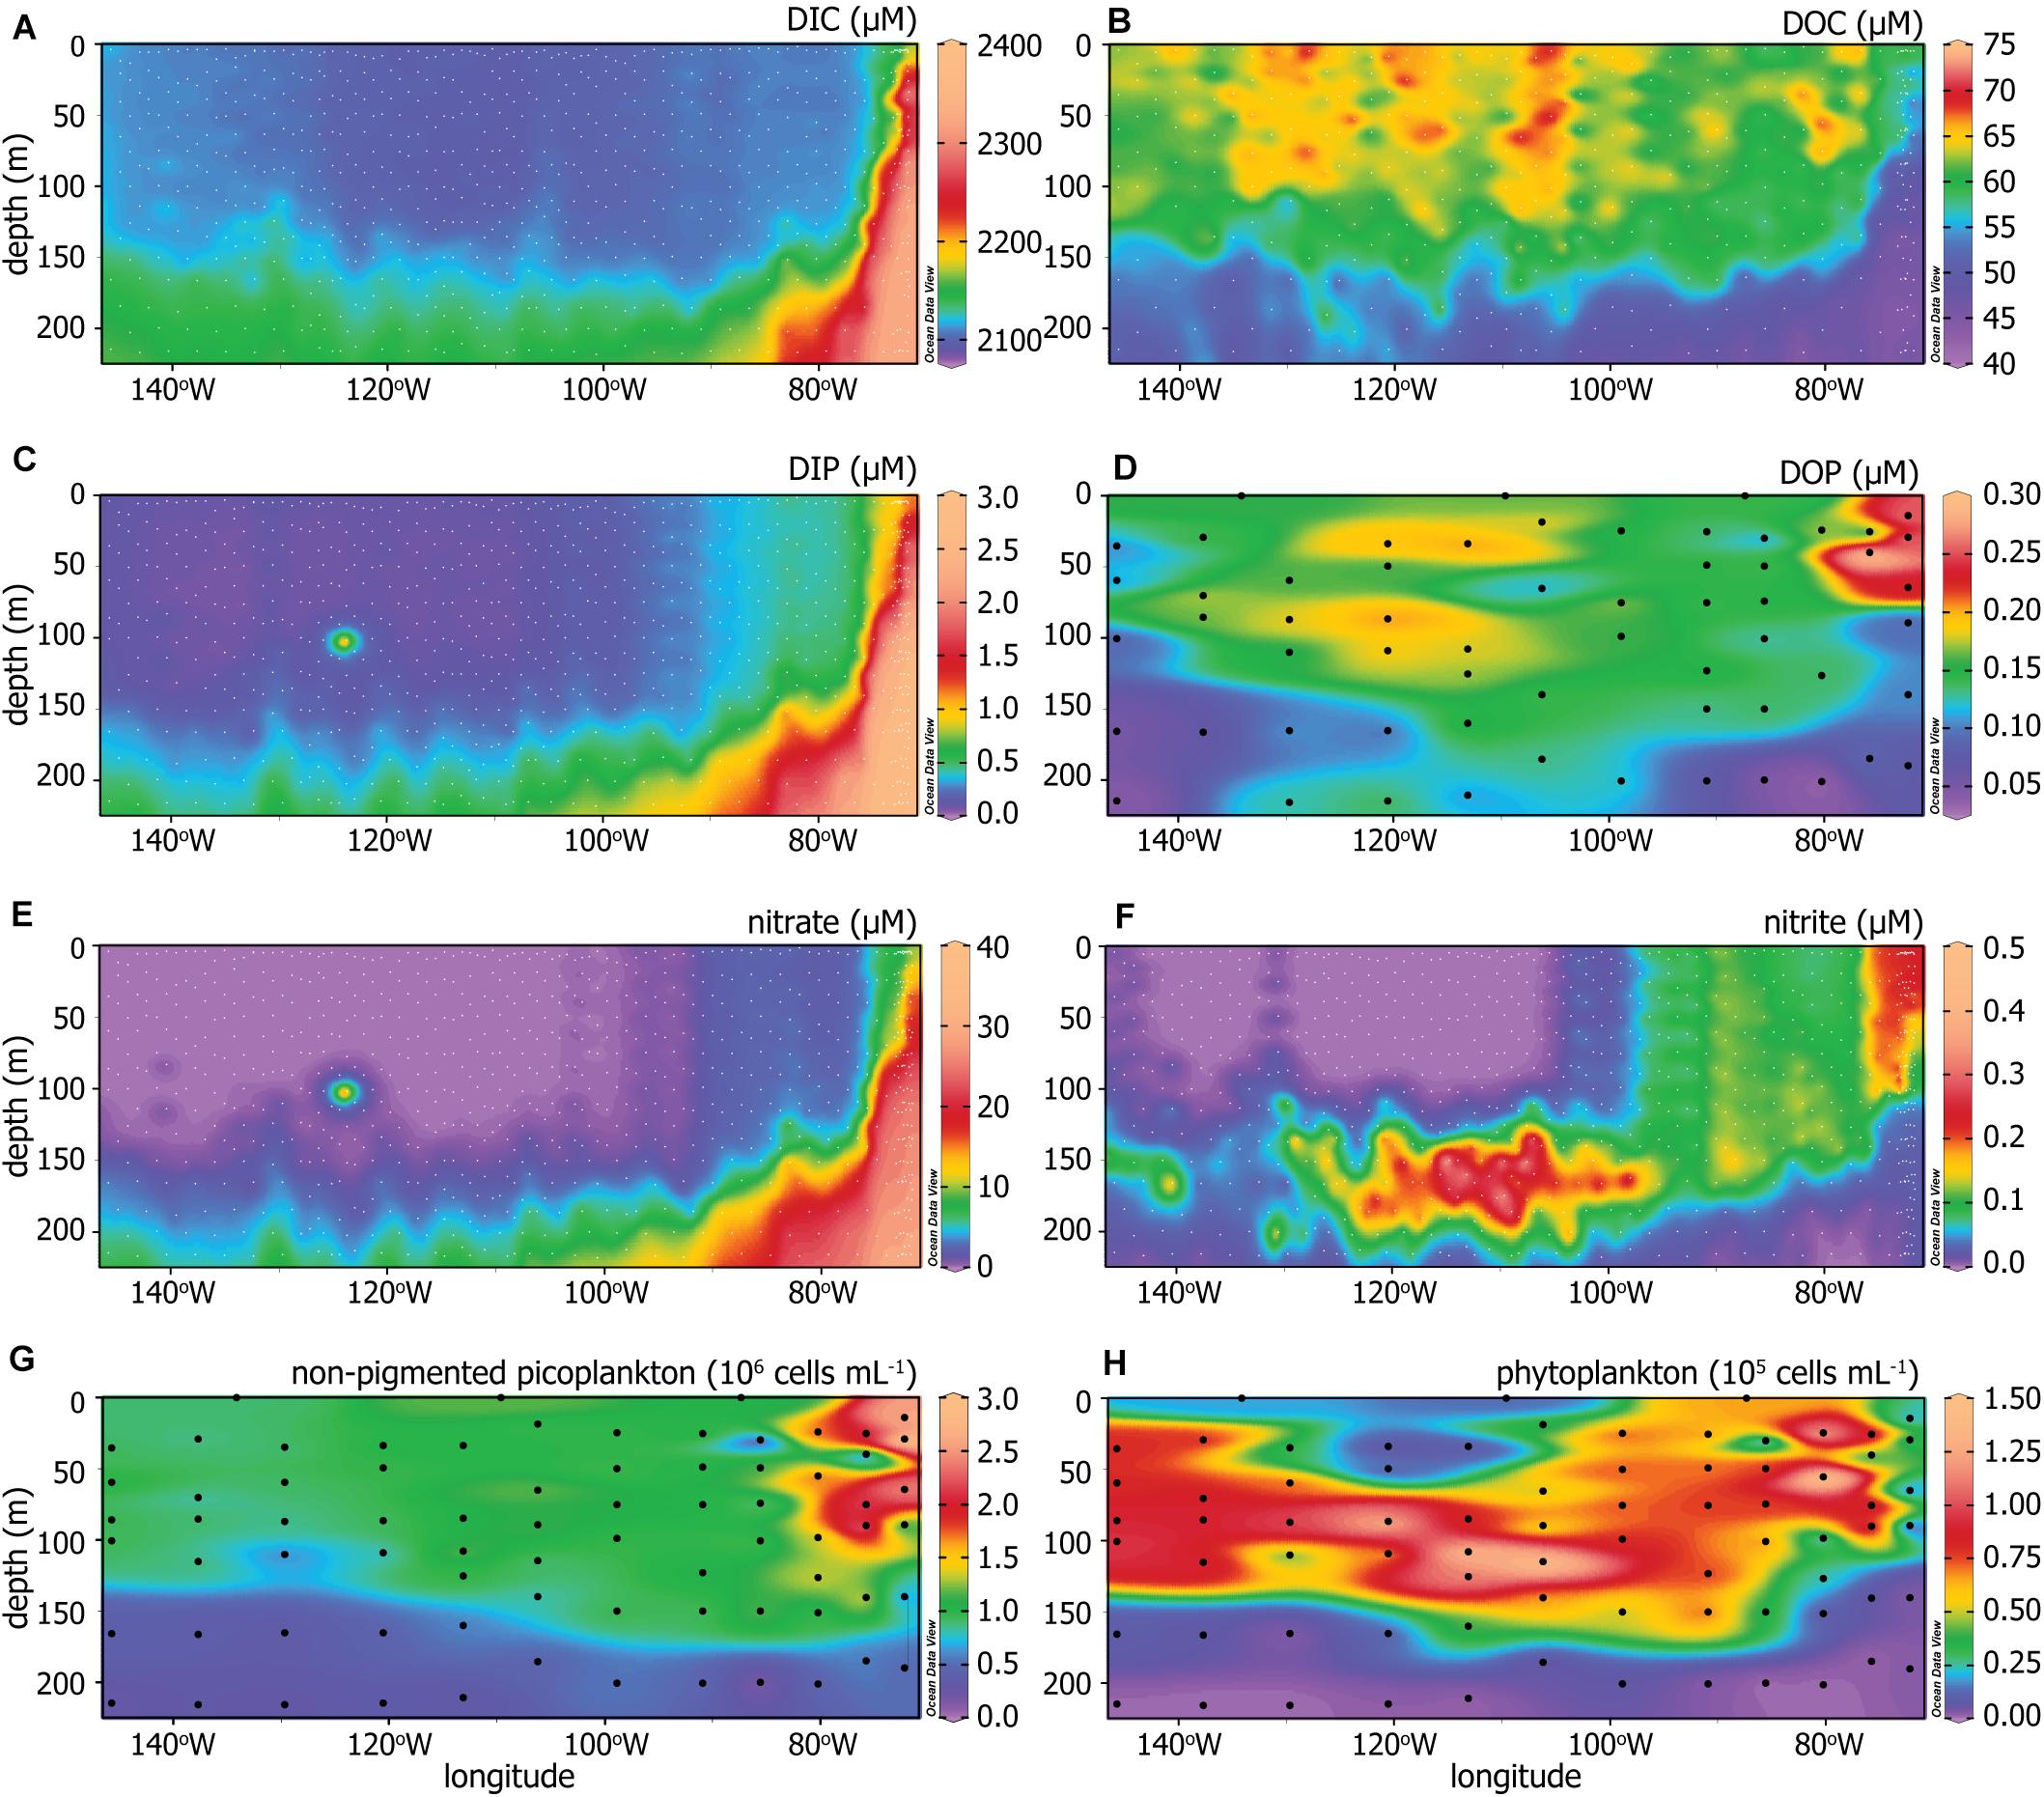
Figure 3. (A) Dissolved inorganic carbon (DIC), (B) dissolved organic carbon (DOC), (C) dissolved inorganic phosphorus (DIP), (D) dissolved organic phosphorus (DOP), (E) nitrate, (F) nitrite, (G) non-pigmented picoplankton abundance, and (H) phytoplankton abundance across the P06E transect. The dots indicate sampling depths and locations, where white dots indicate sampling done by other members of the U.S. GO-SHIP P06 cruise (Swift et al., 2019) and black dots are sampling completed in this study.
The generalized microbial community structure is characterized by the distribution and abundances of non-pigmented picoplankton and phytoplankton (Figures 3G,H). The non-pigmented picoplankton abundance was greatest at the surface and increased toward the upwelling system (Figure 3G). Phytoplankton abundance (Figure 3H) corresponded well with chlorophyll concentrations (Figure 2D). The non-pigmented picoplankton were the dominant microbial group throughout the water column and below the deep chlorophyll maximum, based on relative abundances.
Discussion
Environmental Distributions of PATP
PATP along the South Pacific transect ranged from below our detection limit to a maximum around 7 nM (Figure 1E). However, the majority of the PATP concentrations fell between the range of 0.5–3 nM, with a median of 2.2 nM and an interquartile range of 2.1 nM (Supplementary Table 1). Other studies completed in several ocean basins, at various depths, and during different seasons of the year reported a wide range in cellular PATP concentrations, from 0.001 to 20 nM (Holm-Hansen and Booth, 1966; Karl and Holm-Hansen, 1976; Karl, 1980; Hodson et al., 1981a; McGrath and Sullivan, 1981; Karl and Bailiff, 1989; Ferla et al., 1995; Björkman and Karl, 2001; Naganuma et al., 2006; Greenstein and Wert, 2019), encompassing the PATP range found in this study. A study conducted in the sub-arctic waters of the Greenland and Norwegian Seas found PATP concentrations ranging from 0.08 to 0.68 nM (Naganuma et al., 2006) and a study completed off the coast of Antarctica found concentrations ranging from 0.20 to 9.07 nM, with a majority of the PATP concentrations detected below 0.80 nM (Hodson et al., 1981a). The average PATP concentrations we measured in the South Pacific subtropical ocean were greater than concentrations found in both polar water studies, consistent with increased PATP concentrations in microbes adapted for warmer waters (Czajka et al., 2018). To our knowledge, this is the first study to investigate the relationship between PATP concentrations and other measures of biomass in an open ocean transect.
Measured values of PATP in this study fall within the published range of open ocean PATP values, however, the calculated ratio of PATP:PP in this study indicates surprisingly large fractions of PP are ATP. Our analysis of PATP standards, blanks, and triplicate samples and associated error verifies that this is a quantitative method for PATP, nonetheless the molar P ratio of PATP:PP indicate either, or both, an overestimate of the absolute concentration of PATP, or an underestimate of absolute concentration of PP. The measured values and depth trends of PP fall within published values for the South Pacific (Duhamel et al., 2007; Hashihama et al., 2020). Additionally, the similar trends in PP and microbial abundance corroborated the assumption of negligible detrital PP in the upper water column and supported the use of PP as a measure of live biomass in the sampled water (Paytan et al., 2003; Faul et al., 2005; Duhamel et al., 2007; Defforey and Paytan, 2018). The error in the PATP analysis was greater than PP or cell abundances, with average percent standard errors for the triplicate flow-through samples for PATP, PP, and cell abundances of 30.9, 6.9, and 2.8%, respectively. The higher variability in the triplicate PATP samples in comparison to other parameters was likely due to the sensitivity of the PATP method to differences in timing between collection of seawater and completing filtration, as PATP is expected to be more variable with microbial stress than the other biomass parameters measured. Given the higher error in PATP measurements and more limited prior data for comparison, it is likely that the HPLC method overestimated the absolute PATP concentrations.
Using existing literature of cellular stoichiometry we can bound the expected PATP:PP values as a means of constraining the possible error in our PATP measurements (below), and discuss possible environmental and methodological sources of uncertainty. However, we do not expect that there are any systematic sources of error that are responsible for the transect-wide trends that we observed in PATP:Biomass ratios.
Establishing work on ATP in marine samples found a wide range of ATP relative to particulate organic carbon in a depth profile (Holm-Hansen and Booth, 1966), which can be used to estimate a molar fraction of PP in PATP ranging from 0.0002 to 0.02 in a depth profile from 10 to 1,000 m, with an average of 0.01 mol P in ATP/mol particulate P. Other studies have found the ratio of RNA to ATP mass to be approximately 15–75 (Laws et al., 1983) or DNA to ATP mass to be approximately 10–30 (Jones et al., 1995). However, ATP is an exceedingly P-rich biochemical, with roughly twice the P to dry weight ratio of DNA or RNA (Geider and La Roche, 2002), such that for a microbe with approximately 50% of cellular P in RNA (Cuhel and Waterbury, 1984; Van Mooy and Devol, 2008) and a low RNA to ATP mass ratio it can be estimated that up to about 10% of cellular P may be in ATP. In our data, applying the sample measurement errors to estimate the lower and upper bounds of PATP and PP, respectively, as well as accounting for the 3:1 molar ratio of phosphate in ATP, the majority of our sampling points estimate the fraction of PP in PATP as 0.3 or less, with a median value of 0.20 and a molar ratio range from 0.008 to 1.00, with one outlier exceeding 1. If we assume an expected average range of fraction of PP in PATP from the literature of approximately 0.01–0.10 this suggests that our results may overestimate the absolute concentrations of PATP by a factor of 2–20. Nevertheless, the relative PATP concentrations between samples, and ratios to biomass, remain quantitatively informative as differences between PATP samples across the transect were greater than both the HPLC method standard error and replicate seawater sample variability, and we do not expect the possible sources of error to have generated the observed spatial patterns. Possible environmental and methodological sources of over or underestimation of PATP concentrations are described below.
Two possible sources of overestimating PATP come from either methodological considerations in the HPLC analysis, or contributions of ATP from the dissolved pool. Though numerous HPLC methods have been used to quantitatively analyze ATP (Davis and White, 1980; Admiraal and Veldhuis, 1987; Fischer, 1995; Dai et al., 2008), including those our method was built upon (Özogul et al., 2000; Liu et al., 2006), it is possible that matrix effects or lack of complete chromatographic separation of ATP may have been responsible for overestimation of absolute concentrations. This dataset was generated early in the process of optimizing existing reverse phase HPLC methods (Özogul et al., 2000; Liu et al., 2006) for analysis of ATP in marine microbial samples, and for its implementation in this study ATP and ADP were chromatographically resolved but did not achieve baseline separation (data not shown). Based on published marine microbial molar ratios of ATP:ADP of approximately 1:1 (McGrath and Sullivan, 1981; Romano and Daumas, 1981) this lack of baseline separation could be responsible for at most 50% overestimation of PATP concentrations. If this or matrix effect offsets between standards and samples are responsible for an overestimation of PATP concentrations we expect that error to be uniform across the dataset and not responsible for the observed patterns of variation in PATP:Biomass ratios.
Another possible source of overestimation in PATP concentrations is the potential adsorption of dissolved ATP (DATP) onto the filters during sample collection. DATP concentrations are typically greatest in the euphotic zone, potentially exceeding that of PATP (Azam and Hodson, 1977; Björkman and Karl, 2001), and decrease with depth below the euphotic zone (Hodson et al., 1981b; McGrath and Sullivan, 1981; Karl and Björkman, 2014). If a small portion of DATP was adsorbed onto filters during filtration, we would expect that to lead to a higher signal of PATP in the euphotic zone, which would increase the PATP:Biomass ratio observed in the euphotic zone and diminish the euphotic-subeuphotic variation that we observed. Given that PATP concentrations did not have a depth related trend (Figure 1E) and that we observed significantly higher PATP:Biomass in the subeuphotic region (Table 1), we do not expect that DATP made significant contributions to the measurement and trends of PATP.
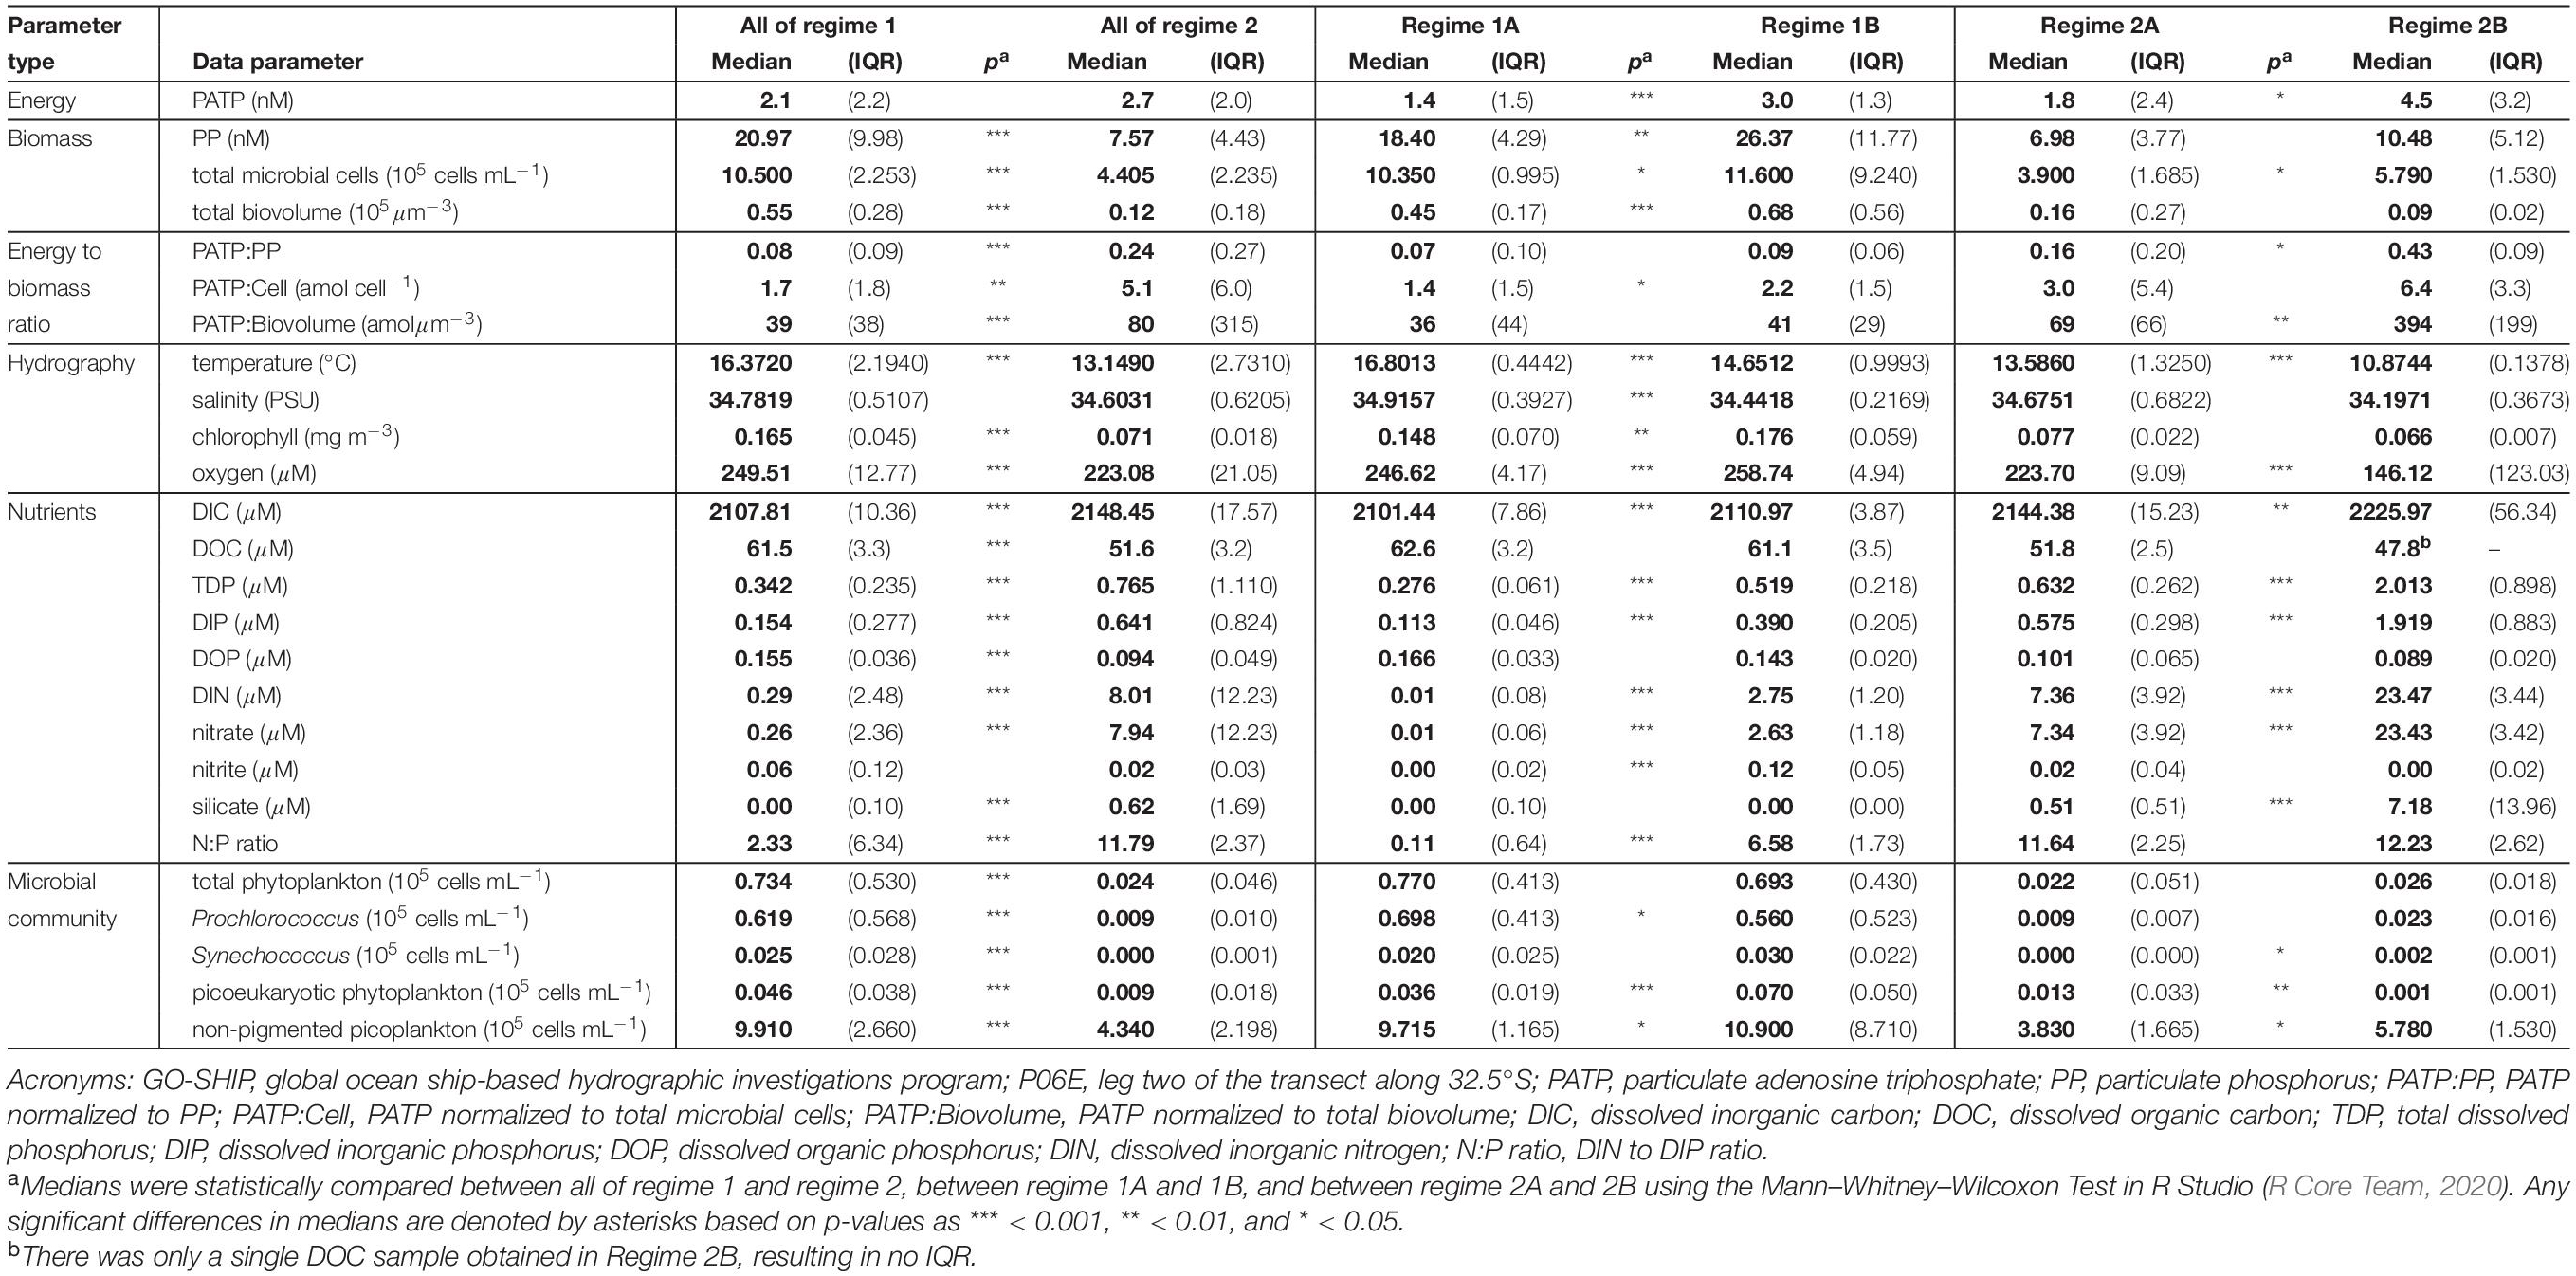
Table 1. Calculated medians (bold) and interquartile ranges (IQR; parentheses) for all data parameters measured within the defined GO-SHIP P06E biogeochemical regimes and their subgroups (Figure 4).
A possible source of underestimating absolute PATP concentrations may be the activity of alkaline phosphatase enzymes. Alkaline phosphatase (AP) enzymes are produced by microbes to hydrolyze DOP, including DATP, into DIP. AP is prevalent across the South Pacific (Duhamel et al., 2011; Hashihama et al., 2020), and AP activity (APA) has been shown to decrease environmentally extracted ATP concentrations by as much as 50% depending on the extraction conditions (Karl and Craven, 1980). The relative impact of APA on PATP is dependent on both the extraction method and timing for completion (Karl and Craven, 1980; Admiraal and Veldhuis, 1987). Data was not available for APA in this study, but it is expected to have trends with depth, inversely correlated with DIP concentrations (Dyhrman and Ruttenberg, 2006; Lomas et al., 2009; Duhamel et al., 2011; Karl and Björkman, 2014), and expected to be more active on DATP pools over PATP in the water column (Dyhrman and Ruttenberg, 2006; Duhamel et al., 2011). The PATP extraction into boiling 20 mM Tris buffer was intended to denature enzymes, including AP, and was initiated within 1 min after filtration was completed, decreasing potential enzymatic activity in samples (Karl and Craven, 1980; Admiraal and Veldhuis, 1987; Karl, 1993). If we assume that this extraction did not deactivate APA, we can bound the maximum possible impact of APA on measured PATP by assuming that ATP was reduced by as much as 50% of PATP in samples with low DIP (approximated by biogeochemical regime 1A, defined below), and find that this does not remove significant variations in PATP:PP across the transect. Given the consistent, rapid extraction procedure and lack of depth trends in our PATP concentrations (Figure 1E), we do not expect that APA had a significant impact on measured PATP concentrations. Nevertheless, future studies should quantify APA to verify that it did not decrease measured PATP concentrations, especially for samples in low DIP environments.
Though there is some uncertainty in the absolute quantification of PATP concentrations across this transect, none of the likely sources of error are expected to have resulted in the transect wide and depth based trends in PATP:Biomass ratios that we observed (Figures 1F–H). These variations in PATP:Biomass were visually correlated with changes in hydrography, nutrient concentrations, and the distribution of the microbial community (Figures 1–3). Measures of PATP:Biomass (Figures 1F–H) were higher at depths below 150 m, where nutrients were higher and the microbial community lacked phytoplankton. Furthermore, the highest PATP:Biomass ratios occurred within the upwelling, oxygen minimum zone (Figures 1, 2D). To explore the underlying environmental and microbial drivers of these variations in PATP:Biomass, we used the nutrient and microbial community data to identify regions of similar biogeochemical characteristics across the transect and quantitatively compared variations between these regimes.
Identification of Biogeochemical Regimes
In order to extract more detailed information regarding microbial community and environmental drivers of variations in PATP:Biomass across the diversity of marine ecosystems in the P06E transect, we binned the data into biogeochemical regimes. By examining the variations in PATP:Biomass across regimes and examining the environmental conditions within each regime we could identify the conditions correlating with significant variations in PATP:Biomass.
Biogeochemical regimes were defined by the N:P ratios and oxygen concentration (Figure 4A). The N:P ratio was calculated based on the ratio of dissolved inorganic nitrogen (DIN), defined as nitrate plus nitrite, to DIP. Though variation in N:P roughly mirrored that of the individual inorganic nutrients, the N:P ratios had more detailed variations with depth and across the transect than were seen in the nutrient concentrations alone (Figure 4B). Overall, there were 4 biogeochemical regimes defined using the N:P ratios and oxygen concentrations: regimes 1A, 1B, 2A, and 2B (Figure 4A). Together, regime 1 (1A and 1B) were generally defined as being near the surface in the euphotic zone while regime 2 (2A and 2B) were deeper, mostly below 150 m depth. These regime groupings also segregated the transect in a pattern similar to the visual patterns observed in PATP:Biomass ratios (Figure 1), where regime 2 mapped onto the region of the transect with significantly greater PATP:Biomass ratios (Figure 4B). The median PATP:PP, PATP:Cell, and PATP:Biovolume values for regime 1 were statistically lower than for regime 2 (Table 1 and Figures 5A–C).
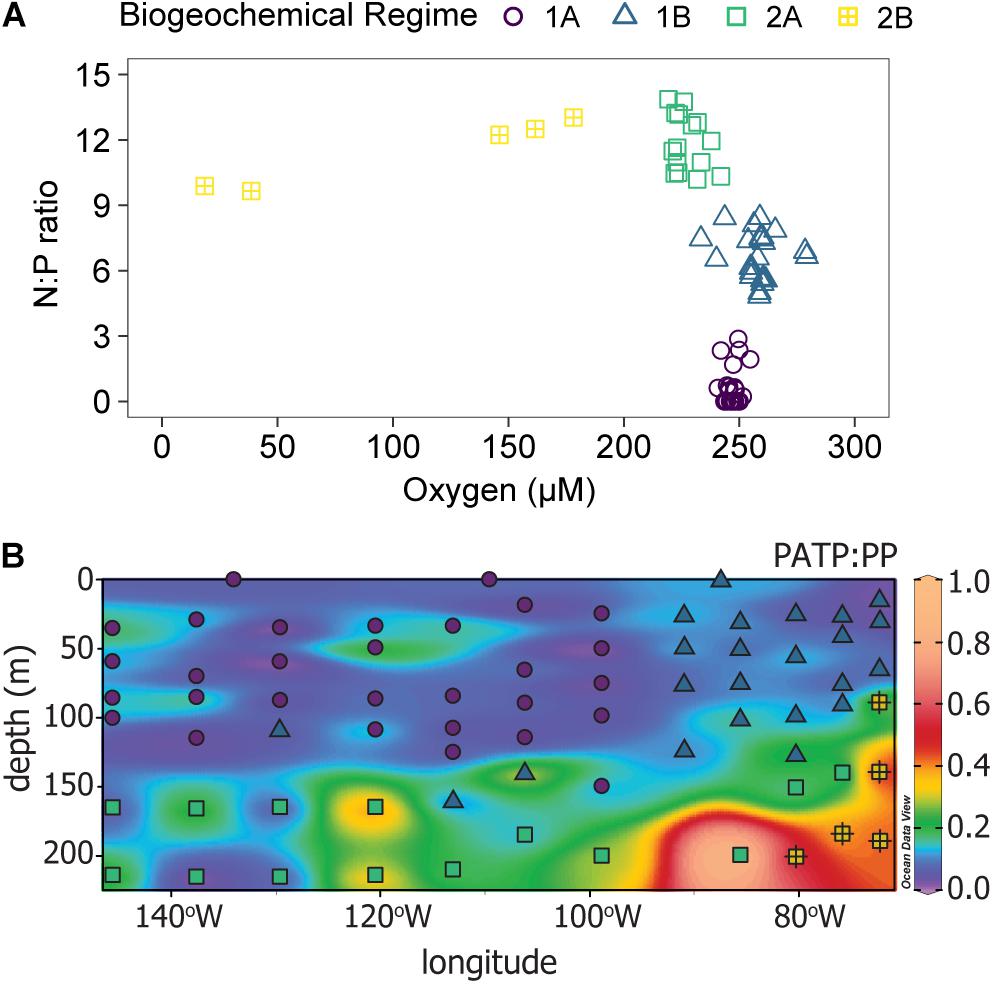
Figure 4. Identification of distinct biogeochemical regimes, labeled regime 1A (purple circles), regime 1B (blue triangles), regime 2A (green squares), and regime 2B (yellow squares with crosses). (A) A scatter plot of the N:P ratio vs. oxygen concentration for the 81 sample locations across the 15 stations where PATP was sampled, Figure 1. (B) Distribution of the four biogeochemical regimes along the transect (symbols) over the distribution of the PATP:PP ratio (colored contours).
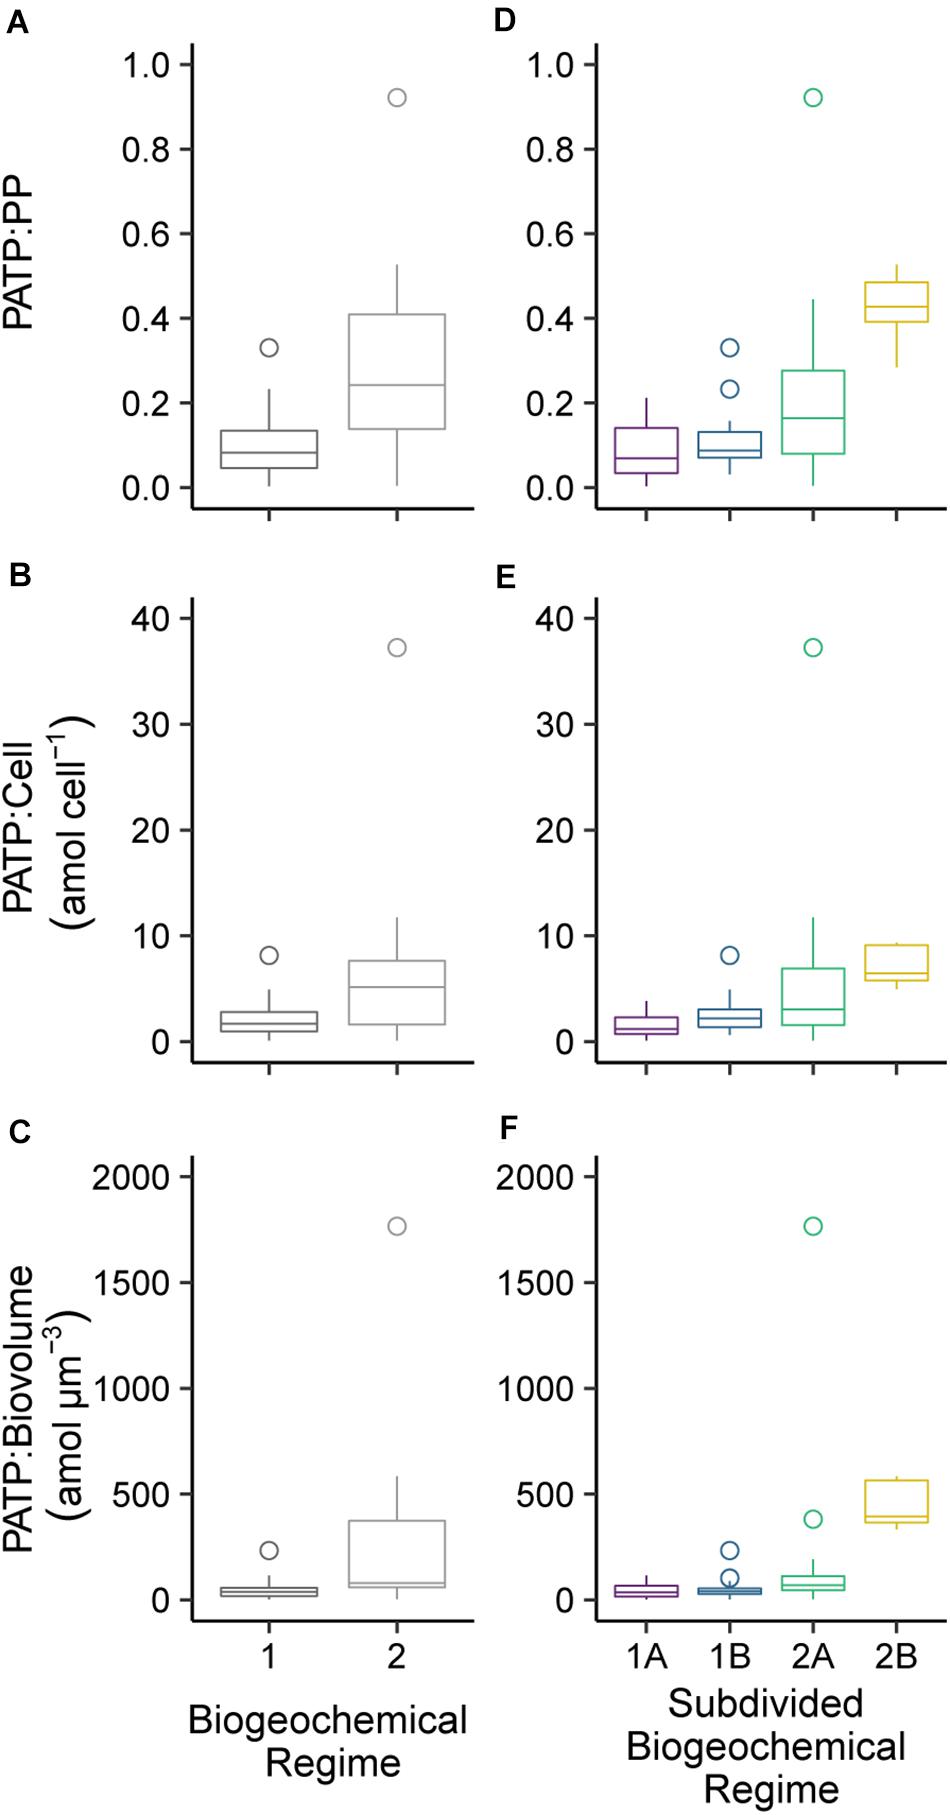
Figure 5. Comparison of the median particulate adenosine triphosphate (PATP) concentrations normalized to (A) particulate phosphorus (PP) concentration, (B) total microbial abundances (Cell), and (C) estimated total microbial biovolume (Biovolume) between the combined biogeochemical regimes 1A and 1B to the combined regimes 2A and 2B. A comparison of PATP normalized to (D) PP, (E) Cell, and (F) Biovolume between the four subdivided biogeochemical regimes (1A, 1B, 2A, 2B). The boxplot whiskers extend to 1.5 times the interquartile range of the data points and outliers were plotted as points.
The four subdivided regimes reflected variations in notable environmental conditions within the P06E transect (Table 1). Both Regime 1A and 1B were defined as upper surface waters, but they can be distinguished by their longitudinal location along the transect (Figure 4B). Regime 1A was located in the convergence zone, and thus defined by low inorganic nutrient concentrations, high organic nutrient concentrations, high salinity, high temperatures, and high oxygen concentrations (Table 1 and Figure 4B). Regime 1A also had high abundances of phytoplankton and non-pigmented picoplankton. Regime 1B was also near the surface but located in the upwelling region of the transect, with greater inorganic nutrient concentrations, lower temperatures, and lower salinity than regime 1A (Table 1 and Figure 4B). Regime 1B additionally mapped onto the deep chlorophyll maximum and had significantly greater total microbial biomass than regime 1A (Table 1 and Figure 4B).
Despite the drastic shifts in the upper surface water conditions from the convergence zone to the upwelling zone, there was not a difference in PATP:PP, PATP:Cell, nor PATP:Biovolume between regime 1A and 1B (Table 1 and Figure 5); hence indicating that PATP could be used as a reasonable, consistent measure of biomass in surface waters across a variety of environmental conditions in the shallow, euphotic open ocean. However, PATP normalized to biomass was not consistent between the surface waters, regime 1, and the regimes below the deep chlorophyll maximum, regimes 2A and 2B (Table 1 and Figure 5). This indicates that PATP would not serve as a reasonable proxy for biomass across an open ocean transect spanning euphotic and subeuphotic depths, supporting our first hypothesis of variations in the relationship between PATP and biomass across the South Pacific transect.
There were statistically greater PATP:Biomass ratios in regime 2 over regime 1 as a whole (Table 1 and Figure 5) which can be explained by the environmental differences between the two regimes. In addition to the difference in depth, regime 2 also had statistically greater inorganic nutrient concentrations, less microbial abundance and biomass, less phytoplankton, and lower organic nutrient concentrations than regime 1 (Table 1). Additionally, regime 2B was located within an oxygen depleted zone (Figure 4B and Table 1) in the upwelling system. We hypothesized that the leading cause of the higher PATP:Biomass in regime 2 compared to regime 1 was due to either the microbial community response to differences in nutrient availability or due to an increase in chemoautotrophic abundance. These hypotheses were further investigated by exploring conditions within each regime.
Biogeochemical Drivers of PATP:Biomass Variations
To further investigate our second hypothesis, that variations in PATP independent of biomass were due to the microbial community and nutrient availability, we examined both the relative changes in the microbial community and nutrients between regime 1 and 2 (Table 1). Potential explanatory variables for the higher PATP:Biomass ratios in regime 2 compared to regime 1 include both the difference in the microbial community structure and resource availability between the two regimes. The microbial community below the deep chlorophyll maximum, regime 2, is typically dominated by heterotrophic bacteria (Campbell et al., 1997; Grob et al., 2007; Van Wambeke et al., 2008), chemoautotrophs, and archaea (Karner et al., 2001; Santoro et al., 2019), as observed in our data from non-pigmented picoplankton (Figure 2 and Table 1).
The heterotrophic bacteria generate ATP primarily through oxidative phosphorylation as a result of organic carbon respiration. The depths below the euphotic zone typically have lower DOC availability, lower labile DOC release typically associated with photoautotrophs, and spatiotemporal variations of organic matter sources (Carlson and Ducklow, 1995; Carlson et al., 2002). Therefore, it is favorable for the microbial community in these low DOC environments to be primed to take advantage of infrequent, opportunistic organic matter inputs by using extracellular enzymes to hydrolyze organic substrates for uptake (Ammerman and Azam, 1985; Hoppe et al., 1993; Arnosti, 2011; Zimmerman et al., 2013). Metabolic energy, in the form of ATP, is required to produce these hydrolytic enzymes (del Giorgio and Cole, 1998). Thus, we further hypothesize that a microbial community that must respond to pulses of organic matter below the euphotic zone would build-up stores of intracellular ATP (PATP). Our results from regime 2 support this hypothesis, showing higher cellular stores of PATP through significantly higher ratios of PATP:PP, PATP:Cell, and PATP:Biovolume in the heterotroph dominated community of the subeuphotic zone compared to the shallow water euphotic depths of regime 1 (Table 1).
An alternative explanation for the increase in PATP:Biomass in regime 2 is that there was a shift in the non-pigmented picoplankton microbial community with a greater abundance of chemoautotrophs. Thaumarchaeota (ammonia oxidizing chemoautotrophs) and nitrifying bacteria have both been observed to increase in abundance below the euphotic zone or deep chlorophyll maximum (Mincer et al., 2007; Santoro et al., 2019; Semedo et al., 2021), with thaumarchaeota maximizing in the upper mesopelagic and comprising up to 40% of total cells (Karner et al., 2001). These thaumarchaeota and nitrifying bacteria abundance patterns coincide with the increase in PATP:Biomass measured in regime 2 (Figures 1F–H). Additionally, these chemoautotrophs generate their required PATP for their metabolic functions without reliance on organic carbon but rather depending on reduced nitrogen species (Santoro et al., 2019), altering their metabolic PATP:Biomass requirements (Könneke et al., 2014).
In addition to comparisons between the two regimes, we conducted linear regressions for the PATP:Biomass ratios vs. the environmental conditions within regime 1 (Figure 6 and Supplementary Table 2) and within regime 2 (Figure 6 and Supplementary Table 3), and looked at the relationships between the individual biomass parameters (Supplementary Figure 1). The relationships in both regimes for PATP:PP vs. nutrients, microbial abundance, and other environmental parameters were consistent with the linear relationships for the other PATP:Biomass ratios, PATP:Cell and PATP: Biovolume, vs. the data parameters (Supplementary Tables 2, 3 and Supplementary Figures 2, 3). Within the non-pigmented picoplankton dominated regime 2, the regressions between PATP:PP and environmental conditions demonstrate that PATP:PP was significantly greater with higher inorganic nutrient concentrations, DIN and DIP, and lower temperatures (Figure 6 and Supplementary Table 3). Although the relationships within regime 2 were not significant for organic nutrients, there was a trend of greater PATP:PP ratios with lower DOC and DOP concentrations (Figure 6). The OMZ in the upwelling region of the transect, regime 2B, had overall significantly greater PATP:PP and PATP:Biovolume ratios than 2A, oxygen replete subeuphotic waters (Table 1 and Figures 5D–F). However, there was not enough sampling done in the OMZ to test for statistical significance of linear trends within regime 2B. Across all of regime 2 there was not a significant trend between PATP:Biomass and oxygen (Supplementary Table 3). The abundance of chemoautotrophic microbes has been observed to increase in marine environments with less than 25 μM oxygen (Lau et al., 2019). The sampled OMZ reached oxygen concentrations below this range, and thus we expect that microbes sampled in the OMZ had significantly greater abundances of chemoautotrophic microbes than the rest of the transect (Lau et al., 2019), further coinciding with higher PATP:Biomass ratios. However, these higher PATP:Biomass ratios in the OMZ were surprising, based on the expectation that microbial implementation of anaerobic metabolisms would be less efficient at converting organic energy sources into PATP than aerobic metabolisms (Jin, 2012). Nonetheless, the biomass normalized PATP was higher in the region with low oxygen, indicating changes in the allocation and use of PATP in microbial cells in this oxygen depleted regime.
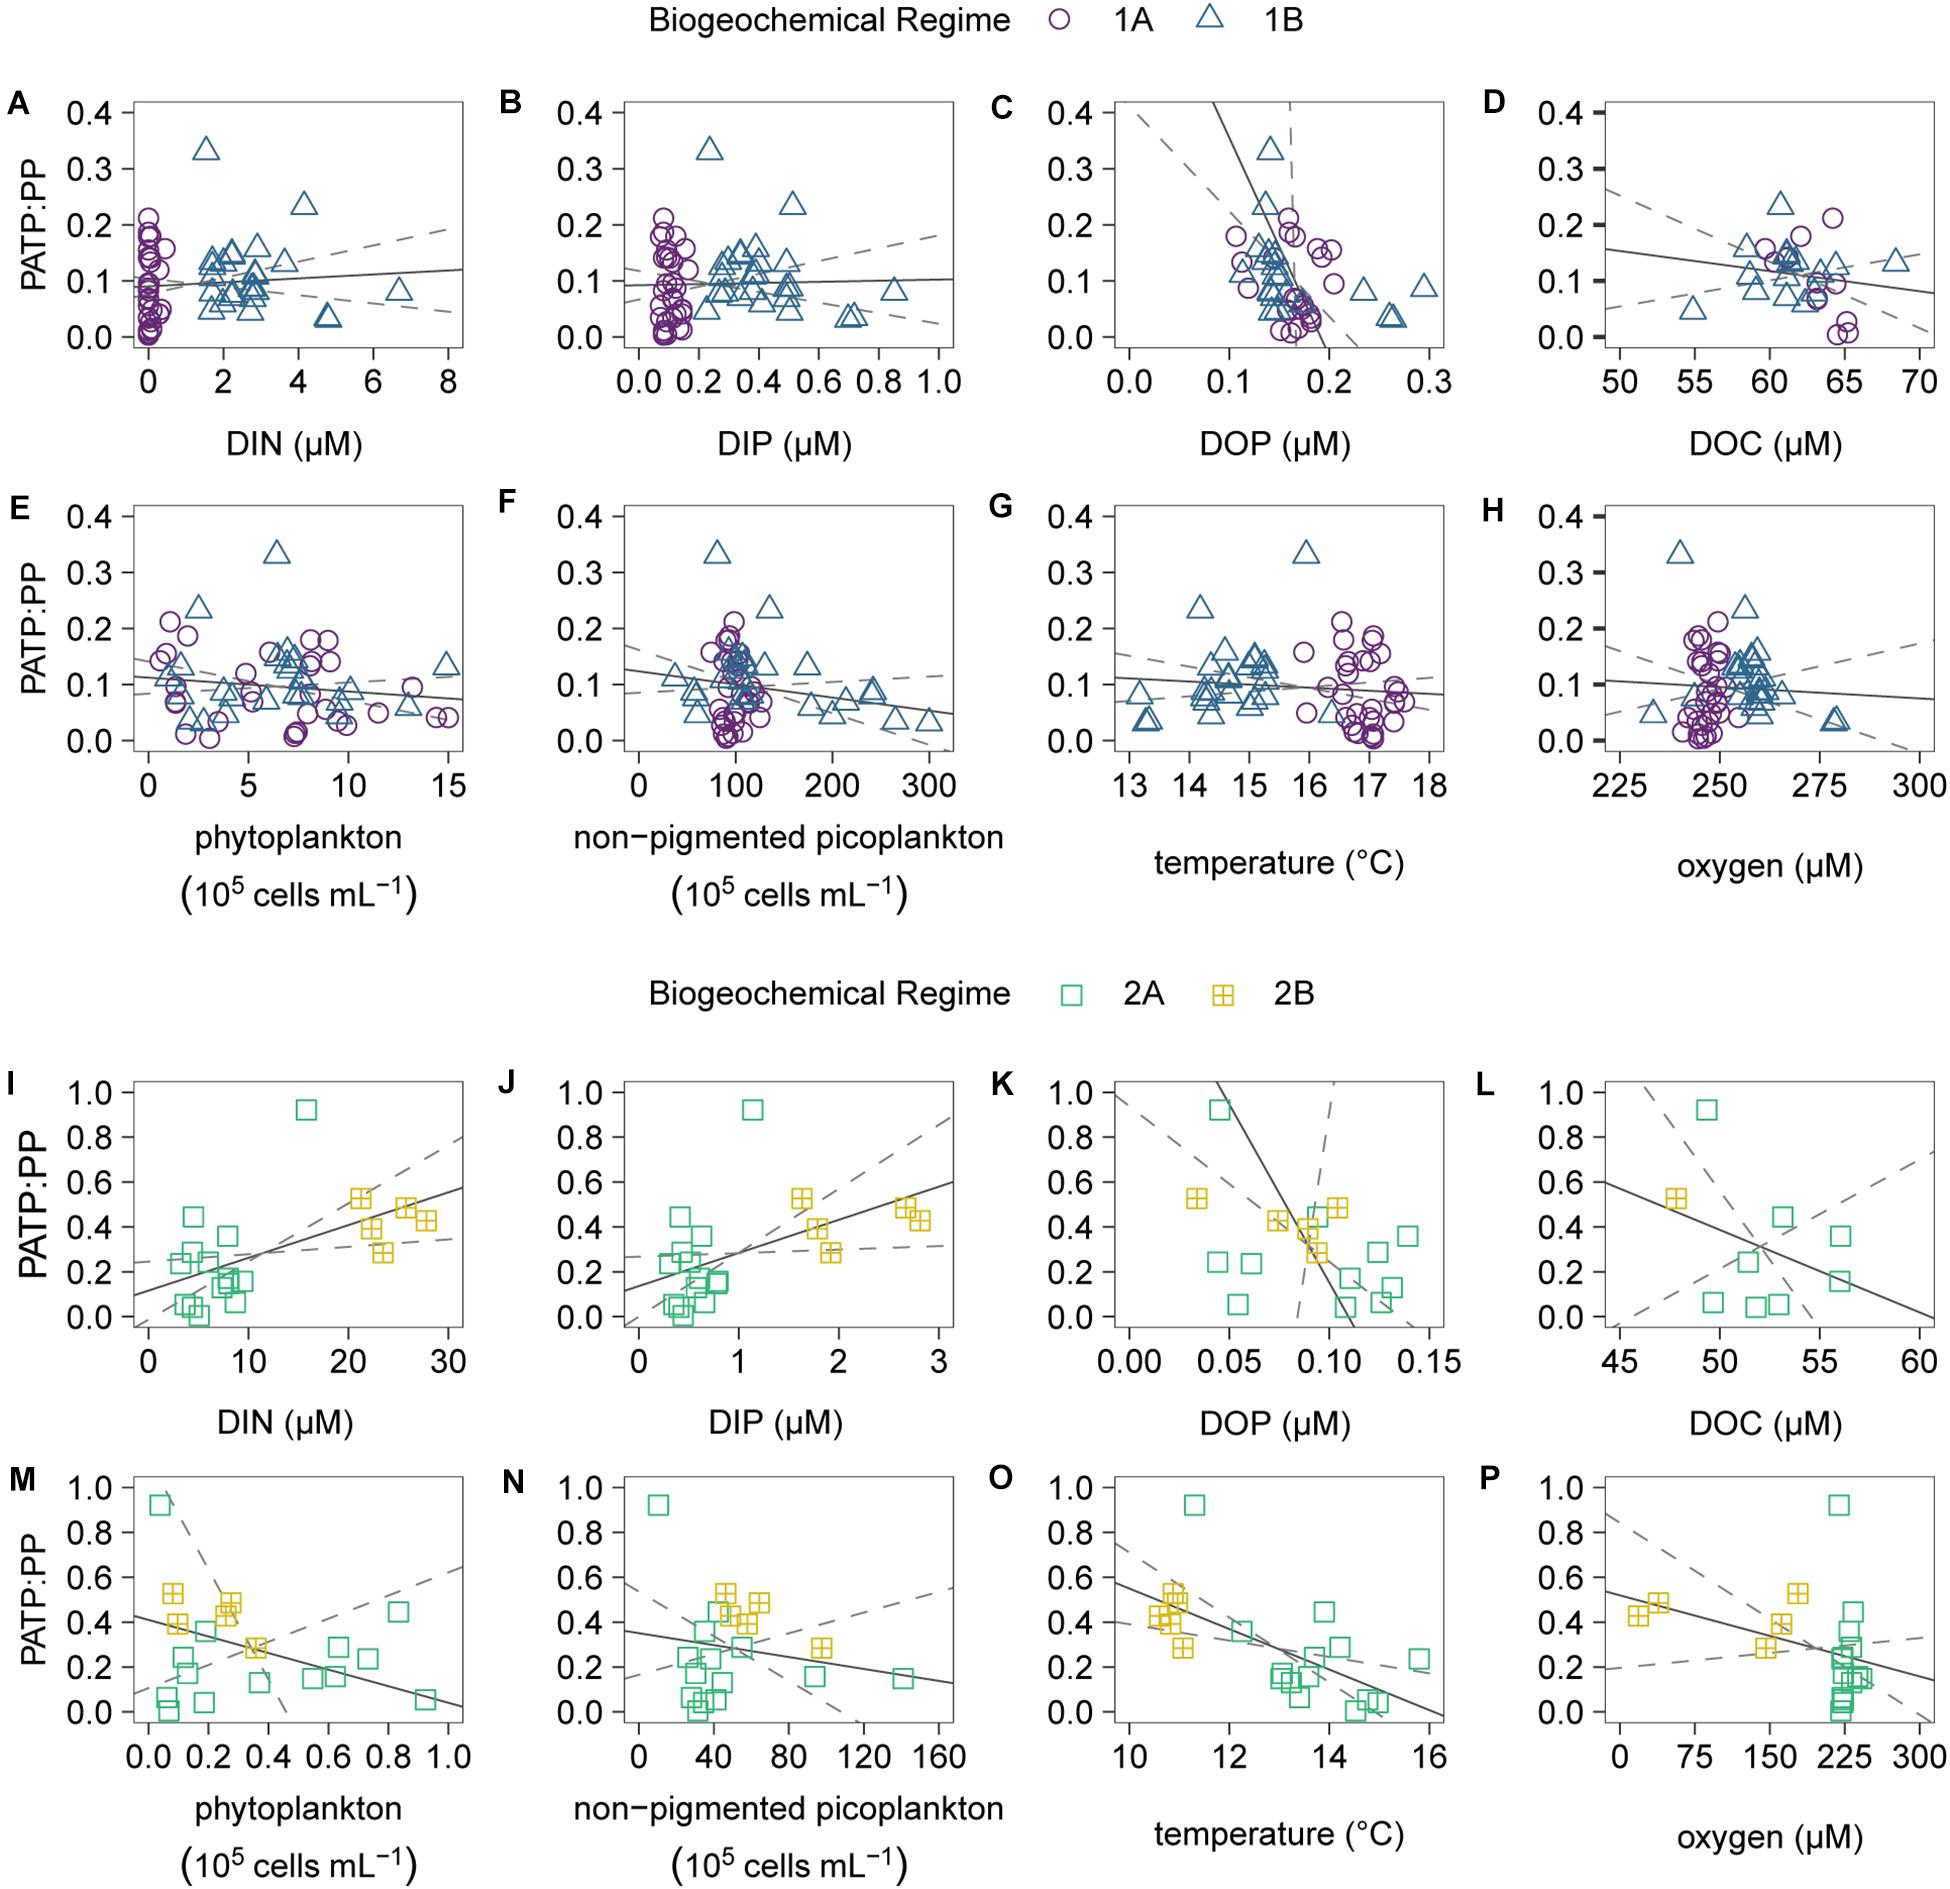
Figure 6. Scatter plots and Model II linear regressions for the combined regimes 1A (purple circles) and 1B (blue triangles) of the particulate ATP normalized to particulate phosphorus (PATP:PP) vs. (A) dissolved inorganic nitrogen (DIN), (B) dissolved inorganic phosphorus (DIP), (C) dissolved organic phosphorus (DOP), (D) dissolved organic carbon (DOC), (E) phytoplankton abundance, (F) non-pigmented picoplankton abundance, (G) temperature, and (H) oxygen. Scatter plots and Model II linear regressions for the combined regimes 2A (green squares) and 2B (yellow squares with crosses) of the PATP:PP (y-axes) vs. (I) DIN, (J) DIP, (K) DOP, (L) DOC, (M) phytoplankton abundance, (N) non-pigmented picoplankton abundance, (O) temperature, and (P) oxygen. All available data points were utilized for the linear regressions (gray solid lines) and 95% confidence intervals (gray dashed lines).
Conclusion
We identified that variations in PATP concentrations in open ocean upper surface waters, shallower than approximately 150 m, are representative of variations in live biomass, consistent with previous assumptions and uses of PATP concentrations in the environment (Holm-Hansen and Booth, 1966; Karl, 1980; McGrath and Sullivan, 1981; Balkwill et al., 1988). However, in subeuphotic depths, just below the deep chlorophyll maximum, we found significantly greater concentrations of PATP per biomass based on biomass measured by particulate phosphorus, microbial cell abundance, and cell biovolume. We hypothesize that higher PATP:Biomass observed was a consequence of different microbial metabolisms and strategies being utilized. We also found a positive relationship between PATP:Biomass and inorganic nutrients in the subeuphotic waters. In these subeuphotic waters organic energy source availability is lower and inconsistent. Thus, microbes may be storing more PATP as a priming strategy so they can take advantage of energy sources when available. Alternatively, the greater PATP:Biomass ratios below the euphotic zone could be due to increased abundances of chemoautotrophic bacteria and archaea. Higher biomass normalized PATP concentrations were also found in the oxygen depleted zone compared to other subeuphotic samples, despite the expectation that anaerobic metabolisms would produce less PATP per organic carbon molecule oxidized than aerobic metabolisms (Jin, 2012). We hypothesize that although the anaerobic metabolisms are less efficient at converting organic sources into PATP than aerobic metabolisms, the overall use of priming strategies and greater abundances of chemoautotrophic microbes (Lau et al., 2019) in the subeuphotic oxygen depleted zone resulted in greater PATP concentrations per biomass than seen in oxygenated surface waters. Overall, we assert that PATP concentrations can be useful in identifying community-wide microbial responses to the environment, illuminating far more nuanced trends than simply estimates for live microbial biomass, and should be analyzed with respect to biomass changes more extensively and in broader marine environments.
Data Availability Statement
The raw data supporting the conclusions of this article will be made available by the authors, without undue reservation.
Author Contributions
KL completed the collection of samples from the South Pacific, laboratory analyses, and statistical analyses. KL and KP completed the intellectual concepts, experimental design, and manuscript production. Both authors contributed to the article and approved the submitted version.
Funding
This work was supported by the Mary Roche Fellowship and institutional funds from the University of Miami, including funds for open-access publication fees.
Conflict of Interest
The authors declare that the research was conducted in the absence of any commercial or financial relationships that could be construed as a potential conflict of interest.
Acknowledgments
We thank the captain and crew of the R/V Nathaniel B. Palmer, and all the scientists who participated in and contributed to the GO-SHIP P06 research expedition. Thank you to the chief scientist Kevin Speer, the co-chief scientist Lena Schulze, and to Jim Swift and the Scripps Oceanographic Data Facility for CTD, nutrient, oxygen, and salinity measurements on the GO-SHIP P06 transect. We also thank the lab technicians of the GO-SHIP cruise: Susan Becker, David Cervantes, Andrew Barna, John Ballard, Kelsey Vogel, Kenneth Jackson, and Lucie Knor. Thank you to the Mary Roche Family Fellowship for research funding. We also thank the NSF/NOAA-funded U.S. Repeat Hydrography Program. Thank you to the laboratories at RSMAS that provided instrumentation, assistance and advice: the Hansell, Close, Brand, and Gaston laboratories. We also thank Solange Duhamel for insight and advice on ATP extraction methods. We also thank the members of the Popendorf laboratory for discussions and research contributions: Darci Swenson, Enid McLachlan, Donna Documet, Mukta Vibhute, and Sabrina Ufer. Thank you to Dennis Hansell for helpful comments on an early draft of the manuscript, and to two reviewers for suggestions which significantly improved the manuscript.
Supplementary Material
The Supplementary Material for this article can be found online at: https://www.frontiersin.org/articles/10.3389/fmars.2021.655898/full#supplementary-material
References
Admiraal, W., and Veldhuis, M. (1987). Determination of nucleosides and nucleotides in seawater by HPLC; application to phosphatase activity in cultures of the alga Phaeocystis pouchetii. Mar. Ecol. Prog. Ser. 36, 277–285. doi: 10.3354/meps036277
Adornato, L. R., Kaltenbacher, E. A., Villareal, T. A., and Byrne, R. H. (2005). Continuous in situ determinations of nitrite at nanomolar concentrations. Deep. Res. Part I 52, 543–551. doi: 10.1016/j.dsr.2004.11.008
Alhasawi, A., Auger, C., Appanna, V. P., Chahma, M., and Appanna, V. D. (2014). Zinc toxicity and ATP production in Pseudomonas fluorescens. J. Appl. Microbiol. 117, 65–73. doi: 10.1111/jam.12497
Ammerman, J. W., and Azam, F. (1985). Bacterial 5’-nucleotidase in aquatic ecosystems: a novel mechanism of phosphorus regeneration. Science 227, 1338–1340. doi: 10.1126/science.227.4692.1338
Arnosti, C. (2011). Microbial extracellular enzymes and the marine carbon cycle. Ann. Rev. Mar. Sci. 3, 401–425. doi: 10.1146/annurev-marine-120709-142731
Azam, F., and Hodson, R. E. (1977). Dissolved ATP in the sea and its utilisation by marine bacteria. Nature 267, 696–698. doi: 10.1038/267696a0
Balkwill, D. L., Leach, F. R., Wilson, J. T., McNabb, J. F., and White, C. (1988). Equivalence of microbial biomass measures based on membrane lipid and cell wall components, adenosine triphosphate, and direct counts in subsurface aquifer sediments. Microb. Ecol. 16, 73–84.
Berg, C., Dupont, C. L., Asplund-Samuelsson, J., Celepli, N. A., Eiler, A., Allen, A. E., et al. (2018). Dissection of microbial community functions during a cyanobacterial bloom in the baltic sea via metatranscriptomics. Front. Mar. Sci. 5:55. doi: 10.3389/fmars.2018.00055
Björkman, K. M., and Karl, D. M. (2001). A novel method for the measurement of dissolved adenosine and Guanosine triphosphate in aquatic habitats: applications to marine microbial ecology. J. Microbiol. Methods 47, 159–167. doi: 10.1016/S0167-7012(01)00301-3
Campbell, L., Liu, H., Nolla, H. A., and Vaulot, D. (1997). Annual variability of phytoplankton and bacteria in the subtropical North Pacific Ocean at Station ALOHA during the 1991-1994 ENSO event. Deep. Res. Part I Oceanogr. Res. Pap. 44, 167–192. doi: 10.1016/S0967-0637(96)00102-1
Carlson, C. A., and Ducklow, H. W. (1995). Dissolved organic carbon in the upper ocean of the central equatorial Pacific Ocean, 1992: daily and finescale vertical variations. Deep. Res. Part II 42, 639–656. doi: 10.1016/0967-0645(95)00023-J
Carlson, C. A., Giovannoni, S. J., Hansell, D. A., Goldberg, S. J., Parsons, R., Otero, M. P., et al. (2002). Effect of nutrient amendments on bacterioplankton production, community structure, and DOC utilization in the northwestern Sargasso Sea. Aquat. Microb. Ecol. 30, 19–36. doi: 10.3354/ame030019
Cuhel, R. L., and Waterbury, J. B. (1984). Biochemical composition and short term nutrient incorporation patterns in a unicellular marine cyanobacterium, Synechococcus (WH7803). Limnol. Oceanogr. 29, 370–374. doi: 10.4319/lo.1984.29.2.0370
Czajka, J. J., Abernathy, M. H., Benites, V. T., Baidoo, E. E. K., Deming, J. W., and Tang, Y. J. (2018). Model metabolic strategy for heterotrophic bacteria in the cold ocean based on Colwellia psychrerythraea 34H. Proc. Natl. Acad. Sci. U.S.A. 115, 12507–12512. doi: 10.1073/pnas.1807804115
Dai, R., Liu, H., Qu, J., Zhao, X., Ru, J., and Hou, Y. (2008). Relationship of energy charge and toxin content of Microcystis aeruginosa in nitrogen-limited or phosphorous-limited cultures. Toxicon 51, 649–658. doi: 10.1016/j.toxicon.2007.11.021
Davis, W. M., and White, D. C. (1980). Fluorometric determination of adenosine nucleotide derivatives as measures of the microfouling, detrital, and sedimentary microbial biomass and physiological status. Appl. Environ. Microbiol. 40, 539–548.
Defforey, D., and Paytan, A. (2018). Phosphorus cycling in marine sediments: advances and challenges. Chem. Geol. 477, 1–11.
del Giorgio, P. A., and Cole, J. J. (1998). Bacterial growth efficiency in natural aquatic systems. Annu. Rev. Ecol. Syst. 29, 503–541. doi: 10.1146/annurev.ecolsys.29.1.503
Duhamel, S., Björkman, K. M., van Wambeke, F., Moutin, T., and Karl, D. M. (2011). Characterization of alkaline phosphatase activity in the north and south pacific subtropical gyres: Implications for phosphorus cycling. Limnol. Oceanogr. 56, 1244–1254. doi: 10.4319/lo.2011.56.4.1244
Duhamel, S., Moutin, T., Van Wambeke, F., Van Mooy, B. A. S., Rimmelin, P., Raimbault, P., et al. (2007). Growth and specific P-uptake rates of bacterial and phytoplanktonic communities in the Southeast Pacific (BIOSOPE cruise). Biogeosciences 4, 941–956. doi: 10.5194/bgd-4-2027-2007
Dyhrman, S. T., and Ruttenberg, K. C. (2006). Presence and regulation of alkaline phosphatase activity in eukaryotic phytoplankton from the coastal ocean: Implications for dissolved organic phosphorus remineralization. Limnol. Oceanogr. 51, 1381–1390. doi: 10.4319/lo.2006.51.3.1381
Faul, K. L., Paytan, A., and Delaney, M. L. (2005). Phosphorus distribution in sinking oceanic particulate matter. Mar. Chem. 97, 307–333.
Fellows, D. A., Karl, D. M., and Knauer, G. A. (1981). Large particle fluxes and the vertical transport of living carbon in the upper 1500 m of the northeast Pacific Ocean. Deep Sea Res. 28A, 921–936. doi: 10.1016/0198-0149(81)90010-8
Ferla, R. L., Allegra, A., Azzaro, F., Greco, S., and Crisafi, E. (1995). Observations on the microbial biomass in two stations of Terra Nova Bay (Antarctica) by ATP and LPS measurements. Mar. Ecol. 16, 307–315. doi: 10.1111/j.1439-0485.1995.tb00414.x
Fischer, J. H. (1995). Specific detection of nucleotides, creatine phosphate, and their derivatives from tissue samples in a simple, isocratic, recycling, low-volume system. LC GC Int. 8, 254–264.
Geider, R. J., and La Roche, J. (2002). Redfield revisited: variability of C:N:P in marine microalgae and its biochemical basis. Eur. J. Phycol. 37, 1–17. doi: 10.1017/S0967026201003456
Greenstein, K. E., and Wert, E. C. (2019). Using rapid quantification of adenosine triphosphate (ATP) as an indicator for early detection and treatment of cyanobacterial blooms. Water Res. 154, 171–179. doi: 10.1016/j.watres.2019.02.005
Grob, C., Ulloa, O., Claustre, H., Huot, Y., Alarcón, G., and Marie, D. (2007). Contribution of picoplankton to the total particulate organic carbon concentration in the eastern South Pacific. Biogeosciences 4, 837–852. doi: 10.5194/bg-4-837-2007
Hashihama, F., Saito, H., Shiozaki, T., Ehama, M., Suwa, S., Sugiyama, T., et al. (2020). Biogeochemical controls of particulate phosphorus distribution across the oligotrophic subtropical Pacific ocean. Glob. Biogeochem. Cycles 34:e2020GB006669. doi: 10.1029/2020GB006669
Hodson, R. E., Azam, F., Carlucci, A. F., Fuhrman, J. A., Karl, D. M., and Holm-Hansen, O. (1981a). Microbial uptake of dissolved organic matter in Mcmurdo Sound, Antarctica. Mar. Biol. 61, 89–94. doi: 10.1007/BF00386648
Hodson, R. E., Maccubbin, A. E., and Pomeroy, L. R. (1981b). Dissolved adenosine triphosphate utilization by free-living and attached bacterioplankton. Mar. Biol. 64, 43–51. doi: 10.1007/BF00394079
Holm-Hansen, O., and Booth, C. R. (1966). The measurement of adenosine triphosphate in the ocean and its ecological significance. Limnol. Oceanogr. 11, 510–519. doi: 10.4319/lo.1966.11.4.0510
Hoppe, H. G., Ducklow, H., and Karrasch, B. (1993). Evidence for dependency of bacterial growth on enzymatic hydrolysis of particulate organic matter in the mesopelagic ocean. Mar. Ecol. Prog. Ser. 93, 277–283. doi: 10.3354/meps093277
Jin, Q. (2012). Energy conservation of anaerobic respiration. Am. J. Sci. 312, 573–628. doi: 10.2475/06.2012.01
Johnson, D. L. (1971). Simultaneous determination of arsenate and phosphate in natural waters. Environ. Sci. Technol. 5, 411–414.
Jones, D. R., Karl, D. M., and Laws, E. A. (1995). DNA: ATP ratios in marine microalgae and bacteria: implications for growth rate estimates based on rates of DNA synthesis. J. Phycol. 31, 215–223. doi: 10.1111/j.0022-3646.1995.00215.x
Karl, D. M. (1980). Cellular nucleotide measurements and applications in microbial ecology. Microbiol. Rev. 44, 739–796.
Karl, D. M. (1993). “Adenosine triphosphate (ATP) and total adenine nucleotide (TAN) pool turnover rates as measures of energy flux and specific growth rate in natural populations of microorganisms,” in Handbook of Methods in Aquatic Microbial Ecology, eds P. F. Kemp, B. F. Sherr, E. B. Sherr, and J. J. Cole (Boca Raton, FL: Lewis Publishers), 483–494.
Karl, D. M. (1999). A sea of change: biogeochemical variability in the North Pacific subtropical gyre. Ecosystems 2, 181–214. doi: 10.1007/s100219900068
Karl, D. M., and Bailiff, M. D. (1989). The measurement and distribution of dissolved nucleic acids in aquatic environments. Limnol. Oceanogr. 34, 543–558. doi: 10.4319/lo.1989.34.3.0543
Karl, D. M., and Björkman, K. M. (2014). “Dynamics of dissolved organic Phosphorus,” in Biogeochemistry of Marine Dissolved Organic Matter, eds D. A. Hansell and C. A. Carlson (Cambridge, MA: Academic Press, Inc), 233–334.
Karl, D. M., and Bossard, P. (1985). Measurement and significance of ATP and adenine nucleotide pool turnover in microbial cells and environmental samples. J. Microbiol. Methods 3, 125–139. doi: 10.1016/0167-7012(85)90040-5
Karl, D. M., and Craven, D. B. (1980). Effects of alkaline phosphatase activity on nucleotide measurements in aquatic microbial communities. Appl. Environ. Microbiol. 40, 549–561. doi: 10.1128/aem.40.3.549-561.1980
Karl, D. M., and Holm-Hansen, O. (1976). Effects of Luciferin concentration on the quantitative assay of ATP using crude luciferase. Anal. Biochem. 75, 100–112. doi: 10.1016/0022-2313(88)90465-6
Karl, D. M., and Tien, G. (1992). MAGIC: a sensitive and precise method for measuring dissolved phosphorus in aquatic environments. Limnol. Oceanogr. 37, 105–116. doi: 10.4319/lo.1992.37.1.0105
Karner, M. B., Delong, E. F., and Karl, D. M. (2001). Archaeal dominance in the mesopelagic zone of the Pacific Ocean. Nature 409, 507–510. doi: 10.1038/35054051
Könneke, M., Schubert, D. M., Brown, P. C., Hügler, M., Standfest, S., Schwander, T., et al. (2014). Ammonia-oxidizing archaea use the most energy-efficient aerobic pathway for CO2 fixation. Proc. Natl. Acad. Sci. U.S.A. 111, 8239–8244. doi: 10.1073/pnas.1402028111
Lau, E., Frame, C. H., Nolan, E. J., Stewart, F. J., Dillard, Z. W., Lukich, D. P., et al. (2019). Diversity and relative abundance of ammonia- and nitrite-oxidizing microorganisms in the offshore Namibian hypoxic zone. PLoS One 14:e217136. doi: 10.1371/journal.pone.0217136
Laws, E. A., Karl, D. M., Redalje, D. G., Jurick, R. S., and Winn, C. D. (1983). Variability in ratios of phytoplankton carbon and RNA to ATP and chlorophyll A in batch and continuous cultures. J. Phycol. 19, 439–445.
Liu, H., Jiang, Y., Luo, Y., and Jiang, W. (2006). A simple and rapid determination of ATP, ADP and AMP concentrations in pericarp tissue of litchi fruit by high performance liquid chromatography. Food Technol. Biotechnol. 44, 531–534.
Lomas, M. W., Burke, A. L., Lomas, D. A., Bell, D. W., Shen, C., Dyhrman, S. T., et al. (2009). Sargasso Sea phosphorus biogeochemistry: an important role for dissolved organic phosphorus (DOP). Biogeosci. Discuss. 6, 10137–10175. doi: 10.5194/bgd-6-10137-2009
McGrath, S. M., and Sullivan, C. W. (1981). Community metabolism of adenylates by microheterotrophs from the Los Angeles Harbor and Southern California Coastal Waters. Mar. Biol. 62, 217–226. doi: 10.1007/BF00394077
Meeder, E., MacKey, K. R. M., Paytan, A., Shaked, Y., Iluz, D., Stambler, N., et al. (2012). Nitrite dynamics in the open ocean-clues from seasonal and diurnal variations. Mar. Ecol. Prog. Ser. 453, 11–26. doi: 10.3354/meps09525
Mincer, T. J., Church, M. J., Taylor, L. T., Preston, C., Karl, D. M., and DeLong, E. F. (2007). Quantitative distribution of presumptive archaeal and bacterial nitrifiers in Monterey Bay and the North Pacific Subtropical Gyre. Environ. Microbiol. 9, 1162–1175. doi: 10.1111/j.1462-2920.2007.01239.x
Morey, J. S., Monroe, E. A., Kinney, A. L., Beal, M., Johnson, J. G., Hitchcock, G. L., et al. (2011). Transcriptomic response of the red tide dinoflagellate, Karenia brevis, to nitrogen and phosphorus depletion and addition. BMC Genomics 12:346. doi: 10.1186/1471-2164-12-346
Naganuma, T., Kimura, H., Karimoto, R., and Pimenov, N. V. (2006). Abundance of planktonic thraustochytrids and bacteria and the concentration of particulate ATP in the Greenland and Norwegian Seas. Polar Biosci. 20, 37–45.
Özogul, F., Taylor, K. D. A., Quantick, P. C., Özogul, Y., Ozogul, F., Taylor, K. D. A., et al. (2000). A rapid HPLC-determination of ATP-related compounds and its application to herring stored under modified atmosphere. Int. J. Food Sci. Technol. 35, 549–554. doi: 10.1111/j.1365-2621.2000.00405.x
Paytan, A., Cade-Menun, B. J., McLaughlin, K., and Faul, K. L. (2003). Selective phosphorus regeneration of sinking marine particles: evidence from 31P-NMR. Mar. Chem. 82, 55–70. doi: 10.1016/S0304-4203(03)00052-5
R Core Team (2020). R: A Language and Environment for Statistical Computing. Vienna: R Foundation for Statistical Computing.
Rappe, M. S., Connon, S. A., Vergin, K. L., and Giovannoni, S. J. (2002). Cultivation of the ubiquitous SAR11 marine bacterioplankton clade. Nature 418, 630–633. doi: 10.1038/nature00917
Raven, J. A. (1998). The twelfth Tansley Lecture. Small is beautiful: the picophytoplankton. Funct. Ecol. 12, 503–513. doi: 10.1046/j.1365-2435.1998.00233.x
Romano, J. C., and Daumas, R. (1981). Adenosine nucleotide “energy charge” ratios as an ecophysiological index for microplankton communities. Mar. Biol. 62, 281–296. doi: 10.1007/BF00397695
Santoro, A. E., Richter, R. A., and Dupont, C. L. (2019). Planktonic marine archaea. Ann. Rev. Mar. Sci. 11, 131–158. doi: 10.1146/annurev-marine-121916-063141
Semedo, M., Lopes, E., Baptista, M. S., Oller-Ruiz, A., Gilabert, J., Tomasino, M. P., et al. (2021). Depth profile of nitrifying archaeal and bacterial communities in the remote oligotrophic waters of the North Pacific. Front. Microbiol. 12:624071. doi: 10.3389/fmicb.2021.624071
Strickland, J. D. H., and Parsons, T. R. (1972). in A Practical Handbook of Seawater Analysis, 2 Edn, ed. J. C. Stevenson (Ottawa, ON: Fisheries Research Board of Canada).
Suzumura, M. (2008). Persulfate chemical wet oxidation method for the determination of particulate phosphorus in comparison with a high-temperature dry combustion method. Limnol. Oceanogr. Methods 6, 619–629.
Swift, J., Becker, S., Wanninkhof, R., Feely, R., Millero, F., Fine, R., et al. (2019). CTD and Bottle data from Cruise P06E, Exchange Version. doi: 10.7942/C2JQ02
Thomson-Bulldis, A., and Karl, D. M. (1998). Application of a novel method for phosphorus determinations in the oligotrophic North Pacific Ocean. Limnol. Oceanogr. 43, 1565–1577. doi: 10.4319/lo.1998.43.7.1565
Van Mooy, B. A. S., and Devol, A. H. (2008). Assessing nutrient limitation of Prochlorococcus in the North Pacific subtropical gyre by using an RNA capture method. Limnol. Oceanogr. 53, 78–88. doi: 10.4319/lo.2008.53.1.0078
Van Wambeke, F., Obernosterer, I., Moutin, T., Duhamel, S., Ulloa, O., and Claustre, H. (2008). Heterotrophic bacterial production in the eastern South Pacific: longitudinal trends and coupling with primary production. Biogeosciences 5, 157–169. doi: 10.5194/bg-5-157-2008
Wan, N., DeLorenzo, D. M., He, L., You, L., Immethun, C. M., Wang, G., et al. (2017). Cyanobacterial carbon metabolism: fluxome plasticity and oxygen dependence. Biotechnol. Bioeng. 114, 1593–1602. doi: 10.1002/bit.26287
White, D. C. (1988). Validation of quantitative analysis for microbial biomass, community structure, and metabolic activity. Adv. Limnol. 31, 1–18.
Wickham, H. (2016). ggplot2: Elegant Graphics for Data Analysis. Berlin: Springer Science & Business Media.
Wilson, C. A., Stevenson, L. H., and Chrzanowski, T. H. (1981). The contribution of bacteria to the total adenosine triphosphate extracted from the microbiota in the water of a salt-marsh creek. J. Exp. Mar. Bio. Ecol. 50, 183–195. doi: 10.1016/0022-0981(81)90049-6
Zhang, C., Luo, H., Huang, L., and Lin, S. (2017). Molecular Mechanism of glucose-6-phosphate utilization in the dinoflagellate Karenia mikimotoi. Harmful Algae 67, 74–84. doi: 10.1016/j.hal.2017.06.006
Keywords: adenosine triphosphate, phosphorus, South Pacific, phytoplankton, bacteria, metabolic energy, microbial, chemoautotrophs
Citation: Lanpher KB and Popendorf KJ (2021) Variability of Microbial Particulate ATP Concentrations in Subeuphotic Microbes Due to Underlying Metabolic Strategies in the South Pacific Ocean. Front. Mar. Sci. 8:655898. doi: 10.3389/fmars.2021.655898
Received: 19 January 2021; Accepted: 29 April 2021;
Published: 10 June 2021.
Edited by:
Carol Robinson, University of East Anglia, United KingdomReviewed by:
Ricardo Maria Letelier, Oregon State University, United StatesCraig Alexander Carlson, University of California, Santa Barbara, United States
Copyright © 2021 Lanpher and Popendorf. This is an open-access article distributed under the terms of the Creative Commons Attribution License (CC BY). The use, distribution or reproduction in other forums is permitted, provided the original author(s) and the copyright owner(s) are credited and that the original publication in this journal is cited, in accordance with accepted academic practice. No use, distribution or reproduction is permitted which does not comply with these terms.
*Correspondence: Kaycie B. Lanpher, klanpher@rsmas.miami.edu