Drift Indices Confirm That Rapid Larval Displacement Is Essential for Recruitment Success in High-Latitude Oceans
 Maik Tiedemann
 Aril Slotte
 Richard D. M. Nash
 Erling K. Stenevik
 Olav S. Kjesbu
- 1Institute of Marine Research, Bergen, Norway
- 2Centre for Environment, Fisheries and Aquaculture Science, Lowestoft, United Kingdom
Larval drift is a key process for successful fish recruitment. We used Norwegian spring-spawning herring (Clupea harengus) as model species to investigate the relationship between larval drift and recruitment. Larval drift indices were derived from simulations based on survey observations between 1993 and 2016. We show that forward simulated larval drift indices have an important positive relation to recruitment success. The relationship demonstrates elevated recruitment when larvae relocate rapidly northwards toward the Barents Sea. Negative or low larval drift indices coincide with only weak recruitment emphasizing limited survival in years with enhanced larval retention. Hence, with this work we combine drift model outcomes refined with survey data indicating that more extensive larval drift is an important component in population dynamics for high-latitude small pelagic fishes. However, larval displacement alone represents only one among many controlling factors but may offer possible predictions of the probability of higher or lower recruitment in the short term. The applicability of the drift indices is adaptable in all world oceans and all marine organisms that occupy planktonic life stages exposed to dynamic ocean currents. The study demonstrates how larval drift indices help to identify larval transport or retention to be crucial for population replenishment.
Introduction
The successful persistence of a fish population is ultimately dependent on life cycle and history closure, i.e., connectivity between each life stage, spawning adults, eggs, larvae, juveniles on nurseries and recruitment of juveniles back to the adult population (Petitgas et al., 2013). In many fish populations, adults will migrate “up stream” of suitable juvenile nursery areas so that eggs and/or larvae will be delivered to the nurseries in a suitable timeframe (Parrish et al., 1981). This window is often dictated by the development time of the early life history stages and the conditioning of a nursery area prior to the arrival of the juveniles. The drift of the eggs and/or larvae is often very influential on the success of supply of juveniles to nurseries and thereby linked to the recruitment success of the population (van der Veer et al., 2015). Life cycle closure can be characterized by the “migration triangle” (Harden-Jones, 1968), however, this framework does not have a provision for “retention of larvae” as presented by Iles and Sinclair (1982). The first allows the offspring to drift with currents away from spawning grounds toward their nurseries. The second retains the offspring in the vicinity of the spawning grounds, at least for a while, and so provide an imprinting mechanism for the return to specific spawning areas (philopatry, natal fidelity) (Sinclair, 1988). Both dispersal mechanisms are assumed to benefit larval survival depending on the physical features of the location in question (Houde, 1989).
The origin of larval drift as a key process in population dynamics of fish was firstly presented by Hjort (1926). In 1900, Johan Hjort observed early cod (Gadus morhua L.) larvae drifting in currents over hundred kilometers away from spawning grounds. With the resulting strong year-classes Hjort assumed that this larval relocation is essential for elevated recruitment. He also described that an aberrant larval drift into unsuitable nurseries may increase larval mortality rates. In contrast, instead of larval drift, retention seems to be the key when larvae instead remain at their spawning areas (Bakun, 1996). Larval retention is defined as the contrast to larval drift since larvae are kept in a certain location (Cowen et al., 2003). However, the application of the word retention is vague because it is used in several contexts. The term has been used to mean the larvae remain in one particular area (Swearer et al., 1999). In other ecosystems like important upwelling ecosystems (García-Reyes et al., 2015), larval retention is regarded as a process keeping the larvae on the shelf even though larvae can be transported alongshore (Churchill et al., 2011). Alternatively, larvae can also be retained in mesoscale eddies, even though non-stationary eddies may transport larvae into other locations (Condie and Condie, 2016).
Along the Norwegian coast, especially on the wider bank areas on the continental shelf, stationary and mobile mesoscale eddies form (Sætre, 1999). The stationary eddies are assumed to play a fundamental role in the successful recruitment of Norwegian spring-spawning (NSS) herring (Clupea harengus L.). Here larvae are suggested to be retained together with their prey on the banks (Sætre et al., 2002). This principle forms the basis of the hypothesis that retention of larval herring is dominant over the first few months of larval life (Sinclair and Power, 2015). However, there are opposing observations and hypotheses. For example, in years where early larval stages of NSS herring are exposed to a strong northward displacement this may result in strong years-classes, as was described for the period 1959–1965 (Dragesund, 1970). In other years during this period, where larvae were retained and concentrated in specific areas, only weak year-classes occurred. The northward advection theory is further supported by recruitment success being positively linked to early spawning within a year (Husebø et al., 2009; Vikebø et al., 2010; Slotte et al., 2019) as well as to the intensity of the Norwegian Coastal Current (NCC) (Skagseth et al., 2015).
Over the last three decades, the use of biophysical modeling to identify drift patterns of marine larvae has increased more than fivefold (Swearer et al., 2019). Biophysical modeling allows particle tracking that provides information about larval dispersal which previously had to be the subject of complex and challenging field studies. Tracking NSS herring larvae in drift simulations indicated that most larvae drift was within the NCC, resulting in their arrival on their presumed nurseries in the Barents Sea plausible (Vikebø et al., 2010). However, parametrisations in drift models involve assumptions of presumed positions and times of the year a larva may have occurred in the field. To counteract this shortage, survey observations can provide a meaningful add-in to refine drift modeling outcomes (Espeland et al., 2015; Kvile et al., 2017).
The main objective of this work was to generate larval drift indices from survey observations that can be adapted to similar types of drift studies worldwide. In addition, as there is obviously some debate as to whether retention or drift results in a strong year class, further investigation is required. This clarification is especially important for oceanic, high-latitude species where the spawning is closely linked to the pulsed production of suitable prey (early copepod stages) (Sundby et al., 2016). We use NSS herring as model species and by combining information from field surveys within a biophysical model we simulated back- and forward drift of NSS herring larvae between 1993 and 2016. This period covers some successful recruitment years, but especially after 2004, where a strong environmental change was observed, there were 10 years where recruitment was particularly low (Tiedemann et al., 2020). From these simulations, larval drift indices were estimated and related to a recruitment index used in a Bayesian framework to link drift strength and direction with differing levels of recruitment (Churchill et al., 2011). We address three main questions: Which dispersal pattern dominates during the drift phase of NSS herring larvae in the years between 1993 and 2016? Which dispersal patterns can be linked to the different levels of recruitment? Do and how do the larval drift indices relate with NSS herring recruitment success?
Materials and Methods
To answer these questions field-based data were combined within advanced drift simulations. The simulations utilized a hydrodynamic dataset which allowed both back- and forward drift simulation to identify larval drift patterns for the years 1993–2016. Every effort was made to base the study on recommended practices for modeling physical–biological interactions (North et al., 2009). Any constraints in the setup of the drift simulations are further addressed in the discussion.
Using Existing Knowledge to Refine Drift Simulations of Early NSS Herring Larvae
Over more than a century, a large quantity of information has been gathered on the life cycle and dynamics of NSS herring (Nakken, 2008). A major part is the identification of several traits during the early larval stages. The main spawning occurs in patches along the continental shelf off the Norwegian coast (Dragesund et al., 1997). The survey data used here for the drift simulations are based on detailed sampling during the main drift phase of early NSS herring larvae along the Norwegian coast. After spawning at the sea floor in February–March (Slotte et al., 2000), NSS herring larvae hatch about 2–3 weeks later ascending to shallower depths (Blaxter and Ehrlich, 1974) and undertaking diurnal vertical migration (night shallow, day deep) (Munk et al., 1989; Ferreira et al., 2012). The pattern of vertical migration is additionally used to refine drift simulations. During dispersal, larvae stay within water masses of the NCC, where eddies can slow the northward larval displacement often retaining them for a time on banks (Sætre et al., 2002). Hence larval drift was simulated in current fields that should represent the NCC and eddy movements.
Survey Data as Input for the Drift Simulation
Along the continental shelf at <250 m bottom depths NSS herring larvae were collected during and after the main spawning season in March–April (Stenevik et al., 2012). Institute of Marine Research (IMR) surveys between 1993 and 2016 covered the main areas of larval occurrence. The earliest start was on 8th March 2004 and the latest end of surveys was on 27th April in 2000 and 2009. In 1993, the area between 60° and 66°N was covered (Supplementary Figures 1–4) with increasing northward extension of the surveys occurring each year until 1998 to 68°N and a farther northward extension between 1999 and 2014 to 71°N. However, in 2007 the survey only covered the area 62°–66°N due to bad weather hampering survey progress. In contrast to 1993, a southward extension to 59°N was conducted in 1997 to 2002 and again in 2011. In 1996 and especially 2004 to 2010 and 2012 to 2016, some of the most southern stations were omitted ending in between 61° and 62°N. The decision to undertake the north-south extensions was based on information from the spatial extent of the fishery on the spawning grounds, which was modified during the survey when zero larvae were reached. However, as the survey direction was either north to south or vice versa (Stenevik et al., 2012) the boundaries of the larval distribution are not always clearly defined. The transects were perpendicular along latitudes about 28–37 km apart with stations approximately 9.4 km apart. Larvae were collected using two different gears. During day-time double oblique hauls down to 75 m with a GULF III (Gehringer, 1952) (mesh size of 375 μm, mean speed of five knots, nose-cone diameter of 20 cm) were conducted. During night-time, a vertical T-80 ring-net (mouth 80 cm diameter and net 375 μm mesh) down to 150 m replaced the GULF III. The T-80 collected larvae in better condition with similar catch rates compared to the GULF III at night but 10 times lower catch-rates during the day (unpublished data). Station data, important for the use in the simulation, included the location of the station, the time of sampling, the abundance per length class (per 1 mm) collected and the age based on the total length (see below).
Parameterisation of the Drift Simulation
Parameterized station data were used to simulate larval drift within the Lagrangian drift model tool Ichthyop (Lett et al., 2008). This tool is designed for ichthyoplankton dispersal accounting for larval traits like vertical migration behavior, growth, and mortality. For each length class the age was estimated according to a constant temperature influence at 7°C [mean sea surface temperature at the Møre spawning grounds (Sætre, 2007)]. An approximate growth rate of 0.2 mm per day was implemented (Doyle, 1977). The length of a first-stage yolksac larva was set at 7 mm total length, based on the smallest larvae collected in the surveys. As a test example, we simulated 15 days of backward drift for a larva of 10 mm total length. Each particle was drifted forward until reaching an age of 60 days which approximately mirrors the last preflexion stage 2c from Doyle’s (1977) staging system. We restricted the days of simulation according to the youngest larval stages. The reasoning behind this is that older larvae (particularly flexion, postflexion, and later stages) develop an advanced swimming behavior which would increase model result uncertainties (Clark et al., 2005), though assuming the most vulnerable stages being within the very early life stages and thereby probably having the strongest effect on recruitment success (Hjort, 1914).
The starting point of the simulations were fitted with the position of the station where the larvae were collected. The information when a larva was collected was used to account for the most accurate timepoint using particles starting either at night position at 5 m below surface or 40 m below surface when being released during the day (Ferreira et al., 2012). We set the sunrise at 6:00 am and sunset at 9:00 pm – both settings in the spatial-temporal realm being compromises. The starting time was always rounded to a full hour and the end position of a GULF III haul was used as input, whereas the T-80 position reflects a precise position because of the vertical tows.
The hydrodynamic model GLORYS12V1 was used in Ichthyop as hydrodynamic dataset. It is an ocean-eddy resolving reanalysis product with data starting in 1993 freely accessible on the Copernicus Marine Service webpage1. The dataset contains a 3D daily mean field on a regular grid approximately 8 × 8 km. The dataset compiled (from global-reanalysis-phy-001-030-daily) comprises daily current fields with 50 vertical sigma levels. Ichthyop has a built-in function reading in the hydrodynamic model component based on the NEMO (Nucleus for European Modeling of the Ocean)2 framework. The choice of the hydrodynamic dataset was due to usability within Ichthyop and feasibility of simulation duration for a time series covering 24 years of survey observation compromising the relative coarse grid. The advection process was calculated using a 4′th Runge-Kutta numerical scheme. A horizontal dispersion process is implemented in the simulations as the default in Ichthyop (Peliz et al., 2007). The time step used to simulate larval drift was set to 60 s meaning that every minute a new geographical position was estimated. This routine was implemented for each larval size group per station for the back- and forward simulation. New positioning was saved in a NetCDF file for further analyses.
How to Quantify Retention or Drift
Every 4 h the position of a particle from the drift simulations was extracted from the NetCDF files leading to 6 positions per day. These positions were used to calculate the distance (d) travelled per 4 h according to Prasetya et al. (2020):
where φ is latitude, λ is longitude, R is the earth’s radius (mean radius = 6378137 m) and the drift direction (bearing = θ) according to
and the larval transport speed (vlarva)
with vlarva in m ∗ s–1 (4 h = 14400 s).
To illustrate yearly dispersal patterns 360° drift plots were produced to identify and summarize the direction and the speed the larvae were drifting. Both the direction and the speed were weighted based on larval abundances observed from the field sampling. Mortality was not included in the model as no specific mortality rates in different areas are known for the investigated periods. Due to limitation of computational power, larval abundances per length class and per station were divided by 10.
Using v and u as Indices for the Velocity and Directional Drift of Fish Larvae
A particle (larva) that drifts in water has a direction and a speed. From both direction and speed indices v and u were calculated; v and u are velocities that represent the directional force in the meridional and the zonal direction, respectively. In mathematical terms, v is a velocity only pointing toward a direction on the y-axis while u only on the x-axis. Hence, both can be used as index for either meridional or zonal drift. To calculate v and u a mathematical convention is needed including a conversion of larval drift direction (ldd) to math direction (mathd) according to
and
Given mathd we can calculate v and u according to
with θ as mathd converted from degrees to radians. The geosphere package (Hijmans, 2019) was used to calculate the distance and the bearing (direction) per drift segment with the R version 4.0.2 (R Core Team, 2020).
A positive v denotes a larva drifting from the south (northward drift), and a negative v a larva from the north (southward drift). A positive u denotes a larva drifting from the west (coastward drift) while a negative u from the east (offshore drift). A yearly index is produced by calculating the mean of v and u for each year and for both the backward vbackward and ubackward and forward vforward and uforward simulations. The further the mean values of v and u are from zero, the stronger the meridional and zonal drift for the total drift per year.
A Bayesian Approach to Relate Recruitment Success With Drift Indices
The International Council for the Exploration of the Sea (ICES) provides stock assessment indices for NSS herring each year, those of relevance here are recruitment at age 2 years (Rage2) and spawning-stock biomass (SSB). We used the ratio between Rage2 and SSBt–2 (the recruits originating from the SSB 2 years ago) (Tiedemann et al., 2020) defined as recruitment success (Rage2/SSBt–2 = Rsuccess), using the assessment undertaken in 2019 which encompasses the 1993 to 2016 year classes (ICES, 2019). The response variable with the larval drift indices were taken as co-variables (vbackward + ubackward and vforward + uforward) within a Bayesian inference (Rue et al., 2009). For this the R-INLA (integrated nested Laplace approximation) package within R version 4.0.2 was used.
Data exploration was undertaken according to Zuur et al. (2010). Rsuccess index and covariables were a-priori tested for outliers using dot plots indicating no serious issues. Recruitment success in the year 2002 was high compared to other values of the time series. Co-linearity between explanatory variables were tested using the Variance Inflation Factor (VIF < 3). vbackward and ubackward were more colinear with a VIF < 3 then vforward and uforward with a VIF < 2. Co-variables were standardized (scaled to zero mean and unit variance) and used in two models, to test the drift indices on Rsuccess per year, i.e., Rsuccess_i:
where Rsuccess_ i is μi with a gamma distribution and a parameter r for the variance, the expected value 𝔼(Rsuccess_i)is μi and μian inverse link function (log-link), β0 the intercept and xi the covariates. A gamma distribution is used as Rsuccess is continuous, strictly positive, and right-skewed (positive skewness). Due to the number of 24 years that represent 24 data points in the response variable the two most simple models were constructed with xi representing only drift indices calculated either from the forward or the backward simulations. Two models (modelbackward, modelforward) were constructed with modelbackward testing Rsuccessi ∼vbackward.stdi + ubackward.stdi and modelforward testing Rsuccessi ∼vforward.stdi + uforward.stdi. The deviance information criterion (DIC) and the Watanabe-Akaike information criterion (WAIC) were used for model selection resulting in the final model which is the full modelforward. The final model was validated based on Zuur et al. (2010). Homogeneity was tested visually using dotplots of residuals versus fitted values. Normality was assessed plotting histograms of the residuals. Temporal independence was tested by the autocorrelation function (ACF). Multi-panel scatterplots were used to visually identify relationships between Rsuccess and covariables to investigate possible non-linear relationships. Data validation plots can be found in the Supplementary Material (Supplementary Figure 7) and indicate no essential statistical issues.
The final model was interpreted in two ways. First, single effects of the covariables were predicted sketching the model fit for Rsuccess based on regular sequences of each range of vforward and uforward. The number of the sequence were based on the number of years from the time series (n = 24). For the final model each sequence either from back-standardized vforward or uforward was combined with corresponding mean back-standardized vforward or uforward values to predict the single effect of the covariables from which the regular sequences were computed. In a second step, the observed versus fitted values of Rsuccess were plotted to evaluate overall model performance. The sketched model fits allowed the interpretation of the single effect of each covariable from the final model. The model interpretation should answer the questions if the model produces realistic predictions, if and how the drift indices vforward and uforward correlate to recruitment success, if the drift direction and speed are important, and how the drift indices affect Rsuccess.
Results
Current Fields Used for Forward and Backward Simulations
Mean current fields from the period 1993–2016 indicate typical circulation patterns along the Norwegian continental shelf area. In the south, between 59°N and 62°N, an inner northward flow occurs, branching at around 63°N north off Møre into two possible drift routes for NSS herring larvae (Figure 1). One branch is closer to the coastline between the coast and the major bank areas with a second flowing northward along the shelf break (∼250 m isobaths). Both branches merge at around 67°N to the southwest of Lofoten. Up to this point the flow speed is between 0.1 and 0.4 m s–1. After the merger of both branches at 67° the flow intensifies frequently exceeding 0.5 m s–1. At around 70°N there is a second split into two branches of the NCC, one following the coastline toward the Barents Sea, the other following the shelf break northwards. Stationary mesoscale eddies are formed between the two branches of the NCC, over the major banks (Frøya Bank, Halten Bank, and Træna Bank). Additional non-stationary eddies form off Lofoten and further north where the NCC reaches maximum speeds, which progress offshore. For single years and to visually inspect eddy movement, the reader is referred to video animations (“Video1 – Video6.mp4” found in the Supplementary Material) that illustrates current fields used for larval drift simulations.
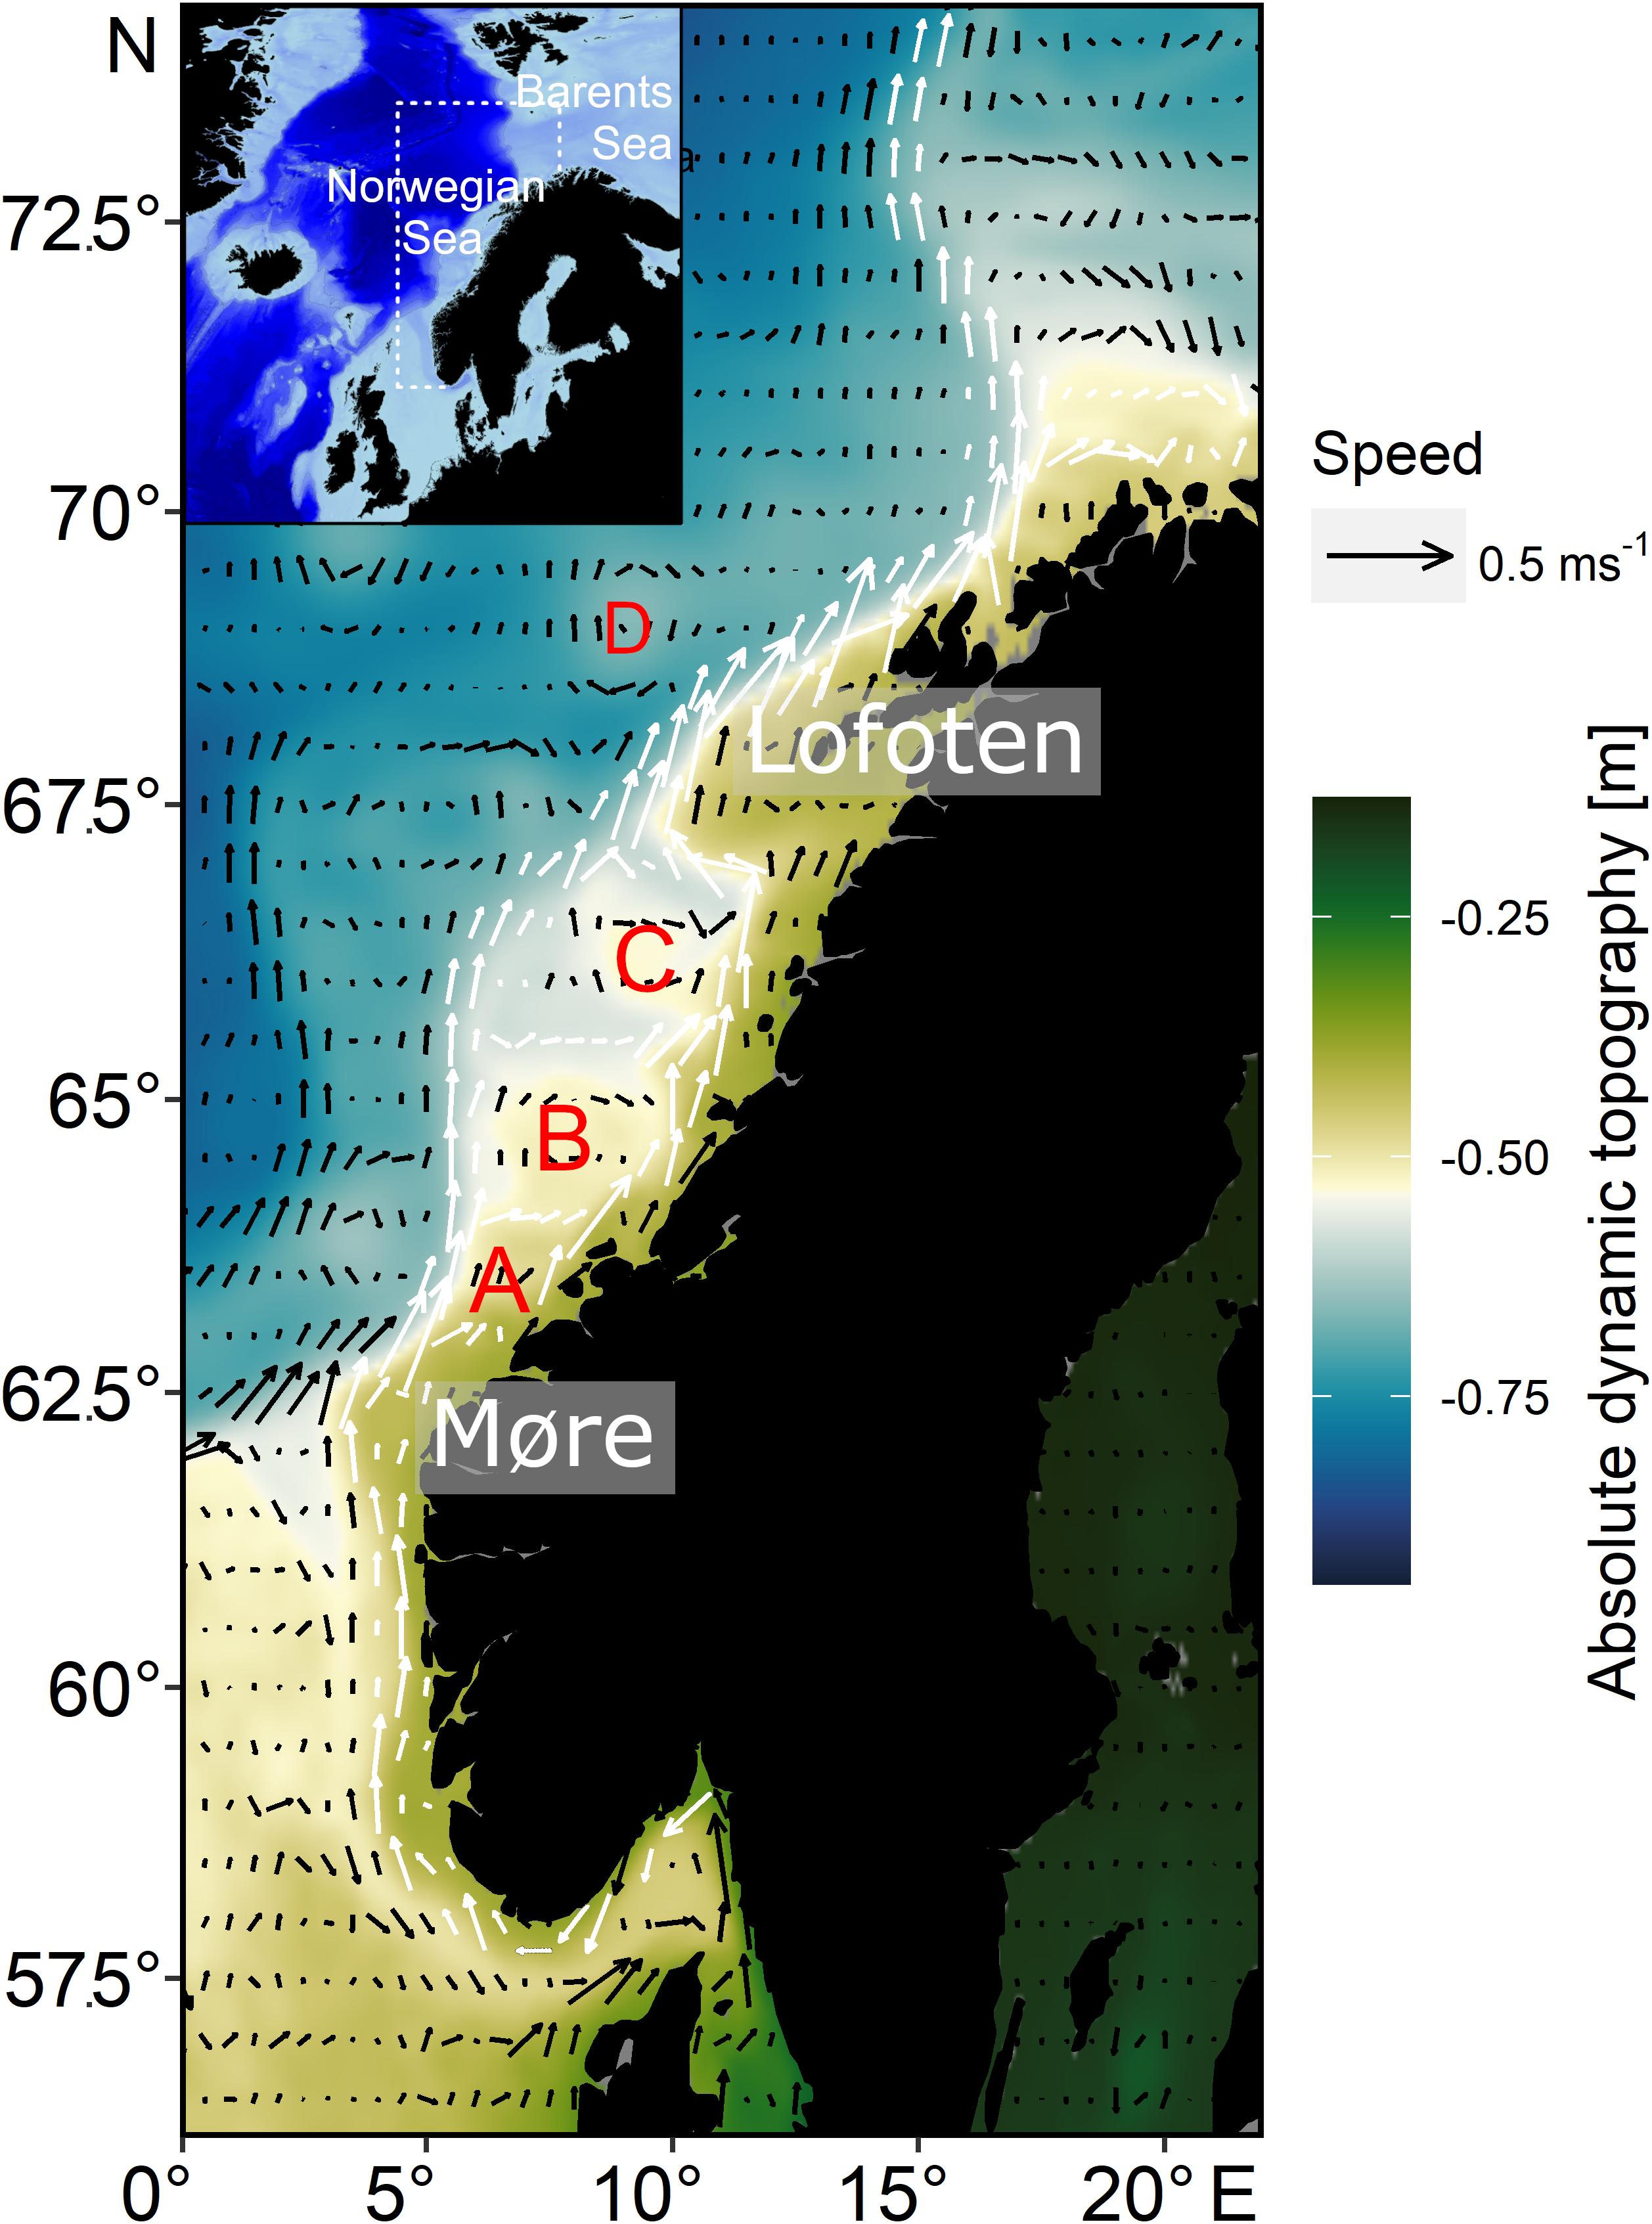
Figure 1. Study area with arrows illustrating currents along the Norwegian coast during the main larval drift season in March–April (average current strength and direction from 1993 to 2016) superimposed on absolute dynamic topography (average from 1993 to 2016); the main branches of the Norwegian Coastal Current are marked with white arrows; current data are based on GLORYS12V1 also used as hydrodynamic dataset for the larval drift simulations; stationary mesoscale eddies are mainly observed in A (Frøya Bank), B (Halten Bank), and C (Træna Bank); D depicts a mobile eddy that typically forms off Lofoten.
Outcome From Forward and Backward Drift Simulations
The larval drift from the backward simulation indicated the highest larval abundances north off Møre as well as on the Halten Bank area which are key spawning grounds of NSS herring (Figure 2). Spawning areas are additionally spread along the continental shelf. While most of the simulated spawning locations were at isobaths <250 m some final positions were also at depths >250 m either in the south of Møre or northwest of Lofoten. At Møre the larval patches drifted mainly northeastwards (Figures 2a versus 2b). From this location onwards many of the larval patches – slightly north off Møre – were transported mainly in the two branches of the NCC taking either the route of the coastal branch or some also along the second branch that follows the continental shelf break. At the widened continental shelf, enhanced larval retention could be observed on the Halten Bank and the Træna Bank (Figure 2b). At the point where the two branches join off Lofoten, larvae were transported farther northwards. Some of the currents and non-stationary mesoscale eddies that form off Lofoten carried larvae offshore. Reaching the shelf break some of the still very young larvae have already drifted into their main nurseries in the Barents Sea, whereas a few larvae followed the second offshore branch further north. During dispersal larvae reached average drift speeds of between 0.1 and 0.5 m s–1 reflecting the typical speed of the currents along the Norwegian coast (Figure 3 and Supplementary Figures 5, 6 360° drift plots). In all years, the northward drift component was frequent and dominant except for the 3 years 1995, 1997, and 2012, where also a frequent southward drift component was computed (Figures 3a–f). The years 2002–2004 reflected the dominant northward drift component, which was in marked contrast to 1995, 1997, and 2012.
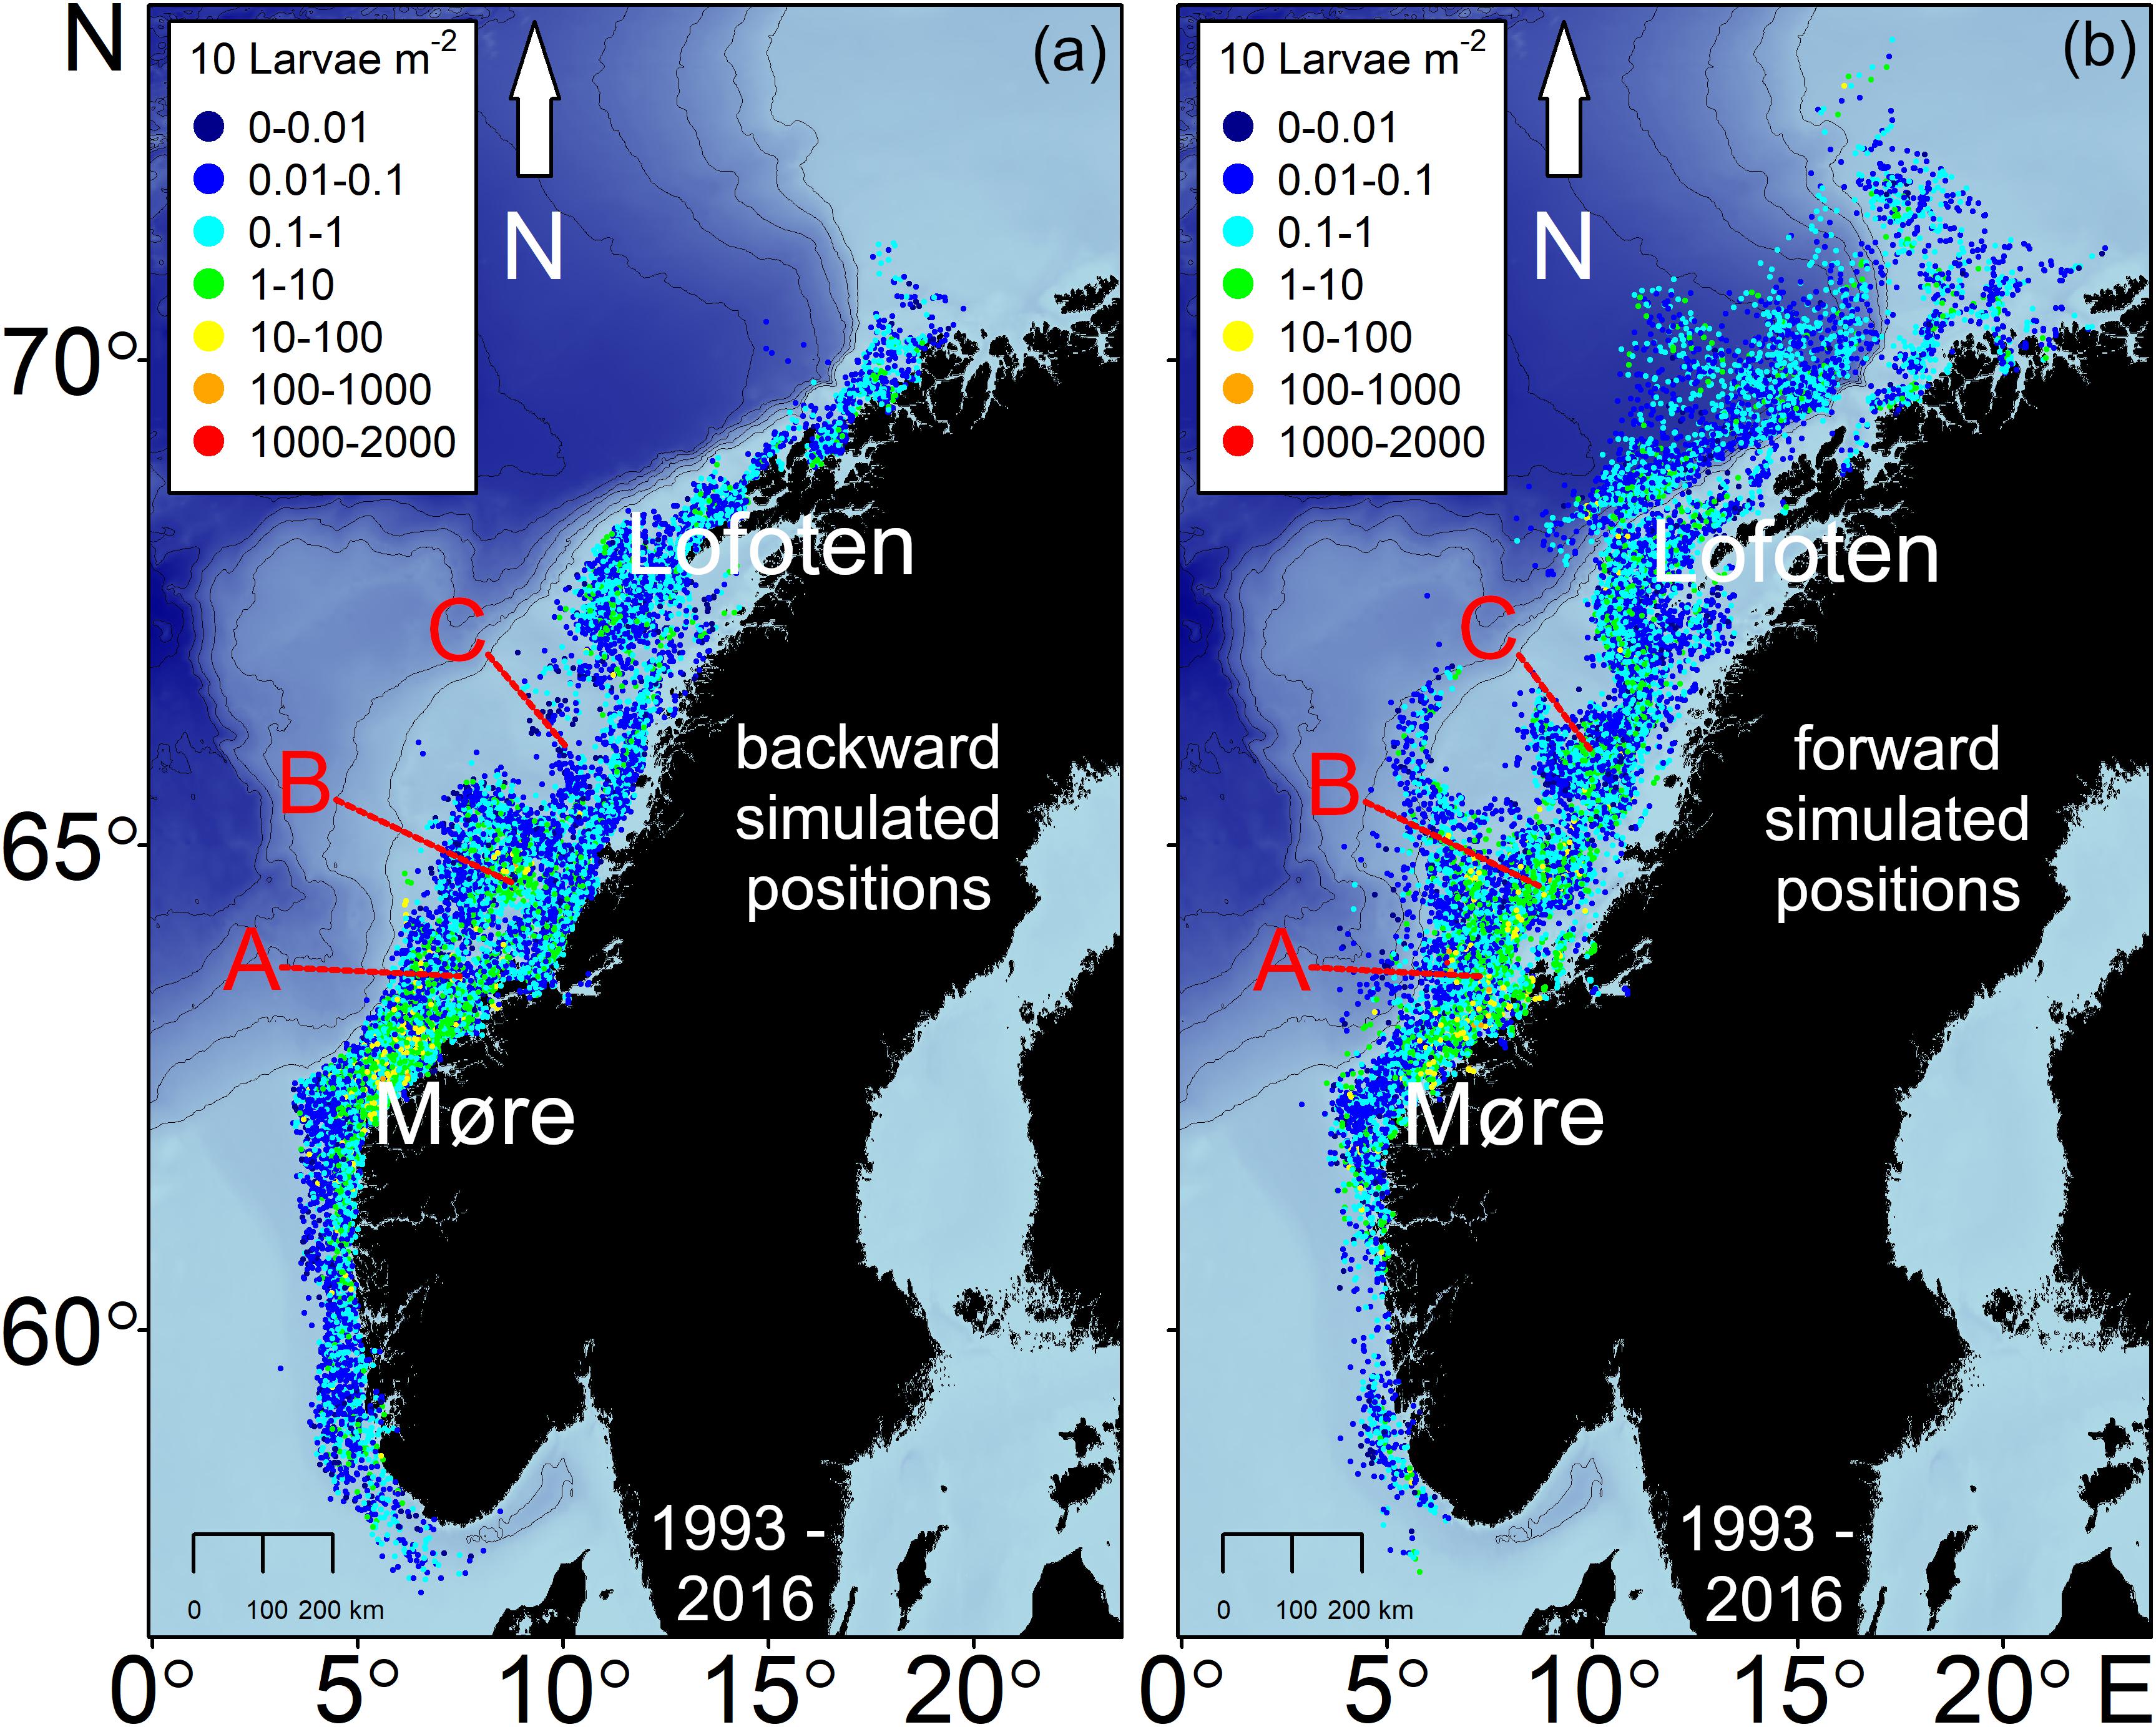
Figure 2. Larval drift simulation from all survey stations of NSS herring larvae in 1993–2016; each point represents the abundances of every size class [per mm] collected during the surveys for (a) the backward simulated starting point and (b) the endpoint after maximum of 60 days of forward drift simulation. A = Frøya Bank, B = Halten Bank, and C = Træna Bank.
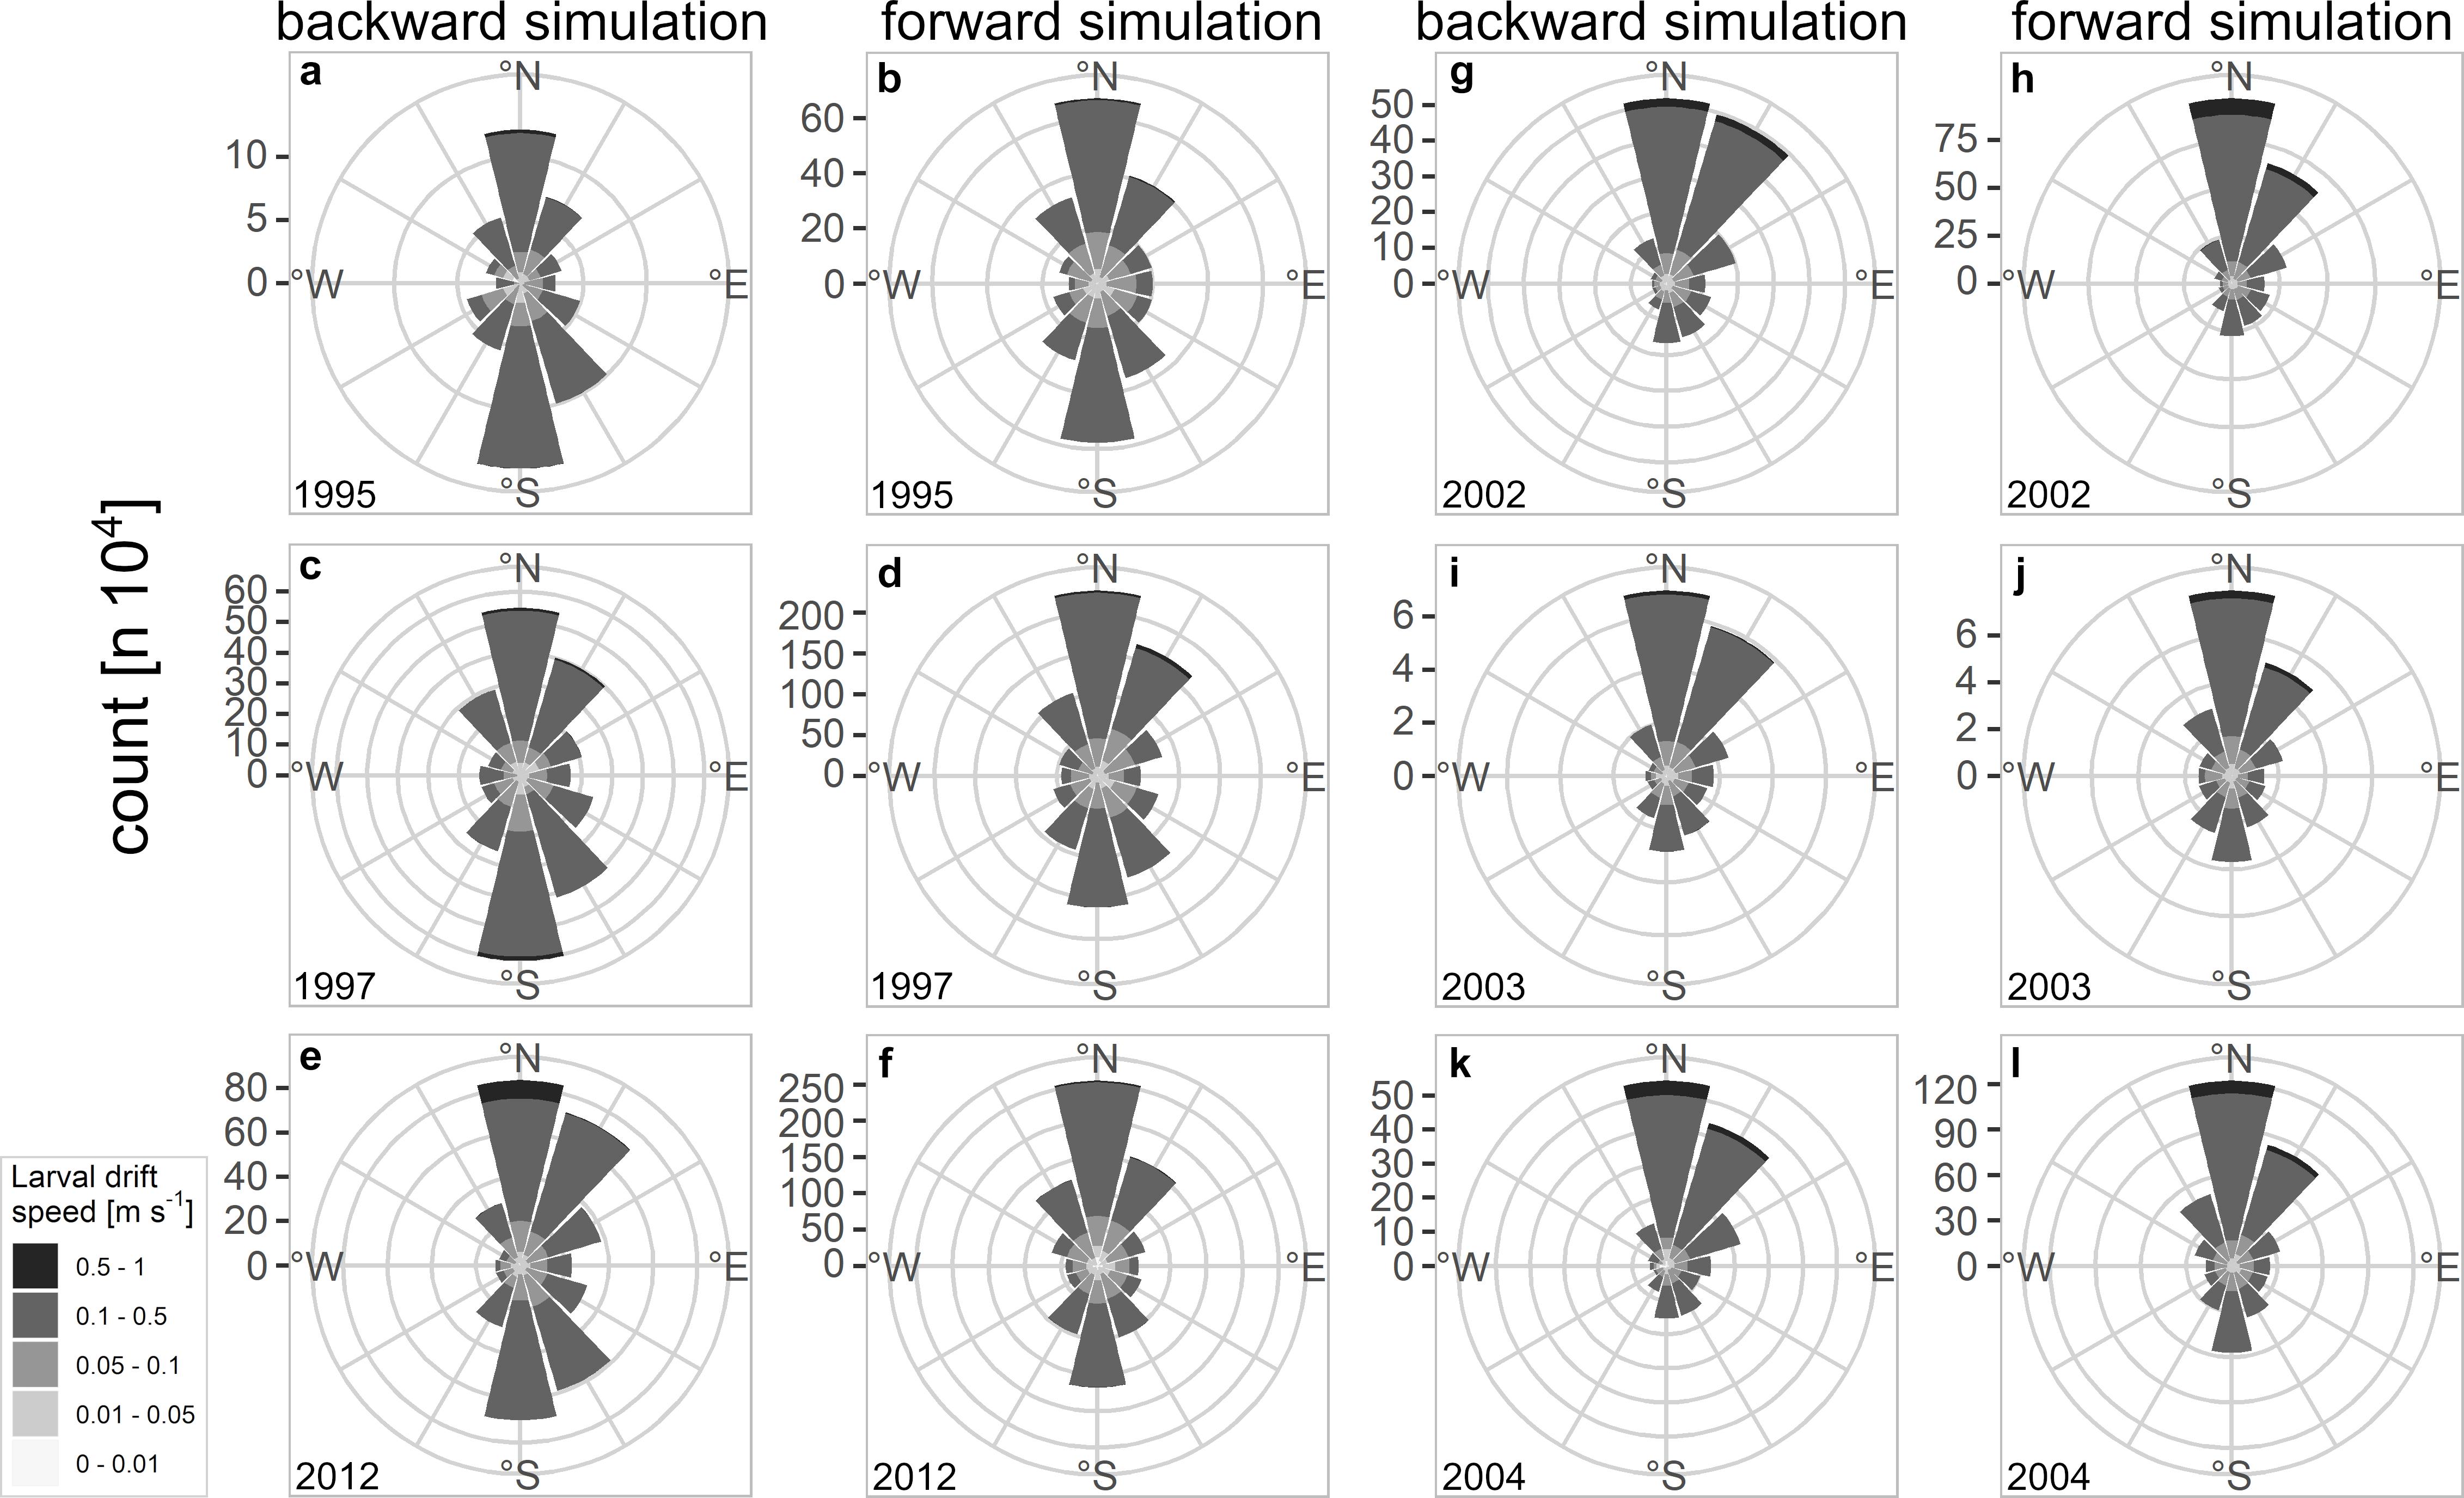
Figure 3. 360° drift plots of backward and forward simulated larval drift from (a–f) 1995, 1997, 2012, and (g–l) 2002–2004; each bar represents the total amount as count of drift speed and direction the NSS herring larvae were drifting in a certain year.
Larval Drift Indices in Relation to Recruitment Success
The years with a strong southward component that represented enhanced larval retention resulted in years with only low recruitment success (Figure 4). In contrast, the years 2002–2004 with this dominant northward drift component were very successful recruitment years. This is represented by the larval drift indices for the drift along the meridional axis (vbackward and vforward). The only year where an overall negative drift index was computed was from the backward drift simulation for the year 1995. This is the only year where there was a stronger southward than northward larval drift. Hence, in 98% of all years from both backward and forward simulations the northward drift component dominated indicated by positive vbackward and vforward drift indices. The meridional drift of larvae was more frequent and stronger than the zonal drift (uforward, ubackward) for both back- and forward simulations (Figures 3, 4). Both mean u drift indices were only positive which means that the overall larval drift per year was inshore. However, years with higher inshore drift coincided with low recruitment years (e.g., 2008, 2010, 2011, 2014) and values closer to zero coincided with years of heightened recruitment (e.g., 1998, 1999, 2016).
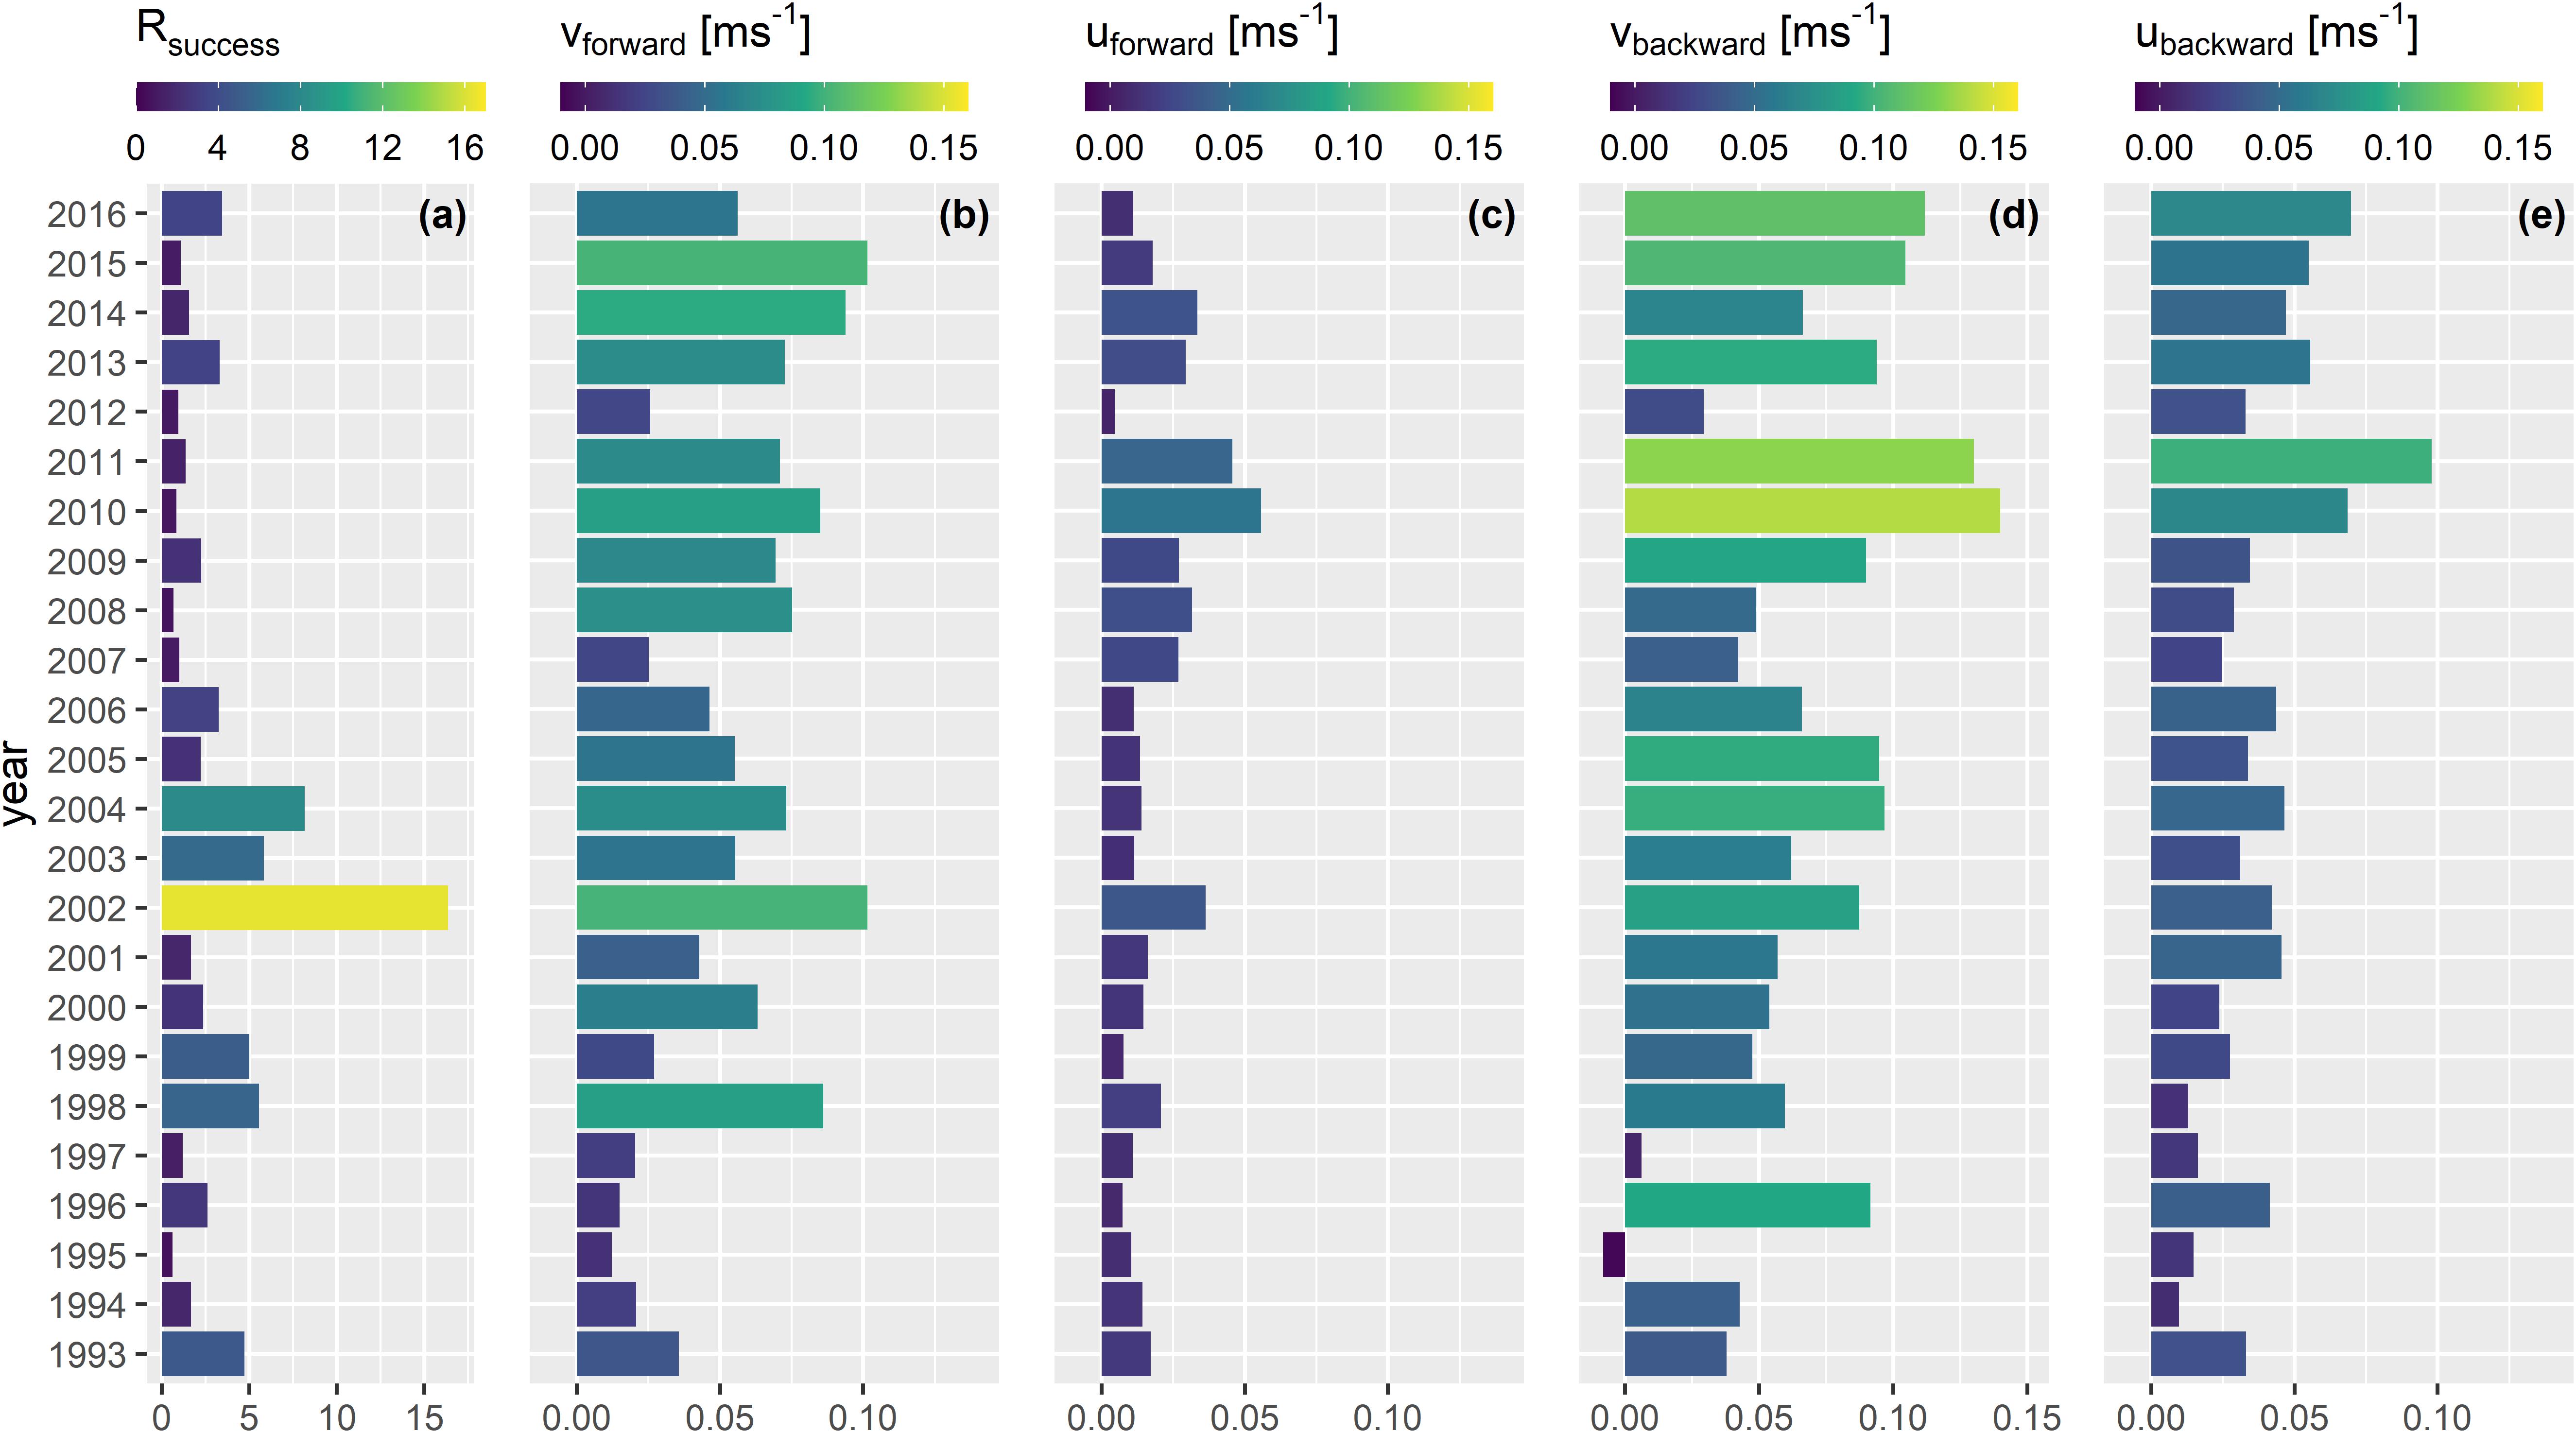
Figure 4. Annual index for (a) Rsuccess (Rage2/SSBt–2), and annual mean indices of larval drift for (b) vforward, (c) uforward, (d) vbackward, and (e) ubackward.
From a more detailed view, the success of recruitment was only depicted for some years while the rest of the years could not visually be related to the 360° drift plots (Supplementary Figures 5, 6 versus Figure 4a). Although the vforward value in 1996 was small vbackward was large and resulted in a higher Rsuccess compared to the years 1995, 1997, and 2012 (Figure 4). The vforward component in 2002 was very strong compared to most of the other vforward values from other years, except 2015 and resulted in a very successful year of recruitment. These results all point toward the necessity of a strong northward drift for the very early life stages of NSS herring to increase the chance of heightened recruitment success. However, in many years after 2004, years of low recruitment success coincided with larvae experiencing a strong and frequent northward drift.
The importance of larvae being transported in the meridional and zonal dimension was tested by the full gamma model (modelforward) on recruitment success which was the best model assigned by DIC and WAIC (Table 1). The fitted and final model was:
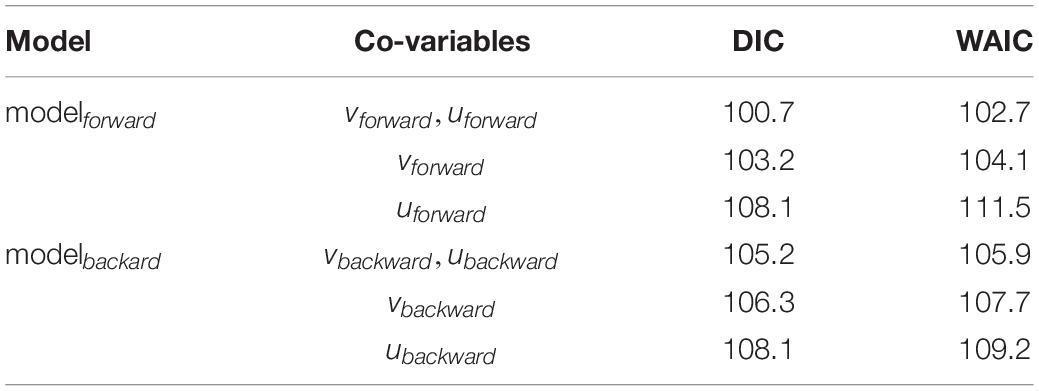
Table 1. Model selection using DIC (deviance information criterion) and WAIC (Watanabe – Akaike information criterion).
The meridional drift component vforward indicated an important and positive relationship with Rsuccess (Table 2). The 95% credible intervals of the posterior mean exclude zero which implied that the term is an important factor behind recruitment success. Simulating vforward from the modelforward resembled a continuous increase of Rsuccess with stronger vforward (Figure 5a). An increased northward drift until vforward = 0.05 ms–1 apparently constrained recruitment with little enhanced recruitment success and low 95% credible intervals. Higher values allowed for elevated Rsuccess by also increasing the 95% credible intervals. That indicated that the potential for higher recruitment is only possible in years where most of the larvae are quickly drifting northwards. Best model predicted uforward values indicate a negative relationship between uforward and Rsuccess (Figure 5b). The posterior mean excludes zero values meaning that this index is an important driver of recruitment too, though, in an opposite way; the more uforward is positive the lower is the Rsuccess. In other words, when more larvae are transported eastwards toward the coast, the chances of good recruitment falls. So, modelforward with only two drift indices as explanatory variables provided an acceptable estimate for recruitment success (Figure 5c). However, the two years 2002 and 2015 were outliers and indicate that larval drift is only one of several factors influencing the highly complex process of NSS herring recruitment.
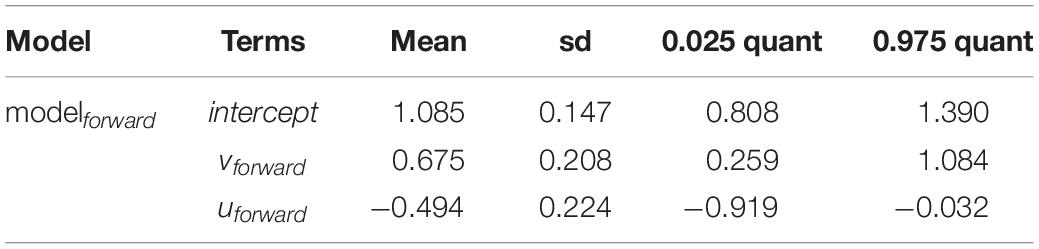
Table 2. Posterior mean values, standard deviation (sd) and 95% credible intervals (0.025 quant, 0.975 quant) of the final full model (modelforward) indicating all terms being important.
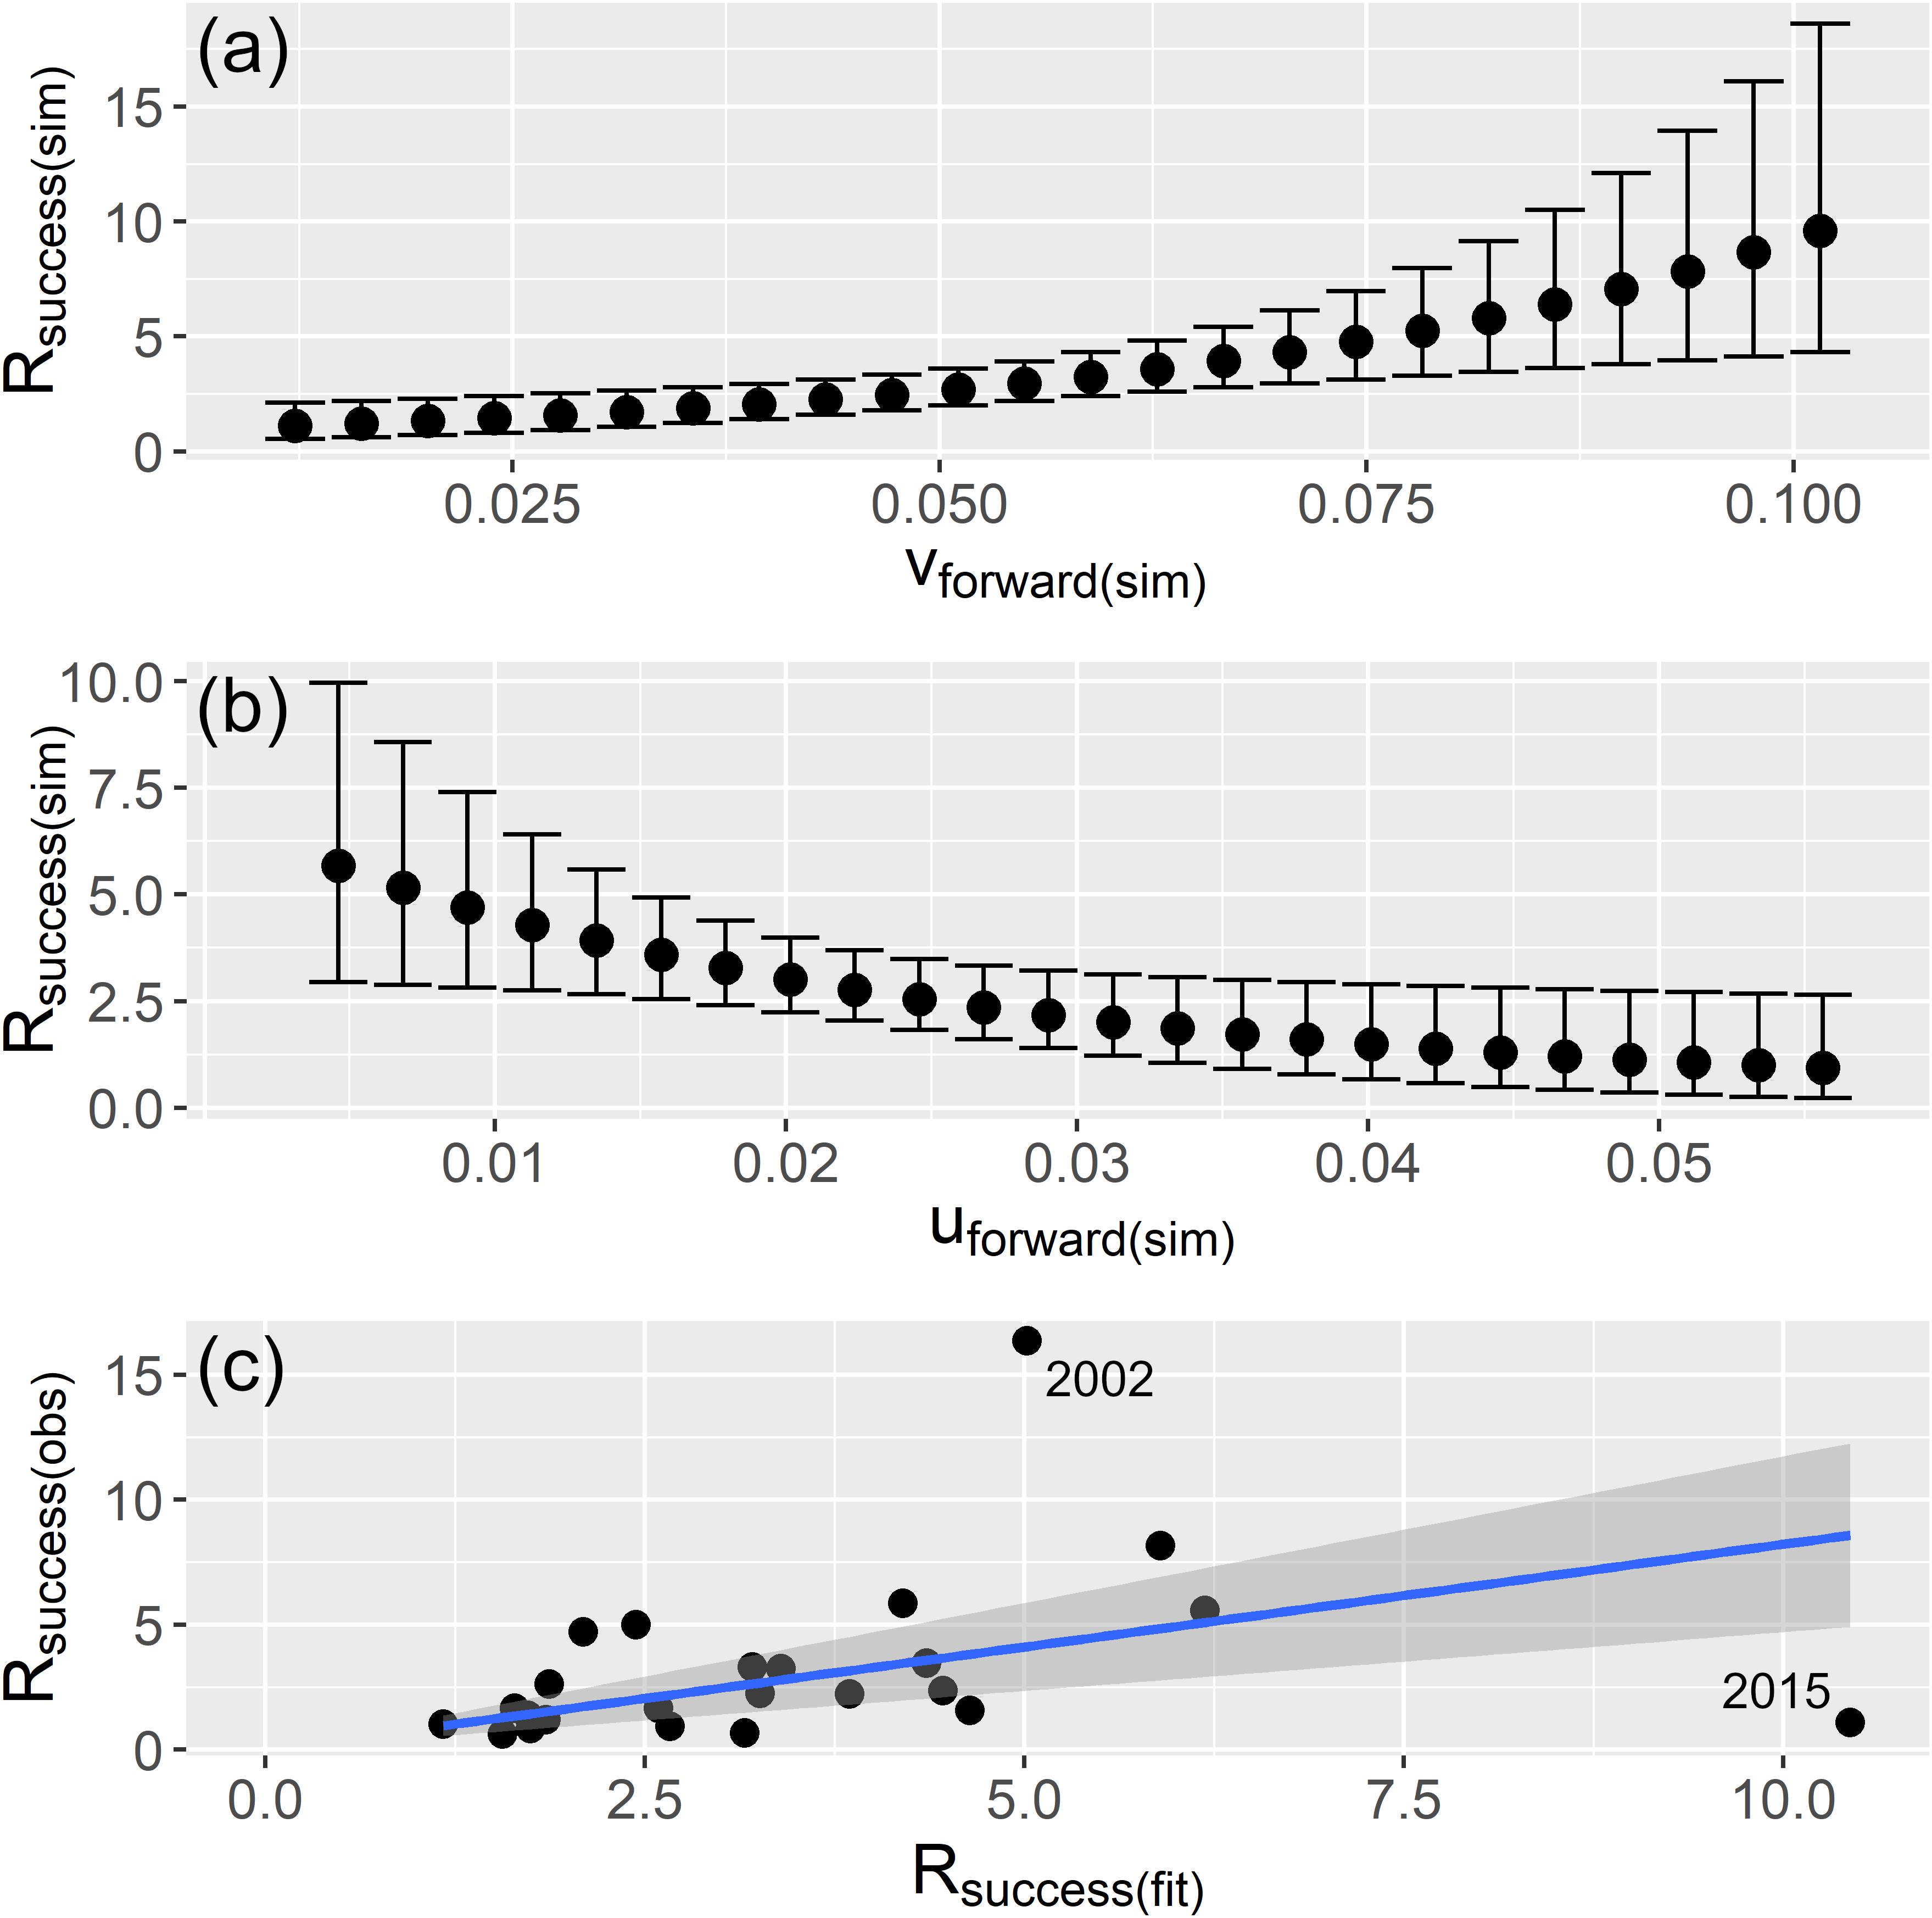
Figure 5. Simulated (sim) relationships from the best model (full modelforward) where Rsuccess (Rage2/SSBt–2) is estimated with 95% credible intervals for equally simulated values of the range of vforward in panel (a) and uforward in panel (b); and (c) relationship of observed (obs) versus fitted (fit) Rsuccess values.
Discussion
Successful recruitment underlies several episodic and subtle mortality events in early life stages of fish (Houde, 1989). These events can involve very high mortality rates where even small perturbations in environmental conditions can have tremendous effects on the survival of the resulting brood (Houde, 1987). Larval dispersal is important as it can involve advection to unfavorable environments where larvae may encounter high predation risks and/or low food supply (Hjort, 1926). On the other hand, drift along routes with optimal environmental conditions may enhance larval survival. Knowing about the larval drift patterns that may result in various years of recruitment success is hence an important endeavor to better understand population dynamics and thereby enhance our abilities to manage harvested stocks. Consequently, in short term projections the strength of the Norwegian Costal Current (NCC) should help defining periods with lowered or raised recruitment potential (Skagseth et al., 2015). Such projections can be refined with dedicated survey observations and the generation of larval drift indices.
Increasing larval survival rates is dependent on ambient environmental conditions. Here, the adults determine where and when they spawn and thereby ultimately define the conditions their offspring will grow up in Parrish et al. (1981) and Slotte and Fiksen (2000). The spatial limitation, however, is that herring spawning is limited to suitable substrata with appropriate bottom currents (Runnström, 1941; Maravelias et al., 2000). In most of the years, recruitment is low for many herring stocks in the Atlantic and a few exceptional years allow stocks to increase significantly (Trochta et al., 2020). A few weeks in early spring after mature NSS herring have released eggs to the sea floor, larvae will inevitably occur under conditions in which they encounter variable chances of survival. As main transport route, the flow regime regulated by the NCC allows larvae to drift either northwards (Vikebø et al., 2010; Stenevik et al., 2012) or encounter stationary eddies which retain larvae on their way toward the Barents Sea (Sætre et al., 2002). When the NCC is strong, larvae can be carried quickly from spawning grounds northwards (Vikebø et al., 2010). An examination of NSS herring year-class strength and the physical conditions in the NCC (e.g., temperature anomalies, current speed and prevailing wind conditions) revealed that a strong NCC coincides with years in which NSS herring had exceptionally high recruitment success (Skagseth et al., 2015). The findings support the positive relationship between the larval northward advection (strength of the NCC) and elevated recruitment, lending support to Hjort’s conclusion that a larval relocation of hundreds of kilometers forms the basis for recruitment success in high-latitudinal waters (Hjort, 1926). This view is also in line with Dragesund’s field observations that rapid transport of NSS herring larvae northwards promotes recruitment (Dragesund, 1970). Therefore, it seems that the frequency and the total mean surplus northward drift of larvae control the level of recruitment. This statement is in contradiction of the theory that larval retention in the first months of life may generally be crucial for herring population replenishment (Sinclair and Power, 2015). Especially with the output of the drift simulations in which only one year accounted for stronger retention then northward relocation it seems that the northward advection dominates for early NSS herring larvae. Additionally, the three years in which a stronger southward drift component was observed signify only weak recruitment years.
The NCC is obviously the major transport path for NSS herring larvae to transit from their spawning grounds along the west coast of Norway to their main nursery area in the Barents Sea, but why would the speed of transport be of importance? As temperature rises in early spring the Norwegian Sea becomes more and more accessible for piscivorous feeding during the spring bloom. Juvenile saithe (Pollachius virens), a potential predator of NSS herring larvae, starts schooling at the Norwegian coast in late spring (Husebø et al., 2009). If this schooling coincides with the presence of NSS herring larvae it may lead to an elevated predation on the larvae. To compensate for any possible top-down control by saithe or any other species like Northeast Atlantic mackerel (Scomber scombrus) (Skaret et al., 2015) or Atlantic salmon (Salmo salar) (Utne et al., 2020) it would therefore be beneficial for larvae to escape high predation risks through a rapid transport away from predator aggregations. In this regard, a combination of early spawning by NSS herring and rapid northward transport could combine to enhance larval survival. The earlier drift would enhance the chances of escaping predation but could be disadvantageous due to a lower potential food supply in early spring (Husebø et al., 2009; Slotte et al., 2019). However, the drift speed only seems important in the years before 2004. Most of the years after 2004, coincide with predominant strong northward drift components that failed to produce strong recruitment. Since 2004 regimes seem to have changed in the study area where larvae are susceptible to a fast temperature shift during early development (Tiedemann et al., 2020). These altered environmental conditions may also have affected the timing of plankton blooming along the drift route, which normally is delayed toward the north along the Norwegian coast, and resulted in a mis-match with available prey for the larvae (Vikebø et al., 2012). In fact, general shifts in seasonality of Calanus species have been demonstrated over the study period in the Norwegian Sea area, in both coastal and oceanic waters (Strand et al., 2020). Another explanation is that there has been a more general decline of zooplankton production along the entire drift route of the NSS herring larvae as suggested by Toresen et al. (2019). Support for this hypothesis is found in a study looking at the production of Calanus species along the Svinøy section crossing the most important NSS herring spawning grounds, suggesting a 50% decrease for the most oceanic stations, and as much as an 81% decrease for the stations closer to the coast over the period 2000–2011 (Dupont et al., 2017). On the other hand, one cannot exclude the potential of increased predation especially by Northeast Atlantic mackerel that has had a significant northward expansion (Nøttestad et al., 2016), which may overlap and prey directly on herring larvae in the late drift period (Skaret et al., 2015; Allen et al., 2021).
By investigating not only the role of the zonal transport of larvae the model outputs indicate that when less larvae are advected inshore it coincides with heightened recruitment. Nursery grounds in fjords along the Norwegian coast are assumed minor compared to the main nursery grounds in the Barents Sea (Dragesund, 1970; Holst and Slotte, 1998). A drift along and not toward the coast would therefore allow a further transport within the main routes of the NCC. If larvae, on the other hand, would be transported coastwards it may increase chances of larval retention at the coastline or inside the fjords. The drift simulations in this regard could indicate that only a few larvae that were actually collected during the surveys would have been transported beyond the continental shelf that may be low in productivity and may negatively affect larval survival (Norcross and Shaw, 1984). However, the offshore larval transport is area specific. For instance, in areas where productive water masses are mainly observed along regions affected by coastal upwelling provide necessary feeding grounds for offspring (Allain et al., 2007; Tiedemann and Brehmer, 2017). It is hence obvious that in these areas larval retention is essential for survival. Such regions can be observed elsewhere in which fish larvae are suggested to make use of the flow regime to retain themselves onshore (Deschepper et al., 2020; Xing et al., 2020). In the Norwegian Sea, however, the flow regime of the NCC prohibits a strong transport off the continental shelf. Only some currents and eddies that form to the west of Lofoten seem to allow a larval offshore transport well away from shore, but whether this mechanism affects NSS herring recruitment to a significant extent still needs to be investigated.
A valuable add-in to the drift simulations was the actual position, the time, the total length as proxy for age and the larval abundance information from the surveys. With these data, it was possible to produce indices based on real observed spatial-temporal data and indicated years of enhanced larval retention or northward advection. However, even though combining the field observations that provide precision in spatial-temporal dimensions the simulations are marked simplifications of the real environment. The strongest bias may come from the resolution of the hydrographical model used here by probably underestimating small scale processes such as meanders and smaller scale eddies (North et al., 2009; Soufflet et al., 2016). The coarse grid was a choice that could cover the time series examined, the suitability within Ichthyop, accessibility and computational cost. However, drift on scales less than twofold of resolution is cropped that leads to particle trajectories more regular than it would be in real life (Vikebø et al., 2011). This setting has certainly increased the underestimation of the particle spread and probably the overestimation of the branches of the NCC. These limitations would also explain the end positions of the backward simulations that should roughly represent the origin. Besides that most of the origins covered typical spawning areas especially off Møre and the Halten Bank a small fraction of the simulated positions were unrealistic, like the ones at depths >250 m. Thereby, the simulation provides a rough estimate of the larval vertical migration behavior. Further to this, the constant assumed growth rate maximizes uncertainties of the realized drift period until the larvae were sampled in the field. For instance, we used a growth rate of 0.2 mm based on Doyle (1977). However, in other studies a daily growth rate of 0.3–0.6 mm was observed for different larval sizes (Stenevik et al., 1996), whereas in another drift simulation a 0.5 mm daily growth rate was adopted (Vikebø et al., 2011). Hence, the destination as well as origin that we considered in this study should only be noted approximations. Another source of bias may be based on running the drift simulations without region specific mortality rates. In different areas of the study area, larval mortality is most likely variable that would change the frequency of observed drift. For a more complex model it would be therefore necessary to implement spatially resolved mortality rates probably based on predator presence and food availability. A new pilot study was accomplished to use a molecular approach to define predation pressure in the field on NSS herring larvae (Allen et al., 2021). Such work may allow to estimate region specific mortality rates to refine the larval drift model outcomes.
The complexity of fish recruitment variability makes it difficult to assemble all factors that determine recruitment (Houde, 1987). Beside the larval drift there are many other factors that may influence NSS herring recruitment (Garcia et al., 2020). It was beyond the scope of this investigation to test all possible controlling factors; we rather focused on an in-depth investigation into one factor that is a major driver. Investigating recruitment success requires a long time-series that would allow for complex models. Here, the 24 years (24 data points for recruitment success) limits the number of co-variables that can be used in a model, which led us to invoke the “One in ten rule” for linear regression type analyses (e.g., number of observations >10 times the degrees of freedom of the co-variables). However, by developing larval drift indices fitted on survey observations it was possible to link the rapid northward advection of larvae to heightened recruitment years between 1993 and 2016. A strong southward drift component is linked to weak recruitment years. The larval drift indices worked especially well with the years before 2005, since then the changes in the environment (e.g., zooplankton availability and temperature) seemed to have mainly driven the recruitment success (Toresen et al., 2019; Tiedemann et al., 2020). The outcome of this work is intercessional toward larval drift studies in which survey data should be used to refine and calibrate drift simulations. This approach is possible for all planktonic taxa enabling a more precise view on the real drift in planktonic organisms.
Data Availability Statement
The original contributions presented in the study are included in the article/Supplementary Material, further inquiries can be directed to the corresponding author/s.
Author Contributions
MT, RN, OK, and AS conceived the study. RN and ES collected the data. MT processed and analyzed the data (mapping, drift simulation, and modeling). OK and AS contributed with project resources. MT wrote the manuscript with contributions from RN, OK, AS, and ES. All authors contributed to the article and approved the submitted version.
Funding
The work is an outcome of the project RECNOR (Recruitment Dynamics of Commercially Important Fish Species in Changing NE Atlantic Ecosystems) with the IMR project number 14861 funded by the FFA (The Norwegian Fisheries Research Sales Tax System) and additionally funded by the project “Sustainable multi-species harvest from the Norwegian Sea and adjacent ecosystems,” Research Council of Norway with the project number 299554.
Conflict of Interest
The authors declare that the research was conducted in the absence of any commercial or financial relationships that could be construed as a potential conflict of interest.
Acknowledgments
The crew members of the various IMR surveys in which the data were collected are gratefully thanked. For data access and curation, we thank Kjell Bakkeplass (IMR-NMD). Alain Zuur and Elena N. Ieno are thanked for an inspiring statistic course in R-INLA that supported the decision for the model choice and presentation.
Supplementary Material
The Supplementary Material for this article can be found online at: https://www.frontiersin.org/articles/10.3389/fmars.2021.679900/full#supplementary-material
Footnotes
- ^ https://resources.marine.copernicus.eu/?option=com_csw&view=details&product_id=GLOBAL_REANALYSIS_PHY_001_030
- ^ https://www.nemo-ocean.eu
References
Allain, G., Petitgas, P., and Lazure, P. (2007). The influence of environment and spawning distribution on the survival of anchovy (Engraulis encrasicolus) larvae in the Bay of Biscay (NE Atlantic) investigated by biophysical simulations. Fish. Oceanogr. 16, 506–514. doi: 10.1111/j.1365-2419.2007.00442.x
Allen, B. J., Ray, J. L., Tiedemann, M., Komyakova, V., Vikebø, F. B., Skaar, K. S., et al. (2021). Quantitative molecular detection of larval Atlantic herring (Clupea harengus) in stomach contents of Atlantic mackerel (Scomber scombrus) marks regions of predation pressure. Sci. Rep. 11:5095. doi: 10.1038/s41598-021-84545-7
Bakun, A. (1996). Patterns in the Ocean: Ocean Processes and Marine Population Dynamics in Cooperation With CENTRO de Investigaciones Biologicas de Noroeste, La Paz, Baja California Sur, Mexico. California: University of California Sea Grant.
Blaxter, J. H. S., and Ehrlich, K. F. (1974). “Changes in behaviour during starvation of herring and plaice larvae,” in The Early Life History of Fish, ed. J. H. S. Blaxter (Oban: Scottish Marine Biological Association), 575–588. doi: 10.1007/978-3-642-65852-5_46
Churchill, J. H., Runge, J., and Chen, C. (2011). Processes controlling retention of spring-spawned Atlantic cod (Gadus morhua) in the western Gulf of Maine and their relationship to an index of recruitment success. Fish. Oceanogr. 20, 32–46. doi: 10.1111/j.1365-2419.2010.00563.x
Clark, D. L., Leis, J. M., Hay, A. C., and Trnski, T. (2005). Swimming ontogeny of larvae of four temperate marine fishes. Mar. Ecol. Prog. Ser. 292, 287–300. doi: 10.3354/meps292287
Condie, S., and Condie, R. (2016). Retention of plankton within ocean eddies. Glob. Ecol. Biogeogr. 25, 1264–1277. doi: 10.1111/geb.12485
Cowen, R. K., Paris, C. B., Olson, D. B., and Fortuna, J. L. (2003). The role of long distance dispersal versus local retention in replenishing marine populations. Gulf Caribb. Res. 14, 129–137. doi: 10.18785/gcr.1402.10
Deschepper, I., Lyons, K., Lyashevska, O., and Brophy, D. (2020). Biophysical models reveal the role of tides, wind, and larval behaviour in early transport and retention of Atlantic herring (Clupea harengus) in the Celtic Sea. Can. J. Fish. Aquat. Sci. 77, 90–107. doi: 10.1139/cjfas-2018-0491
Doyle, M. J. (1977). A morphological staging system for the larval development of the herring, Clupea harengus l. J. Mar. Biol. Assoc. United Kingdom 57, 859–867. doi: 10.1017/S0025315400025212
Dragesund, O. (1970). Factors influencing year-class strength of Norwegian spring spawning herring (Clupea harengus Linneé). Fisk. Skr. Ser. Havundersøkelser 15, 381–450.
Dragesund, O., Johannessen, A., and Ulltang, Ø (1997). Variation in migration and abundance of Norwegian spring spawning herring (Clupea harengus l.). Sarsia 82, 97–105. doi: 10.1080/00364827.1997.10413643
Dupont, N., Bagøien, E., and Melle, W. (2017). Inter-annual variability in spring abundance of adult Calanus finmarchicus from the overwintering population in the southeastern Norwegian Sea. Prog. Oceanogr. 152, 75–85. doi: 10.1016/j.pocean.2017.02.004
Espeland, S. H., Albretsen, J., Olsen, E. M., and Bodvin, T. (2015). Modelling drift of pelagic offspring: the importance of egg surveys in providing a realistic model initialization. ICES J. Mar. Sci. 72, 2578–2589. doi: 10.1038/278097a0
Ferreira, A. S., de, A., Stenevik, E. K., Vollset, K. W., Korneliussen, R., and Folkvord, A. (2012). Vertical migration of Norwegian spring-spawning herring larvae in relation to predator and prey distribution. Mar. Biol. Res. 8, 605–614. doi: 10.1080/17451000.2011.653370
Garcia, T., Planque, B., Arneberg, P., Bogstad, B., and Skagseth, Ø, and Tiedemann, M. (2020). An appraisal of the drivers of Norwegian spring-spawning herring (Clupea harengus) recruitment. Fish. Oceanogr. 30, 159–173. doi: 10.1111/fog.12510
García-Reyes, M., Sydeman, W. J., Schoeman, D. S., Rykaczewski, R. R., Black, B. A., Smit, A. J., et al. (2015). Under pressure: climate change, upwelling, and eastern boundary upwelling ecosystems. Front. Mar. Sci. 2:109. doi: 10.3389/fmars.2015.00109
Gehringer, J. W. (1952). High speed plankton samplers. 2. An all-metal plankton sampler (Model Gulf III). Fish Wildl. Serv. Spec. ScL Rep.-Fish 88, 7–12.
Hijmans, R. J. (2019). Introduction to the “Geosphere” Package (Version 1.4-3). Available online at: https://www.rdocumentation.org/packages/geosphere (accessed December, 2020).
Hjort, J. (1914). Fluctuations in the great fisheries of Northern Europe. Cons. Perm. Int. Pour l’Exploration la Mer 20, 1–228. doi: 10.1515/9781400822133.1
Hjort, J. (1926). Fluctuations in the year classes of important food fishes. ICES J. Mar. Sci. 1, 5–38. doi: 10.1093/icesjms/1.1.5
Holst, J. C., and Slotte, A. (1998). Effects of juvenile nursery on geographic spawning distribution in Norwegian spring spawning herring (Clupea harengus L.). ICES J. Mar. Sci. 55, 987–996. doi: 10.1006/jmsc.1998.0371
Houde, E. D. (1987). Fish early life dynamics and recruitment variability. Am. Fish. Soc. Symp. 2, 17–29.
Houde, E. D. (1989). Subtleties and episodes in the early life of fishes. J. Fish Biol. 35, 29–38. doi: 10.1111/j.1095-8649.1989.tb03043.x
Husebø, Å, Stenevik, E. K., Slotte, A., Fossum, P., Salthaug, A., Vikebø, F., et al. (2009). Effects of hatching time on year-class strength in Norwegian spring-spawning herring (Clupea harengus). ICES J. Mar. Sci. 66, 1710–1717. doi: 10.1093/icesjms/fsp150
ICES (2019). Herring (Clupea harengus) in subareas 1, 2, and 5, and in divisions 4.a and 14.a, Norwegian Spring-Spawning Herring (the Northeast Atlantic and the Arctic Ocean) In Report of the ICES Advisory Committee, 2019. ICES Advice her.27.1-24a514a. Copenhagen: ICES, doi: 10.17895/ices.advice.4882
Iles, T. D., and Sinclair, M. (1982). Atlantic herring: Stock discreteness and abundance. Science 215, 627–633. doi: 10.1126/science.215.4533.627
Kvile, K. Ø, Fiksen, Ø, Prokopchuk, I., and Opdal, A. F. (2017). Coupling survey data with drift model results suggests that local spawning is important for Calanus finmarchicus production in the Barents Sea. J. Mar. Syst. 165, 69–76. doi: 10.1016/j.jmarsys.2016.09.010
Lett, C., Verley, P., Mullon, C., Parada, C., Brochier, T., Penven, P., et al. (2008). A Lagrangian tool for modelling ichthyoplankton dynamics. Environ. Model. Softw. 23, 1210–1214. doi: 10.1016/j.envsoft.2008.02.005
Maravelias, C. D., Reid, D. G., and Swartzman, G. (2000). Seabed substrate, water depth and zooplanktonas determinants of the prespawning spatial aggregation of North Atlantic herring. Mar. Ecol. Prog. Ser. 195, 249–259. doi: 10.3354/meps195249
Munk, P., Kiørboe, T., and Christensen, V. (1989). Vertical migrations of herring, Clupea harengus, larvae in relation to light and prey distribution. Environ. Biol. Fishes 26, 87–96. doi: 10.1007/BF00001025
Nakken, O. (2008). in Norwegian Spring-Spawning Herring & Northeast Arctic Cod, ed. O. Nakken (Trondheim: Tapir Academic Press). doi: 10.1007/bf00001025
Norcross, B. L., and Shaw, R. F. (1984). Oceanic and estuarine transport of fish eggs and larvae: a review. Trans. Am. Fish. Soc. 113, 153–165. doi: 10.1577/1548-86591984113<153
North, E. W., Gallego, A., Petitgas, P., Ådlandsvik, B., Bartsch, J., Brickman, D., et al. (2009). Manual of Recommended Practices for Modelling Physical – Biological Interactions During Fish Early Life, ICES Cooperative Research Report, 295, International Council for the Exploration of the Sea. Copenhagen: ICES, 118.
Nøttestad, L., Utne, K. R., Óskarsson, J. G., Jónsson, S., Jacobsen, J. A., and Tangen, Ø, et al. (2016). Quantifying changes in abundance, biomass, and spatial distribution of Northeast Atlantic mackerel (Scomber scombrus) in the Nordic seas from 2007 to 2014. ICES J. Mar. Sci. 73, 359–373. doi: 10.1093/icesjms/fsv218
Parrish, R. H., Nelson, C. R. S., and Bakun, A. (1981). Transport mechanisms and reproductive success of fishes in the California Current. Biol. Oceanogr. 1, 175–203. doi: 10.1080/01965581.1981.10749438
Peliz, A., Marchesiello, P., Dubert, J., Marta-Almeida, M., Roy, C., and Queiroga, H. (2007). A study of crab larvae dispersal on the Western Iberian Shelf: physical processes. J. Mar. Syst. 68, 215–236. doi: 10.1016/j.jmarsys.2006.11.007
Petitgas, P., Rijnsdorp, A. D., Dickey-Collas, M., Engelhard, G. H., Peck, M. A., Pinnegar, J. K., et al. (2013). Impacts of climate change on the complex life cycles of fish. Fish. Oceanogr. 22, 121–139. doi: 10.1111/fog.12010
Prasetya, D. A., Nguyen, P. T., Faizullin, R., Iswanto, I., and Armay, E. F. (2020). Resolving the shortest path problem using the haversine algorithm. J. Crit. Rev. 7, 62–64. doi: 10.22159/jcr.07.01.11
R Core Team (2020). R: A Language and Environment for Statistical Computing. Vienna: R Foundation for Statistical Computing.
Rue, H., Martino, S., and Chopin, N. (2009). Approximate Bayesian inference for latent Gaussian models by using integrated nested Laplace approximations. J. R. Stat. Soc. Ser. B Stat. Methodol. 71, 319–392. doi: 10.1111/j.1467-9868.2008.00700.x
Runnström, S. (1941). Quantitative investigations on herring spawning and its yearly fluctuations at the west coast of Norway. Rep. Nor. Fish. Mar. Investig. 6, 1–71.
Sætre, R. (1999). Features of the central Norwegian shelf circulation. Cont. Shelf Res. 19, 1809–1831. doi: 10.1016/S0278-4343(99)00041-2
Sætre, R. (2007). in The Norwegian Coastal Current: Oceanography and Climate, 1. Edn, ed. R. Sætre (Trondheim: Tapir Academic Press). doi: 10.1016/s0278-4343(99)00041-2
Sætre, R., Toresen, R., Søiland, H., and Fossum, P. (2002). The Norwegian spring-spawning herring - spawning, larval drift and larval retention. Sarsia 87, 167–178. doi: 10.1080/003648202320205247
Sinclair, M. (1988). Marine Populations: An Essay on Population Regulation and Speciation. Seattle: Washington Sea Grant/University Washington Press.
Sinclair, M., and Power, M. (2015). The role of “larval retention” in life-cycle closure of Atlantic herring (Clupea harengus) populations. Fish. Res. 172, 401–414. doi: 10.1016/j.fishres.2015.07.026
Skagseth, Ø, Slotte, A., Stenevik, E. K., and Nash, R. D. M. (2015). Characteristics of the Norwegian coastal current during years with high recruitment of Norwegian spring spawning herring (Clupea harengus L.). PLoS One 10:1–17. doi: 10.1371/journal.pone.0144117
Skaret, G., Bachiller, E., Langøy, H., and Stenevik, E. K. (2015). Mackerel predation on herring larvae during summer feeding in the Norwegian Sea. ICES J. Mar. Sci. 72, 2313–2321. doi: 10.1093/icesjms/fst048
Slotte, A., and Fiksen, Ø (2000). State-dependent spawning migration in Norwegian spring-spawning herring. J. Fish Biol. 56, 138–162. doi: 10.1006/jfbi.1999.1145
Slotte, A., Husebø, Å, Berg, F., Stenevik, E., Folkvord, A., Fossum, P., et al. (2019). Earlier hatching and slower growth: a key to survival in the early life history of Norwegian spring spawning herring. Mar. Ecol. Prog. Ser. 617–618, 25–39. doi: 10.3354/meps12682
Slotte, A., Johannessen, A., and Kjesbu, O. S. (2000). Effects of fish size on spawning time in Norwegian spring-spawning herring. J. Fish Biol. 56, 295–310. doi: 10.1006/jfbi.1999.1161
Soufflet, Y., Marchesiello, P., Lemarié, F., Jouanno, J., Capet, X., Debreu, L., et al. (2016). On effective resolution in ocean models. Ocean Model. 98, 36–50. doi: 10.1016/j.ocemod.2015.12.004
Stenevik, E. K., Fossum, P., Johannessen, A., and Folkvord, A. (1996). Identification of Norwegian spring spawning herring (Clupea harengus L.) larvae from spawning grounds off Western Norway applying otolith microstructure analysis. Sarsia 80, 285–292. doi: 10.1080/00364827.1996.10413602
Stenevik, E. K., Nash, R. D. M., Vikebø, F., Fossum, P., and Bakkeplass, K. (2012). The effects of survey design and circulation pattern on the perceived abundance of herring larvae: a case study for Norwegian spring spawning herring (Clupea harengus). Fish. Oceanogr. 21, 363–373. doi: 10.1111/j.1365-2419.2012.00631.x
Strand, E., Bagøien, E., Edwards, M., Broms, C., and Klevjer, T. (2020). Spatial distributions and seasonality of four Calanus species in the Northeast Atlantic. Prog. Oceanogr. 185:102344. doi: 10.1016/j.pocean.2020.102344
Sundby, S., Drinkwater, K. F., and Kjesbu, O. S. (2016). The North Atlantic spring-bloom system-where the changing climate meets the winter dark. Front. Mar. Sci. 3:28. doi: 10.3389/fmars.2016.00028
Swearer, S. E., Caselle, J. E., Lea, D. W., and Warner, R. R. (1999). Larval retention and recruitment in an island population of a coral-reef fish. Nature 402, 799–802. doi: 10.1038/45533
Swearer, S. E., Treml, E. A., and Shima, J. S. (2019). “A review of biophysical models of marine larval dispersal,” in Oceanography and Marine Biology, eds S. J. Hawkins, A. L. Allcock, A. E. Bates, I. P. Smith, S. E. Swearer, and P. A. Todd (Boca Raton FL: CRC Press), 325–356. doi: 10.1201/9780429026379-7
Tiedemann, M., and Brehmer, P. (2017). Larval fish assemblages across an upwelling front: indication for active and passive retention. Estuar. Coast. Shelf Sci. 187, 118–133. doi: 10.1016/j.ecss.2016.12.015
Tiedemann, M., Nash, R. D. M., Stenevik, E. K., Stiasny, M. H., Slotte, A., and Kjesbu, O. S. (2020). Environmental influences on Norwegian spring-spawning herring (Clupea harengus L.) larvae reveal recent constraints in recruitment success. ICES J. Mar. Sci. fsaa072, 1–13. doi: 10.1093/icesjms/fsaa072
Toresen, R., Skjoldal, H. R., Vikebø, F., and Martinussen, M. B. (2019). Sudden change in long-term ocean climate fluctuations corresponds with ecosystem alterations and reduced recruitment in Norwegian spring-spawning herring (Clupea harengus. Clupeidae). Fish Fish. 20, 686–696. doi: 10.1111/faf.12369
Trochta, J. T., Branch, T. A., Shelton, A. O., and Hay, D. E. (2020). The highs and lows of herring: a meta-analysis of patterns and factors in herring collapse and recovery. Fish Fish. 21, 1–24. doi: 10.1111/faf.12452
Utne, K. R., Thomas, K., Jacobsen, J. A., Fall, J. Ó, Maoiléidigh, N. P., Broms, C., et al. (2020). Feeding interactions between Atlantic salmon (Salmo salar Linnaeus) post-smolts and other planktivorous fish in the Northeast Atlantic. Can. J. Fish. Aquat. Sci. 78, 1–14. doi: 10.1139/cjfas-2020-0037
van der Veer, H. W., Freitas, V., and Leggett, W. C. (2015). “Recruitment level and variability,” in Flatfishes: Biology and Exploitation, eds R. N. Gibson, R. D. M. Nash, and A. J. Geffen (Oxford: Blackwell Science Ltd), 542.
Vikebø, F. B., Ådlandsvik, B., Albretsen, J., Sundby, S., Stenevik, E. K., Huse, G., et al. (2011). Real-Time ichthyoplankton drift in northeast Arctic cod and Norwegian spring-spawning herring. PLoS One 6: e27367. doi: 10.1371/journal.pone.0027367
Vikebø, F. B., Husebø, Å, Slotte, A., Stenevik, E. K., and Lien, S. V. (2010). Effect of hatching date, vertical distribution, and interannual variation in physical forcing on northward displacement and temperature conditions of Norwegian spring-spawning herring larvae. ICES J. Mar. Sci. 67, 1948–1956. doi: 10.1093/icesjms/fsq084
Vikebø, F. B., Korosov, A., Stenevik, E. K., and Husebø, Å, and Slotte, A. (2012). Spatio-temporal overlap of hatching in Norwegian spring-spawning herring and the spring phytoplankton bloom at available spawning substrata. ICES J. Mar. Sci. 69, 1298–1302. doi: 10.1093/icesjms/fss083
Xing, Q., Yu, H., Yu, H., Sun, P., Liu, Y., Ye, Z., et al. (2020). A comprehensive model-based index for identification of larval retention areas: a case study for Japanese anchovy Engraulis japonicus in the Yellow Sea. Ecol. Indic. 116, 106479. doi: 10.1016/j.ecolind.2020.106479
Keywords: Clupea harengus, early life stages, dispersal, population dynamics, retention, simulation, INLA approach
Citation: Tiedemann M, Slotte A, Nash RDM, Stenevik EK and Kjesbu OS (2021) Drift Indices Confirm That Rapid Larval Displacement Is Essential for Recruitment Success in High-Latitude Oceans. Front. Mar. Sci. 8:679900. doi: 10.3389/fmars.2021.679900
Received: 12 March 2021; Accepted: 29 April 2021;
Published: 24 May 2021.
Edited by:
Stelios Katsanevakis, University of the Aegean, GreeceReviewed by:
Laura Carrillo, The South Border College (ECOSUR), MexicoDavid Bryan, National Marine Fisheries Service (NOAA), United States
Copyright © 2021 Tiedemann, Slotte, Nash, Stenevik and Kjesbu. This is an open-access article distributed under the terms of the Creative Commons Attribution License (CC BY). The use, distribution or reproduction in other forums is permitted, provided the original author(s) and the copyright owner(s) are credited and that the original publication in this journal is cited, in accordance with accepted academic practice. No use, distribution or reproduction is permitted which does not comply with these terms.
*Correspondence: Maik Tiedemann, Maik.Tiedemann@hi.no