
Nonlinear Actuation of Casimir Oscillators toward Chaos: Comparison of Topological Insulators and Metals


1
Department of Physics, Faculty of Physics and Chemistry, Alzahra University, Tehran 1993891167, Iran
2
Zernike Institute for Advanced Materials, University of Groningen, Nijenborgh 4, 9747 AG Groningen, The Netherlands
3
Department of Mechanical Engineering, University of Sistan and Baluchestan, Zahedan 981-35161, Iran
*
Author to whom correspondence should be addressed.
Universe 2021, 7(5), 123; https://doi.org/10.3390/universe7050123
Submission received: 13 April 2021
/
Revised: 20 April 2021
/
Accepted: 21 April 2021
/
Published: 29 April 2021
(This article belongs to the Special Issue The Casimir Effect: From a Laboratory Table to the Universe)
Abstract
:In the current study, we explore the sensitivity of the actuation dynamics of electromechanical systems on novel materials, e.g., Bi2Se3, which is a well-known 3D Topological Insulator (TI), and compare their response to metallic conductors, e.g., Au, that are currently used in devices. Bifurcation and phase portraits analysis in conservative systems suggest that the strong difference between the conduction states of Bi2Se3 and Au yields sufficiently weaker Casimir force to enhance stable operation. Furthermore, for nonconservative driven systems, the Melnikov function and Poincare portrait analysis probed the occurrence of chaotic behavior leading to increased risk for stiction. It was found that the presence of the TI enhanced stable operation against chaotic behavior over a significantly wider range of operation conditions in comparison to typical metallic conductors. Therefore, the use of TIs can allow sufficient surface conductance to apply electrostatic compensation of residual contact potentials and, at the same time, to yield sufficiently weak Casimir forces favoring long-term stable actuation dynamics against chaotic behavior.
1. Introduction
Nowadays, advancement in fabrication and, consequently, manufacturing techniques of micro/nanoelectromechanical systems (MEMS/NEMS) attract strong attention from the scientific and technology point of view in various sensor technologies, accelerometers, microswitches, etc. [1,2,3,4]. On the other hand, the omnipresent Casimir forces appear to become dominant by reduction of the scale of microdevices into the submicron range, because MEMS/NEMS have surface areas large enough but gaps small enough for this force to play a significant role. As the magnitude of the Casimir force increases, it can lead to the permanent adhesion of moving elements with adjacent surfaces, known as stiction, under certain conditions [4]. Strategies to reduce stiction have been studied in terms of a suitable choice of materials and for the development of knowledge in predicting stable device operation on a long-term basis for the general case of nonconservative driven MEMS/NEMS [5,6,7].
In fact, the Casimir force was predicted in 1948 [8] for perfectly reflecting parallel plates due to the perturbation of vacuum fluctuations of the electromagnetic (EM) field. Soon after, Lifshitz and coworkers considered the general case of dielectric plates by exploiting the fluctuation-dissipation theorem, which relates the dissipative properties of the plates (optical absorption by many microscopic dipoles) and the resulting EM fluctuations. In terms of the Lifshitz theory [9,10], the van der Waals and Casimir forces are the short- and long-range asymptotic limits, respectively, of the same force [1,2,3,4,8,9,10,11,12,13,14]. Nevertheless, the strong dependence of the Casimir force on the material optical properties can be utilized to tune the actuation of devices by proper choice of the interacting materials [5,6,7,15,16,17,18,19]. Several studies have shown that strong Casimir forces exist between components made of metals due to their high absorption of conduction electrons in the infrared range, while the less conductive materials can provide weaker Casimir forces and enhance the stability of microdevices suitable for operation in harsh environments [5,6,7,15,16,17,18,19].
Furthermore, due to these unique properties of their surface states, topological insulator (TI) materials can potentially open a new window of opportunity for MEMS engineering [20,21,22,23,24,25]. Indeed, there has recently been strong interest from both the theoretical and experimental point of view on TI materials, which provide a new quantum state of matter [20,21,22,23,24,25]. TIs show an insulating gap in the bulk but have gapless surface states that are protected topologically. Several recent studies have shown that a repulsive Casmir force can be achieved between two TI plates under certain conditions [23,24,25], which is promising for MEMS design and manufacturing. In these devices, the Casimir force is not only sufficiently strong to play an inevitable role, but the actuation dynamics can also abruptly change toward stiction due to the attractive forces. Hence, any conditions for the occurrence of a repulsive force are of paramount importance for stable motion. In addition, the attractive Casimir forces from TIs can be sufficiently weak to allow the stable operation of actuating devices with suitable compensation of contact potentials due to their conductive surface states [26], while stable operation cannot be achieved using good conductive materials, for example, Au, due to significantly stronger Casimir forces [6,7].
So far, several investigations have been conducted to answer the question of how the Casimir force changes with these novel materials under both trivial TI (with θ=0) and nontrivial TI (θ 0) conditions where θ defines the topological magnetoelectric polarizability (TMEP) [23,24,25]. However, to date, how significant the influence of TIs on stable device actuation and long-term performance remains unexplored, although it is well known that the occurrence of chaotic behavior is unavoidable by shrinking the size of devices.
2. Optical Properties of Materials and Device Actuation
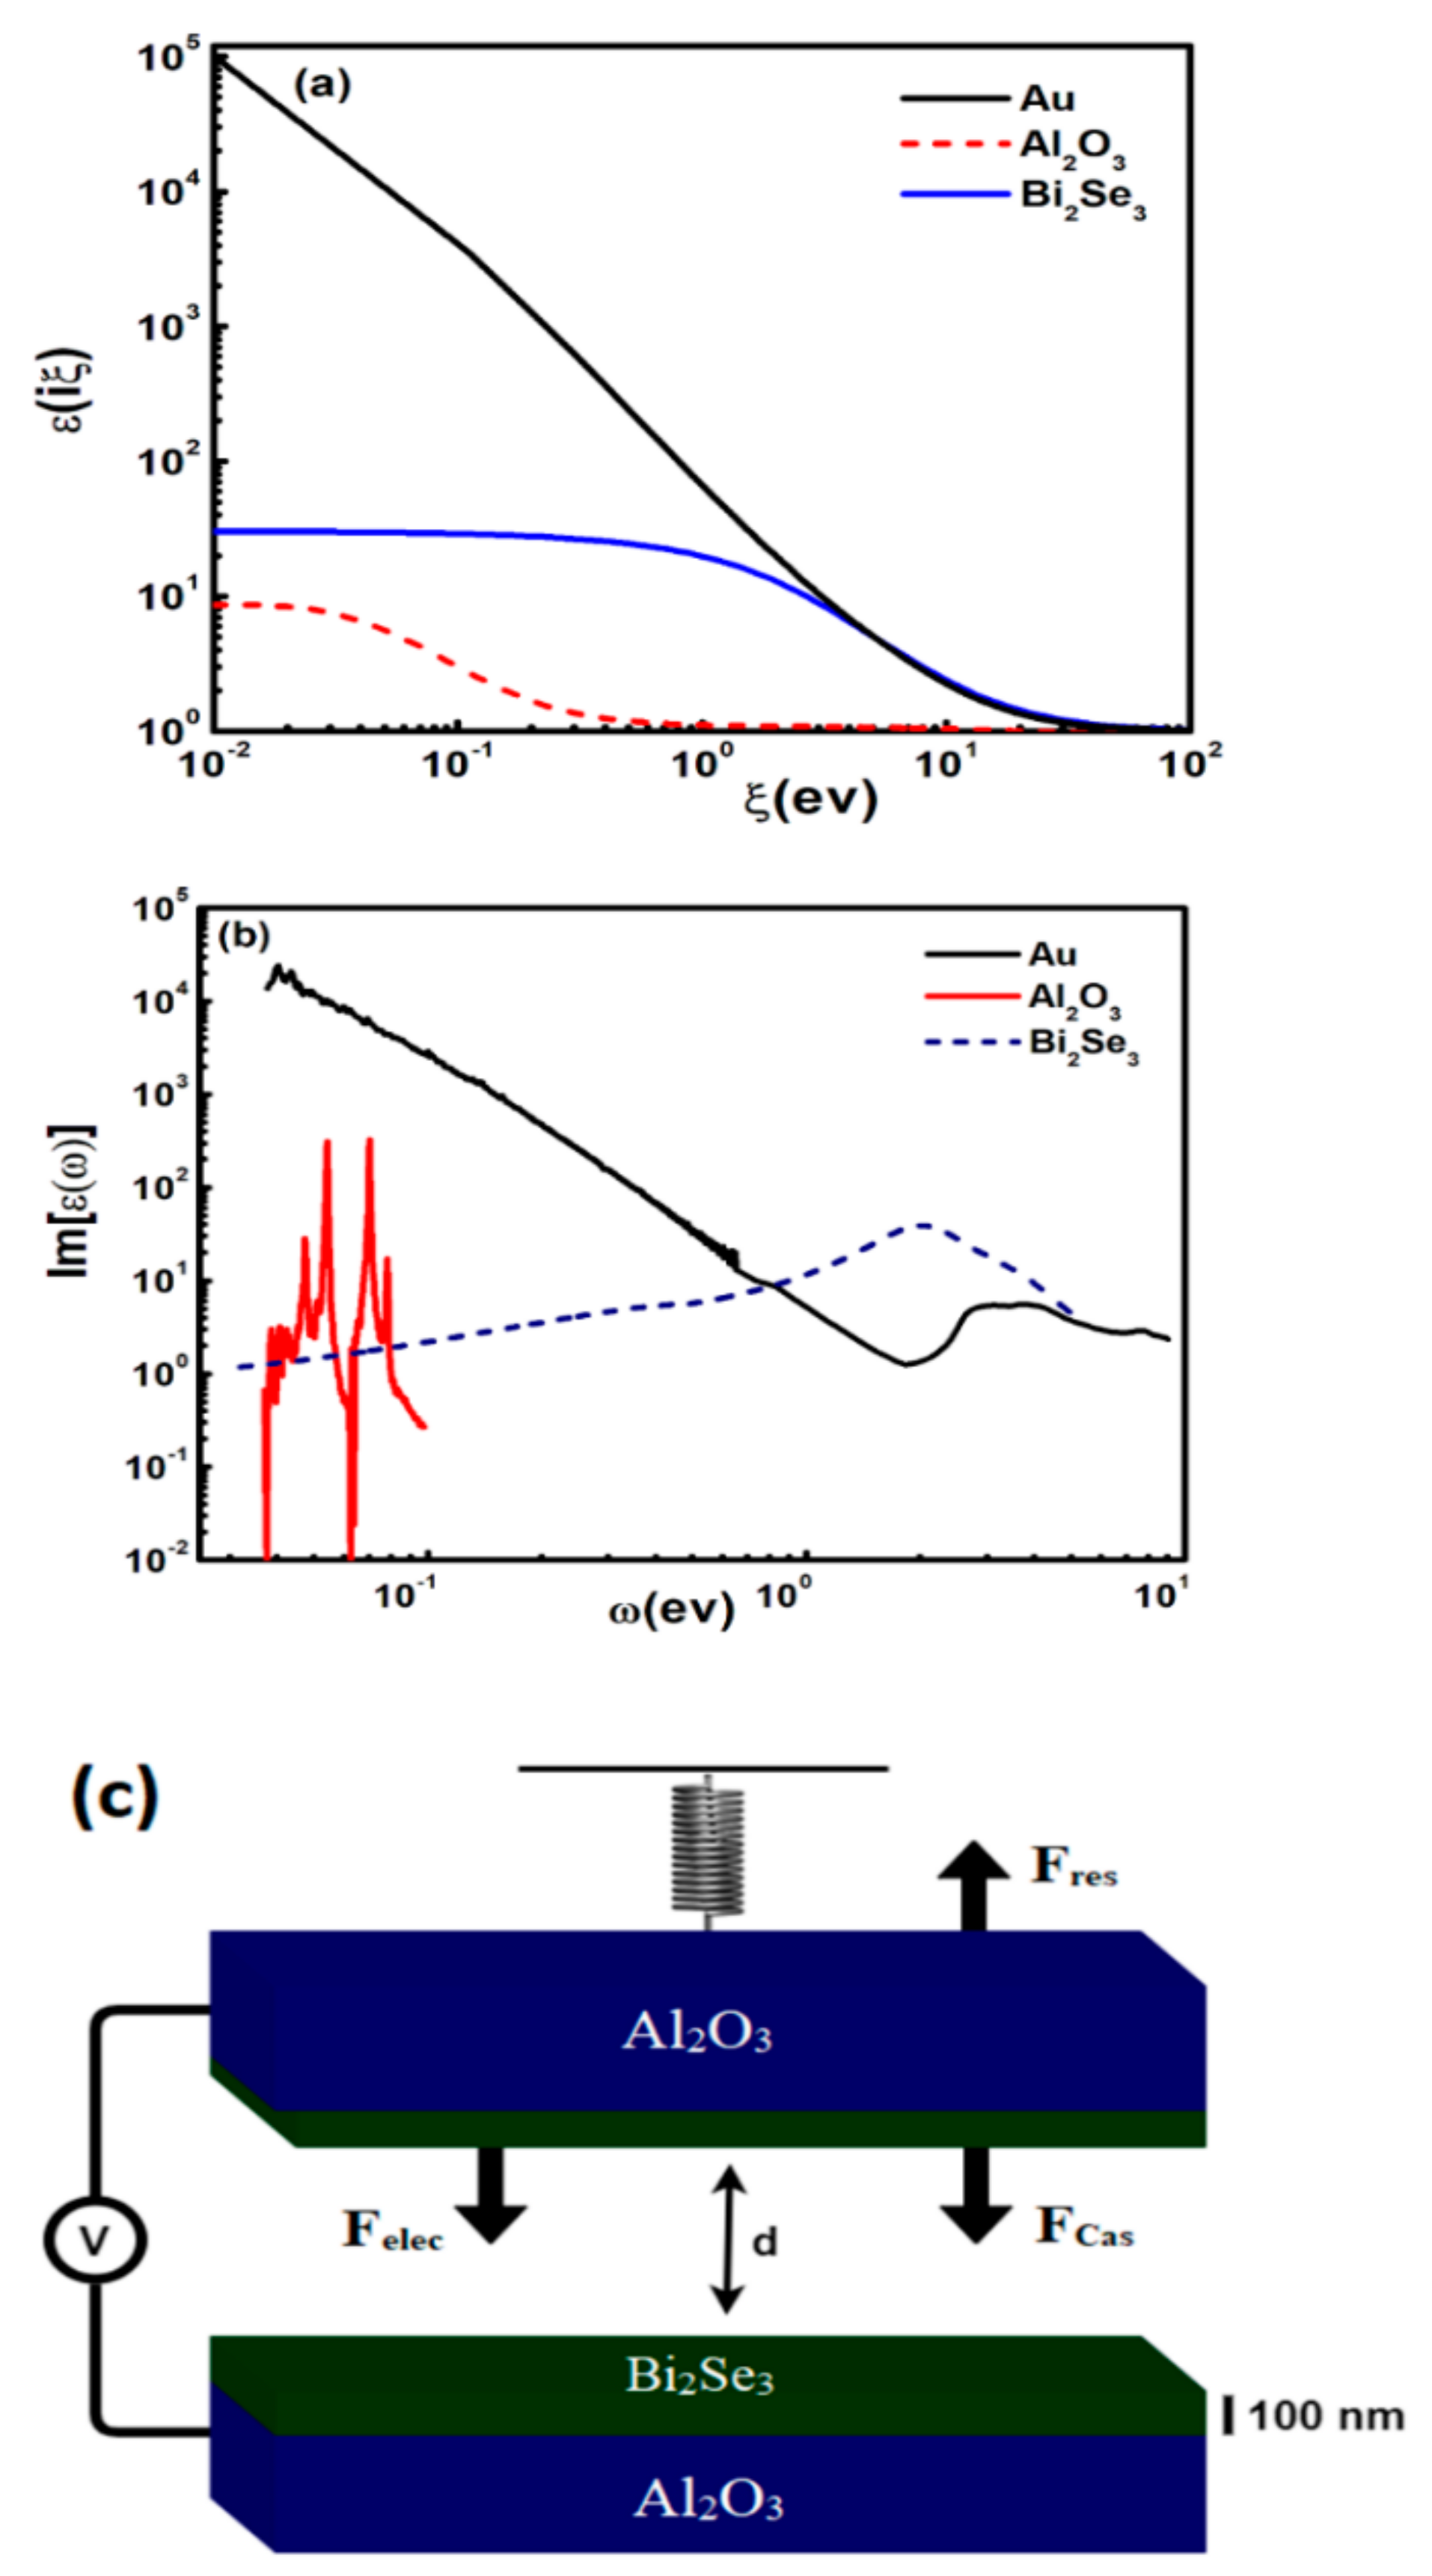
Prior to modeling the microdevice and its actuation dynamics, it is necessary to compute the Casimir force via Lifshitz theory (see Appendix A). For this purpose, the imaginary part of the frequency-dependent dielectric function is an essential input. Therefore, the optical properties of all samples, including Au, Bi2Se3, and Al2O3, were characterized with ellipsometry using the VUV-VASE (0.5–9.34 eV) and IR-VASE (0.03–0.5 eV) ellipsometers [17,26,27]. Bi2Se3 is a well-known 3D Topological insulator [26], and Au is used in devices due to its high conductivity ( eV) [17,27]. The imaginary part ε’’(ω) of frequency-dependent dielectric response function ε(ω) of Bi2Se3 and Al2O3 and the corresponding functions at imaginary frequencies ε(iξ) are shown in Figure 1a,b. Since, in practice, the experimental data for the imaginary part ε’’ (ω) of the dielectric function ε(ω) cover only a limited frequency range, some extrapolations were made as shown in Appendix B.
For our actuation analysis, we considered a typical microswitch as shown in Figure 1c. The microswitch was constructed from 2 plates where the upper plate was suspended by a mechanical spring governed by the Hooke’s law while the lower plate was fixed [28]. The elastic restoring force of the spring with stiffness K counterbalanced the attractive Casimir force. It was assumed that both plates were coated with an optically bulk Au film (thickness: ~100 nm) or a 100 nm layer of Bi2Se3 deposited on a bulk sapphire (Al2O3) as described by the authors of [26]. For our calculation, we considered initial separations d between the actuating plates in the range 250 nm to 1 µm, and any thermal effects were not taken into account (assuming, basically, a temperature of 0 K). By considering all acting forces on the movable plate, the equation of motion for the microsystem can be written as:
where M is the mass of the moving plate and (M/Q)(dz/dt) is the intrinsic energy dissipation of the actuating system with Q as its quality factor [29,30,31]. The frequency was assumed to have a value that is typical for many MEMS or atomic force microscope (AFM) cantilevers (typically = 300 kHz) [29,30,31]. The parameter was introduced to distinguish between the conservative frictionless autonomous operation of the actuating system () and the nonconservative driven system by an external force () in the presence of friction with a finite quality factor Q. Finally, we considered MEMS components with flat surfaces, because any nanoscale roughness has a significant influence at separations sufficiently below 100 nm [32]. In all cases, the lateral dimensions of the plates were considered to be .
3. Results and Discussion
To proceed with the analysis of the actuation dynamics, we introduced the bifurcation parameter , which is the ratio of the minimum Casimir force to the maximum restoring force . A small change of can lead to an abrupt change in the actuation of the system [15]. Substitution of yields for the equation of motion the more convenient form:
with λ = z/d and .
3.1. Conservative Actuating System (ε = 0)
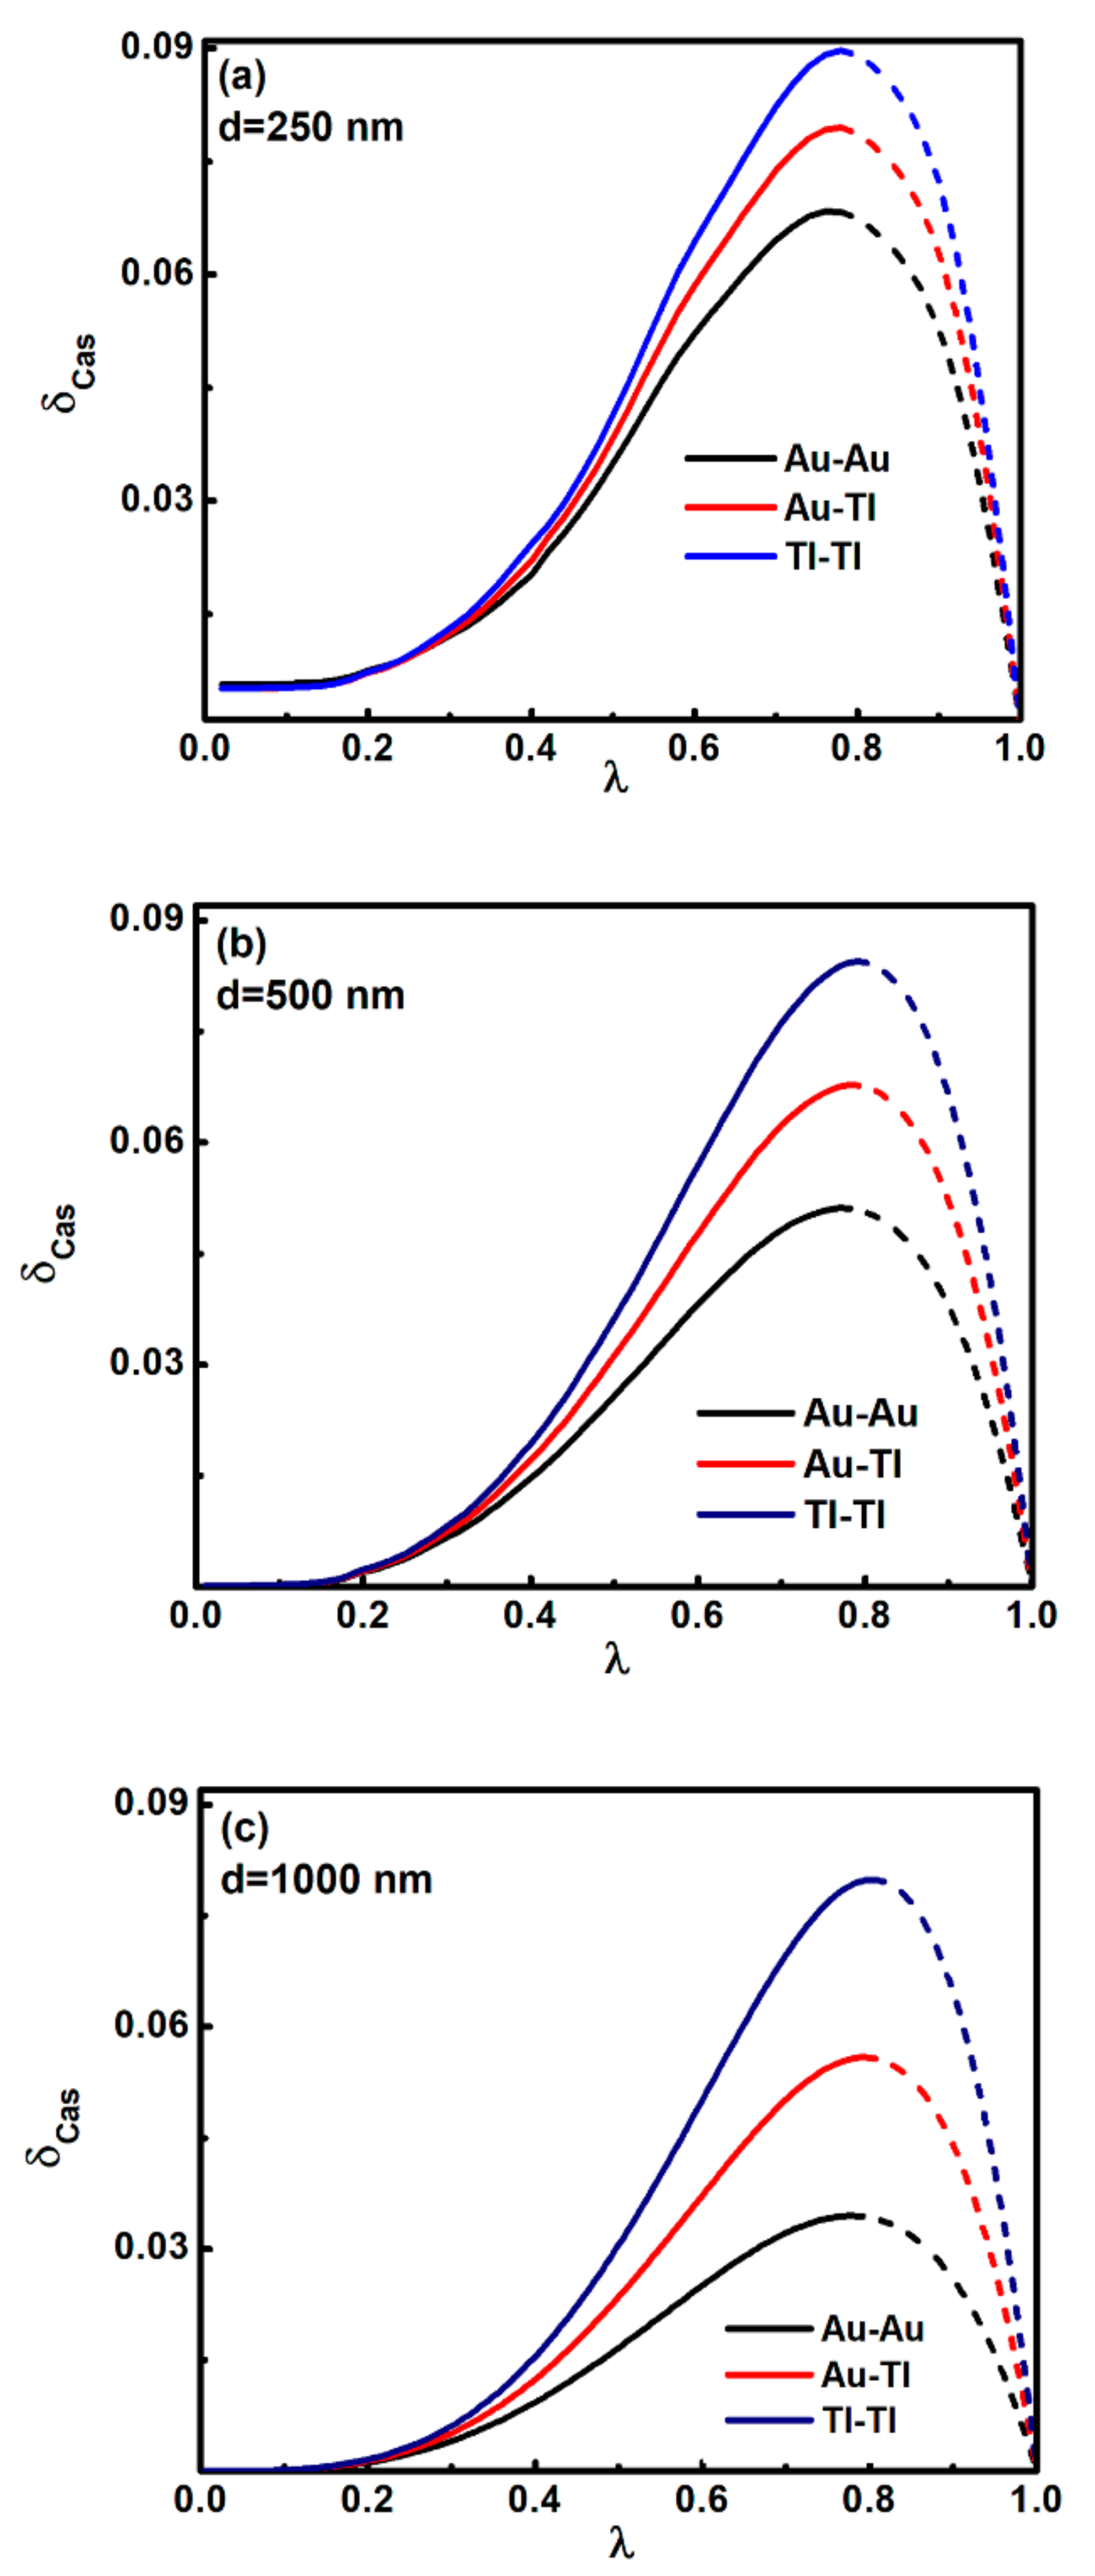
The conservative system is discussed first in order to study the equilibrium points of the dynamical system. In fact, the locus of equilibrium points is obtained by the condition , since the presence of periodic solution describes regions with sufficient restoring force to prevent stiction of the plates. In this case, Equation (2) yields the condition for . Figure 2 shows plots of vs. for different initial distances illustrating how different interaction materials generate considerable change on the stability conditions of the system. Notably, there is a significant difference between the bifurcation curves around the maximum where one approaches critically unstable behavior. In Figure 2, the dashed lines show the stable area where the restoring force is strong enough to ensure stable periodic motion. The solid lines indicate unstable regions where the moving plate undergoes instable motion leading to permanent lockdown. When , two equilibrium points exist. The equilibrium point closer to (dashed line) is a stable center point, and the one closer to (solid line) is the unstable saddle point. By increasing or equivalently weakening the restoring force (), the distance between the equilibrium points decreases until reaches the maximum saddle point . Clearly, when ~ for the Au-Au system leads to loss of its stability, it is still < for the TI-TI system, ensuring the presence of two equilibrium points and enhancing the possibility for stable motion.
Besides the bifurcation diagrams in Figure 2, the Poincare portraits in Figure 3 directly depict the strong sensitivity of actuation dynamics on its initial conditions and demonstrate how the size of the stable area is strongly dependent on the optical properties. In Figure 3, the enclosed area by the homoclinic orbit corresponds to periodic solutions and stable actuation. Otherwise, stiction would occur within one period. The phase portraits in Figure 3 also demonstrate that a system with stronger Casimir attractive force has significantly less phase space available for stable motion as is the case when comparing the distinct behavior of the Au-Au and TI-TI systems.
Because the extrapolation of the dielectric function for Au in the low frequency range was performed by the Drude model, Figure 4 shows the influence of extrapolation in the low frequency range by considering the effect of both the Drude (D) and Plasma (P) models. Due to the strong difference between the conduction states of Au and TI, the stable area for actuation of both the Au-Au and Au-TI systems is smaller than the TI-TI system for both extrapolation models. For the Au-Au system, the use of the Drude or Plasma models to extrapolate at low frequencies induces significant changes in the phase space available for stable actuation. However, for the Au-TI and the TI-TI systems, the extrapolation effect by the D/P models is reduced, e.g., in Au-TI systems, or fully eliminated, e.g., in TI-TI systems. For the latter, no extrapolation is performed for the optical data of the TI due to the absence of any measurable absorption in the far-infrared range (probably due to the insensitivity of the ellipsometry measurements to probe the conductive surface layer of the TI). In this plot, we considered δCas = 0.027 for both the Au-Au and Au-TI systems. According to the bifurcation diagram, by increasing the separation distance d for actuation (where the spring is not stretched during fabrication of the device) and therefore decreasing the value of , the chosen value for δCas moves to the maximum of the bifurcation curve (when d changes from 250 nm to 1000 nm) where the sensitivity on the optical properties is most pronounced. As a result, the ratio of the phase space area for stable actuation in Figure 4, SAA/STT and SAT/STT, decreases with increasing separation distance for both extrapolation models at low frequencies beyond the far-infrared range where optical data are no longer available.
3.2. Nonconservative Driven System (ε = 1)
For the more realistic case of externally actuated devices, we performed investigations of the existence of chaotic behavior in dissipative MEMS driven by an external periodic force [33]. Chaotic behavior could occur if the separatrix (homoclinic orbit) of the conservative system splits, and this behavior can be studied by the so-called Melnikov function and Poincare portrait analysis [33,34]. If we define the homoclinic solution of the conservative system as , then the Melnikov function for the oscillating system () is given by [28,29]:
The separatrix splits if the Melnikov function has simple zeros such that and . If have no zeros. Thus, the device motion will not be chaotic. The conditions of no simple zeros where and provide the threshold condition for possible chaotic motion [33,34]. If we define:
then the threshold condition for chaotic motion with obtains the form:
with , and denoting the Hilbert transform [33,34].
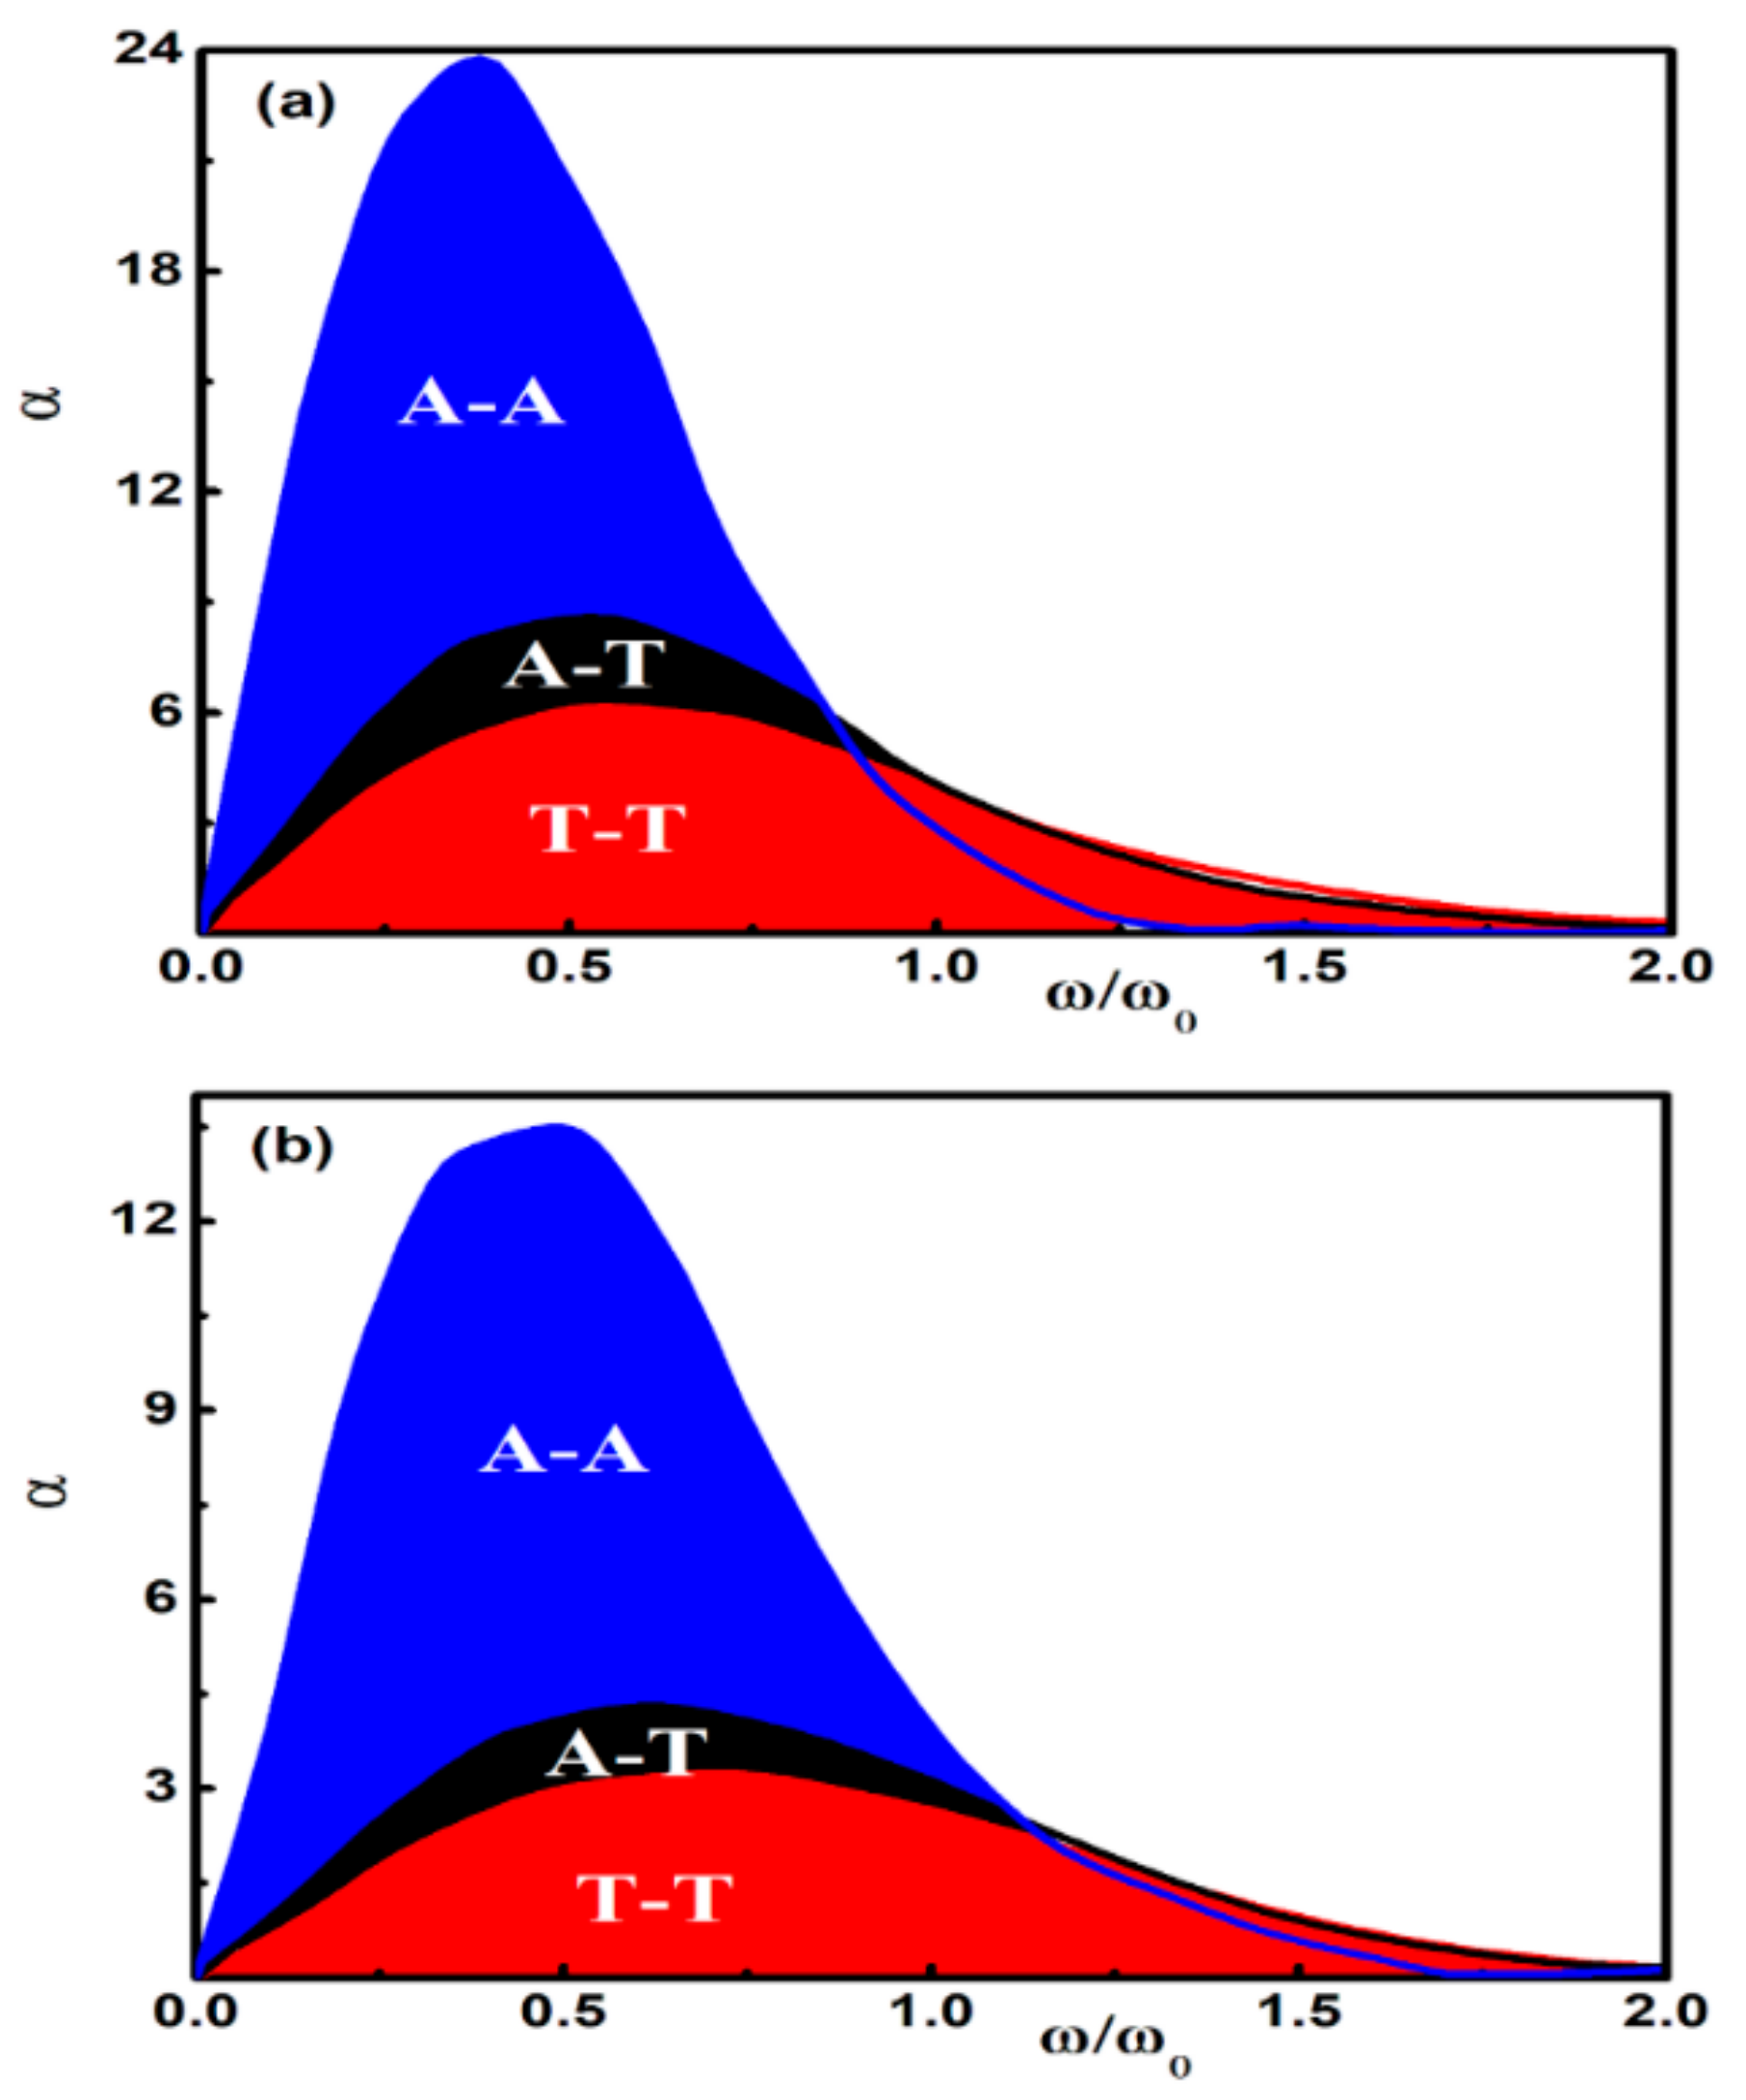
Figure 5 shows the threshold Melnikov curves vs. the driving frequency ratio . For relatively large values of α (above the curve), the dissipation dominates the driving force (), leading to regular motion, which asymptotically approaches the stable periodic orbit of the conservative system. However, for parameter values below the curve, the splitting of the separatrix could lead to chaotic motion. Clearly, for the Au-Au system with the highest conductivity of interacting materials, which lead also to stronger Casimir forces, chaotic motion is more likely to occur as it is manifested by the larger area below the threshold curves. However, for the TI-TI system, this area is decreased significantly, indicating higher possibilities for stable driven actuation. Hence, Figure 5 clearly demonstrates the strong dependence of the region below the threshold curve on the optical properties of the interacting materials for all values of initial distance d prior to initiation of its actuation.
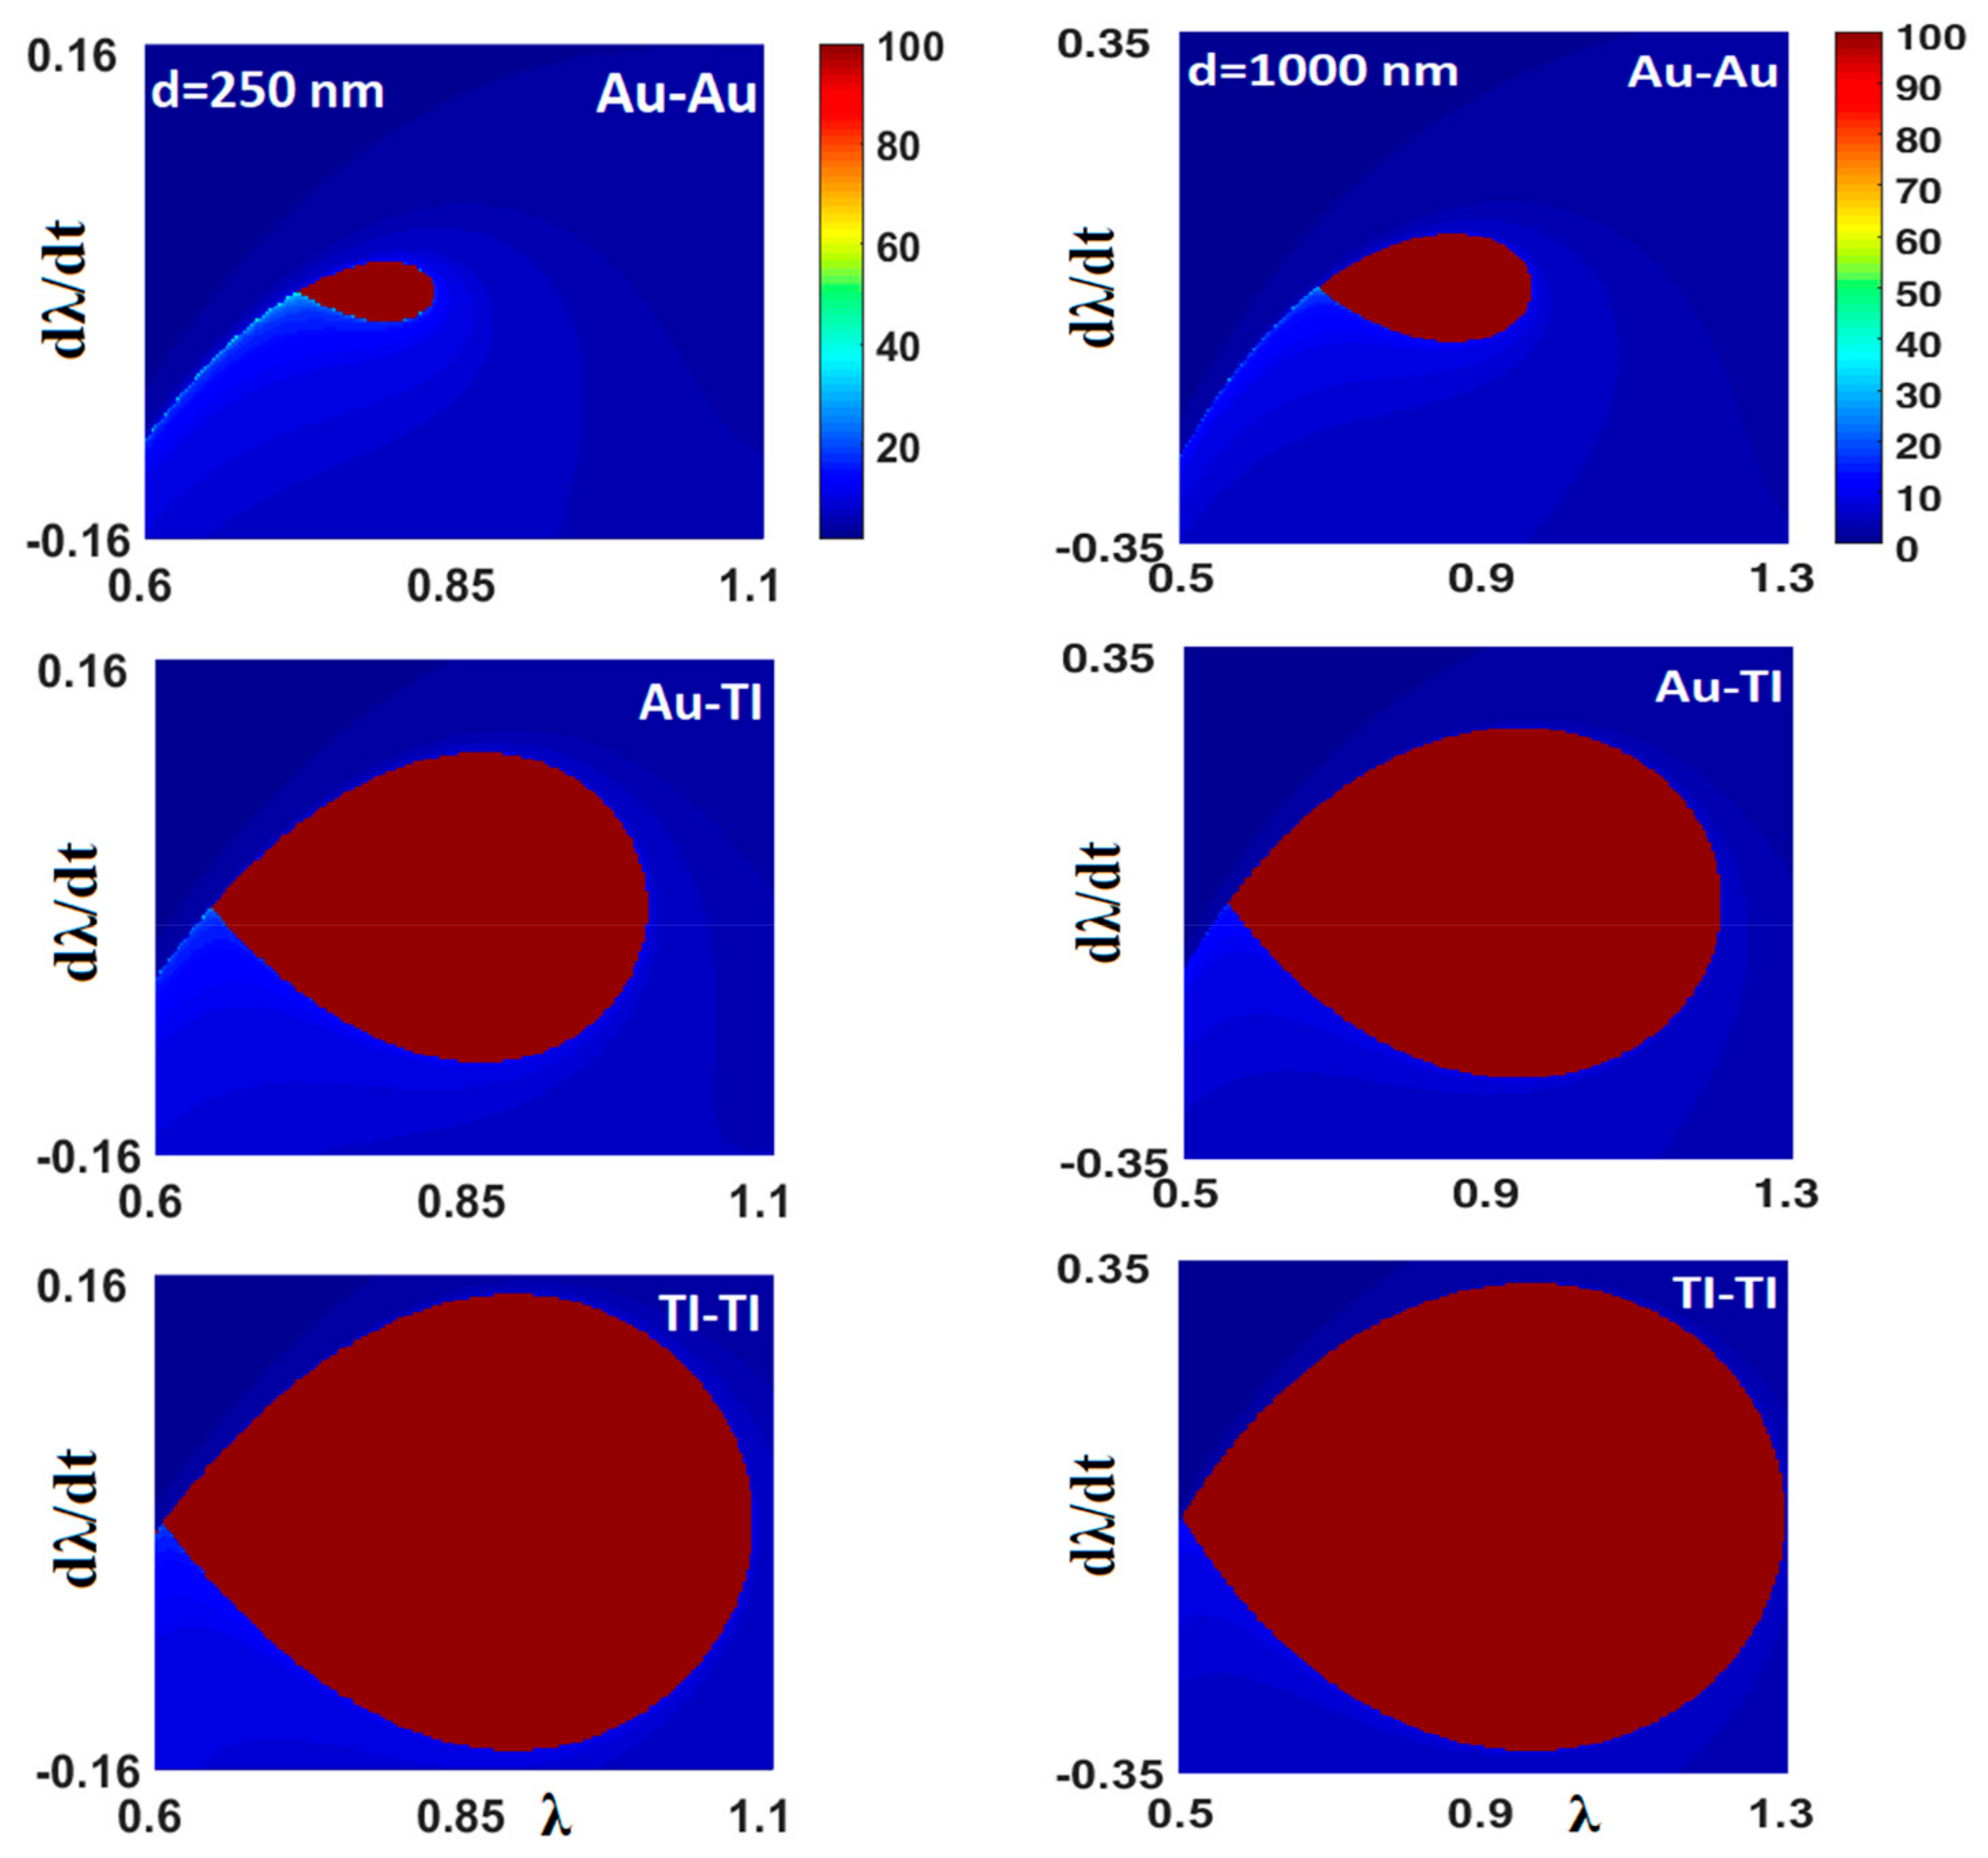
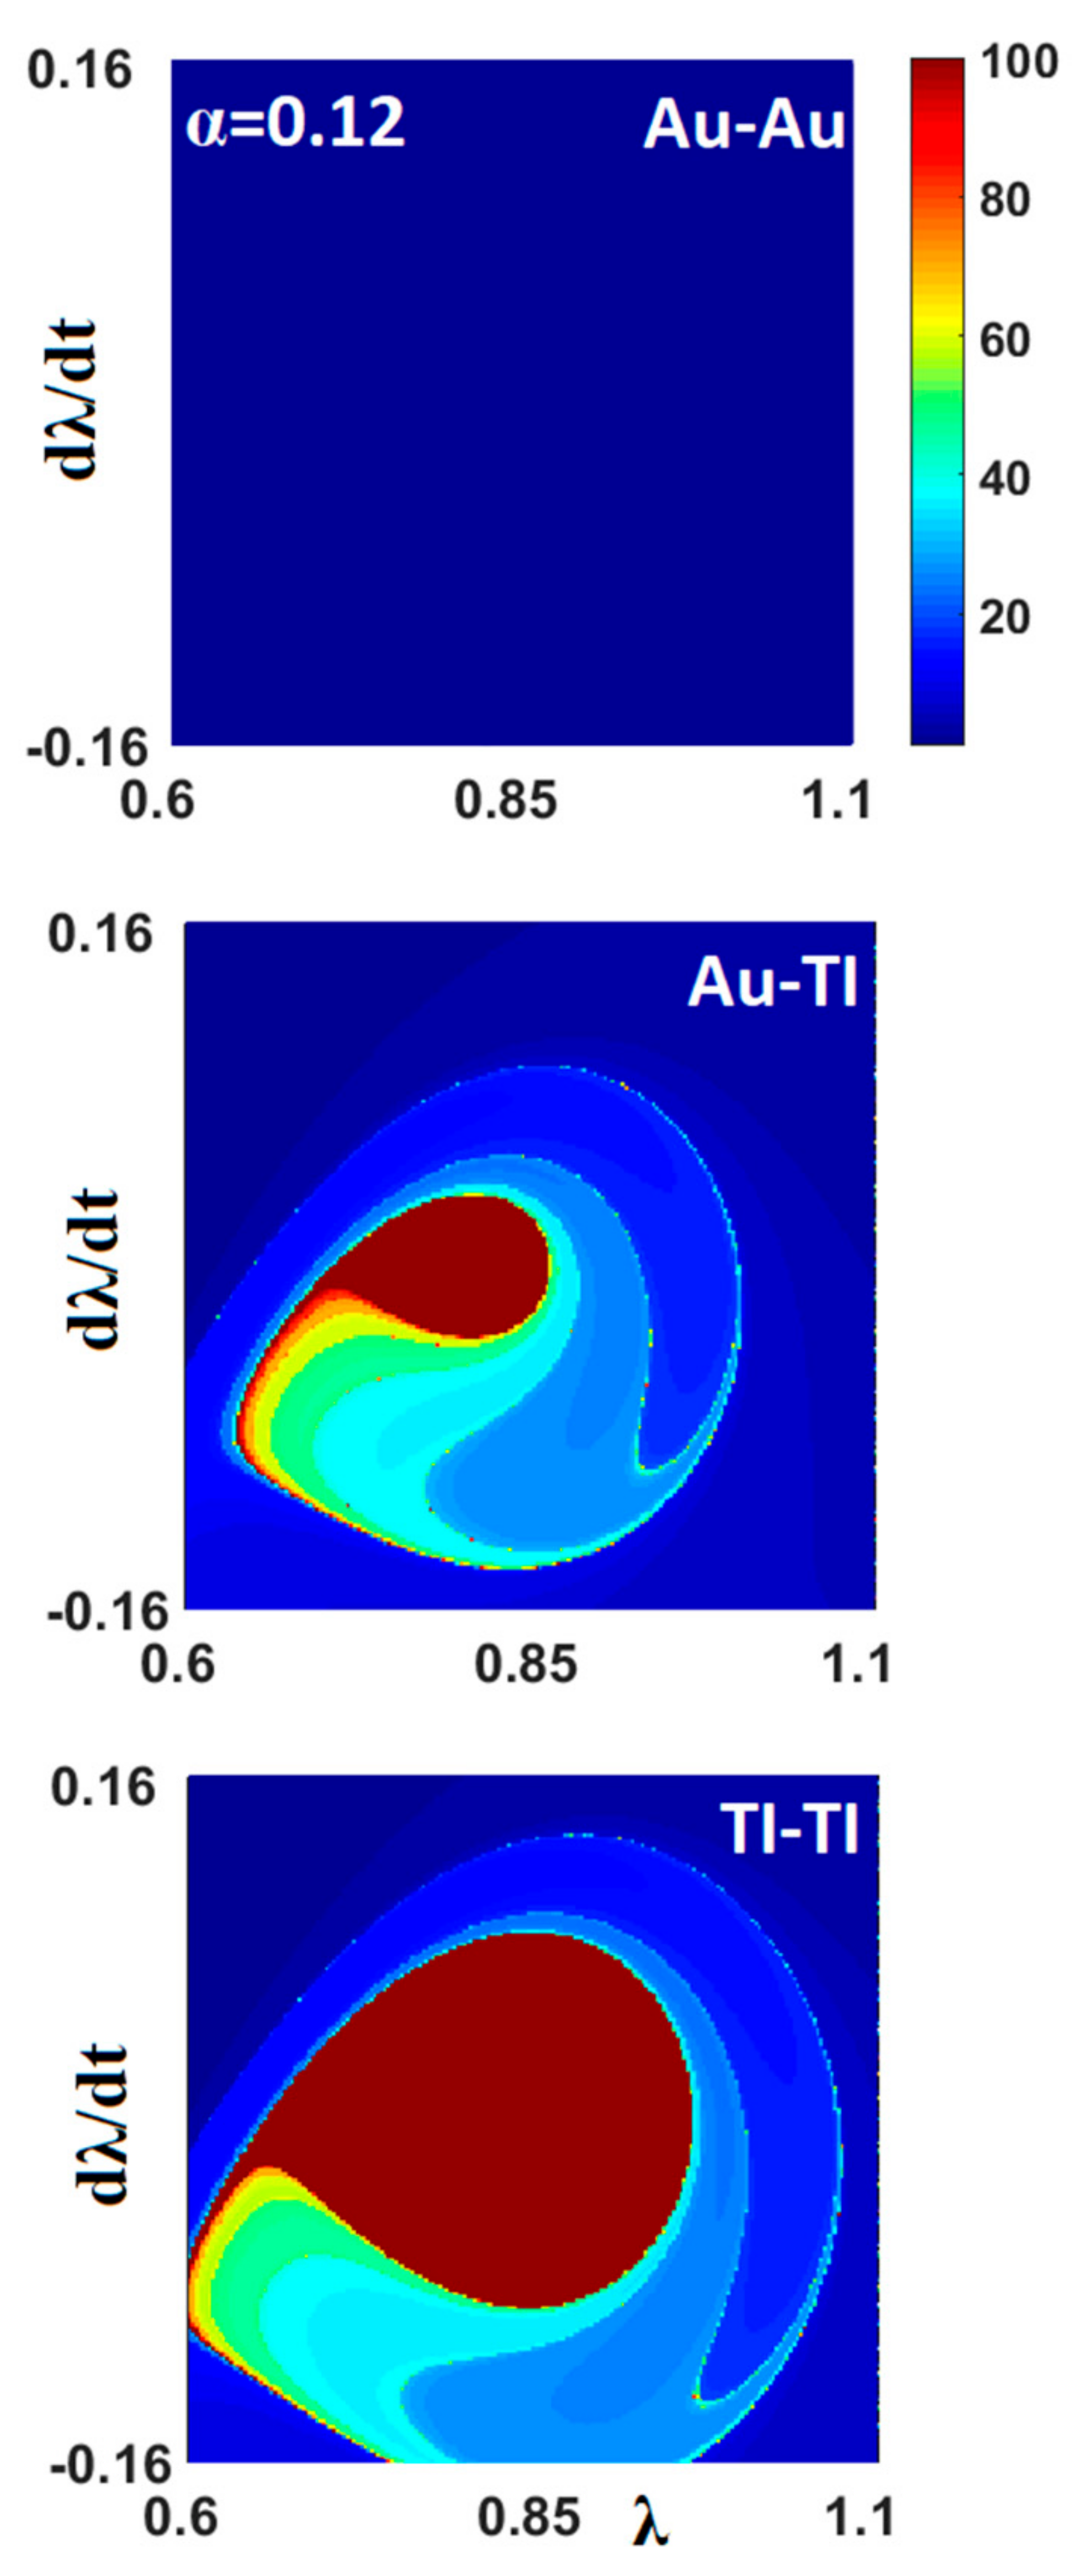
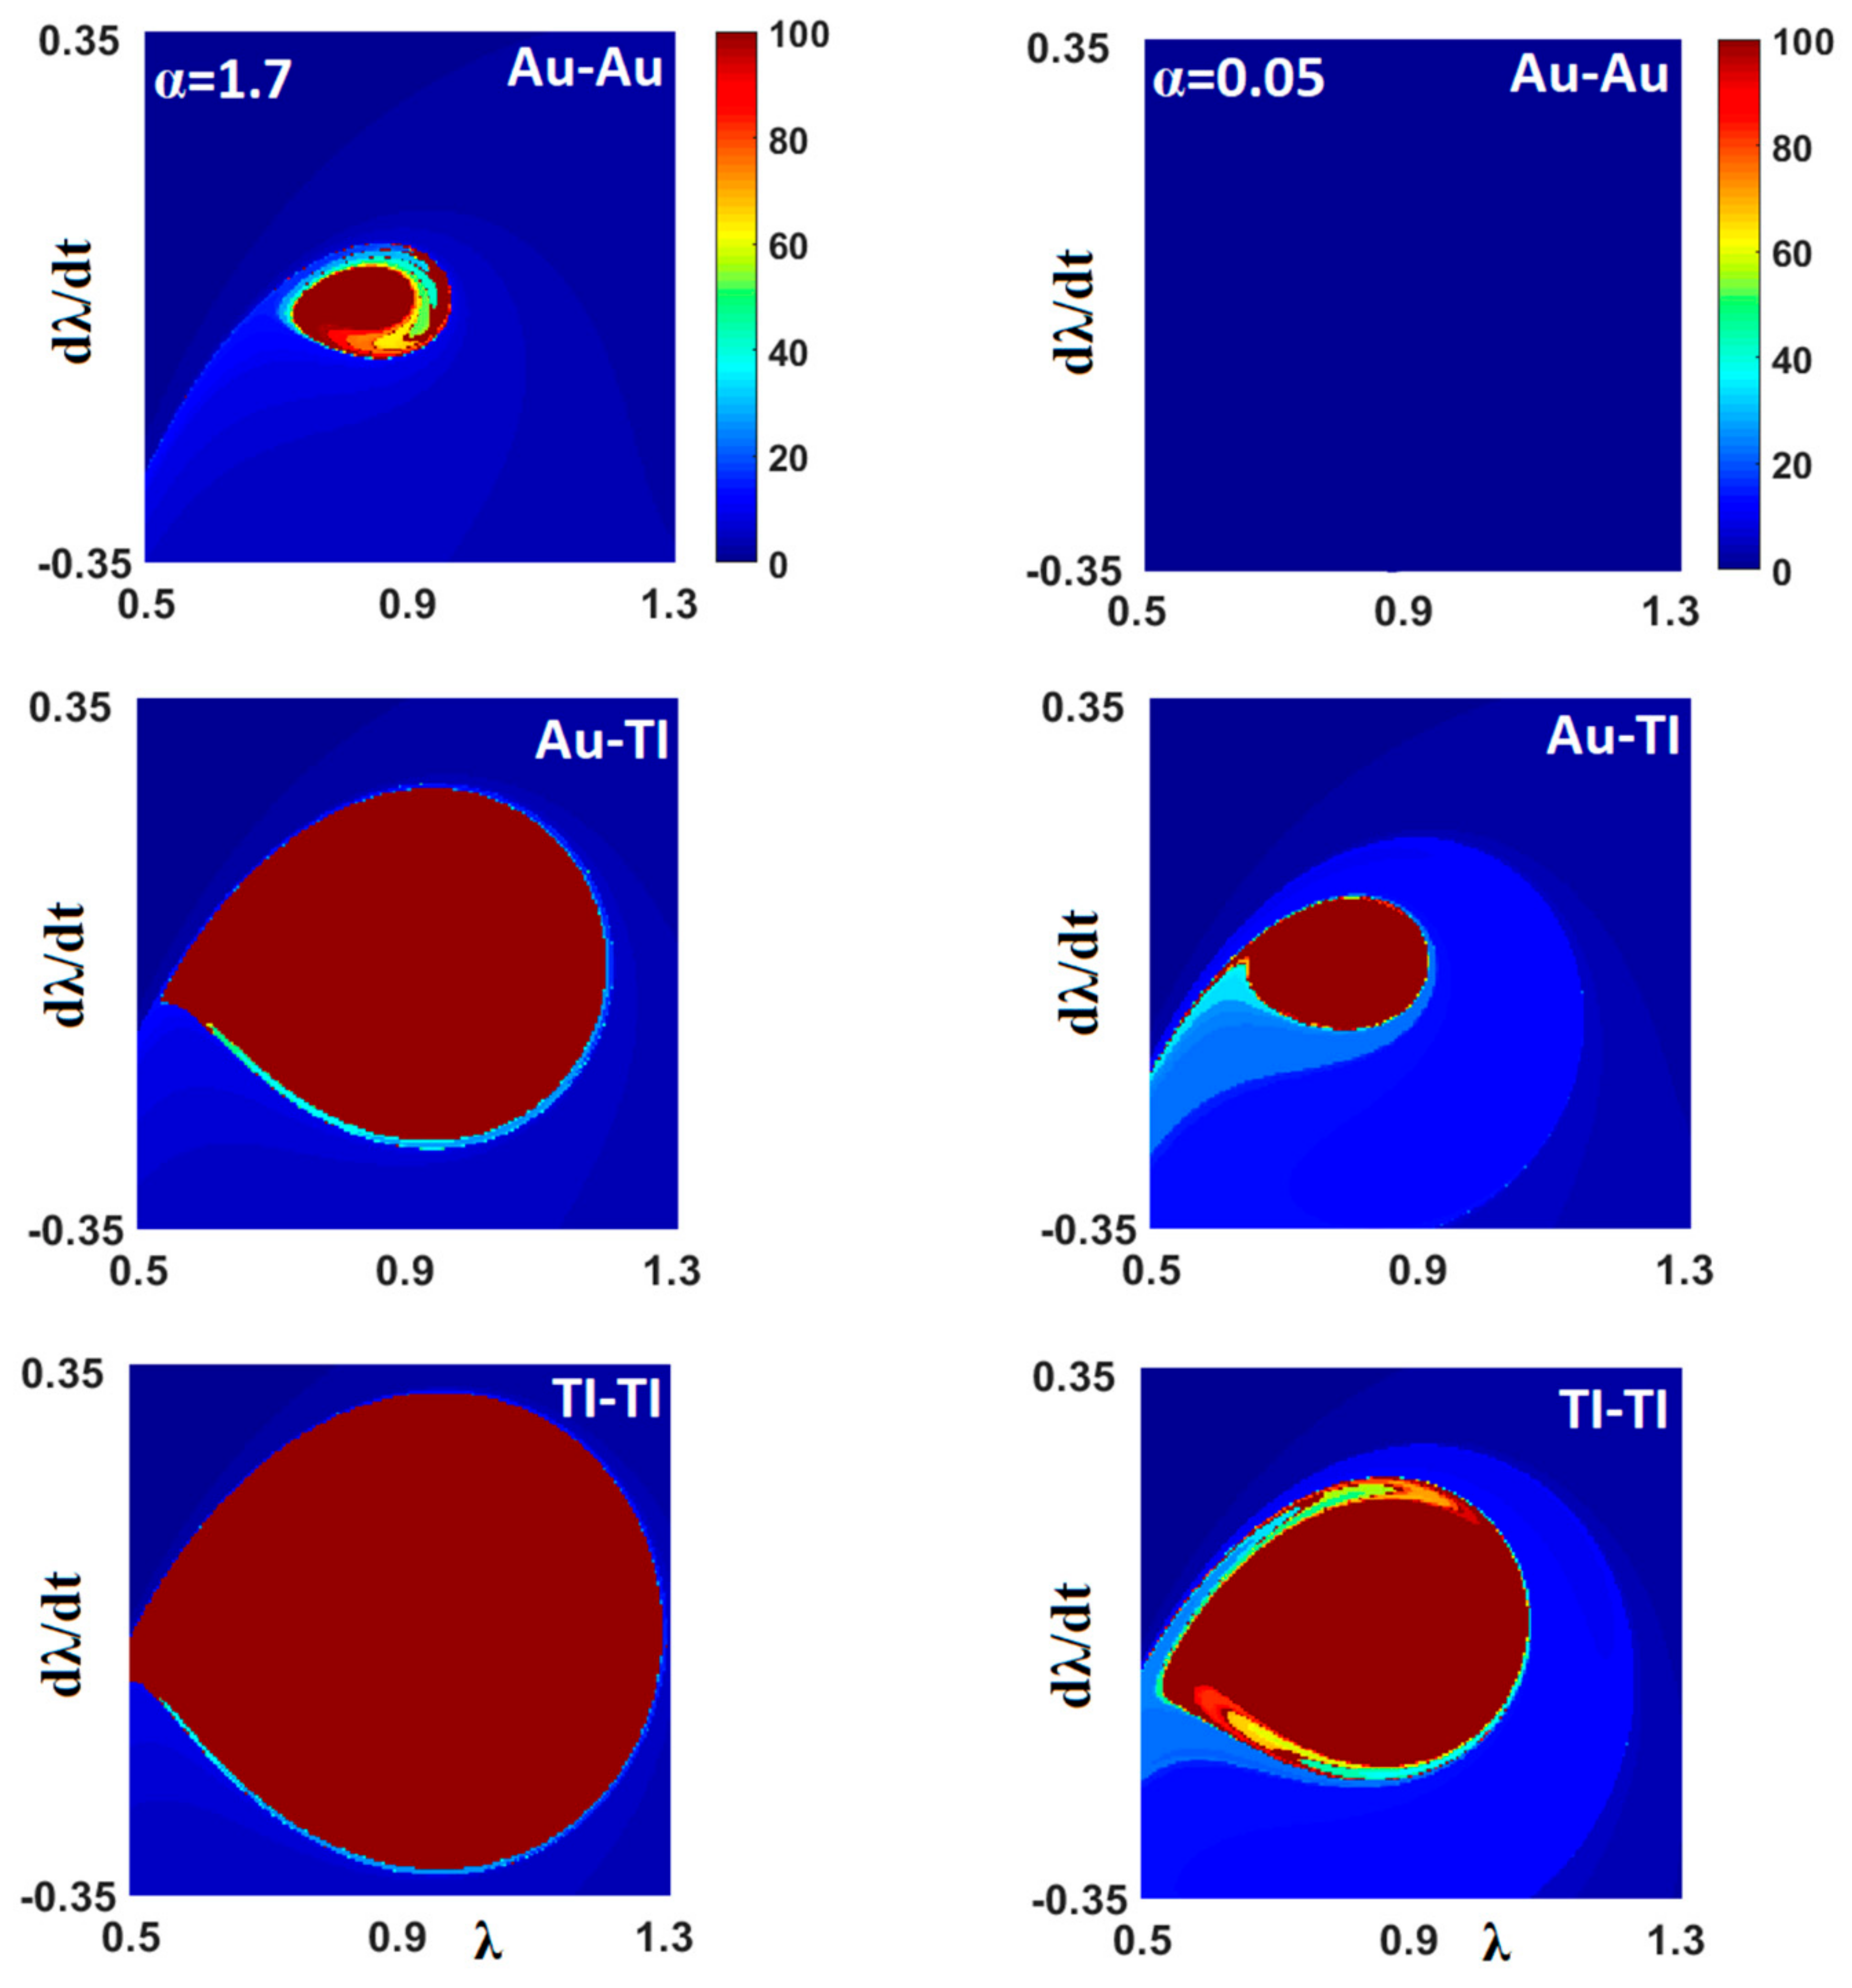
Furthermore, the Poincare portraits in Figure 6 and Figure 7 illustrate the sensitive dependence of the chaotic motion on the optical properties for the Au and TI systems for both different initial distances d and threshold values of the parameter . When the occurrence of chaotic motion is possible with the decreasing value of there is a region of initial conditions where the distinction between qualitatively different solutions is unclear. If we compare Figure 5 with Figure 3 where chaotic motion does not occur, it is revealed that, for chaotic motion, there is no simple smooth boundary between the stable (red regions) and unstable solutions (blue regions). With decreasing the value of the parameter , the possibility of occurrence of chaotic motion is enhanced as it is manifested by the dramatic shrinkage of the stable solutions (elliptic-like red area) in Figure 7 for the Au-Au system. This is also in strong contrast with the TI-TI system where stable operation is much more efficiently ensured even for very low values of the parameter within the area favoring unstable motion.
From Figure 6 and Figure 7, it is evident how the chaotic motion of Casimir oscillators can impose a considerable risk of stiction after several periods of oscillation, limiting the long-term prediction of the device operation. This undesirable malfunction occurs more prominently for the more conductive systems since the Casimir force is stronger. On the other hand, for the actuating system where TIs are involved, the measurement of the residual contact potentials Vo, as performed by the authors of [26] for the Au-Bi2Se3 system leading to potential values Vo ≈ 200 mV for TI thicknesses in the range 10–100 nm, allows subsequent voltage compensation (for TI thickness above 30 nm [26]). At the same time, the TI (e.g., Bi2Se3) yields weaker Casimir forces that allow stable operation over a wider area of initial conditions in phase space. Indeed, according to the authors of [6,7], the stable area for operation of actuating devices undergoes further shrinkage with additional electrostatic forces. This effect is very crucial for operation under condition with Melnikov parameter < 1 (corresponding to strong driving force and weak dissipation γ) where, for the Au-Au system, any phase space for stable operation in Figure 7 is absent. Moreover, for the TI-TI system, it has still significant size.
4. Conclusions
In conclusion, we investigated the sensitivity of actuation dynamics of electromechanical systems on novel materials, for example, Bi2Se3, a well-known 3D Topological Insulator (TI), and compared their response to good conductors, e.g., Au. Analysis in conservative systems using bifurcation and phase portraits suggests that the strong difference between the conduction states of Bi2Se3 and Au yield sufficiently weaker Casimir force to enhance stable operation. Furthermore, for nonconservative driven systems, the Melnikov function and Poincare portraits analysis probed the occurrence of chaotic behavior leading to increased risk for stiction. It was found that the presence of the TI enhances stable operation against chaotic behavior over a significantly wider range of operation conditions in comparison to typical metallic conductors. Therefore, the use of TIs can allow sufficient surface conductance to apply electrostatic compensation of any contact potentials [23] and, at the same, to yield sufficient weak Casimir forces to allow long-term prediction of actuation dynamics against chaotic behavior. This effect will be very crucial for operation under Melnikov parameters < 1 (relatively strong driving force and weak dissipation) where, for good conductors, any phase space for stable operation is absent. For the systems where TIs are involved, operation could have still a significant available range of initial conditions to perform stable actuation on longer-term basis.
Author Contributions
All authors contributed to the research reported in this article. Conceptualization, F.T., Z.B., and G.P.; methodology, F.T., Z.B., and G.P.; software, F.T., Z.B., and M.S., validation, F.T., Z.B., M.S.; formal analysis, F.T., G.P.; investigation, F.T., Z.B., M.S., G.P.; writing—original draft preparation, F.T., and G.P.; writing—review and editing, F.T., Z.B., M.S., and G.P.; funding acquisition, F.T., and G.P. All authors have read and agreed to the published version of the manuscript.
Funding
This research was partly funded by the Netherlands Organization for Scientific Research (NWO) under grant number 16PR3236.
Institutional Review Board Statement
Not applicable.
Informed Consent Statement
Not applicable.
Data Availability Statement
The computer-generated data used in this article are available by request to the authors.
Acknowledgments
G.P. acknowledges support from the Netherlands Organization for Scientific Research (NWO) under grant number 16PR3236. F.T. acknowledges support from the Department of Physics at Alzahra University. We would like to acknowledge useful discussions with D.T. Yiman for the analysis of the optical data for the Bi2Se3 system.
Conflicts of Interest
The authors declare no conflict of interest.
Appendix A. Lifshitz Theory for Stratified Media
The Casimir force between two plates which are covered with a thin layer of Bi2Se3 on a bulk of Al2O3 (Figure 1) in Equation (2) is given by [8,9,10]:
are the imaginary frequencies. The reflection coefficients between the plates are given by [4,9,10]:
where ‘a’ is thickness of Bi2Se3, and the index of +B (-B) and +A (-A) define regions that correspond to Bi2Se3 and Al2O3 for a plate at the right (left) side, respectively. The vacuum between the plates is referred by the index 0. The reflection coefficients on the various boundaries are given by and for the transverse electric (TE) and magnetic (TM) field polarizations, respectively. represents the out-off plane wave vector in the gap between the interacting plates () and in each of the interacting plates (). is the in-plane wave vector.
Appendix B. Dielectric Function of Materials with Extrapolations
For the calculation of the integral in Equation (A4), the measured data for the imaginary part of the frequency dependent dielectric function are required. In this study, for the Au sample, the experimental data of the imaginary part of the dielectric function cover only a limited range of frequencies . Therefore, for the low optical frequencies (), we extrapolated using the Drude model [9,10,17,35]:
where is the plasma frequency and is the relaxation frequency. For the high optical frequencies (), we extrapolated using the expression [9,10,17,35]:
Finally, for the plasma model, one must replace the term in Equation (A8) with . Therefore, for the plasma model, is given by the simpler expression:
For the case of Bi2Se3 and Al2O3, there is no any extrapolation because they do not have any measurable Drude tail indicating absorption for the imaginary part at low frequencies.
References
- Rodriguez, A.W.; Capasso, F.; Johnson, S.G. The Casimir effect in microstructured geometries. Nat. Photonics 2011, 5, 211. [Google Scholar] [CrossRef]
- Capasso, F.; Munday, J.N.; Iannuzzi, D.; Chan, H.B. Casimir Forces and Quantum Electrodynamical Torques: Physics and Nanomechanics. IEEE J. Sel. Top. Quant. Electron. 2007, 13, 400. [Google Scholar] [CrossRef]
- Ball, P. Fundamental physics: Feel the force. Nature 2007, 447, 77. [Google Scholar] [CrossRef]
- Bordag, M.; Klimchitskaya, G.L.; Mohideen, U.; Mostepanenko, V.M. Advances in the Casimir Effect; Oxford University Press: New York, NY, USA, 2009. [Google Scholar]
- Tajik, F.; Sedighi, M.; Palasantzas, G. Sensitivity on materials optical properties of single beam torsional Casimir actuation. J. Appl. Phys. 2017, 121, 174302. [Google Scholar] [CrossRef] [Green Version]
- Tajik, F.; Sedighi, M.; Khorrami, M.; Masoudi, A.A.; Palasantzas, G. Chaotic behavior in Casimir oscillators: A case study for phase-change materials. Phys. Rev. E 2017, 96, 042215. [Google Scholar] [CrossRef] [PubMed] [Green Version]
- Tajik, F.; Sedighi, M.; Khorrami, M.; Masoudi, A.A.; Waalkens, H.; Palasantzas, G. Dependence of chaotic behavior on optical properties and electrostatic effects in double-beam torsional Casimir actuation. Phys. Rev. E 2018, 98, 02210. [Google Scholar] [CrossRef] [Green Version]
- Casimir, H.B.G. Zero Point Energy Effects on Quantum Electrodynamics. Proc. K. Ned. Akad. Wet. 1948, 51, 793. [Google Scholar]
- Lifshitz, E.M. The Theory of Molecular Attractive Forces between Solids. Sov. Phys. JETP 1956, 2, 73. [Google Scholar]
- Dzyaloshinskii, I.E.; Lifshitz, E.M.; Pitaevskii, L.P. General theory of van der waals forces. Sov. Phys. Uspekhi 1961, 4, 153. [Google Scholar] [CrossRef]
- Decca, R.S.; L’opez, D.; Fischbach, E.; Klimchitskaya, G.L.; Krause, D.E.; Mostepanenko, V.M. Novel constraints on light elementary particles and extra-dimensional physics from the Casimir effect. Eur. Phys. J. C 2007, 51, 963. [Google Scholar] [CrossRef] [Green Version]
- Decca, R.S.; López, D.; Fischbach, E.; Klimchitskaya, G.L.; Krause, D.E.; Mostepanenko, V.M. Tests of new physics from precise measurements of the Casimir pressure between two gold-coated plates. Phys. Rev. D 2007, 75, 077101. [Google Scholar] [CrossRef] [Green Version]
- Craighead, H.G. Nanoelectromechanical systems. Science 2000, 290, 1532. [Google Scholar] [CrossRef] [PubMed] [Green Version]
- Bochobza-Degani, O.; Nemirovsky, Y. Modeling the pull-in parameters of electrostatic actuators with a novel lumped two degrees of freedom pull-in model. Sens. Actuators A 2002, 97–98, 659. [Google Scholar]
- Sedighi, M.; Broer, W.H.; Palasantzas, G.; Kooi, B.J. Sensitivity of micromechanical actuation on amorphous to crystalline phase transformations under the influence of Casimir forces. Phys. Rev. B 2013, 88, 165423. [Google Scholar] [CrossRef] [Green Version]
- Sedighi, M.; Palasantzas, G. Casimir and hydrodynamic force influence on microelectromechanical system actuation in ambient conditions. Appl. Phys. Lett. 2014, 104, 074108. [Google Scholar] [CrossRef]
- Sedighi, M.; Svetovoy, V.B.; Broer, W.H.; Palasantzas, G. Casimir forces from conductive silicon carbide surfaces. Phys. Rev. B 2014, 89, 195440. [Google Scholar] [CrossRef]
- Tajik, F.; Sedighi, M.; Babamahdi, Z.; Masoudi, A.A.; Waalkense, H.; Palasantzas, G. Dependence of non-equilibrium Casimir forces on material optical properties towards chaotic motion during device actuation. Chaos 2019, 29, 093126. [Google Scholar] [CrossRef] [PubMed]
- Tajik, F.; Sedighi, M.; Babamahdi, Z.; Masoudi, A.A.; Waalkense, H.; Palasantzas, G. Sensitivity of non-equilibrium Casimir forces on low frequency optical properties towards chaotic motion of microsystems. Chaos 2020, 30, 023108. [Google Scholar] [CrossRef]
- Hasan, M.Z.; Kane, C.L. Colloquium: Topological insulators. Rev. Mod. Phys. 2010, 82, 3045. [Google Scholar] [CrossRef] [Green Version]
- Moore, J.E. The birth of topological insulators. Nature 2010, 464, 194. [Google Scholar] [CrossRef]
- Hsieh, D.; Qian, D.; Wray, L.; Xia, Y.; Hor, Y.; Cava, R.J.; Hasan, M. A Topological Dirac insulator in a quantum spin Hall phase. Nature 2008, 452, 970. [Google Scholar]
- Grushin, A.G.; Corteijo, A. Tunable Casimir Repulsion with Three-Dimensional Topological Insulators. Phys. Rev. Lett. 2011, 106, 020403. [Google Scholar] [CrossRef]
- Grushin, A.G.; Rodriguez-Lopez, P.; Corteijo, A. Effect of finite temperature and uniaxial anisotropy on the Casimir effect with three-dimensional topological insulators. Phys. Rev. B 2011, 84, 045119. [Google Scholar] [CrossRef] [Green Version]
- Martinez, J.C.; Jalil, M.B.A. Tuning the Casimir force via modification of interface properties of three-dimensional topological insulators. J. Appl. Phys. 2013, 113, 204302. [Google Scholar] [CrossRef]
- Babamahdi, Z.; Svetovoy, V.B.; Yimam, D.T.; Kooi, B.J.; Banerjee, T.; Moon, J.; Enache, S.; Oh, M.; Stöhr, M.; Palasantzas, G. Casimir and electrostatic forces from Bi2Se3 thin films of varying thickness. Phys. Rev. B Lett. 2021, 103, L161102. [Google Scholar]
- Svetovoy, V.B.; van Zwol, P.J.; Palasantzas, G.; de Hosson, J.T.M. Optical properties of gold films and the Casimir force. Phys. Rev. B 2008, 77, 035439. [Google Scholar] [CrossRef] [Green Version]
- Pelesko, J.A.; Bernstein, D.H. Modeling MEMS and NEMS; Chapman & Hall/CRC: Boca Raton, FL, USA, 2003. [Google Scholar]
- Garcıa, R.; Perez, R. Dynamic atomic force microscopy methods. Surf. Sci. Rep. 2002, 47, 197. [Google Scholar] [CrossRef]
- Li, M.; Tang, H.X.; Roukes, M.L. Ultra-sensitive NEMS-based cantilevers for sensing, scanned probe and very high-frequency applications. Nat. Nanotechnol. 2007, 2, 114. [Google Scholar] [CrossRef] [PubMed]
- Mamin, H.J.; Rugar, D. Sub-attonewton force detection at millikelvin temperatures. Appl. Phys. Lett. 2011, 79, 3358. [Google Scholar] [CrossRef]
- Torricelli, G.; van Zwol, P.J.; Shpak, O.; Palasantzas, G.; Svetovoy, V.B.; Binns, C.; Kooi, B.J.; Jost, P.; Wuttig, M. Casimir force contrast between Amorphous and Crystalline Phases of AIST. Adv. Funct. Mater. 2012, 22, 3729. [Google Scholar] [CrossRef]
- Broer, W.; Waalkens, H.; Svetovoy, V.B.; Knoester, J.; Palasantzas, G. Nonlinear actuation dynamics of driven Casimir oscillators with rough surfaces. Phys. Rev. Appl. 2015, 4, 054016. [Google Scholar] [CrossRef] [Green Version]
- Hirsch, M.W.; Smale, S.; Devaney, R.L. Differential Equations, Dynamical Systems, and an Introduction to Chaos; Elsevier Academic Press: San Diego, CA, USA, 2004. [Google Scholar]
- Sedighi, M.; Svetovoy, V.B.; Palasantzas, G. Casimir force measurements from silicon carbide surfaces. Phys. Rev. B 2016, 93, 085434. [Google Scholar] [CrossRef]
Figure 1.
(a) Dielectric functions at imaginary frequency for Au, Al2O3, and Bi2Se3. (b) Imaginary part of the frequency-dependent dielectric functions for Au, Al2O3, and Bi2Se3 obtained by ellipsometry. (c) Schematic of the MEMS made of Al2O3 covered with an Au or Bi2Se3 layer.
Figure 1.
(a) Dielectric functions at imaginary frequency for Au, Al2O3, and Bi2Se3. (b) Imaginary part of the frequency-dependent dielectric functions for Au, Al2O3, and Bi2Se3 obtained by ellipsometry. (c) Schematic of the MEMS made of Al2O3 covered with an Au or Bi2Se3 layer.

Figure 2.
Bifurcation diagrams vs. (=z/d) for different interacting materials. The initial distance d between the plates is (a) 250 nm, (b) 500 nm, and (c) 1000 nm. The dashed and solid lines represent the unstable and stable equilibrium points, respectively.
Figure 2.
Bifurcation diagrams vs. (=z/d) for different interacting materials. The initial distance d between the plates is (a) 250 nm, (b) 500 nm, and (c) 1000 nm. The dashed and solid lines represent the unstable and stable equilibrium points, respectively.

Figure 3.
Contour plots of the transient times to stiction in the phase plane vs. for systems made of several pairs of interacting materials. The initial distance between the plates is indicated in the plots. Here, we considered for d = 250 nm and for d = 1000 nm. For the calculations, we used 150 × 150 initial conditions (). The red (elliptical in shape central area) region surrounded by the homoclinic orbit contains the initial conditions that lead to stable oscillations.

Figure 4.
Ratio of the stable area of actuation between different systems (Au-Au and Au-TI) and the TI-TI system vs. initial separation distance for the extrapolations at low frequencies for Au via the Drude (D) and Plasma (P) models. For the calculations, we considered .
Figure 4.
Ratio of the stable area of actuation between different systems (Au-Au and Au-TI) and the TI-TI system vs. initial separation distance for the extrapolations at low frequencies for Au via the Drude (D) and Plasma (P) models. For the calculations, we considered .

Figure 5.
Threshold curve vs. driving frequency (with the natural frequency of the system). The area below the curve defines the condition that can possibly lead to chaotic motion. The values of and the initial distances d considered here were (a) and d = 250 nm and (b) and d = .
Figure 5.
Threshold curve vs. driving frequency (with the natural frequency of the system). The area below the curve defines the condition that can possibly lead to chaotic motion. The values of and the initial distances d considered here were (a) and d = 250 nm and (b) and d = .

Figure 6.
Contour plot of the transient times to stiction in the phase plane vs. for Scheme 250. nm, , = 0.5, and . For the calculations, we used 150 × 150 initial conditions (). The stable actuation (red) region increased significantly from Au-Au to TI-TI systems.
Figure 6.
Contour plot of the transient times to stiction in the phase plane vs. for Scheme 250. nm, , = 0.5, and . For the calculations, we used 150 × 150 initial conditions (). The stable actuation (red) region increased significantly from Au-Au to TI-TI systems.

Figure 7.
Contour plot of the transient times to stiction in the phase plane vs. for systems made of different pairs of materials. The initial distance be 1000 nm, = 0.5, and . The parameter is indicated in the plots for both columns. For the calculations, we used 150 × 150 initial conditions ().
Figure 7.
Contour plot of the transient times to stiction in the phase plane vs. for systems made of different pairs of materials. The initial distance be 1000 nm, = 0.5, and . The parameter is indicated in the plots for both columns. For the calculations, we used 150 × 150 initial conditions ().

Publisher’s Note: MDPI stays neutral with regard to jurisdictional claims in published maps and institutional affiliations. |
© 2021 by the authors. Licensee MDPI, Basel, Switzerland. This article is an open access article distributed under the terms and conditions of the Creative Commons Attribution (CC BY) license (https://creativecommons.org/licenses/by/4.0/).
Share and Cite
MDPI and ACS Style
Tajik, F.; Babamahdi, Z.; Sedighi, M.; Palasantzas, G. Nonlinear Actuation of Casimir Oscillators toward Chaos: Comparison of Topological Insulators and Metals. Universe 2021, 7, 123. https://doi.org/10.3390/universe7050123
AMA Style
Tajik F, Babamahdi Z, Sedighi M, Palasantzas G. Nonlinear Actuation of Casimir Oscillators toward Chaos: Comparison of Topological Insulators and Metals. Universe. 2021; 7(5):123. https://doi.org/10.3390/universe7050123
Chicago/Turabian StyleTajik, Fatemeh, Zahra Babamahdi, Mehdi Sedighi, and George Palasantzas. 2021. "Nonlinear Actuation of Casimir Oscillators toward Chaos: Comparison of Topological Insulators and Metals" Universe 7, no. 5: 123. https://doi.org/10.3390/universe7050123
Note that from the first issue of 2016, this journal uses article numbers instead of page numbers. See further details here.