
Distribution of Uranium Isotopes in Sandy Deposits by Sequential Extraction


N. Laverov Federal Center for Integrated Arctic Research of Russian Academy of Sciences, 23 Severnoy Dviny Emb., 163061 Arkhangelsk, Russia
*
Author to whom correspondence should be addressed.
Minerals 2021, 11(5), 467; https://doi.org/10.3390/min11050467
Submission received: 24 March 2021
/
Revised: 27 April 2021
/
Accepted: 27 April 2021
/
Published: 29 April 2021
(This article belongs to the Special Issue Uranium in Sedimentary Basins: Migration and Concentration)
Abstract
:The sequential extraction procedure is used to reconstruct the processes of redistribution of uranium isotopes in the mineral phases of the aquifer of the Vendian sandy-argillaceous deposits developed in the coastal territory of the European North of Russia. This aquifer has large resources of drinking and mineral groundwater which, however, are used in extremely limited quantities. This is due to the very complex nature of the hydrochemical conditions, and uranium-isotopic methods are used to clarify these conditions. The following mineral phases of core samples were characterized: adsorbed trace materials and carbonate minerals; ferrihydrate, amorphous minerals of Fe, Al and Si, and secondary U minerals; crystalline iron minerals; clay and some refractory minerals; and all remaining resistant minerals. The most resistant minerals, whose fraction ranges from 70.58 to 96.4%, have a minimum average uranium concentration of 0.47 ppm. This uranium is practically conserved in the rock, as a result of which the average ratio of its 234U:238U isotopes is close to equilibrium. In the remaining fractions, uranium is redistributed by groundwater along their flow lines from recharge areas in watersheds to areas of discharge into river valleys. Its maximum concentration (12.89 ppm) measurement is carried out by coprecipitation with iron hydroxides, then the uranium is adsorbed and precipitated with carbonates (9.14 ppm). The average 234U:238U is maximum in adsorbed trace materials and carbonate minerals (2.39 ± 0.36) and is close to that in fresh groundwater (2.8 ± 0.42). It is also increased in the amorphous minerals of Fe (1.53 ± 0.23). In general, there is a dependence of the 234U:238U activity ratio in rock on the degree of participation of groundwater in the deposition of hydrogenic uranium isotopes into the cracks and pores of these rocks. The results obtained contribute to the refinement of such a parameter as the retardation factor, which is necessary for understanding the processes of migration and concentration of uranium in sedimentary basins.
1. Introduction
The average uranium content in sedimentary rocks, such as clays, sandstones, and carbonates, ranges from 0.45 ppm to 3.7 ppm [1], but it is very actively redistributed in these partially permeable deposits in strictly defined directions and forms large roll-front accumulations on geochemical barriers. For example, the average ore grade of the Moinkum deposit complex is 0.06%U (600 ppm) [2,3,4,5]. Water is the main carrier of uranium, and it is always radioactive to some extent. Therefore, information on the distribution, migration, and concentration of uranium in sedimentary deposits is used when searching for its deposits and for assessing the chemical and radiological aspects of the negative impact on terrestrial inhabitants [6,7,8,9,10]. In addition, thanks to the discovery of uranium isotopic fractionation, uranium isotopes are actively used as indicators of geological, hydrogeological, and geoecological processes [11,12,13,14,15,16].
To analyze the processes that control the distribution of nuclides in sedimentary basins, complex mathematical models have been developed using molar concentrations and activity of nuclides in groundwater and host rocks [17,18,19,20,21,22,23,24,25]; however, information on the distribution of uranium isotopes in the rock is obtained mainly by the method of its total digestion. At the same time, the host rocks of sedimentary basins are characterized by a heterogeneous mineralogical composition and contrasting differences in the physicochemical properties of mineral formations, which determine the different migration abilities of uranium isotopes. There is no doubt that the procedure for sequential extraction of uranium isotopes from mineral phases with reagents of different strengths [26,27,28,29,30,31] gives a more informative picture of the redistribution of uranium isotopes in the water–rock system.
In our previous works, we presented the results of studying the migration of uranium isotopes, the activity of which was determined by the methods of total digestion [32] and the procedure of partial extraction [33]. Therefore, in this work, an attempt is made to use the sequential extraction method to reconstruct the processes of redistribution of uranium isotopes in individual mineral phases of the aquifer of the Vendian sandy-argillaceous deposits, widespread in the coastal territory of the European North of Russia. This aquifer has large resources of groundwater, but they are used in extremely limited quantities, because the hydrochemical conditions in the aquifer are very complex and are associated with salinization by sea waters of modern and ancient transgressions [34] and an increase in the concentration of uranium in certain areas [35].
2. Materials and Methods
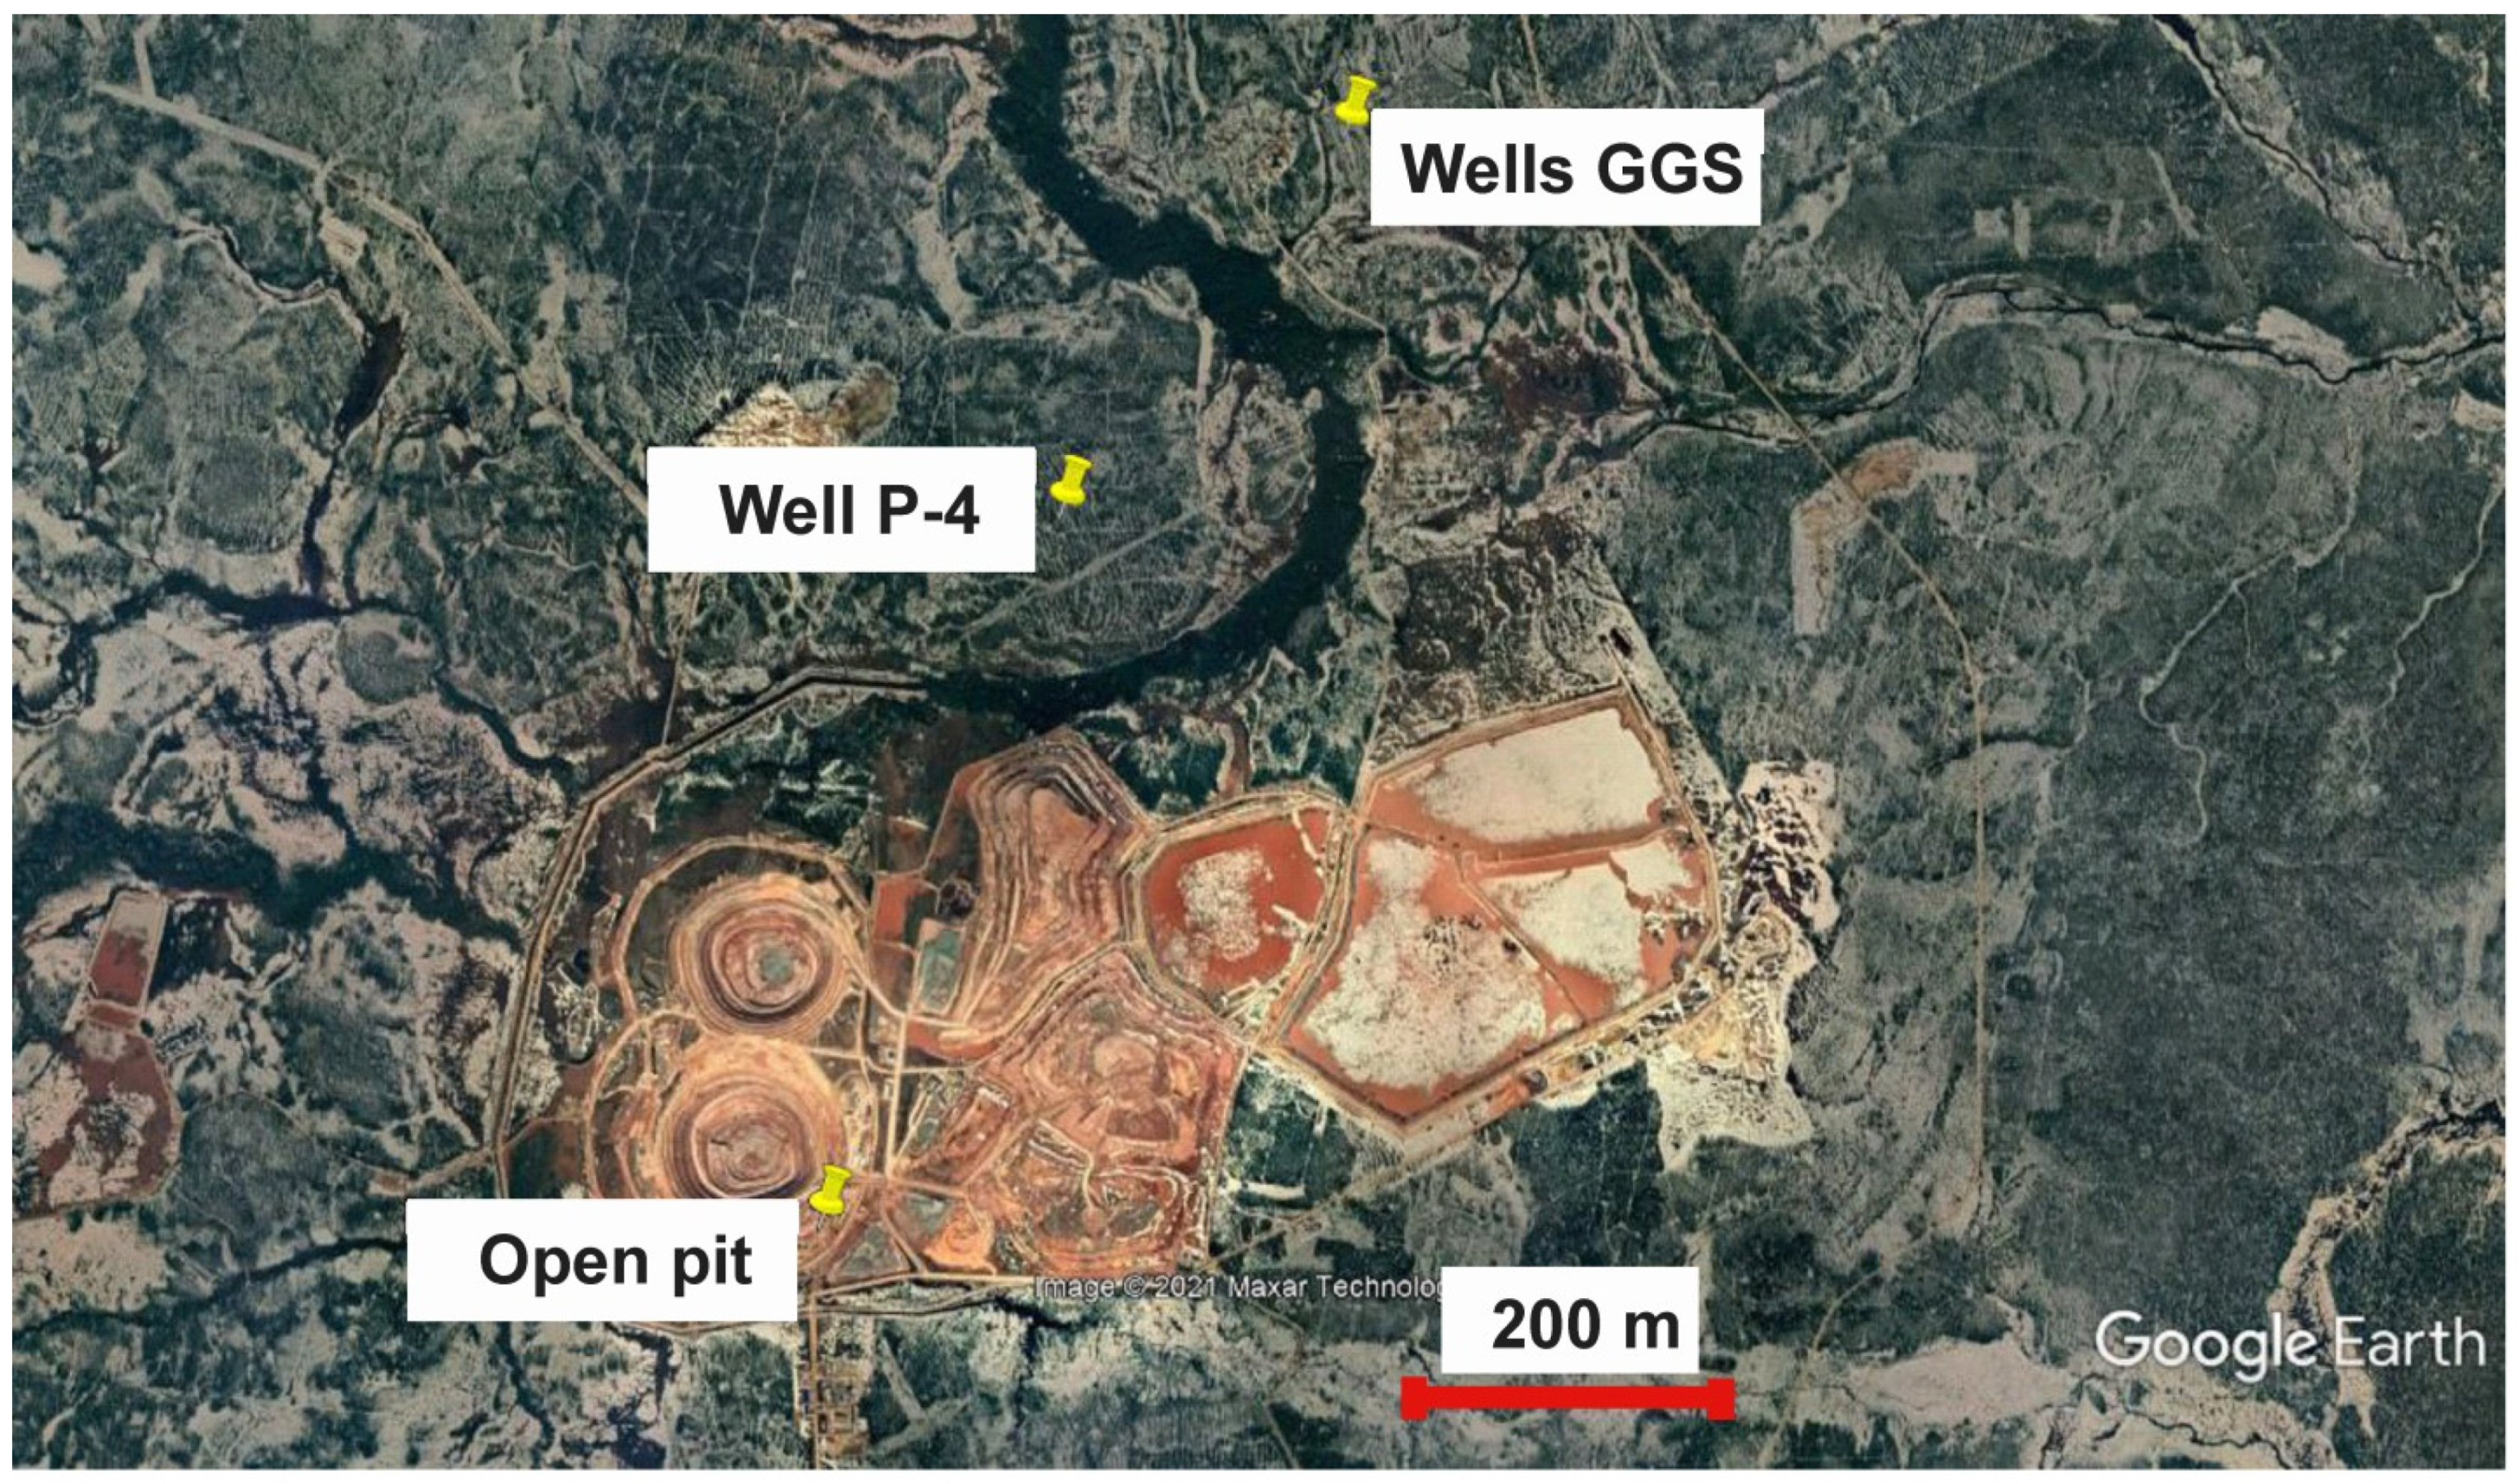
The boreholes GGS2-10 and GGS2-11 are located 100 km north of the city of Arkhangelsk in northwestern Russia in the area with coordinates N65°20′48″ E41°06′10″ and were drilled using a diamond drill bit (92 mm inner diameter, 112 mm outer diameter) and mud rotary methods to 102 m and 101.2 m, respectively below the ground surface in May–July 2018. Five samples were taken from each boreholes to perform sequential extraction. In addition, 15 samples were taken from the diamond deposit, including 5 core samples from the hydrogeological well P-4 (N65°19′28″ E41°01′48″) and 10 samples from the walls of the kimberlite pipe open pit (N65°17′14″ E41°01′48″) (Figure 1) to perform partial extraction. Samples were taken from objects available for sampling: wells being drilled along Vendian sandy-argillaceous sediments and a deepening open pit to a freshwater circulation depth of about 200 m. The sampling interval in the wells was approximately 10 m. The samples were quickly packed in airtight polythene bags. The sample mass collected in each case was about 1500 g. Then, 500 g sub-samples of the material were oven dried at 40 °C for 7 days and homogenized by grinding with an agate mortar and pestle to pass through a 125 μm sieve in a glove box with nitrogen. The prepared material was stored in glass bottles for sequential and partial extractions and isotopic analyses.
The chemical composition and the mineralogical composition of the Vendian sediments in the area of the diamond deposit were studied in detail during different periods of geological exploration and have been described in the article by Malov and Zykov [33]. The deposits are mainly composed of sandstones (60–80%) and siltstones (20–30%), separated by interlayers of mudstones. Clastic material is 70–80%, represented by quartz and feldspar grains. Biotite and clay aggregates are insignificant. Cement has a predominantly clay-ferruginous composition and there are also carbonate and gypsum cements. Clay minerals are represented by illite, kaolinite and chlorite. The ratio of Fe2O3 and FeO forms of iron in siltstones is ~(6 ÷ 17):1.
The description of the samples of the studied rocks was performed on five thin sections of core samples. The mineral phases were examined using X-ray powder diffraction (XRD) analysis and scanning electron microscopy (SEM) at the Laboratory of Mineralogy of Ore Genesis, Institute of Mineralogy, Ural Branch of RAS, Russia (Miass, Russia) (see Appendix A).
2.1. Sequential Extractions
About 500 g of rock sample was crushed using an agate mortar and pestle to pass through a 125 μm sieve and 20 g of the prepared material was sequentially treated by extraction solutions in accordance with Yanaze et al. [26]. At the end of each extraction step, the suspended solution was separated by a combination of centrifugation and fil, tration using a 0.45 μm Millipore filter. The residue in the centrifuge tube was washed with 10 mL of each extraction solution and passed through the filter. The combined residue was washed with 10 mL of distilled water, then dried and treated by the next extraction solution [26]. The sequential extraction procedures are described hereinafter.
2.1.1. Fraction 1. Adsorbed Trace Materials and Carbonate Minerals
The sample of mass 20 g was shaken with 100 mL of Morgan’s solution (1 Μ sodium acetate adjusted at pH 5.0 by acetic acid) at room temperature for 4 h.
2.1.2. Fraction 2. Ferrihydrate, Amorphous Minerals of Fe, Al, and Si, and Secondary U Minerals
The residue on the filter from fraction 1 was shaken with 100 mL of Tamm’s solution (10.9 g/L oxalic acid + 16.1 g/L ammonium oxalate) in the dark at room temperature for 4 h.
2.1.3. Fraction 3. Crystalline Iron Minerals
The residue from fraction 2 was stirred with 100 mL of CDB solution (1 g sodium dithionite and 60 mL of 0.3 Μ trisodium citrate +0.2 Μ sodium hydrogen carbonate) at 85 °C for 30 min. The extraction was repeated, then the extractions were combined and boiled with nitric and hydrochloric acid until the solution became transparent and this avoided precipitation of sulfides.
2.1.4. Fraction 4. Clay and Some Refractory Minerals
The residue on the filter from fraction 3 was stirred with 100 mL of 6 Μ HCl at 85 °C for 2 h.
2.2. Measurements of Uranium Isotopes after Sequential Extractions and in Fraction 5. All Remaining Resistant Minerals
The analytical procedure for the extracted uranium isotopes after Sequential Extractions and in the resulting solutions was similar to the method used in a previous study by Malov and Zykov [33]. Spectrometric detection of alpha particles was performed using an alpha spectrometer (PROGRESS-ALPHA, DOZE, Russia) with an uncertainty of 10–15%. Total error of analysis is defined by δ = δst + δsys (statistical + systematic), measurement of uncertainties for U are reported individually, and efficiency of 232U extraction was 40–50%.
2.3. Partial Extraction of Adsorbed Trace Materials
A volume of 200 mL of low mineralized fresh natural groundwater of Ca-Mg-Na-HCO3 composition taken from the borehole 3u had total dissolved solids (TDS) of 285 mg/L (see [34]) and was mixed with 20 g of the prepared material in centrifuge tubes and shaken for 1 h on an end-over-end shaker. The boundary conditions when using low-mineralized fresh natural groundwater were as follows: temperature 20 °C, pH 7.7 and redox potential of 230 mV. First, adsorbed material was released. Measurements of uranium isotopes were carried out in the same way as described above in Section 2.2.
The uranium concentration in water taken from borehole 3u was 0.25 ± 0.005 ppb [34]. The 200 mL of water, which was mixed with 20 g of crushed material, contained 0.05 ± 0.001 μg of uranium; this concentration was subtracted from the concentration obtained after partial extraction of adsorbed trace materials.
3. Results
Table 1 shows the results of five sequential extractions of the ten core samples.
3.1. Substance Dissolution
As can be seen from Table 1, Morgan’s solution dissolves from 0.77% to 2.52% (on average 1.62%) of the sample substance; Tamm’s solution dissolves from 0.13% to 4.31% (on average 2.03%) of the sample substance; CDB solution dissolves from 0.12% to 10.2% (on average 3.13%) of the sample substance; 6 Μ HCl dissolves from 0.6% to 9.4% (on average 3.21%) of the sample substance. In general, these four fractions range from 2.65% to 17.79%, with a weighted average of 10 percent. The bulk is from 70.58% to 96.4% (on average 84.59%) of the sample substance is dissolved only by a mixture of hydrofluoric, perchloric, and nitric acids.
Experiments on the partial extraction of adsorbed trace materials showed that water dissolved from 0.51% to 2.12% (on average 1.2%) of the sample substance (Table 2), that is, carbonate minerals make up only about 0.42% of the sample substance. This is consistent with the results of visual examination of the thin sections of core samples [33]. There are spots, lenses (no more than 0.4–0.5 mm in size) with limonite-goethite and ferruginous-carbonate cement. Carbonate is represented by calcite and is formed later than the limonite-goethite aggregate. Individual detrital grains are partially replaced by ferruginous carbonate aggregate. No carbonate phases were detected in these samples by XRD and SEM (see Appendix A), however significant levels of bicarbonate (3–5 mmol) are present in the contacting groundwater [34] from which carbonate is deposited (see Section 3.2).
The effectiveness of Tamm and CDB solutions for dissolving amorphous minerals and ferrihydrite and crystalline iron minerals, respectively, is supported by Yanaze et al. [26] with references to Tamm [36], Chao, Zhou [37], Mehra, Jackson [38], Airey et al. [39], Lowson et al. [27].
According to the chemical analyses, the content of Fe2O3 in the rocks is 2–5.3% [33]. XRD analysis showed the presence of hematite and amorphous iron oxides up to 18% in one of the samples. This is consistent with the data given in Table 1 for dissolution of 0.25 to 11.9% rocks with Tamm and CDB solutions.
The content of feldspar and clay from 6 to 18% (see Appendix A) is consistent with the data given in Table 1 about the dissolution by six molar hydrochloric acid from 0.6 to 9.4% of rocks. Remaining resistant minerals are the quartz, mica and most resistant clay ([26], Appendix A).
3.2. Uranium Concentration
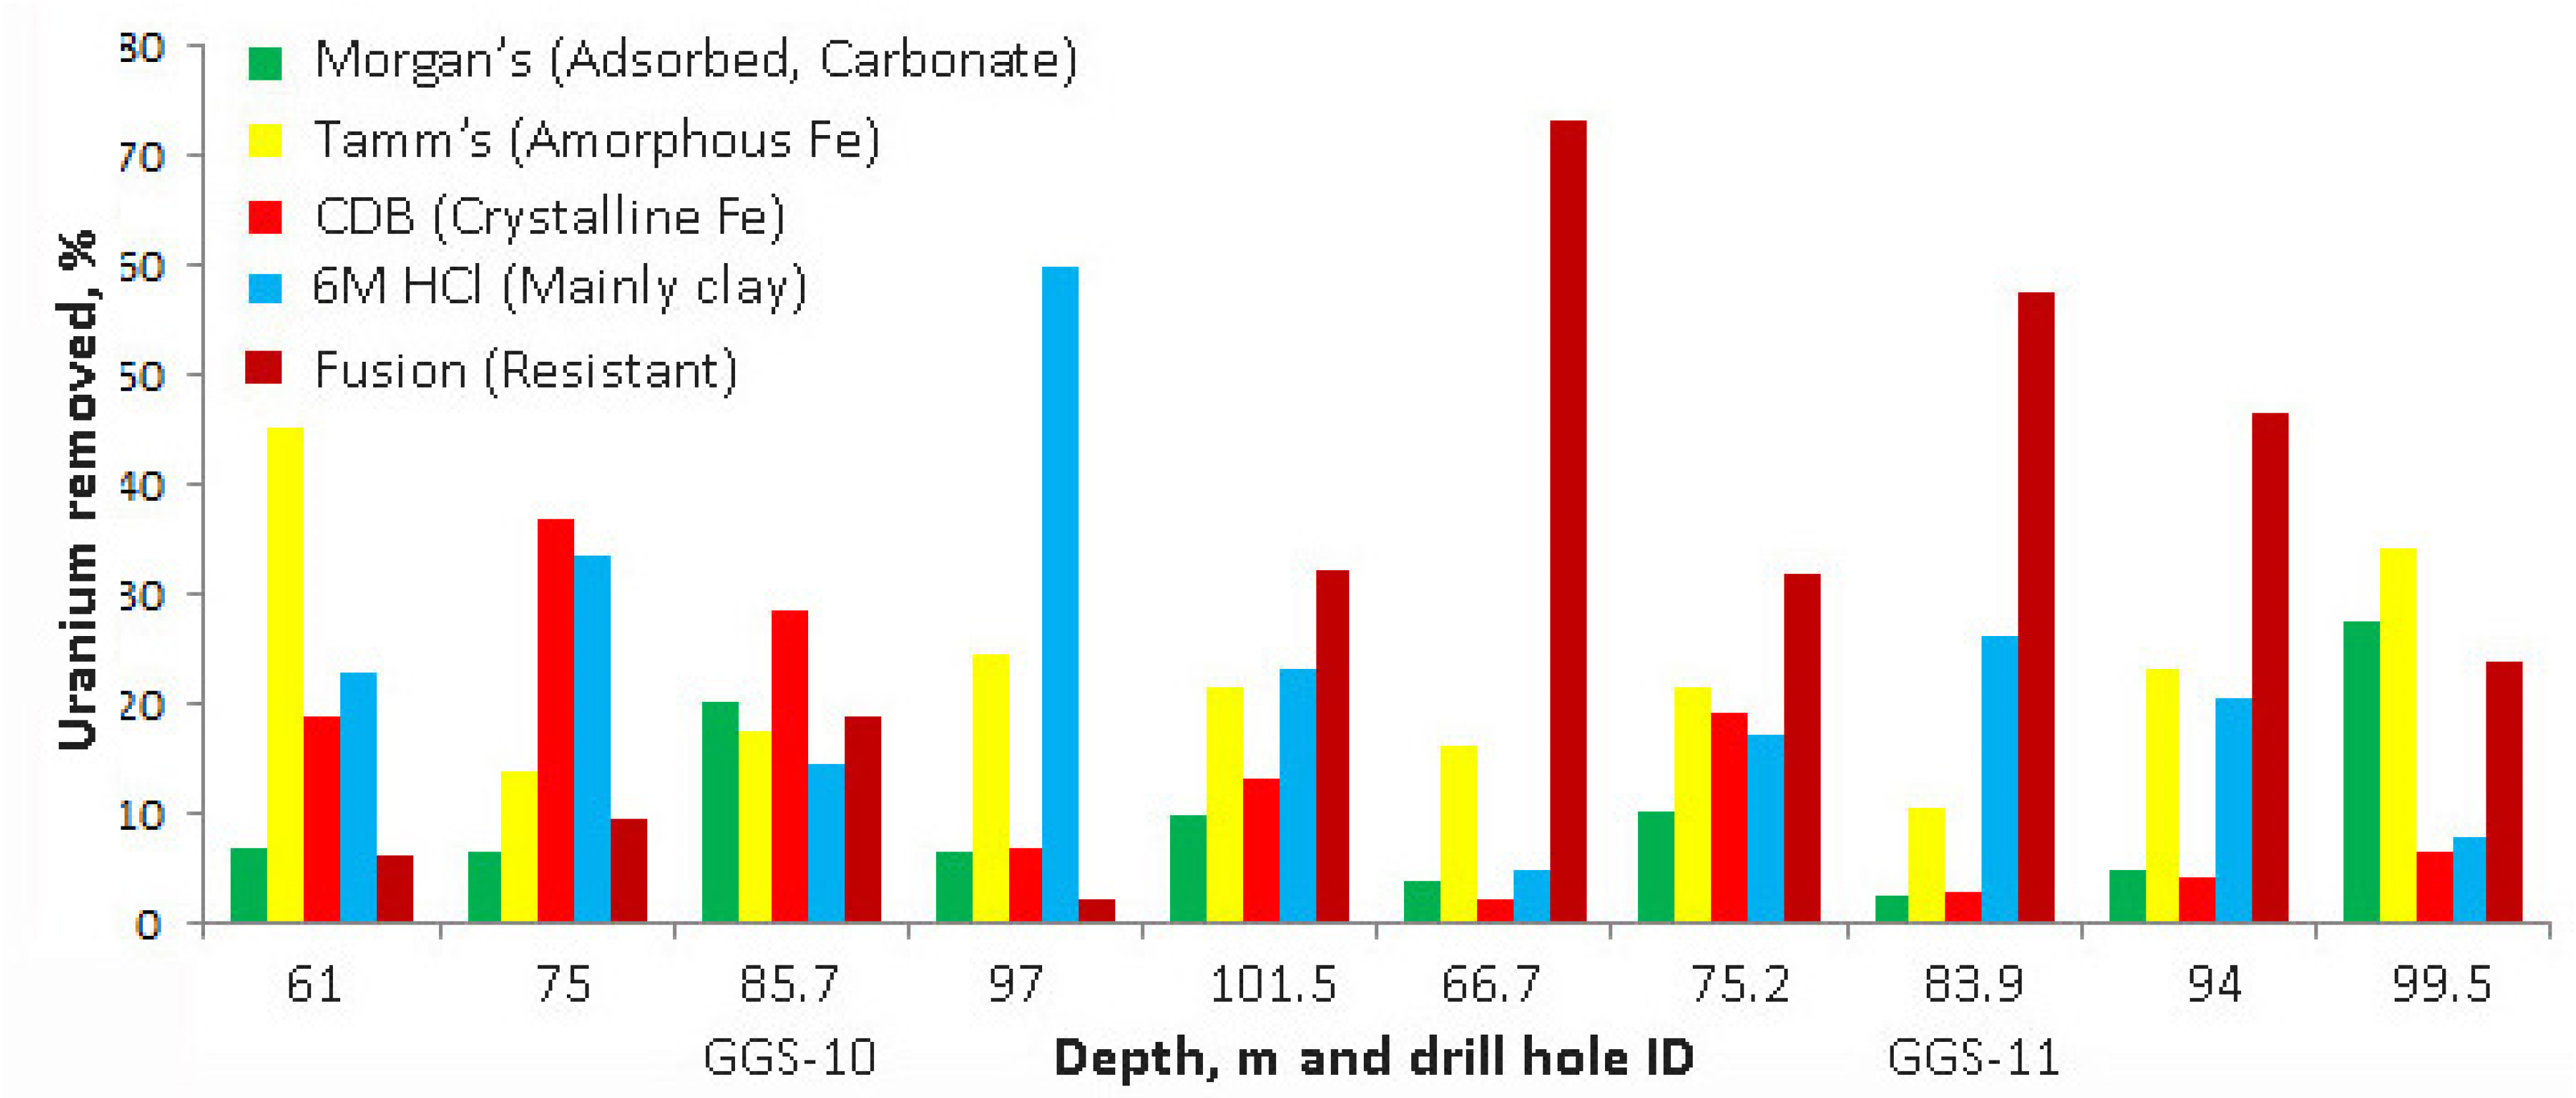
The adsorbed trace materials and carbonate minerals contain from 2.5% to 27.4% (on average 9.72%) of the total uranium content in the rock (Table 1, Figure 2), while the adsorbed trace materials contain from 0.6% to 24.9% (on average 6.1%) of the total uranium content in the rock (Table 2). That is, about one third of easily recoverable uranium is coprecipitated with carbonates. Analysis of the evolution of the composition of groundwater in the study area [34] showed that the composition of Ca-Mg-HCO3 is typical for the least saline waters with a total dissolved solids content (TDS) of up to 0.3 g·L−1. This is due to the undersaturation of atmospheric precipitation, melted snow water and the least saline groundwater in relation to calcite. There is an almost 100% correlation between (Ca + Mg) and HCO3. However, as the TDS increases to 0.6–0.9 g·L−1, the deficiency of Ca and Mg in groundwater increases. This is due to their saturation with calcite and dolomite and partial precipitation of calcium carbonates.
Ferrihydrate, amorphous minerals of Fe, Al, and Si, and secondary U minerals contain from 9% to 45.1% (on average 21.6%) of the total uranium content in the rock (Table 1, Figure 2). Thermodynamic numerical simulations were carried out to determine the principal migration species of U in groundwater and the saturation of certain water samples with uranophane suggests that this mineral is of secondary genesis [40].
Crystalline iron minerals contain from 2.2% to 36.8% (on average 13.12%) of the total uranium content in the rock. Clay and some refractory minerals contain from 4.8% to 59.8% (on average 23.21%) of the total uranium content in the rock. All remaining resistant minerals contain from 2.1% to 73.1% (on average 32.35%) of the total uranium content in the rock (Table 1, Figure 2).
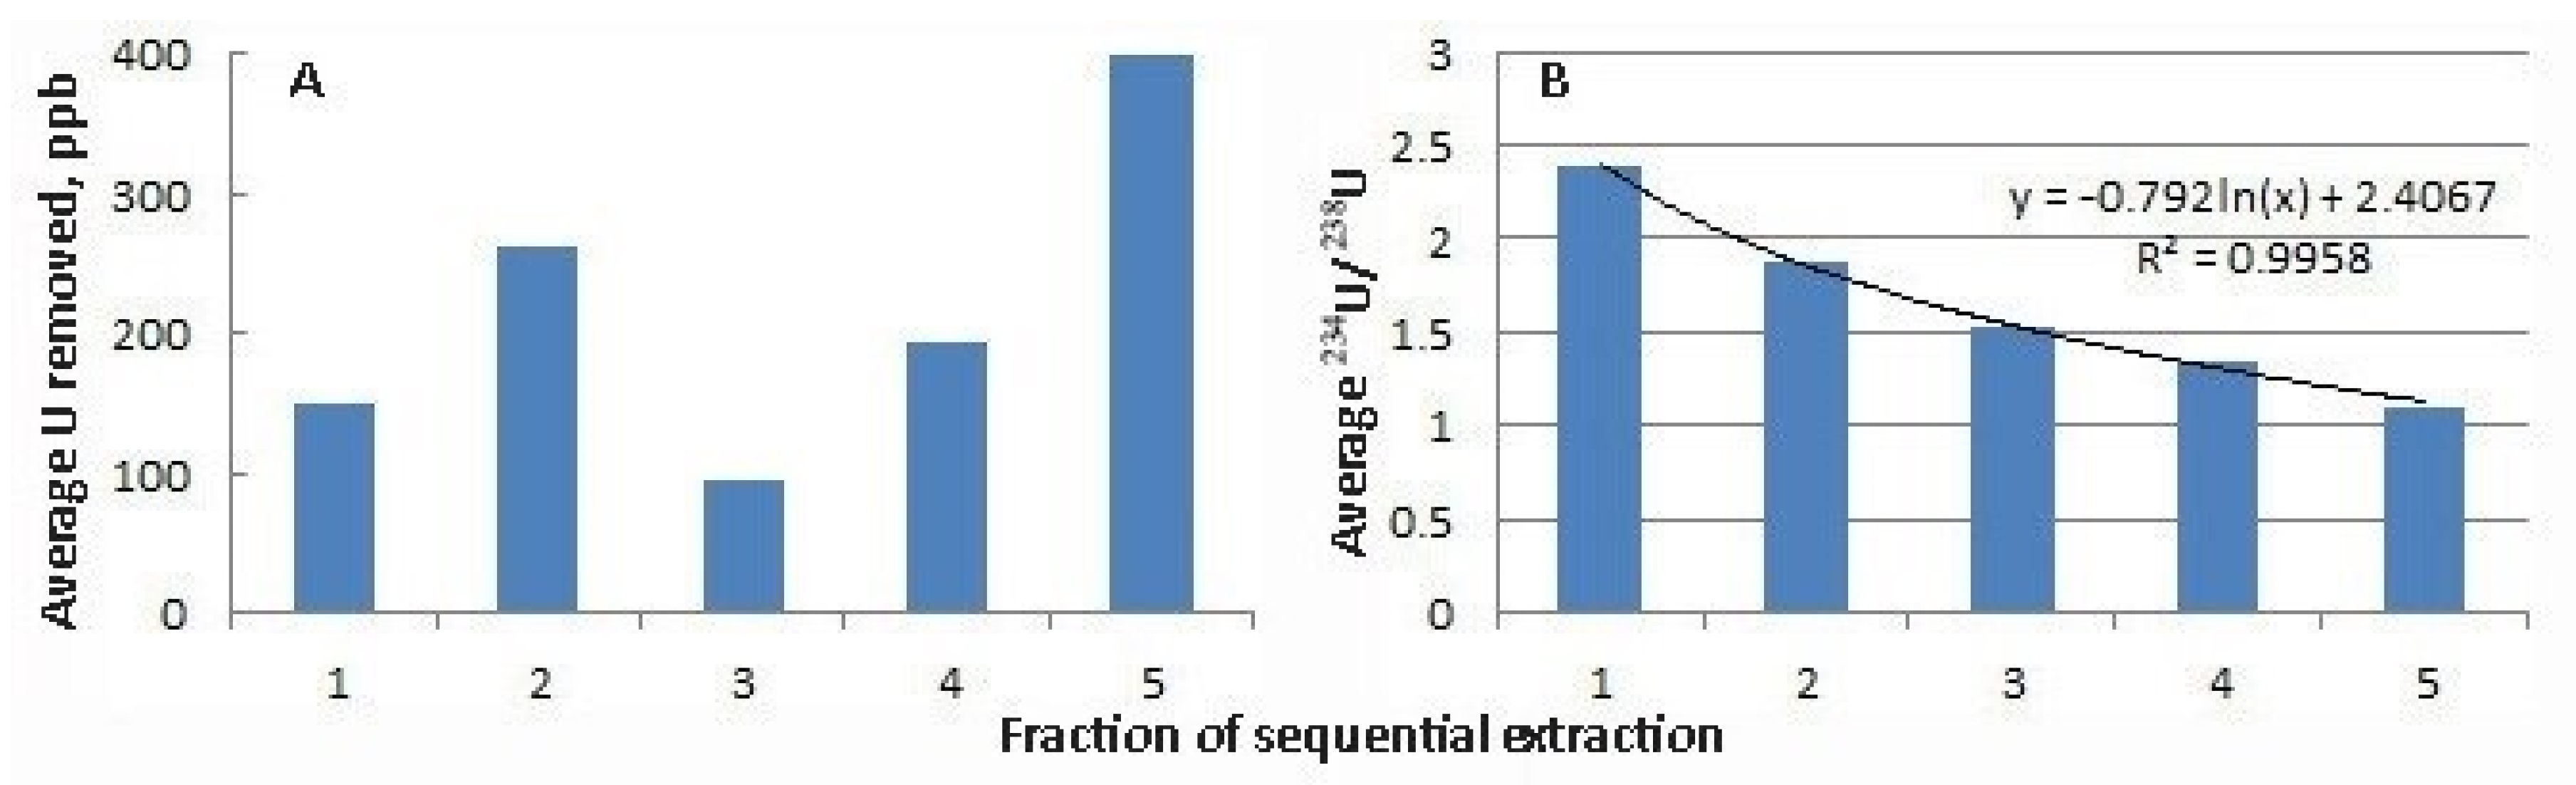
The average weight distribution of uranium in extracted phases differs slightly from its percentage distribution (Table 1, Figure 3A): a minimum uranium content of 95 ± 14 ppb is typical for crystalline iron minerals.
In other fractions, the weight distribution of uranium is similar to its percentage distribution: the maximum value is observed in the most resistant minerals (398 ± 60 ppb), followed by amorphous minerals of Fe (263 ± 39 ppb), clay and some refractory minerals (193 ± 29 ppb), and adsorbed trace materials and carbonate minerals (149 ± 22 ppb) (Figure 3A).
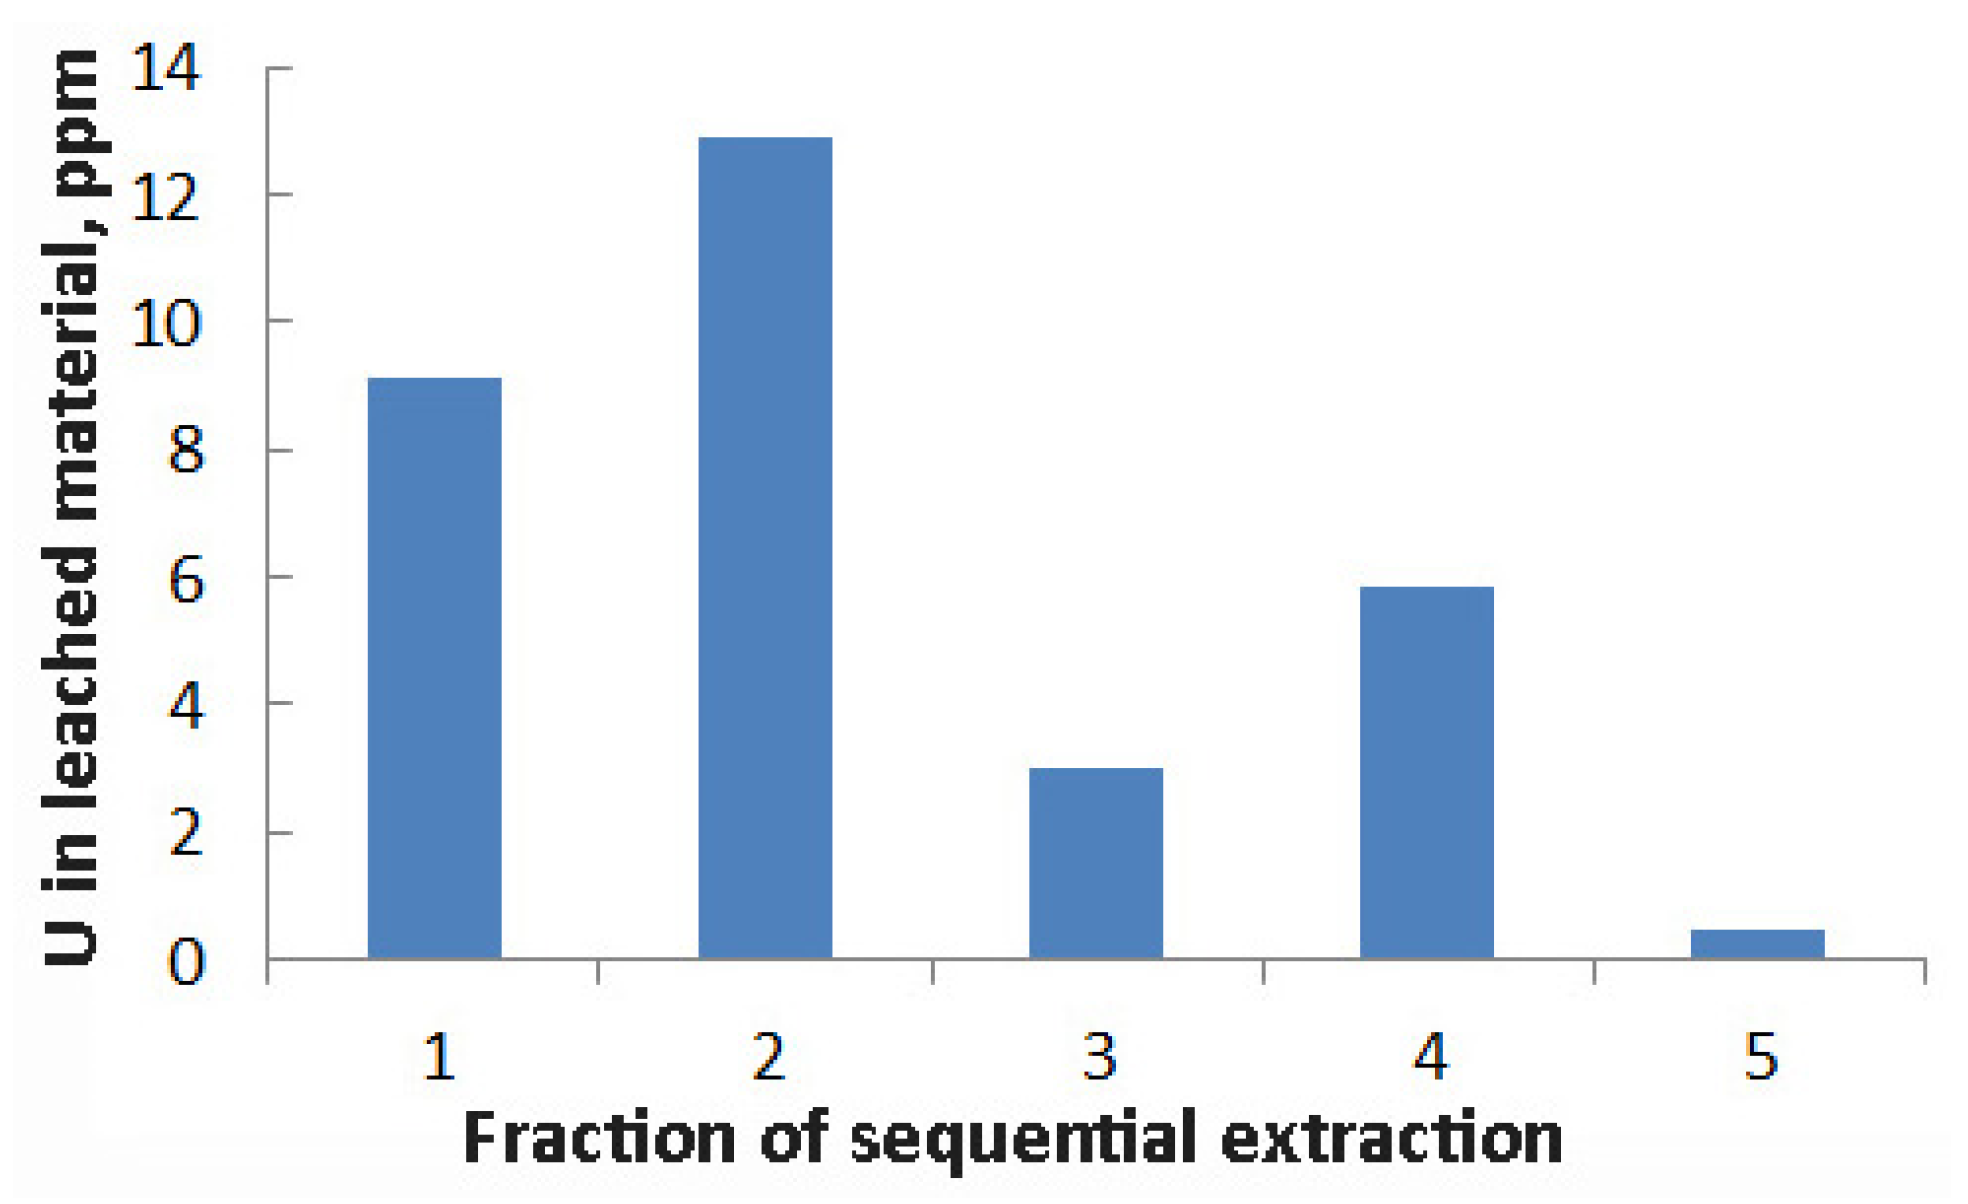
At the same time, the maximum content of uranium in the most resistant minerals is explained only by the maximum mass of this fraction, which averages about 85% of the total mass of samples (see Table 1). The concentration of uranium directly in the dissolved substance (leached material) is at a maximum in amorphous minerals of Fe (12.89 ppm), then adsorbed trace materials and carbonate minerals (9.14 ppm), clay and some refractory minerals (5.88 ppm), crystalline iron minerals (3.01 ppm), and most resistant minerals (0.47 ppm) (see Figure 4). It is also noteworthy that the average concentration of uranium in adsorbed trace materials was 7.7 ppm according to Table 2, that is, about 1.4 ppm remains in carbonate minerals.
3.3. Uranium Isotopes 234U:238U Activity Ratio
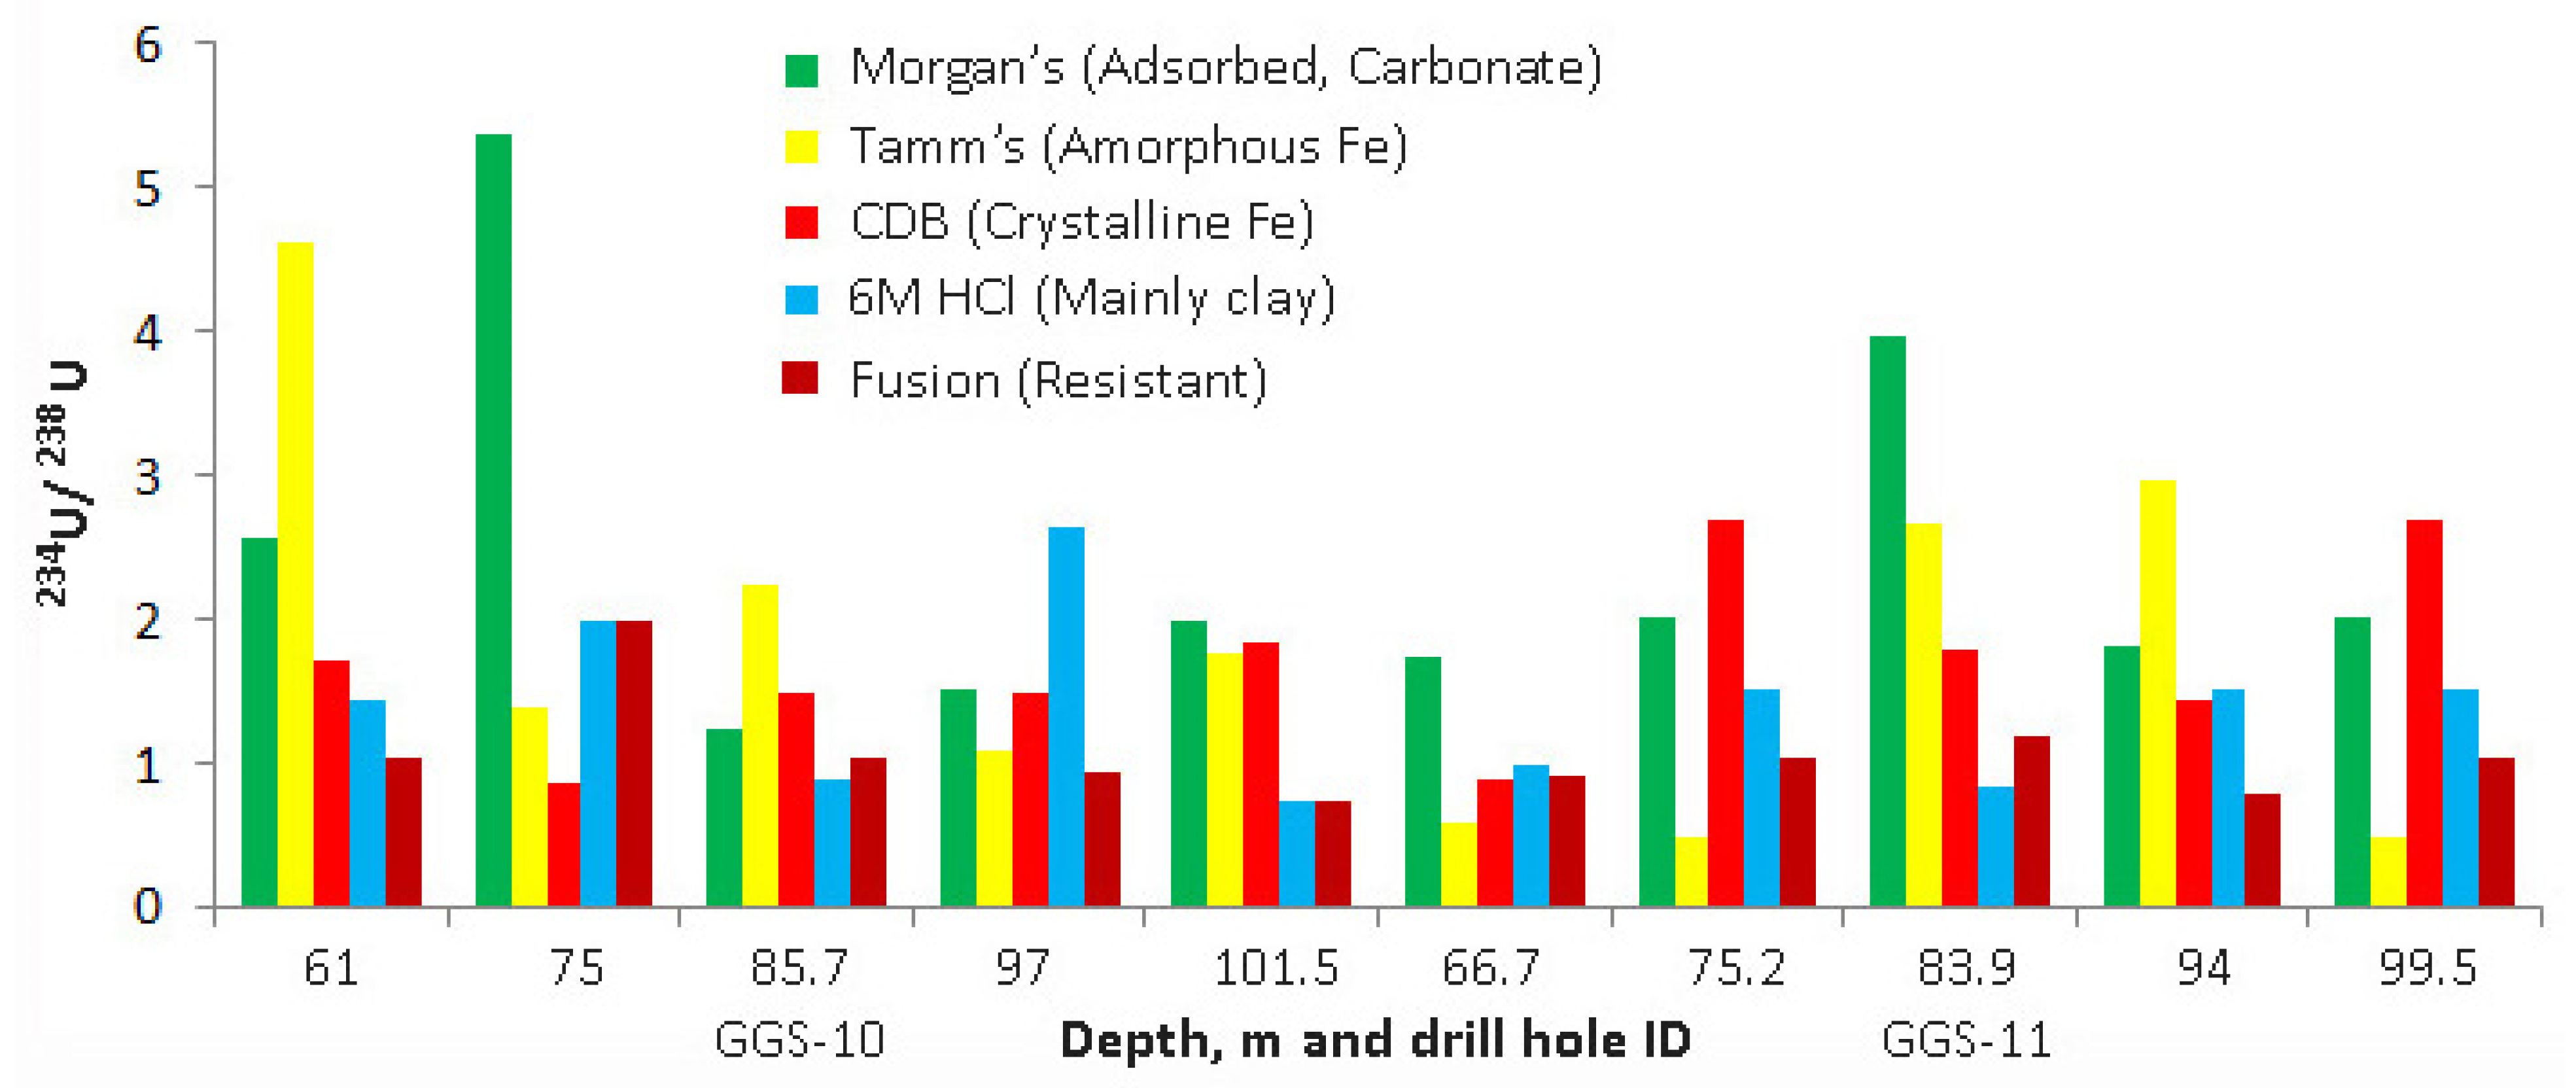
For adsorbed trace materials leached from rocks by partial extraction, the values of the uranium isotopes 234U:238U activity ratio vary from 1.44 ± 0.21 to 4.25 ± 0.64, average 2.2 ± 0.32 (Table 2). In adsorbed trace materials and carbonate minerals leached from rocks by sequential extraction, they vary from 1.25 ± 0.19 to 5.36 ± 0.8, average 2.39 ± 0.36 (Table 1, Figure 5).
For ferrihydrate, amorphous minerals of Fe, Al, and Si, and secondary U minerals leached from rocks by sequential extraction, the values of the uranium isotopes 234U:238U activity ratio vary from 0.49 ± 0.07 to 4.63 ± 0.7, average 1.88 ± 0.28. In crystalline iron minerals, they vary from 0.86 ± 0.13 to 2.68 ± 0.4, mean 1.53 ± 0.23. For clay and some refractory minerals, the values of the uranium isotopes 234U:238U activity ratio vary from 0.73 ± 0.11 to 2.64 ± 0.39, average 1.35 ± 0.2. In all remaining resistant minerals, they range from 0.73 ± 0.11 to 1.26 ± 0.19, mean 1.09 ± 0.16 (Table 1, Figure 5).
4. Discussion
In general, the distribution of uranium concentrations in various mineral associations of Vendian sedimentary rocks is rather uneven and as shown in previous works [32,33], this unevenness is mainly associated with the presence of relics of green-colored deposits, which were under reducing conditions for a long period of time. The significantly higher uranium content in them compared to red-colored siltstones indicates a significant variability in the values of the permeability of the aquifer, as a result of which they were located far from the groundwater filtration paths and retained uranium. The content of such rocks is approximately 20% according to Malov [32], in this study it is 25% according to Table 2 and 10% according to Table 1. It seems that in such a situation the maximum information content will be achieved as the number of analyzed samples increases. Figure 3 and Figure 4 show the results of fifty extractions and demonstrate quite clearly, in our opinion, manifested regularities of uranium concentration in sedimentary sandy-clayey sediments interacting with groundwater filtering through them.
In the most resistant minerals, such as hardly soluble aluminosilicates and a clay/quartz resistate, the volume of which ranges from 70.58% to 96.4% (an average of 84.59%), the average uranium concentration is 398 ppb per 1 kg of rock and 470 ppb per 1 kg of the most resistant minerals. This uranium is practically sealed in the rock, as a result of which the average ratio of its 234U:238U isotopes is close to equilibrium (1.09) (Figure 3B)
In the remaining fractions, uranium is redistributed by groundwater along their flow lines from recharge areas in watersheds to areas of discharge into river valleys. Its maximum concentration is achieved by coprecipitation with iron hydroxides (263 ppb per 1 kg of rock, but 12890 ppb per 1 kg of the amorphous minerals of Fe), in second place is sorbed uranium and uranium precipitated with carbonates (149 ppb per 1 kg of rock, but 9140 ppb per kg of the adsorbed trace materials and carbonate minerals).
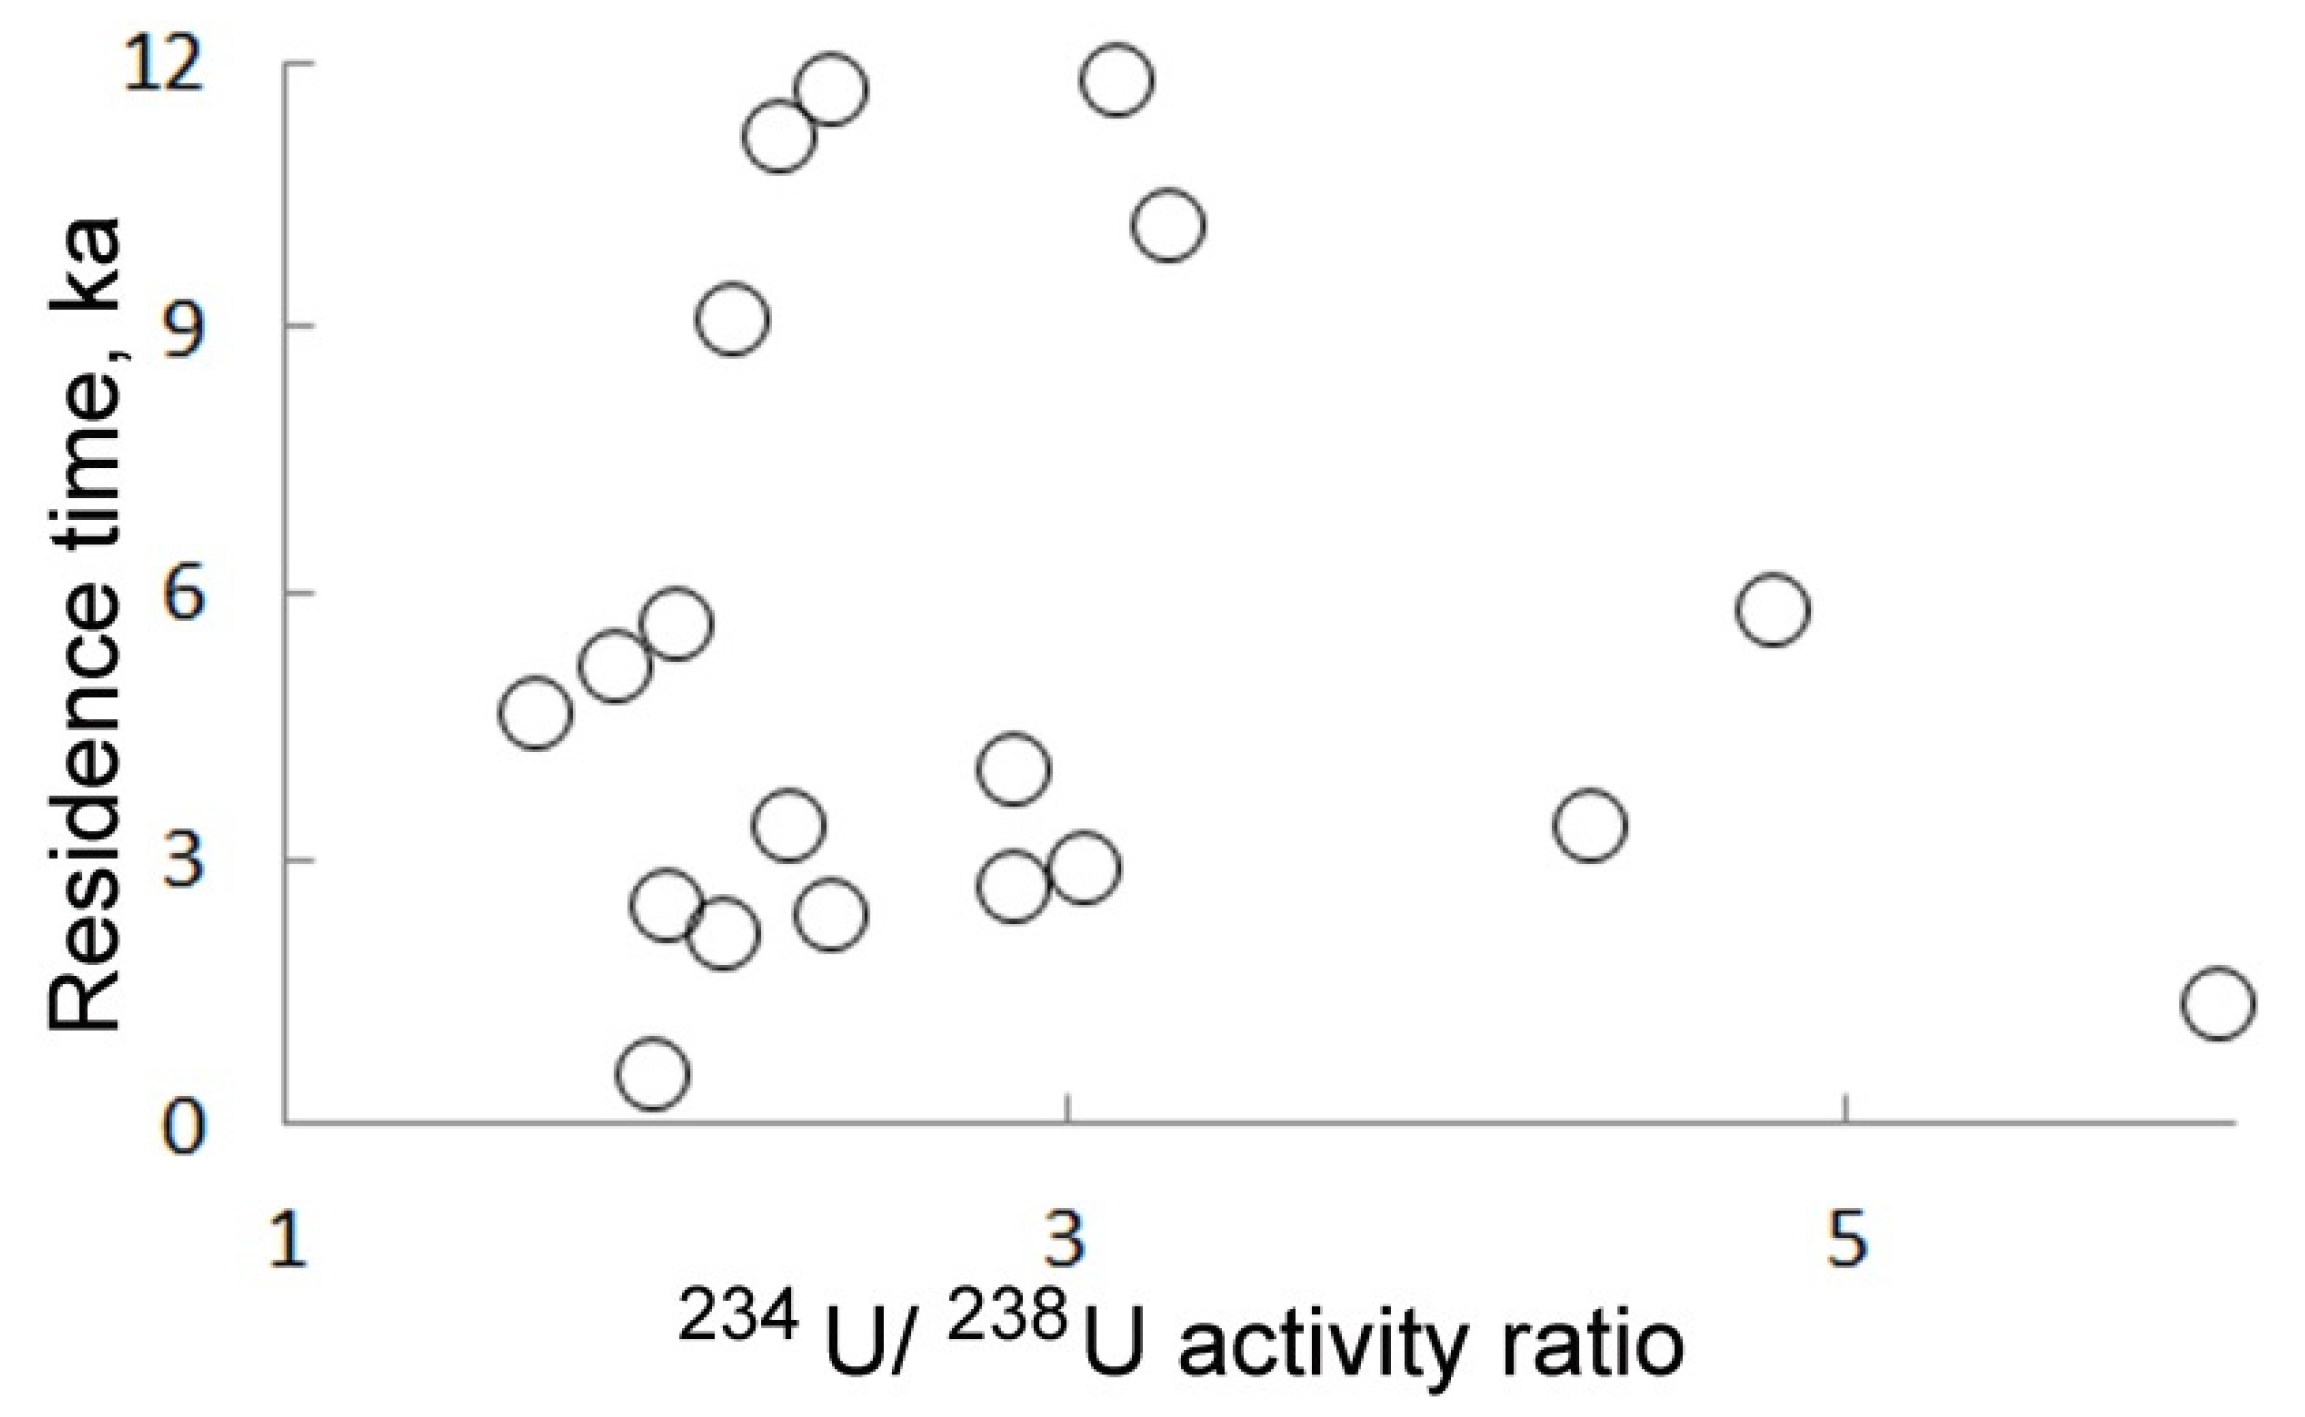
The average value of the activity ratio of uranium isotopes 234U:238U in adsorbed trace materials and carbonate minerals according to sequential extraction data is 2.39 ± 0.36, the maximum values reach (3.98 ± 0.6)—(5.36 ± 0.8) (Table 1). The average value of the activity ratio of uranium isotopes 234U:238U according to partial extraction of adsorbed trace materials from 15 samples looks similar (2.2 ± 0.32). It is no coincidence that the average value of the activity ratio of uranium isotopes 234U:238U in fresh groundwaters of the study area is 2.8 ± 0.42, and the maximum values reach (4.34 ± 0.65)—(5.94 ± 0.84) [34] (see Figure 6), that is, they are on the same level with the 234U:238U values in rocks, but still slightly increased. The average value of the activity ratio of uranium isotopes 234U:238U in the amorphous minerals of Fe is also significantly increased in comparison with the equilibrium value (1.53 ± 0.23).
Overall, Figure 3B actually demonstrates an unexpectedly strong logarithmic dependence of the uranium isotopes 234U:238U activity ratio in rock on the degree of groundwater participation in the deposition of hydrogenic uranium isotopes into the cracks and pores of these rocks. This participation is maximally realized in the processes of sorption of uranium and its precipitation with calcium carbonates and iron hydroxides.
The similarity of the activity ratios of 234U:238U in groundwater and in the most easily leached fractions of water-bearing rocks was noted in the experiments of Lowson et al. [27], Payne et al. [28], and Dabous et al. [29], with the fractions being defined as sorbed elements, carbonate minerals and amorphous iron minerals [26] which could indicate the process which is the transition of nonequilibrium nuclides from water to rock with an increase in the U isotopes activity ratio in the rock [32].
In addition, thermodynamic numerical simulations were carried out to determine the principal migration species of U in groundwater and the saturation of certain water samples with uranophane suggests that this mineral is of secondary genesis [40].
The results obtained contribute to the refinement of such parameters as the retardation factor and the recoil loss factor, which are necessary for understanding the processes of migration and concentration of uranium in sedimentary basins.
5. Conclusions
- (1)
- In this work, an attempt is made to use the sequential extraction method to reconstruct the processes of redistribution of uranium isotopes in individual mineral phases of the aquifer of the Vendian sandy-argillaceous deposits, widespread in the coastal territory of the European North of Russia.
- (2)
- This aquifer has large resources of groundwater, but they are used in extremely limited quantities, because the hydrochemical conditions in the aquifer are very complex and are associated with salinization by sea waters of modern and ancient transgressions and an increase in the concentration of uranium in certain areas.
- (3)
- Samples were taken from objects available for sampling: wells being drilled along Vendian sandy-argillaceous sediments and a deepening open pit to a freshwater circulation depth of about 200 m. Clastic material is 70–80%, represented by quartz and feldspar grains. Biotite and clay aggregates are insignificant. Cement has a predominantly clay-ferruginous composition and there are also carbonate and gypsum cements. Clay minerals are represented by hydromica, kaolinite, and chlorite. The ratio of Fe2O3 and FeO forms of iron in siltstones is ~(6 ÷ 17):1.
- (4)
- The adsorbed trace materials and carbonate minerals have been found to contain on average 9.72% of the total uranium content (TUC) in the rock, while the adsorbed trace materials contain on average 6.1% TUC. That is, about one third of easily recoverable uranium is coprecipitated with carbonates. Ferrihydrate, amorphous minerals of Fe, Al, and Si, and secondary U minerals contain on average 21.6% TUC. Thermodynamic numerical simulations were carried out to determine the principal migration species of U in groundwater and the saturation of certain water samples with uranophane suggests that this mineral is of secondary genesis. Crystalline iron minerals contain on average 13.12% TUC. Clay and some refractory minerals contain on average 23.21% TUC. All remaining resistant minerals contain on average 32.35% TUC.
- (5)
- At the same time, the maximum content of uranium in the most resistant minerals is explained only by the maximum mass of this fraction, which averages about 85% of the total mass of samples. The content of uranium directly in the dissolved substance (leached material) is at a maximum in amorphous minerals of Fe (12.89 ppm), then adsorbed trace materials and carbonate minerals (9.14 ppm), clay and some refractory minerals (5.88 ppm), crystalline iron minerals (3.01 ppm), and most resistant minerals (0.47 ppm). It is also noteworthy that the average concentration of uranium in adsorbed trace materials was 7.7 ppm, that is, about 1.4 ppm remains in carbonate minerals.
- (6)
- The average 234U:238U is maximum in adsorbed trace materials and carbonate minerals (2.39 ± 0.36) and is close to that in fresh groundwater (2.8 ± 0.42). It is also increased in the amorphous minerals of Fe (1.53 ± 0.23). In general, there is a dependence of the 234U:238U activity ratio in rock on the degree of participation of groundwater in the deposition of hydrogenic uranium isotopes into the cracks and pores of these rocks.
Author Contributions
Conceptualization, formal analysis, writing—original draft preparation, A.I.M.; methodology and investigation, S.B.Z. and A.S.T. All authors have read and agreed to the published version of the manuscript.
Funding
This work was supported by the Russian Ministry of Education and Science (project no. № AAAA-A19-119011890018-3), the Russian Foundation for Basic Research (projects No. 20-05-00045_A.
Acknowledgments
The authors are grateful to Belogub E.V. and Rassomakhin M.A for determining the mineral phases using X-ray powder diffraction (XRD) analysis and scanning electron microscopy (SEM).
Conflicts of Interest
The authors declare no conflict of interest. The founding sponsors had no role in the design of the study; in the collection, analyses, or interpretation of data; in the writing of the manuscript, and in the decision to publish the results.
Appendix A
Appendix A.1. X-ray Powder Diffraction (XRD) Analysis
X-ray diffraction patterns were obtained on a Shimadzu XRD-6000 diffractometer (Shimadzu, Kyoto, Japan), Cu-K α radiation with a monochromator, recording speed 2 degrees/min. X-ray processing was carried out using standard software. Quantitative ratios between minerals were calculated using the SIROQUANT V.3 software package. References from the internal database were used. The results are reduced to 100% of the crystalline phases. The amount of X-ray amorphous substance (filmy iron hydroxides and oxides, amorphous silica) was not analyzed. The sensitivity of the method is 0.5 wt % for well crystallized minerals and 1 wt % for clay minerals and poorly ordered iron oxide. The results are shown in Table A1.
The maximum amounts of clay minerals and a significant amount of hematite were found in sample GGS2-11-4. In samples GGS2-11-2, GGS2-11-3, intrinsic iron oxide minerals do not form crystalline forms and are probably represented by filmy X-ray amorphous precipitates. Crystalline iron hydroxide (goethite FeOOH) was not found.
No carbonates were found in the form of any discernible precipitates. Calcium level is so low that it does not even map. Magnesium is present, but it is associated with cement illite. One fragment of serpentine and several fragments of biotite (hydrobiotite) composition were also found. Illite and kaolinite are not identified during routine analysis, because in very thin aggregates the particles in the cement have submicron dimensions.

Table A1.
Mineral composition of sedimentary rock samples (wt %).
| Sample ID | GGS2-11-1 | GGS2-11-2 | GGS2-11-3 | GGS2-11-4 | GGS2-11-5 |
|---|---|---|---|---|---|
| Sampling depth, m | 66.7–66.8 | 75.2–75.3 | 83.9–84.0 | 94.0–94.1 | 99.5–99.6 |
| Mineral | |||||
| Quartz | 75 | 87 | 90 | 22 | 42 |
| Potassium feldspar (Orthoclase) | 12 | 5 | 5 | 2 | 4 |
| Albite | 3 | - | 3 | - | - |
| Illite (+Muscovite) | 8 | 2 | 1 | 46 | 40 |
| Kaolinite | 2 | 1 | 1 | 12 | 14 |
| Hematite | - | trace | trace | 18 | - |
Sample GGS2-11-4 is likely to contain a significant X-ray amorphous substance; therefore, the contents of crystalline phases, especially hematite, are clearly overestimated in X-ray analysis. Hematite in the form of separate precipitates sufficient for analysis is not identified. Possibly, the rock contains titanium oxides but in small amounts.
Appendix A.2. Scanning Electron Microscopy (SEM)
VEGA3 TESCAN with EDS. Minerals were diagnosed by energy dispersive spectra, the presence of carbonates was checked by mapping in the characteristic radiation of calcium and magnesium. If the carbonate component is present, then it is a filmy precipitation in clay cement. The presence of carbonates can be unambiguously proven only by chemical determination of CO2.
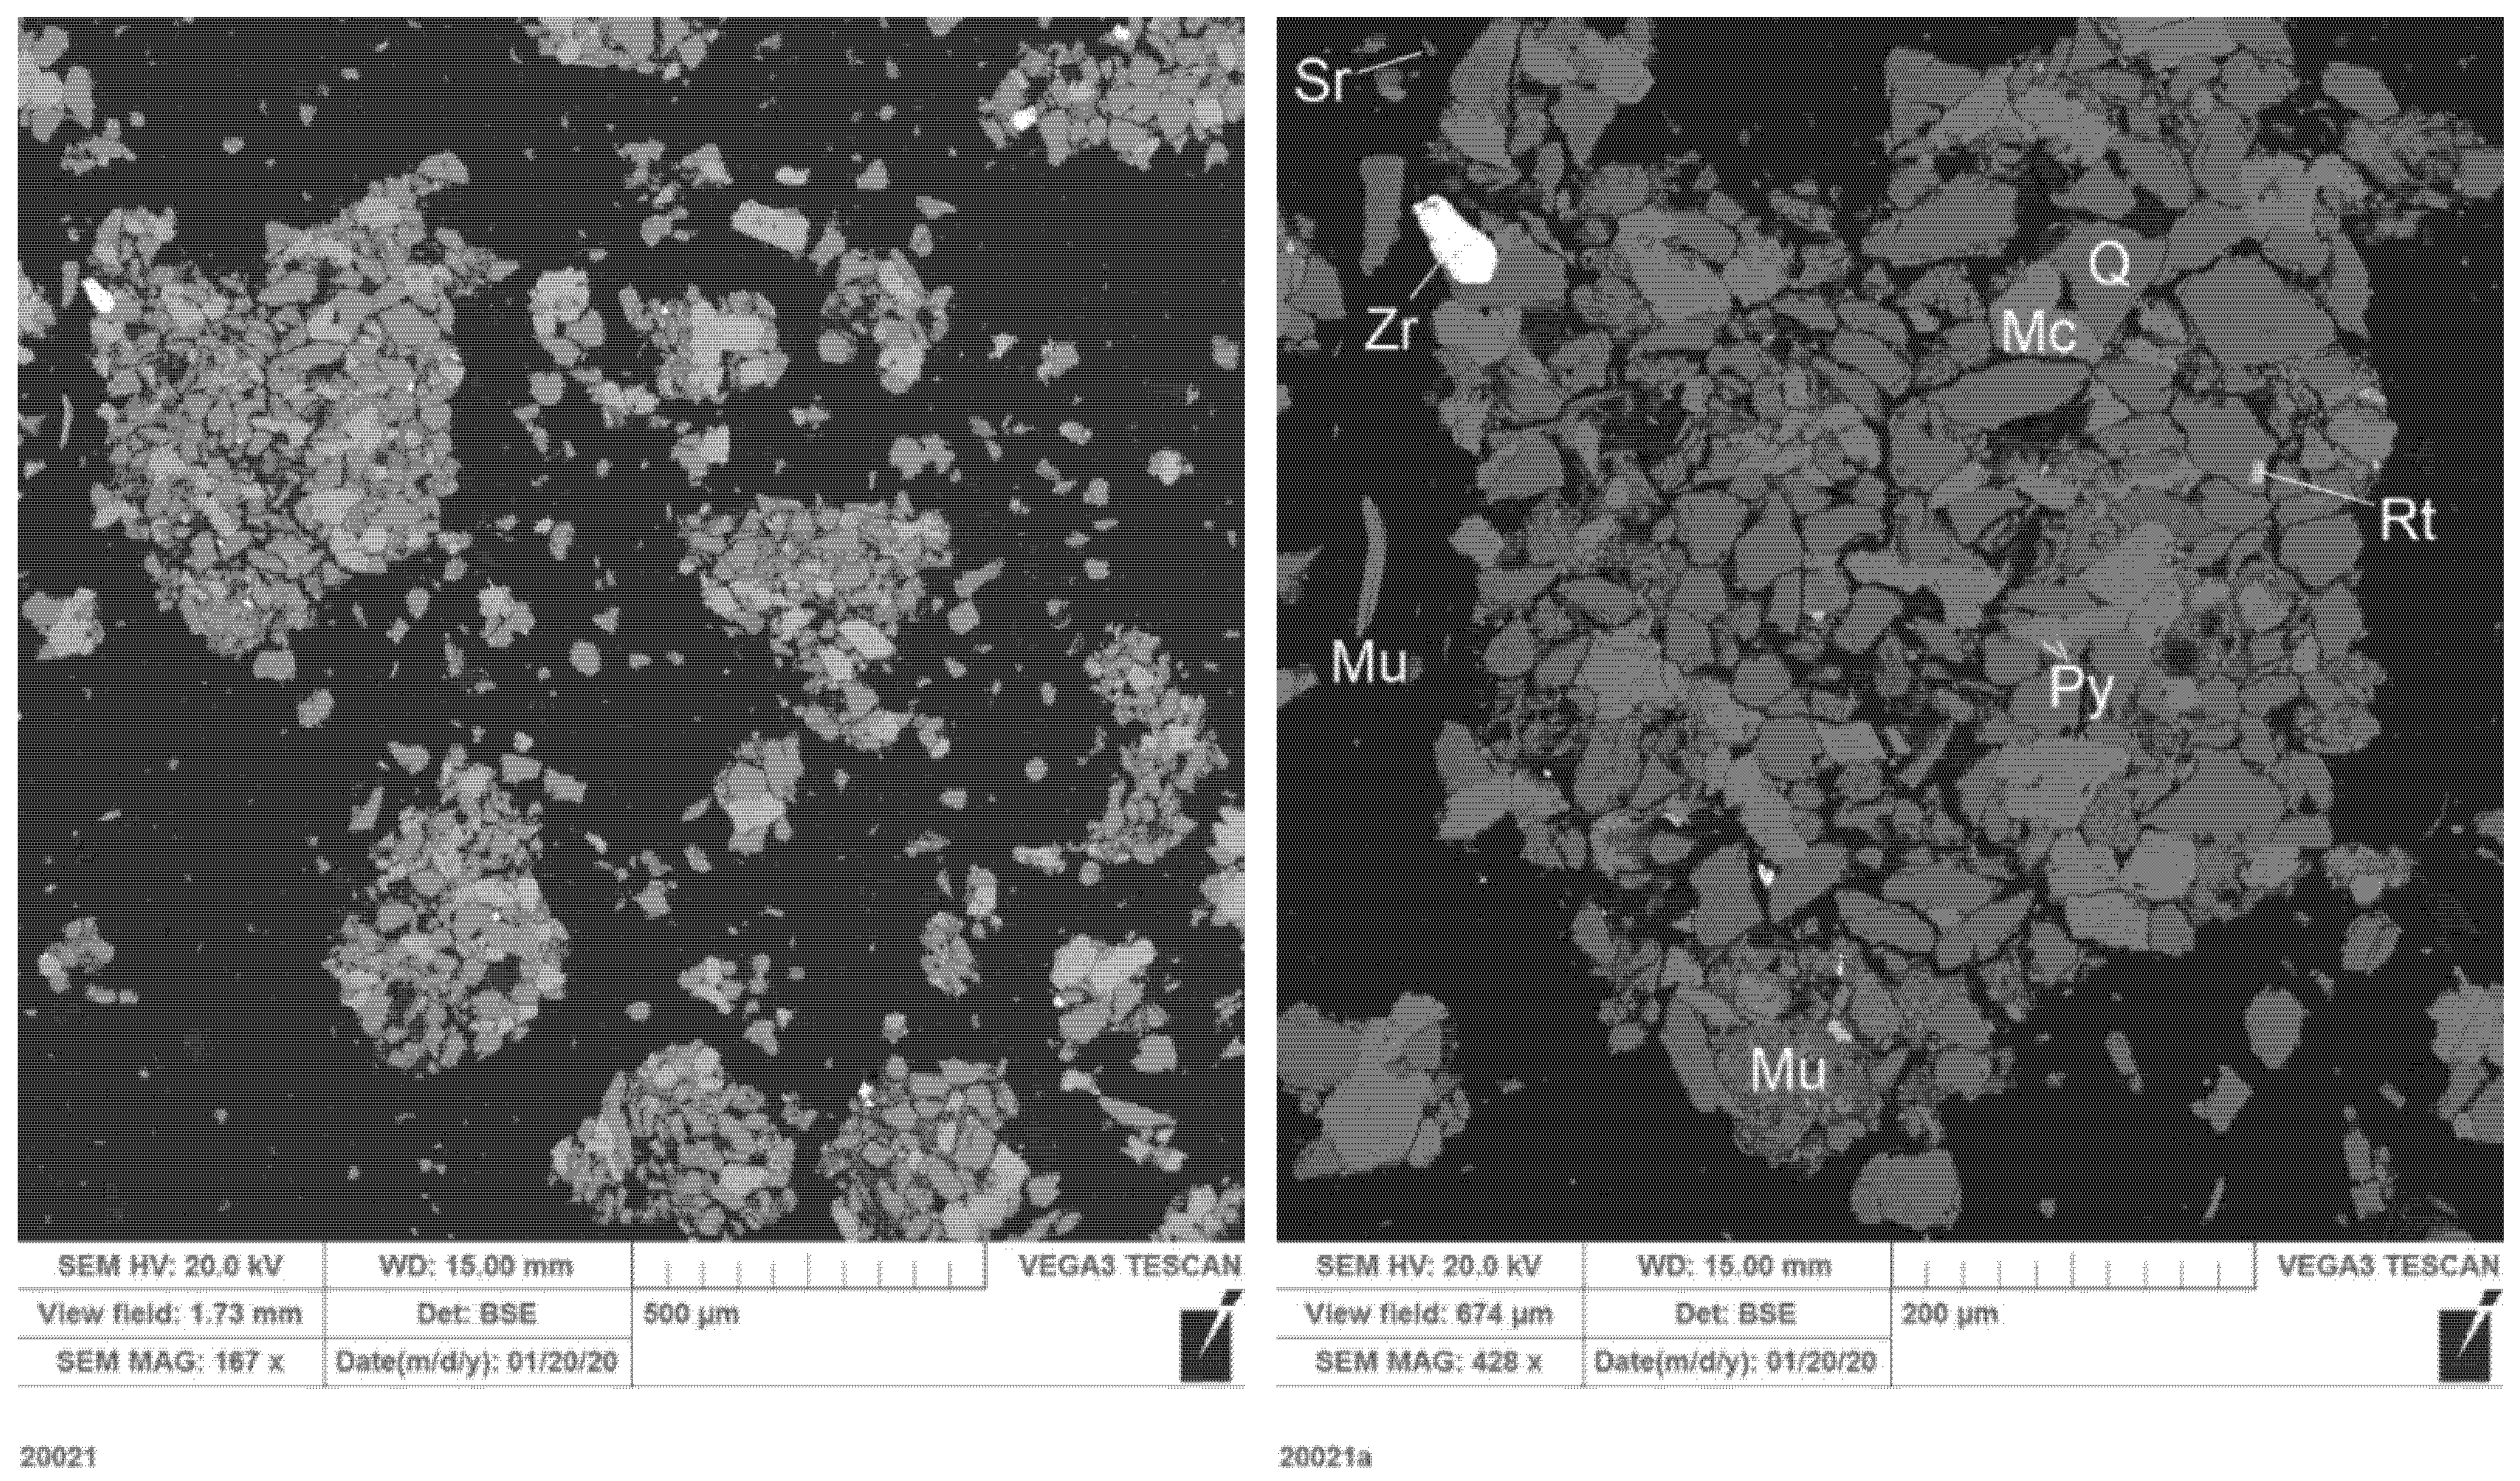
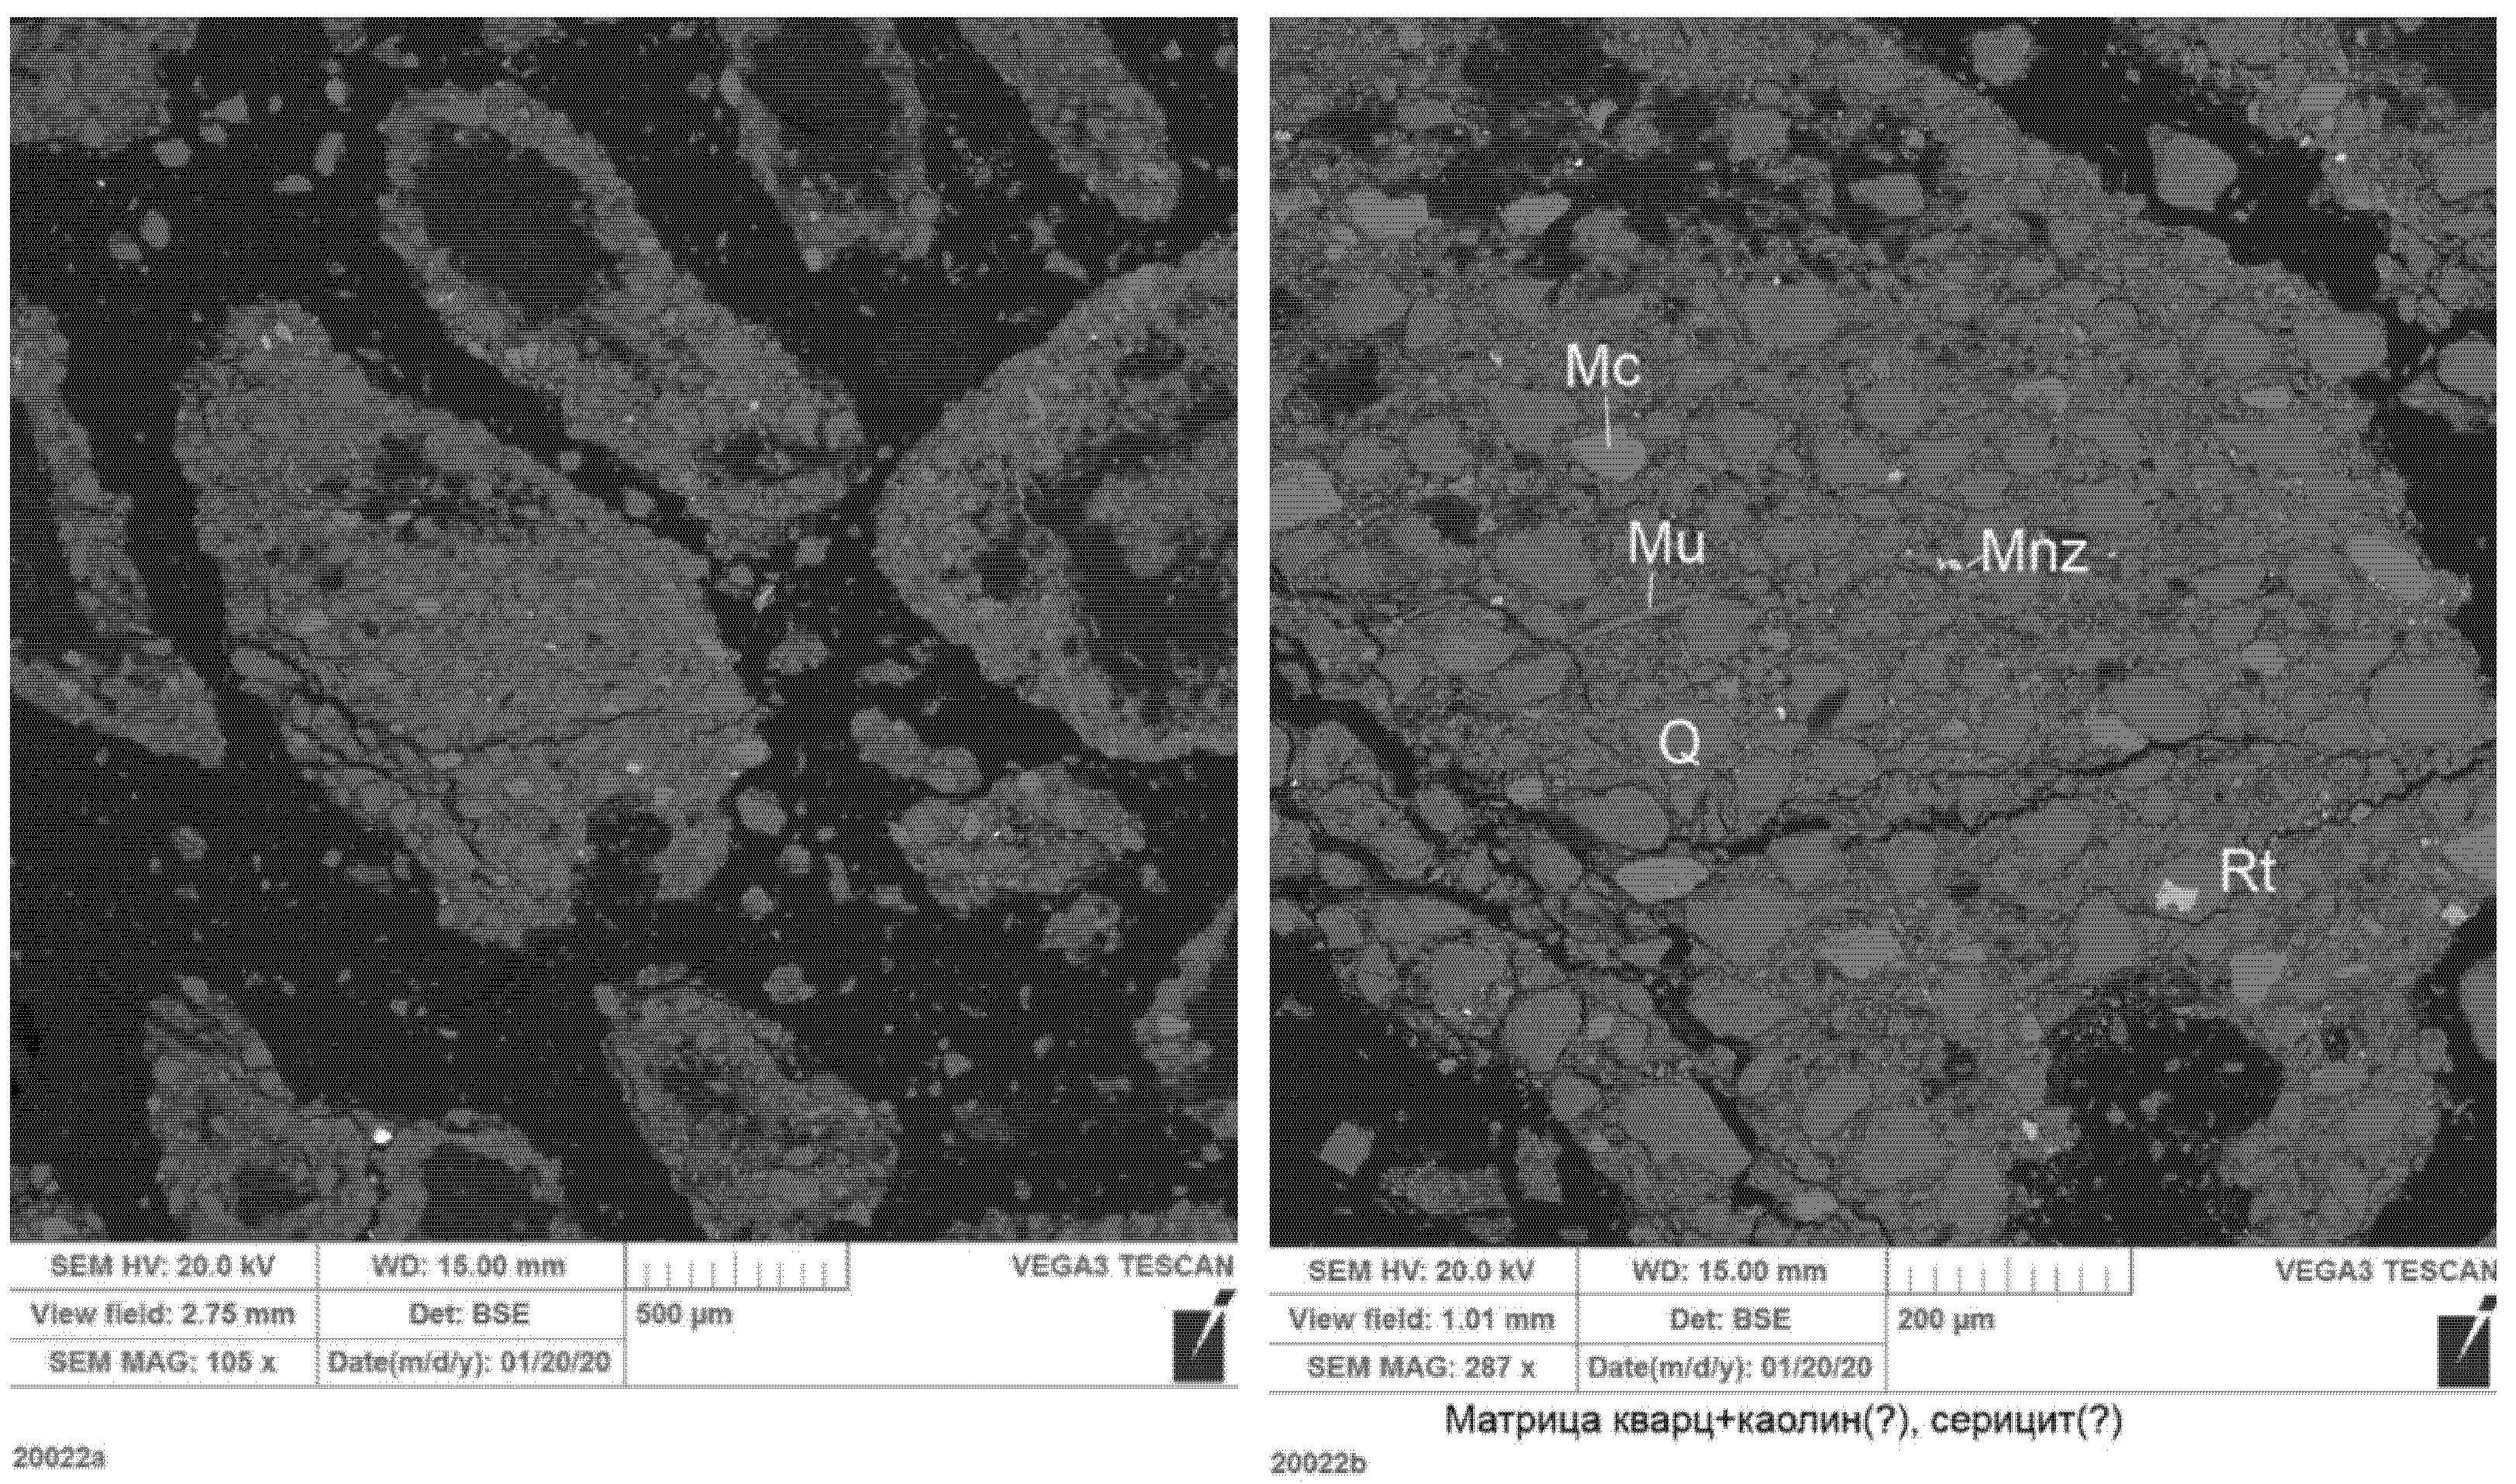
Figure A1.
SEM micrograph of Sample GGS2-11-1.

Quartz (Q)-potassium feldspar (Mc) aggregate with mica (Mu), mica-kaolin cement and accessories: zircon (Zr), titanium oxide, in the form of rutile (Rt), pyrite (Py)—very thin inclusions at the border of potassium feldspar. No calcium carbonates were found in the cement. Loss on ignition is probably associated with mica-kaolin cement. Mica cement (illite) is enriched with magnesium.
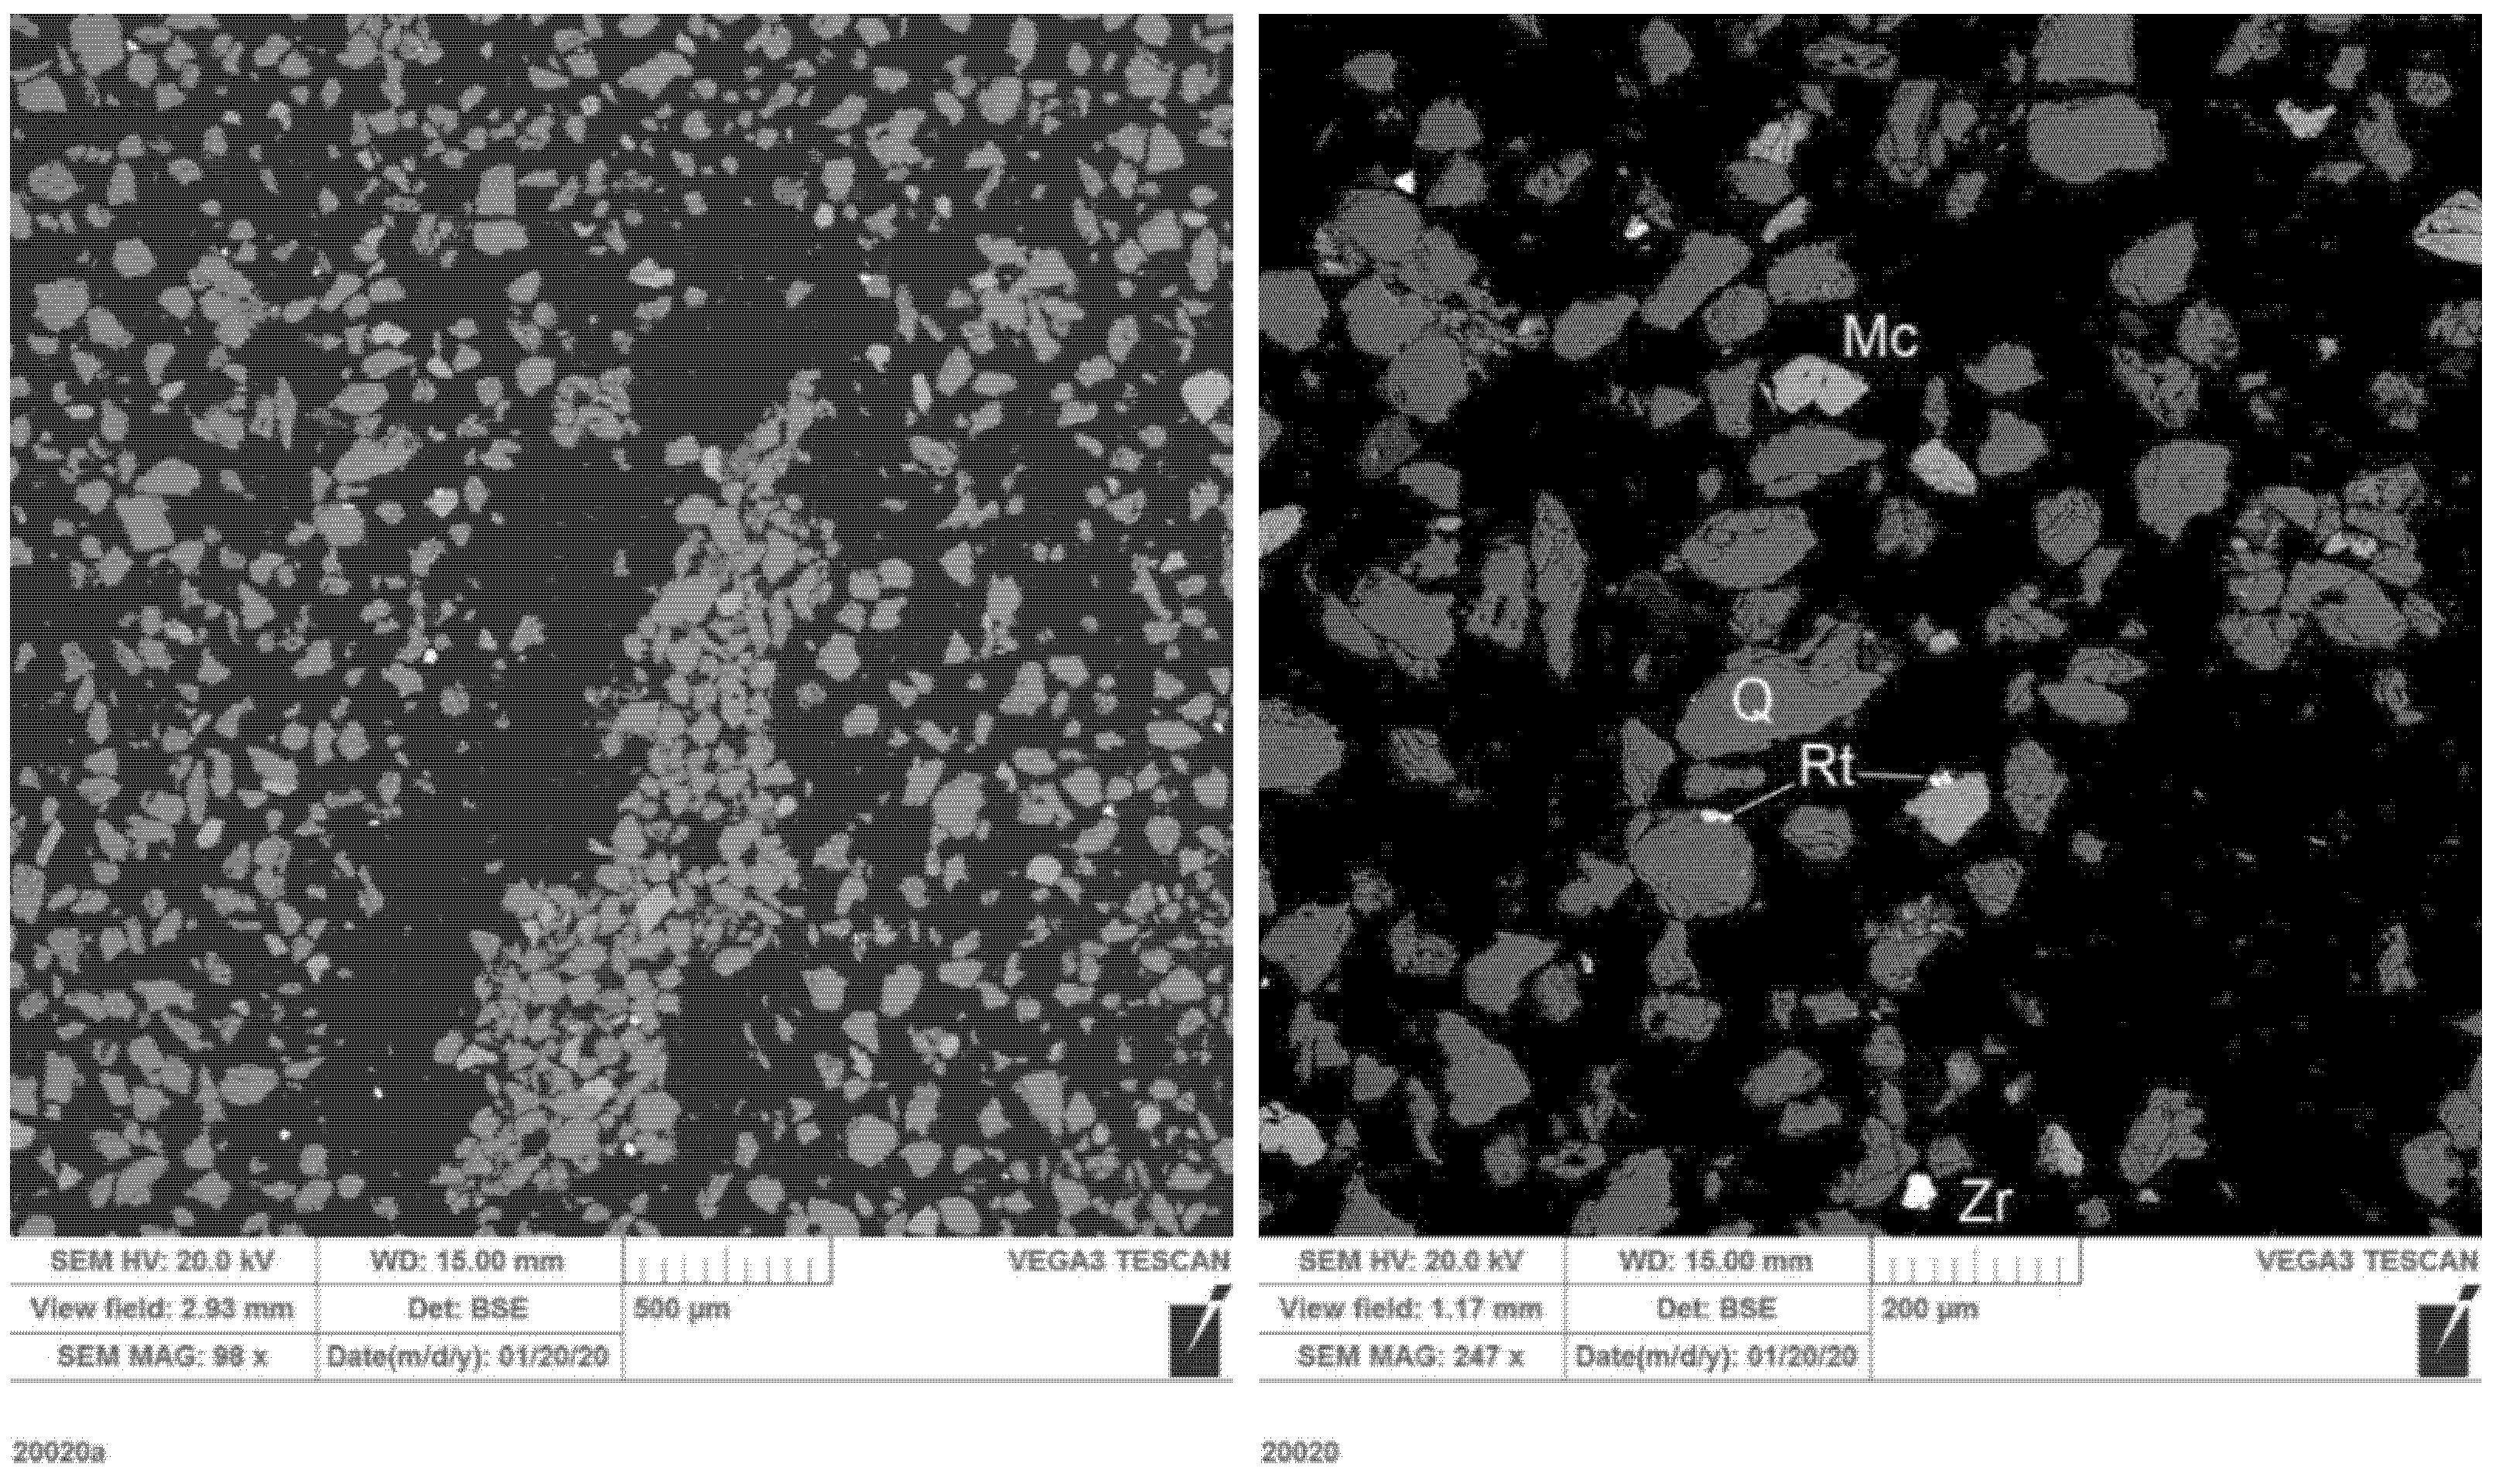
Figure A2.
SEM micrograph of Sample GGS2-11-2.

Quartz (Q)-potassium feldspar (Mc) aggregate (orthoclase or microcline) with mica cement (not marked, there is very little of it) and accessories: zircon (Zr), titanium oxide (Rt). No calcium carbonates were found in the cement. Mica cement (illite) is enriched with magnesium.
Figure A3.
SEM micrograph of Sample GGS2-11-3.

Fragments of quartz (Q), potassium feldspar (Mc), muscovite (Mu) in clay (kaolin-hydromica) cement. Accessory minerals are monazite (Mnz) and rutile (Rt). Voids in some clay particles are spalling, not all particles are uniformly saturated with epoxy, which clearly indicates the presence of sorbed water in the cement. No calcium carbonates were found in the cement.
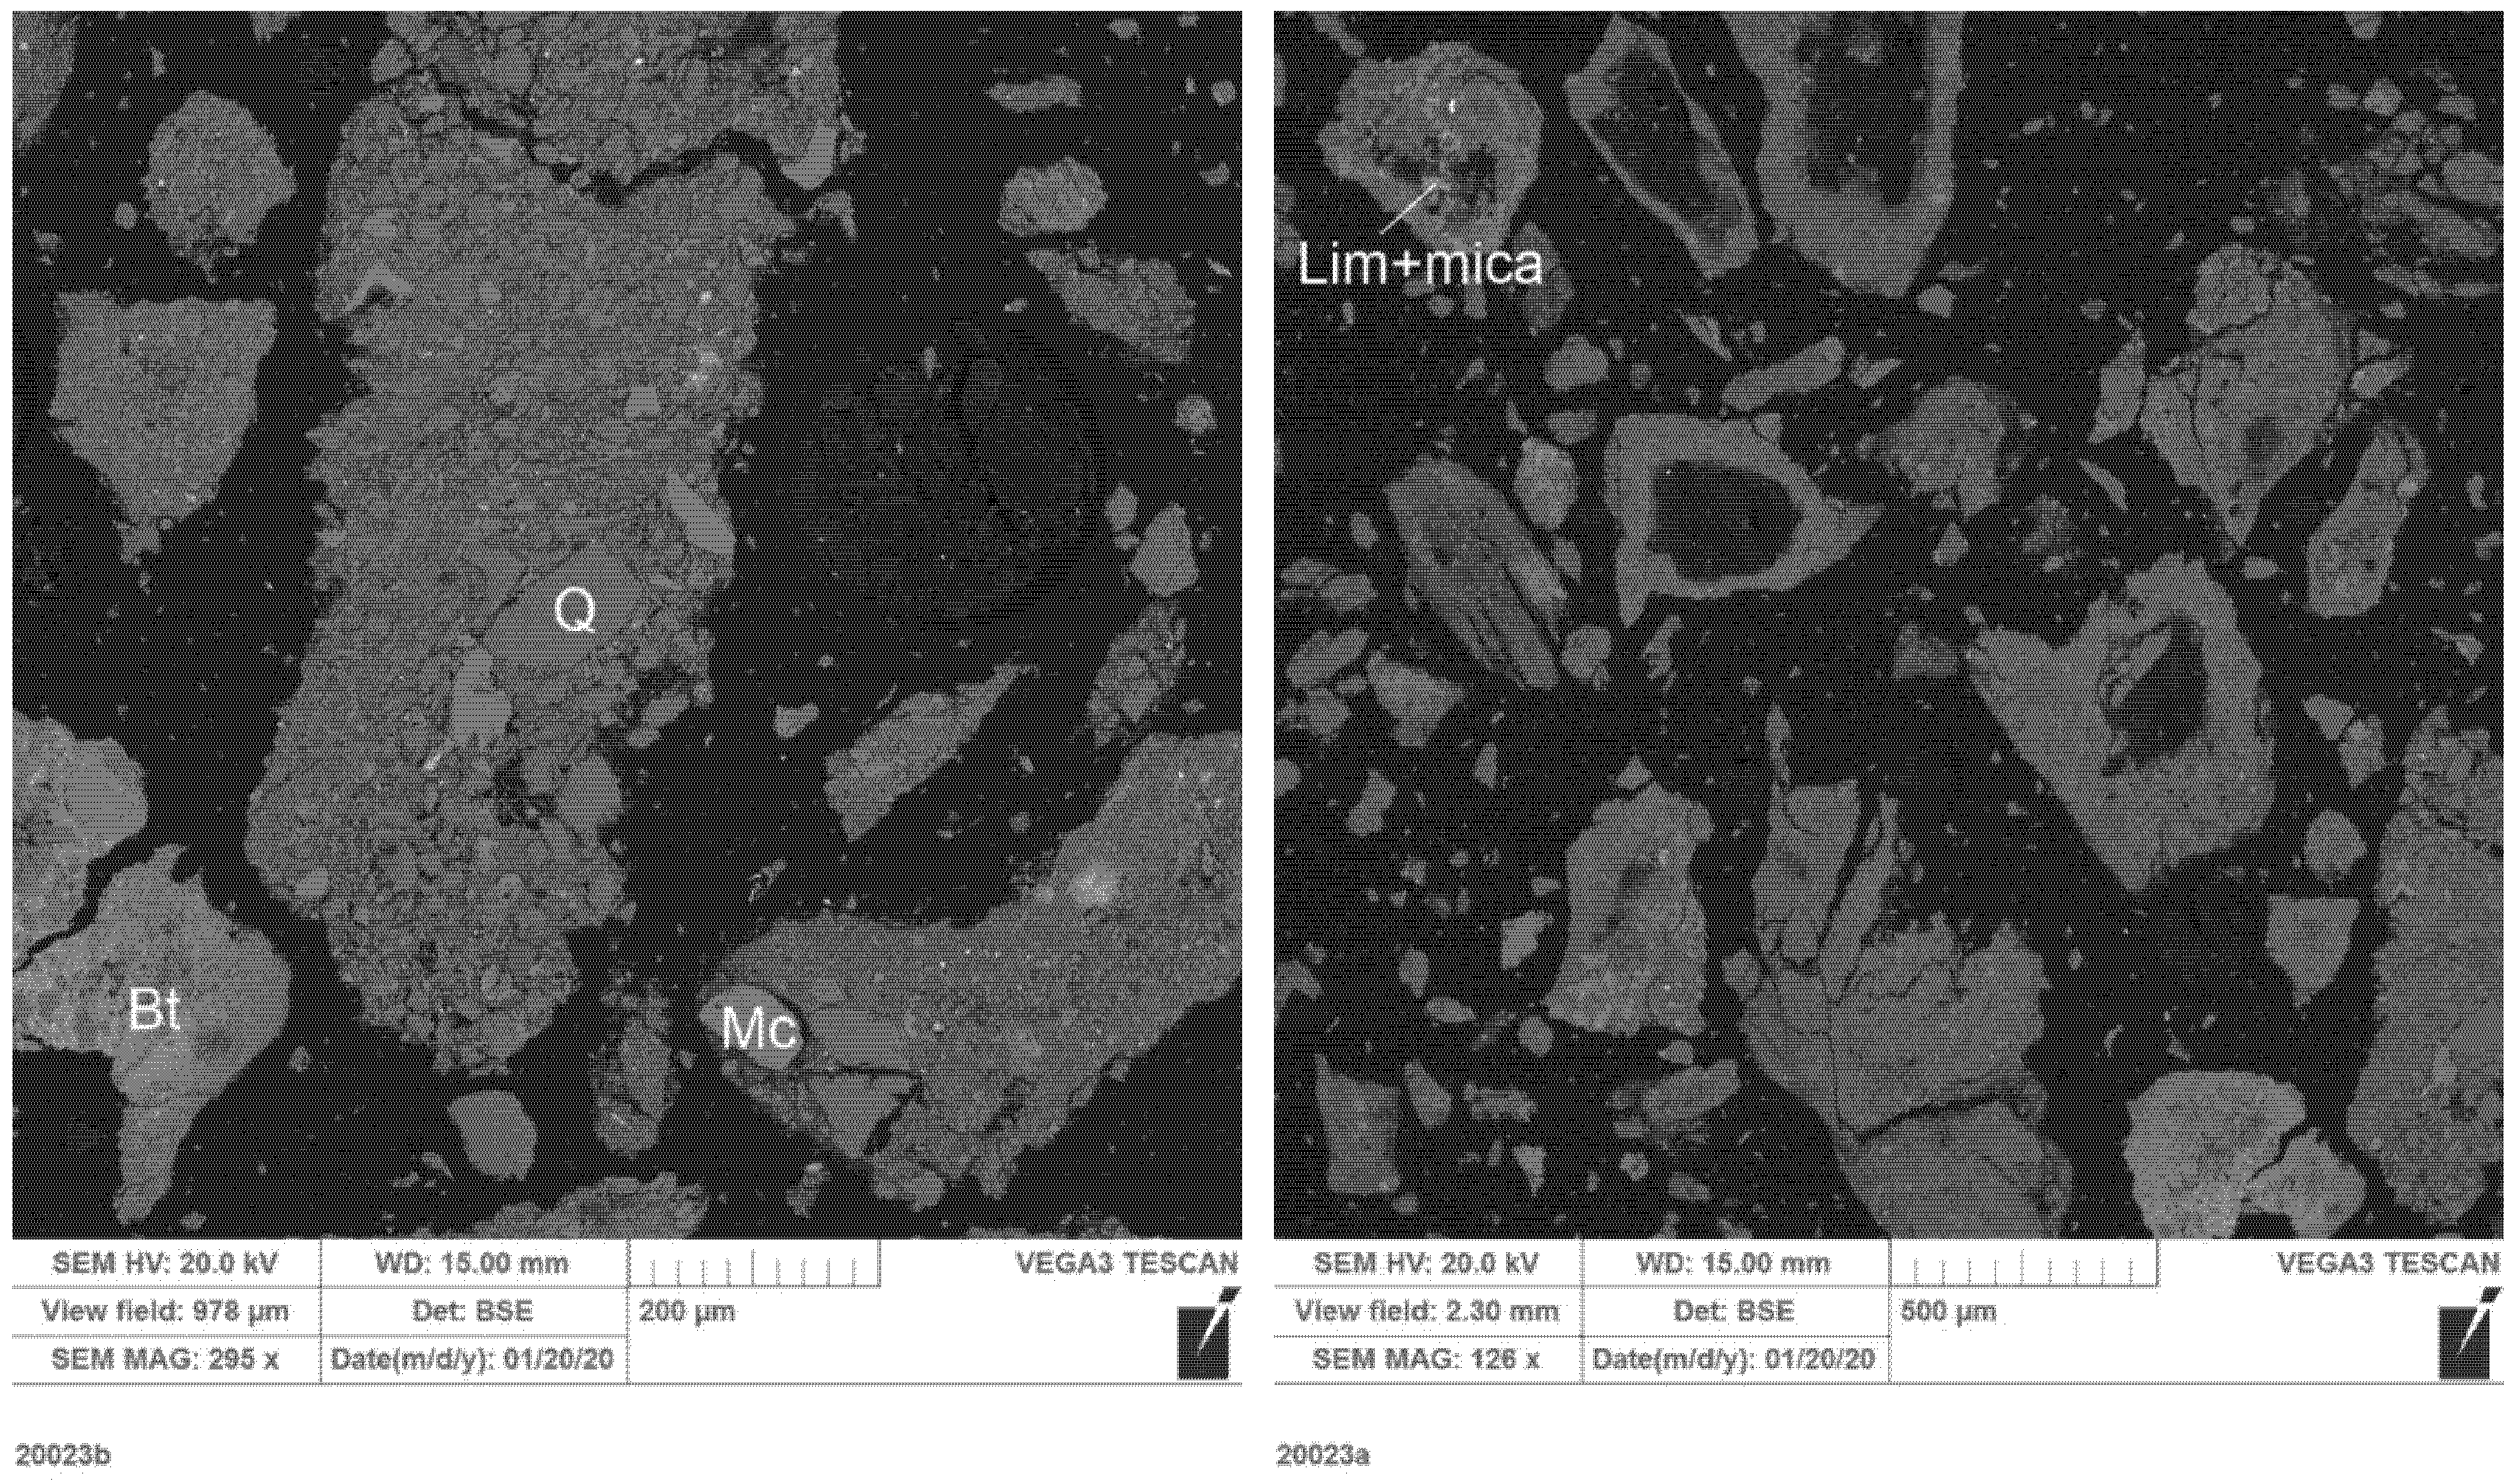
Figure A4.
SEM micrograph of Sample GGS2-11-4.

Fragments of quartz (Q)—potassium feldspar (Mc) in clay (kaolin-hydromica) cement, individual minerals do not differ. Light thin spots are clumps of Fe + Ti oxides. In clay cement, iron is evenly distributed in the form of films around clay particles (Lim), individual minerals are not distinguished. Voids in some clay particles—chipping. No calcium carbonates were found in cement.
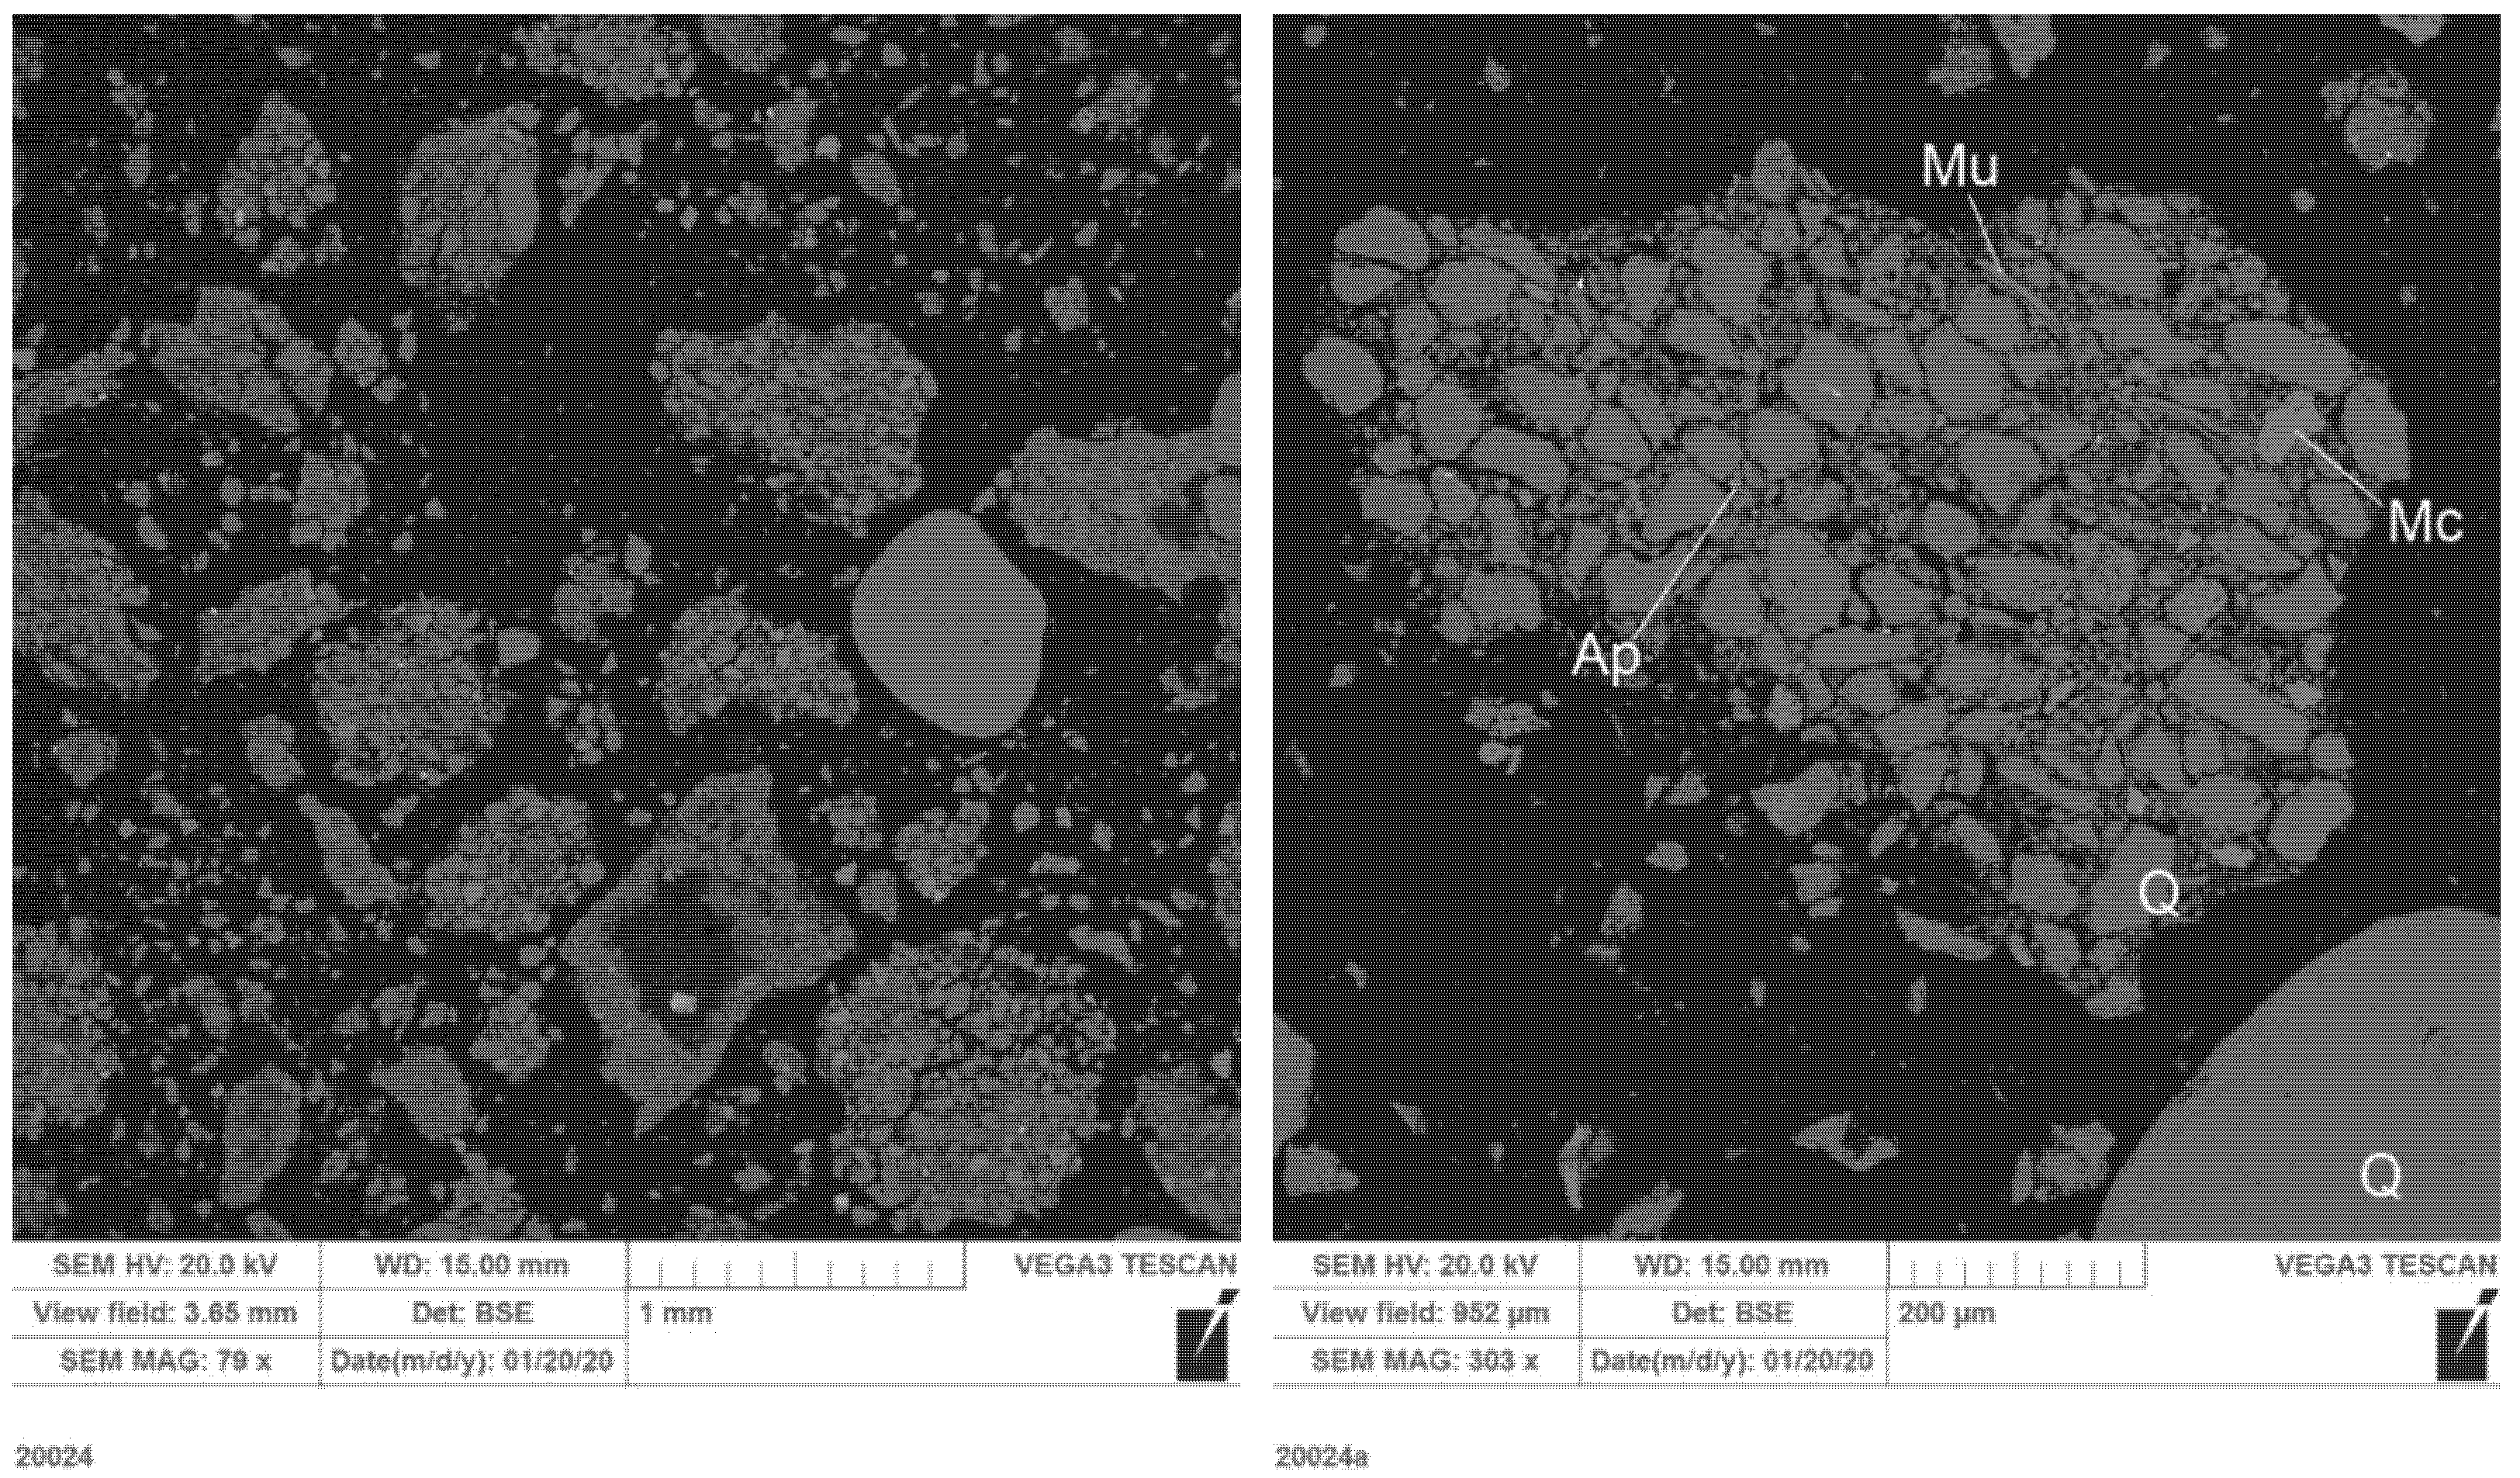
Figure A5.
SEM micrograph of Sample GGS2-11-5.

Fragments of quartz (Q, large rounded sand grain in the left photo), potassium feldspar (Mc), muscovite with mica cement, and accessories: apatite (Ap). No calcium carbonates were found in the cement. Loss on ignition is probably associated with mica-kaolin cement. Illite is enriched with magnesium.
References
- Turekian, K.K.; Wedepohl, K.H. Distribution of the elements in some major units of the Earth’s crust. Geol. Soc. Am. Bull. 1961, 72, 175–190. [Google Scholar] [CrossRef]
- International Atomic Energy Agency. World Distribution of Uranium Deposits (UDEPO), with Uranium Deposit Classification; IAEA-TECDOC-1629; IAEA: Vienna, Austria, 2009. [Google Scholar]
- Keatley, A.C.; Scott, T.B.; Davis, S.; Jones, C.P.; Turner, P. An investigation into heterogeneity in a single vein-type uranium ore deposit: Implications for nuclear forensics. J. Environ. Radioact. 2015, 150, 75–85. [Google Scholar] [CrossRef] [PubMed]
- Peng, X.; Min, M.; Qiao, H.; Wang, J.; Fayek, M. Uranium-Series Disequilibria in the Groundwater of the Shihongtan Sandstone-Hosted Uranium Deposit, NW China. Minerals 2016, 6, 3. [Google Scholar] [CrossRef] [Green Version]
- Hall, S.M.; Mihalasky, M.J.; Tureck, K.R.; Hammarstrom, J.M.; Hannon, M.T. Genetic and grade and tonnage models for sandstone-hosted roll-type uranium deposits, Texas Coastal Plain. Ore Geol. Rev. 2017, 80, 716–753. [Google Scholar] [CrossRef]
- Murphy, W.M.; Shock, E.L. Environmental Aqueous Geochemistry of Actinides. Rev. Mineral. Geochem. 1999, 38, 221–253. [Google Scholar]
- Priest, N.D. Toxicity of depleted uranium. Lancet 2001, 357, 244–246. [Google Scholar] [CrossRef]
- World Health Organization. Guidelines for Drinking-Water Quality, 4th ed.; WHO: Geneva, Switzerland, 2011. [Google Scholar]
- Manickum, T.; John, W.; Terry, S.; Hodgson, K. Preliminary study on the radiological and physicochemical quality of the Umgeni Water catchments and drinking water sources in KwaZulu-Natal, South Africa. J. Environ. Radioact. 2014, 137, 227–240. [Google Scholar] [CrossRef] [PubMed]
- Xoubi, N. Evaluation of Uranium Concentration in Soil Samples of Central Jordan. Minerals 2015, 5, 133–141. [Google Scholar] [CrossRef] [Green Version]
- Dhaoui, Z.; Chkir, N.; Zouari, K.; Ammar, F.H.; Agoune, A. Investigation of uranium geochemistry along groundwater flow path in the Continental Intercalaire aquifer (Southern Tunisia). J. Environ. Radioact. 2016, 157, 67–76. [Google Scholar] [CrossRef] [PubMed]
- Suksi, J.; Rasilainen, K.; Marcos, N. U isotopic fractionation—A process characterising groundwater systems. In Uranium in the Environment; Merkel, B.J., Hasche-Berger, A., Eds.; Springer: Berlin/Heidelberg, Germany, 2006; pp. 683–690. [Google Scholar]
- Chabaux, F.; Bourdon, B.; Riotte, J. U-series geochemistry in weathering profiles, riverwaters and lakes. In U/Th Series Radionuclides in Aquatic Systems; Krishnaswami, S., Cochran, J.K., Eds.; Radioactivity in the Environment; Elsevier: New York, NY, USA, 2008; Volume 13, pp. 49–104. [Google Scholar]
- Maher, K.; DePaolo, D.J.; Lin, J.C.F. Rates of silicate dissolution in deep-sea sediment: In situ measurement using U-234/U-238 of pore fluids. Geochim. Cosmochim. Acta 2004, 68, 4629–4648. [Google Scholar] [CrossRef]
- Dosseto, A.; Bourdon, B.; Turner, S. Uranium-series isotopes in river materials: Insights into the timescales of erosion and sediment transport. Earth Planet. Sci. Lett. 2008, 265, 1–17. [Google Scholar] [CrossRef]
- Vigier, N.; Bourdon, B. Constraining Rates of Chemical and Physical Erosion Using U-Series Radionuclides. In Handbook of Environmental Isotope Geochemistry, Advances in Isotope Geochemistry; Baskaran, M., Ed.; Springer: Berlin/Heidelberg, Germany, 2011; Chapter 27; pp. 553–571. [Google Scholar]
- Krishnaswami, S.; Graustein, W.C.; Turekian, K.K.; Dowd, J.F. Radium, Thorium and Radioactive Lead Isotopes in Groundwaters: Application to the in situ Determination of Adsorption-Desorption Rate Constants and Retardation Factors. Water Resour. Res. 1982, 18, 1663–1675. Available online: https://inis.iaea.org/search/search.aspx?orig_q=RN:15005709 (accessed on 21 April 2021). [CrossRef]
- Davidson, M.R.; Dickson, B.L. A Porous Flow Model for Steady State Transport of Radium in Groundwater. Water Resour. Res. 1986, 22, 34–44. [Google Scholar] [CrossRef]
- Ivanovich, M.; Fröhlich, K.; Hendry, M.J. Uranium-series radio nuclides in fluids and solids, Milk River aquifer, Alberta, Canada. Appl. Geochem. 1991, 6, 405–418. [Google Scholar] [CrossRef]
- Ku, T.L.; Luo, S.; Leslie, B.W.; Hammond, D.E. Decay-series disequilibria applied to the study of rock-water interaction and geothermal systems. In Uranium-Series Disequilibrium: Application to Earth, Marine, and Environmental Sciences; Ivanovich, M., Harmon, R.S., Eds.; Clarendon Press: Oxford, UK, 1992; pp. 631–668. Available online: https://inis.iaea.org/search/search.aspx?orig_q=RN:25066326 (accessed on 21 April 2021).
- Osmond, J.K.; Cowart, J.B. Ground water. In Uranium-Series Disequilibrium: Application to Earth, Marine, and Environmental Sciences; Ivanovich, M., Harmon, R.S., Eds.; Clarendon Press: Oxford, UK, 1992; pp. 290–334. [Google Scholar]
- Luo, S.D.; Ku, T.L.; Roback, R.; Murrell, M.; McLing, T.L. In-situ radionuclide transport and preferential groundwater flows at INEEL (Idaho): Decay-series disequilibrium studies. Geochim. Cosmochim. Acta 2000, 64, 867–881. [Google Scholar] [CrossRef]
- Tricca, A.; Porcelli, D.; Wasserburg, G.J. Factors controlling the groundwater transport of U, Th, Ra, and Rn. J. Earth Syst. Sci. 2000, 109, 95–108. [Google Scholar] [CrossRef] [Green Version]
- Tricca, A.; Wasserburg, G.J.; Porcelli, D.; Baskaran, M. The transport of U- and Th-series nuclides in a sandy unconfined aquifer. Geochim. Cosmochim. Acta 2001, 65, 1187–1210. [Google Scholar] [CrossRef]
- Porcelli, D. Investigating groundwater processes using U- and Th-series nuclides. Radioact. Environ. 2008, 13, 105–153. [Google Scholar]
- Yanase, N.; Nightingale, T.; Payne, T.; Duerden, P. Uranium distribution in mineral phases of rock by sequential extraction procedure. Radiochim. Acta 1991, 52, 387–393. [Google Scholar] [CrossRef]
- Lowson, R.T.; Short, S.A.; Davey, B.G.; Gray, D.J. 234U/238U and 230Th/234U activity ratios in mineral phases of a lateritic weathered zone. Geochim. Cosmochim. Acta 1986, 50, 1697–1702. [Google Scholar] [CrossRef]
- Payne, T.E.; Edis, R.; Fenton, B.R.; Waite, T.D. Comparison of laboratory uranium sorption data with ‘in situ distribution coefficients’ at the Koongarra uranium deposit, Northern Australia. J. Environ. Radioact. 2001, 57, 35–55. [Google Scholar] [CrossRef]
- Dabous, A.A.; Osmond, J.K.; Dawood, Y.H. Uranium/thorium isotope evidence for groundwater history in the Eastern Desert of Egypt. J. Arid Environ. 2002, 50, 343–357. [Google Scholar] [CrossRef]
- Filgueiras, A.V.; Lavilla, I.; Bendicho, C. Chemical sequential extraction for metal partitioning in environmental solid samples. J. Environ. Monit. 2002, 4, 823–857. [Google Scholar] [CrossRef] [PubMed]
- Priestley, S.C.; Payne, T.E.; Harrison, J.J.; Post, V.E.A.; Shand, P.; Love, A.J.; Wohling, D.L. Use of U-isotopes in exploring groundwater flow and inter-aquifer leakage in the south-western margin of the Great Artesian Basin and Arckaringa Basin, central Australia. Appl. Geochem. 2018, 98, 331–344. [Google Scholar] [CrossRef]
- Malov, A.I. Evolution of the uranium isotopic compositions of the groundwater and rock in the sandy-clayey aquifer. Water 2017, 9, 910. [Google Scholar] [CrossRef] [Green Version]
- Malov, A.I.; Zykov, S.V. Study of the mobilization of uranium isotopes in a sandstone aquifer in combination with groundwater data. Water 2020, 12, 112. [Google Scholar] [CrossRef] [Green Version]
- Malov, A.I. Evolution of the groundwater chemistry in the coastal aquifers of the south-eastern White Sea area (NW Russia) using 14C and 234U-238U dating. Sci. Total Environ. 2018, 616, 1208–1223. [Google Scholar] [CrossRef]
- Tyshov, A.S.; Malov, A.I.; Yakovlev, E.Y.; Druzhinin, S.V. Changes in the radionuclide and chemical composition of groundwater during the operation of water intake in sand collectors. In Problems of Ensuring Environmental Safety and Sustainable Development of the ARCTIC Regions; Bolotov, I., Ed.; FCIAR RAS: Arkhangelsk, Russia, 2019; pp. 116–119. (In Russian) [Google Scholar]
- Tamm, Ü. Über die Oxalatmethode in der chemischen Bodenanalyse. Fran Statens Skogsforsoeksans Stockh. 1932, 27, 19–20. [Google Scholar]
- Chao, Τ.T.; Zhou, L. Extraction techniques for selective dissolution of amorphous iron oxides from soils and sediments. Soil Sei. Soc. Am. J. 1983, 47, 225. [Google Scholar] [CrossRef]
- Mehra, O.P.; Jackson, M.L. Iron oxide removal from soils and clays by a dithionite-citrate system buffered with bicarbonate. In Proceedings of the 7th National Conference on Clays and Clay Minerals, Washington, DC, USA, 20–23 October 1958; pp. 317–327. [Google Scholar]
- Airey, P.L.; Roman, D.; Golian, C.; Short, S.; Nightingale, T.; Lowson, R.T.; Calf, G.E. Radionuclide Migra–tion Around Uranium Ore Bodies—Analogue of Radioactive Waste Repositories; USNRC Contract NRC-04–81-172, AAEC (Aust. At. Energy Comm.) Annual Report, 1982–1983, AAEC/C40, NUREG/CR-3941; USNRC: Rockville, MD, USA, 1984.
- Malov, A.I.; Sidkina, E.S.; Ryzhenko, B.N. Model of the Lomonosov diamond deposit as a water–rock system: Migration species, groundwater saturation with rock-forming and ore minerals, and ecological assessment of water quality. Geochem. Int. 2017, 55, 1118–1130. [Google Scholar] [CrossRef]
Figure 1.
Core sampling locations. “Wells GGS” are the GGS2-10 and GGS2-11 boreholes with a depth of 102 and 101.2 m. “Well P-4” is a hydrogeological borehole with a depth of 214 m. “Open pit” is Quarry on the Arkhangelskaya kimberlite pipe of the Lomonosov diamond deposit with a depth of 210 m.
Figure 1.
Core sampling locations. “Wells GGS” are the GGS2-10 and GGS2-11 boreholes with a depth of 102 and 101.2 m. “Well P-4” is a hydrogeological borehole with a depth of 214 m. “Open pit” is Quarry on the Arkhangelskaya kimberlite pipe of the Lomonosov diamond deposit with a depth of 210 m.

Figure 2.
Distribution of uranium (%) in extracted phases.

Figure 3.
Average distribution of uranium (ppb of rock) (A) and the ratio of the activities of its isotopes (B) in extracted phases 1–5. 1—Adsorbed trace materials and carbonate minerals; 2—Ferrihydrate, amorphous minerals of Fe, Al, and Si, and secondary U minerals; 3—Crystalline iron minerals; 4—Clay and some refractory minerals; 5—All remaining resistant minerals.

Figure 4.
Average distribution of uranium in leached material of fractions 1–5 (ppm of leached material). Legend is in Figure 3.
Figure 4.
Average distribution of uranium in leached material of fractions 1–5 (ppm of leached material). Legend is in Figure 3.

Figure 5.
Measured 234U:238U activity ratios in extracted phases.

Figure 6.
234U:238U activity ratio vs. groundwater residence time in the fresh groundwater of the study area.
Figure 6.
234U:238U activity ratio vs. groundwater residence time in the fresh groundwater of the study area.

Table 1.
Distribution of uranium and measured 234U:238U activity ratios in sequential extracted phases.
Table 1.
Distribution of uranium and measured 234U:238U activity ratios in sequential extracted phases.
| Borehole ID | GGS2-10 | ||||||||
| Sampling Depth, m | 61.0–61.1 | 75.0–75.1 | 85.7–85.8 | 97.0–97.1 | 101.5–101.6 | ||||
| Fraction a | Uranium Isotope Activity Ratio 234U:238U | ||||||||
| 1 | 2.57 ± 0.39 | 5.36 ± 0.8 | 1.25 ± 0.19 | 1.52 ± 0.22 | 2 ± 0.3 | ||||
| 2 | 4.63 ± 0.7 | 1.39 ± 0.21 | 2.23 ± 0.34 | 1.09 ± 0.15 | 1.76 ± 0.26 | ||||
| 3 | 1.71 ± 0.26 | 0.86 ± 0.13 | 1.5 ± 0.22 | 1.5 ± 0.22 | 1.84 ± 0.28 | ||||
| 4 | 1.45 ± 0.22 | 2 ± 0.3 | 0.88 ± 0.13 | 2.64 ± 0.39 | 0.73 ± 0.11 | ||||
| 5 | 1.04 ± 0.15 | 2 ± 0.3 | 1.04 ± 0.15 | 0.93 ± 0.15 | 0.73 ± 0.11 | ||||
| Uranium Content in the Entire Volume of the Rock, ppb | |||||||||
| 1 | 43.8 ± 6.6 | 24.9 ± 3.8 | 45.8 ± 6.9 | 50 ± 7.4 | 38.2 ± 5.7 | ||||
| 2 | 50.6 ± 7.5 | 160.6 ± 24 | 97.2 ± 14 | 44 ± 6.6 | 142 ± 21 | ||||
| 3 | 27.2 ± 4.1 | 67.5 ± 10.1 | 258 ± 39 | 70.8 ± 10.6 | 39.9 ± 6 | ||||
| 4 | 141 ± 21 | 81.2 ± 12.2 | 234 ± 35 | 35.7 ± 5.35 | 346 ± 52 | ||||
| 5 | 301 ± 45 | 21.7 ± 3.2 | 65.9 ± 9.9 | 47.1 ± 7.06 | 12.1 ± 1.8 | ||||
| Sum | 564 ± 84 | 356 ± 53 | 701 ± 105 | 248 ± 37 | 578 ± 87 | ||||
| Uranium Content in the Entire Volume of the Rock, % | |||||||||
| 1 | 7.8 | 7 | 6.5 | 20.3 | 6.6 | ||||
| 2 | 9.0 | 45.1 | 13.9 | 17.7 | 24.6 | ||||
| 3 | 4.8 | 19 | 36.8 | 28.6 | 6.9 | ||||
| 4 | 25 | 22.8 | 33.4 | 14.4 | 59.8 | ||||
| 5 | 53.4 | 6.1 | 9.4 | 19 | 2.1 | ||||
| Sum | 100 | 100 | 100 | 100 | 100 | ||||
| Substance Dissolution, %/g (from a 20-g Sample) | |||||||||
| 1 | 0.77/0.16 | 1.62/0.33 | 2.39/0.48 | 2.52/0.51 | 1.35/0.27 | ||||
| 2 | 1.15/0.24 | 4.31/0.88 | 3.73/0.75 | 3.06/0.62 | 1.7/0.34 | ||||
| 3 | 2.44/0.51 | 1.64/0.33 | 5.02/1.01 | 8.1/1.64 | 10.2/2.04 | ||||
| 4 | 2.15/0.45 | 6.42/1.31 | 9.4/1.89 | 4.11/0.83 | 3/0.6 | ||||
| 5 | 86.6/18.1 | 73.73/15.04 | 71.69/14.41 | 70.58/14.3 | 74.55/14.91 | ||||
| Sum | 93.1/19.46 | 87.72/17.89 | 92.23/18.54 | 88.37/17.9 | 90.8/18.16 | ||||
| Borehole ID | GGS2-11 | Average | |||||||
| Sampling Depth, m | 66.7–66.8 | 75.2–75.3 | 83.9–84.0 | 94.0–94.1 | 99.5–99.6 | GGS2-10-11 | |||
| Fraction a | Uranium Isotope Activity Ratio 234U:238U | ||||||||
| 1 | 1.73 ± 0.26 | 2.02 ± 0.3 | 3.98 ± 0.6 | 1.82 ± 0.26 | 1.67 ± 0.25 | 2.39 ± 0.36 | |||
| 2 | 0.58 ± 0.09 | 0.49 ± 0.07 | 2.67 ± 0.4 | 2.97 ± 0.45 | 1.04 ± 0.15 | 1.88 ± 0.28 | |||
| 3 | 0.89 ± 0.13 | 2.68 ± 0.4 | 1.79 ± 0.27 | 1.43 ± 0.21 | 1.16 ± 0.18 | 1.53 ± 0.23 | |||
| 4 | 1 ± 0.15 | 1.51 ± 0.23 | 0.84 ± 0.13 | 1.52 ± 0.23 | 0.98 ± 0.14 | 1.35 ± 0.2 | |||
| 5 | 0.91 ± 0.14 | 1.04 ± 0.16 | 1.2 ± 0.18 | 0.8 ± 0.15 | 1.26 ± 0.19 | 1.09 ± 0.16 | |||
| Uranium Content in the Entire Volume of the Rock, ppb | |||||||||
| 1 | 54.7 ± 8.2 | 57.3 ± 8.6 | 33.2 ± 5 | 63.4 ± 8.8 | 1074 ± 161 | 149 ± 22 | |||
| 2 | 231 ± 35 | 119 ± 18 | 142 ± 21 | 296 ± 36 | 1343 ± 201 | 263 ± 39 | |||
| 3 | 31.7 ± 4.8 | 106 ± 16 | 39.6 ± 5.9 | 54.6 ± 9.6 | 252 ± 38 | 95 ± 14 | |||
| 4 | 69.6 ± 10.4 | 94.7 ± 14 | 352 ± 53 | 263 ± 39 | 310 ± 46 | 193 ± 29 | |||
| 5 | 1050 ± 157 | 177 ± 27 | 773 ± 116 | 593 ± 76 | 940 ± 141 | 398 ± 60 | |||
| Sum | 1437 ± 215 | 554 ± 94 | 1339 ± 201 | 1270 ± 168 | 3919 ± 587 | 1098 ± 165 | |||
| Uranium Content in the Entire Volume of the Rock, % | |||||||||
| 1 | 3.8 | 10.3 | 2.5 | 5 | 27.4 | 9.72 | |||
| 2 | 16.1 | 21.5 | 10.6 | 23.3 | 34.2 | 21.6 | |||
| 3 | 2.2 | 19.1 | 3 | 4.3 | 6.5 | 13.12 | |||
| 4 | 4.8 | 17.1 | 26.2 | 20.7 | 7.9 | 23.21 | |||
| 5 | 73.1 | 32 | 57.7 | 46.7 | 24 | 32.35 | |||
| Sum | 100 | 100 | 100 | 100 | 100 | 100 | |||
| Substance Dissolution, %/g (from a 20-g Sample) | |||||||||
| 1 | 1.3/0.26 | 1/0.2 | 1.8/0.36 | 1.52/0.3 | 1.93/0.39 | 1.62/0.33 | |||
| 2 | 1.6/0.31 | 1.4/0.28 | 0.13/0.026 | 2.13/0.42 | 1.03/0.21 | 2.03/0.41 | |||
| 3 | 1/0.21 | 0.6/0.12 | 0.12/0.025 | 0.86/0.17 | 1.28/0.26 | 3.13/0.63 | |||
| 4 | 1/0.19 | 1.3/0.25 | 0.6/0.12 | 3.5/0.69 | 1.17/0.23 | 3.21/0.66 | |||
| 5 | 92.9/18.6 | 94.2/18.8 | 96.4/19.3 | 92/18.1 | 93.3/18.7 | 84.59/17.03 | |||
| Sum | 97.8/19.6 | 98.5/19.7 | 99/19.8 | 98.6/19.7 | 98.8/19.8 | 94.49/19.05 | |||
a 1—Adsorbed trace materials and carbonate, 2—Amorphous minerals of Fe, 3—Crystalline iron minerals, 4—Clay and some refractory minerals, 5—All remaining resistant minerals
Table 2.
Distribution of uranium and measured 234U:238U activity ratios in adsorbed trace materials.
Table 2.
Distribution of uranium and measured 234U:238U activity ratios in adsorbed trace materials.
| ID | Rock Type | Depth, m | U, ppm | 234U:238U | Substance Dissolution, %/g (from a 20-g Sample) | U, ppb | U, % | 234U:238U |
|---|---|---|---|---|---|---|---|---|
| In the Entire Volume of the Rock | In Adsorbed Trace Materials | |||||||
| 1P-4 | Sandstones | 149 | 1.01 ± 0.15 | 0.99 ± 0.14 | 1.44/0.29 | 22.9 ± 3.4 | 2.3 | 2.02 ± 0.28 |
| 2P-4 | Sandstones | 195 | 1.22 ± 0.18 | 0.80 ± 0.12 | 1.58/0.32 | 12.9 ± 1.9 | 1.1 | 4.25 ± 0.64 |
| 3P-4 | Sandstones | 202 | 1.58 ± 0.23 | 0.83 ± 0.12 | 0.51/0.1 | 16 ± 2.4 | 1 | 3.27 ± 0.48 |
| 4P-4 | Sandstones | 208 | 1.65 ± 0.24 | 1.26 ± 0.18 | 1.43/0.29 | 25.8 ± 3.8 | 1.6 | 2.10 ± 0.29 |
| 5P-4 | Sandstones | 213 | 1.03 ± 0.14 | 1.35 ± 0.2 | 1.42/0.28 | 18.1 ± 2.6 | 1.8 | 1.83 ± 0.26 |
| 10op | Siltstones | 20.5 | 1.29 ± 0.18 | 1.43 ± 0.22 | 0.93/0.19 | 11.5 ± 1.7 | 0.9 | 1.58 ± 0.23 |
| 11op | Siltstones | 72.8 | 1.79 ± 0.25 | 1.12 ± 0.16 | 1.62/0.32 | 26.2 ± 3.9 | 1.5 | 2.18 ± 0.3 |
| 12op | Siltstones | 71.7 | 2.81 ± 0.41 | 1.32 ± 0.18 | 1.26/0.25 | 17.6 ± 2.6 | 0.6 | 2.49 ± 0.36 |
| 13op | Argillite | 82.4 | 1.62 ± 0.23 | 1.29 ± 0.17 | 2.12/0.42 | 404 ± 59 | 24.9 | 1.86 ± 0.27 |
| 14op | Siltstones | 109.8 | 2.35 ± 0.35 | 1.31 ± 0.18 | 1.33/0.27 | 99 ± 14 | 4.2 | 1.94 ± 0.29 |
| 16op | Siltstones | 92 | 1.20 ± 0.16 | 0.83 ± 0.12 | 0.61/0.12 | 225 ± 32 | 18.8 | 1.68 ± 0.24 |
| 17op | Siltstones | 92 | 1.08 ± 0.15 | 1.94 ± 0.28 | 0.58/0.12 | 38 ± 5.7 | 3.5 | 1.44 ± 0.21 |
| 18op | Siltstones | 94 | 1.50 ± 0.2 | 1.23 ± 0.16 | 0.92/0.18 | 266 ± 39 | 17.7 | 1.50 ± 0.22 |
| 21op | Siltstones | 73.4 | 1.66 ± 0.24 | 0.98 ± 0.15 | 1.73/0.34 | 274 ± 41 | 16.5 | 3.76 ± 0.54 |
| 25op | Sandstones | 59 | 1.38 ± 0.19 | 1.04 ± 0.14 | 0.73/0.14 | 9.2 ± 1.4 | 0.7 | 1.67 ± 0.23 |
Publisher’s Note: MDPI stays neutral with regard to jurisdictional claims in published maps and institutional affiliations. |
© 2021 by the authors. Licensee MDPI, Basel, Switzerland. This article is an open access article distributed under the terms and conditions of the Creative Commons Attribution (CC BY) license (https://creativecommons.org/licenses/by/4.0/).
Share and Cite
MDPI and ACS Style
Malov, A.I.; Zykov, S.B.; Tyshov, A.S. Distribution of Uranium Isotopes in Sandy Deposits by Sequential Extraction. Minerals 2021, 11, 467. https://doi.org/10.3390/min11050467
AMA Style
Malov AI, Zykov SB, Tyshov AS. Distribution of Uranium Isotopes in Sandy Deposits by Sequential Extraction. Minerals. 2021; 11(5):467. https://doi.org/10.3390/min11050467
Chicago/Turabian StyleMalov, Alexander I., Sergey B. Zykov, and Alexey S. Tyshov. 2021. "Distribution of Uranium Isotopes in Sandy Deposits by Sequential Extraction" Minerals 11, no. 5: 467. https://doi.org/10.3390/min11050467
Note that from the first issue of 2016, this journal uses article numbers instead of page numbers. See further details here.