Nonlinearity of Subtidal Estuarine Circulation in the Pearl River Estuary, China
 Hongzhou Xu
 Jian Shen
 Dongxiao Wang
 Lin Luo
 Bo Hong
- 1Institute of Deep-Sea Science and Engineering, Chinese Academy of Sciences, Sanya, China
- 2Southern Marine Science and Engineering Guangdong Laboratory (Zhuhai), Zhuhai, China
- 3Virginia Institute of Marine Science, College of William and Mary, Gloucester Point, VA, United States
- 4School of Marine Sciences, Sun Yat-sen University, Zhuhai, China
- 5State Key Laboratory of Tropical Oceanography, South China Sea Institute of Oceanology, Chinese Academy of Sciences, Guangzhou, China
- 6School of Civil Engineering and Transportation, South China University of Technology, Guangzhou, China
The Pearl River Estuary (PRE) is a bell-shaped estuary with a narrow deep channel and wide shoals. This unique topographic feature leads to different dynamics of the subtidal estuarine circulation (SEC) in the PRE compared with a narrow and straight estuary. In this study, the nonlinear dynamics of the SEC in the PRE under mean circumstance are analyzed by using a validated 3D numerical model. Model results show that the nonlinear advections reach leading order in the along-channel momentum balance. Modulated by tide, the nonlinear advections show significant temporal variations as they have much larger values during spring tide than that during neap tide. Unlike straight and narrow estuaries, both tidally and cross-sectionally averaged axial and lateral advections play important roles in driving the SEC in the PRE in which the axial advection dominates the nonlinear effect, but the two nonlinear terms balance each other largely resulting in a reduced nonlinear effect. Despite this, the total nonlinear advection is still comparable with other terms, and it acts as the baroclinic pressure to reinforce the SEC, especially during the ebb tide, suggesting a flood–ebb asymmetry of the nonlinear dynamics in the PRE. In addition, diagnostic analyses of the along-channel vorticity budget show that nonlinear advections also make significant contribution to drive the lateral circulation in the PRE as Coriolis and baroclinic pressure terms, indicating complex dynamics of the circulation in the PRE.
Introduction
The typical estuarine circulation has been characterized by a linear formula ever since a half-century ago when it was theorized that along-channel residual estuarine circulation is controlled by a balance between the horizontal pressure gradient and stress divergence (Pritchard, 1956; Hansen and Rattray, 1965; Chatwin, 1976):
where, ρ0 is the water density, Km is the vertical eddy viscosity, and p and u are the tidally averaged pressure gradient and along-channel velocity, respectively. This classic theory was representative for the leading-order estuarine dynamics in the literature. Using this momentum balance and assumption of constant horizontal density gradient and vertical eddy viscosity, a linear analytical solution of the strength of residual estuarine circulation can be obtained from Eq. 1 as (Hansen and Rattray, 1965, namely HR65 hereafter):
where is the along-channel density gradient that can be represented as a function of the along-channel salinity gradient , H is the water depth, and β is a constant of 7.7 × 10⁻⁴. This equation suggests that the residual estuarine circulation is driven by the baroclinic pressure gradient against with vertically and tidally averaged vertical mixing.
However, the above linear framework has been challenged by a number of recent studies, which show that subtidal estuarine circulation (SEC) in a nature estuary can be impacted by nonlinear advection, tidal asymmetry, uneven bathymetry, and bottom stress under influence of tide and earth rotation (Trowbridge et al., 1999; Geyer et al., 2000; Lacy et al., 2003; Chen et al., 2009; Huijts et al., 2009; Cheng, 2014; Cheng et al., 2017, 2019). Lateral advection (cross-channel direction) caused by estuarine secondary circulation is regarded as having an important role on SEC that has been found in many estuaries by model simulation and observation. Lerczak and Geyer (2004) estimated the contribution of lateral advection on SEC in an idealized estuary. Their results indicated that lateral advection played a leading order in driving along-channel estuarine circulation, and its contribution can be even larger than the along-channel density gradient under weak stratification conditions. Scully et al. (2009) studied the mechanisms of residual estuarine circulation in the Hudson River estuary and found that the along-channel momentum dynamics were mainly balanced by three terms, i.e., the pressure gradient, stress divergence, and lateral advection, in which the lateral advection played a similar role as the baroclinic pressure gradient to enhance the exchange flow in this estuary. Using in situ data, Basdurak and Valle-Levinson (2012) estimated nonlinear advection at the lower James River estuary. Their results indicated that lateral advection has the same order with other terms through along-channel momentum diagnosis.
Moreover, although longitudinal advection (along-channel direction) is limited in a long and straight estuary (Lerczak and Geyer, 2004; Cheng and Valle-Levinson, 2009), it can rise to be a leading order term for impacting SEC in an estuary with width-varied or curved channel. Savenije et al. (2008) systematically studied tide dynamics of short convergent estuaries where tidal energy can spread upstream equally or increasingly suggesting upstream augment of tidal current and non-negligible longitudinal advection based on continuity equation. In addition, tidal asymmetry between ebb–flood can cause effective longitudinal advection to impact residual flow in an estuary (Valle-Levinson and Guo, 2009). Martin and MacCready (2011) found that the longitudinal advection became leading terms at the region with varied widths in the Strait of Juan de Fuca in which they stated topography and tide were the two main factors, and about 90% of longitudinal advection was induced by tidal advection due to tidal asymmetry. Basdurak and Valle-Levinson (2012) studied the contribution of nonlinear advection to along-channel exchange flow at the bend region connecting James River and Chesapeake Bay. Their results revealed that longitudinal advection has the same magnitude as lateral advection in this region with varying streamwise bathymetries, and it played as a baroclinic pressure term to reinforce the exchange flow. All the above studies provide insight into the roles of lateral and longitudinal advections on SEC in estuaries.
The Pearl River Estuary (PRE) is a short convergent estuary with wide shoals (Figure 1). Tidal energy is intensified, and tidal range is amplified significantly with the tidal wave propagating upstream along the PRE (Mao et al., 2004), indicating active tidal nonlinearity in this estuary (Wong et al., 2003a,b). Dong et al. (2004) used sparse observed data to diagnose the dynamics of SEC in the PRE based on steady-state linear momentum equation and pointed out that pressure, bottom stress, and Coriolis were leading terms in the momentum balance. However, the mechanism of SEC in this estuary was rarely addressed since then. Most studies were focused on the saltwater intrusion, particle transport, and freshwater plume in the PRE (Ji et al., 2011; Zhou et al., 2012; Lin et al., 2019; Hong et al., 2020a,b). Recently, Pan et al. (2020) pointed out that linear momentum terms played important roles to reinforce lateral convergence and divergence in the PRE based on a numerical simulation. Apparently, they all ignored the contribution of nonlinear advection on driving SEC in the PRE. As the SEC plays an important role on pollutant and sediment transport in the PRE, it receives our focus as we investigate the nonlinearity of the subtidal circulation in this estuary. In this study, we applied a numerical model to the PRE to estimate the contribution of nonlinear advection in the momentum balance equation for controlling the SEC quantitatively and discuss their mechanisms in this estuary.
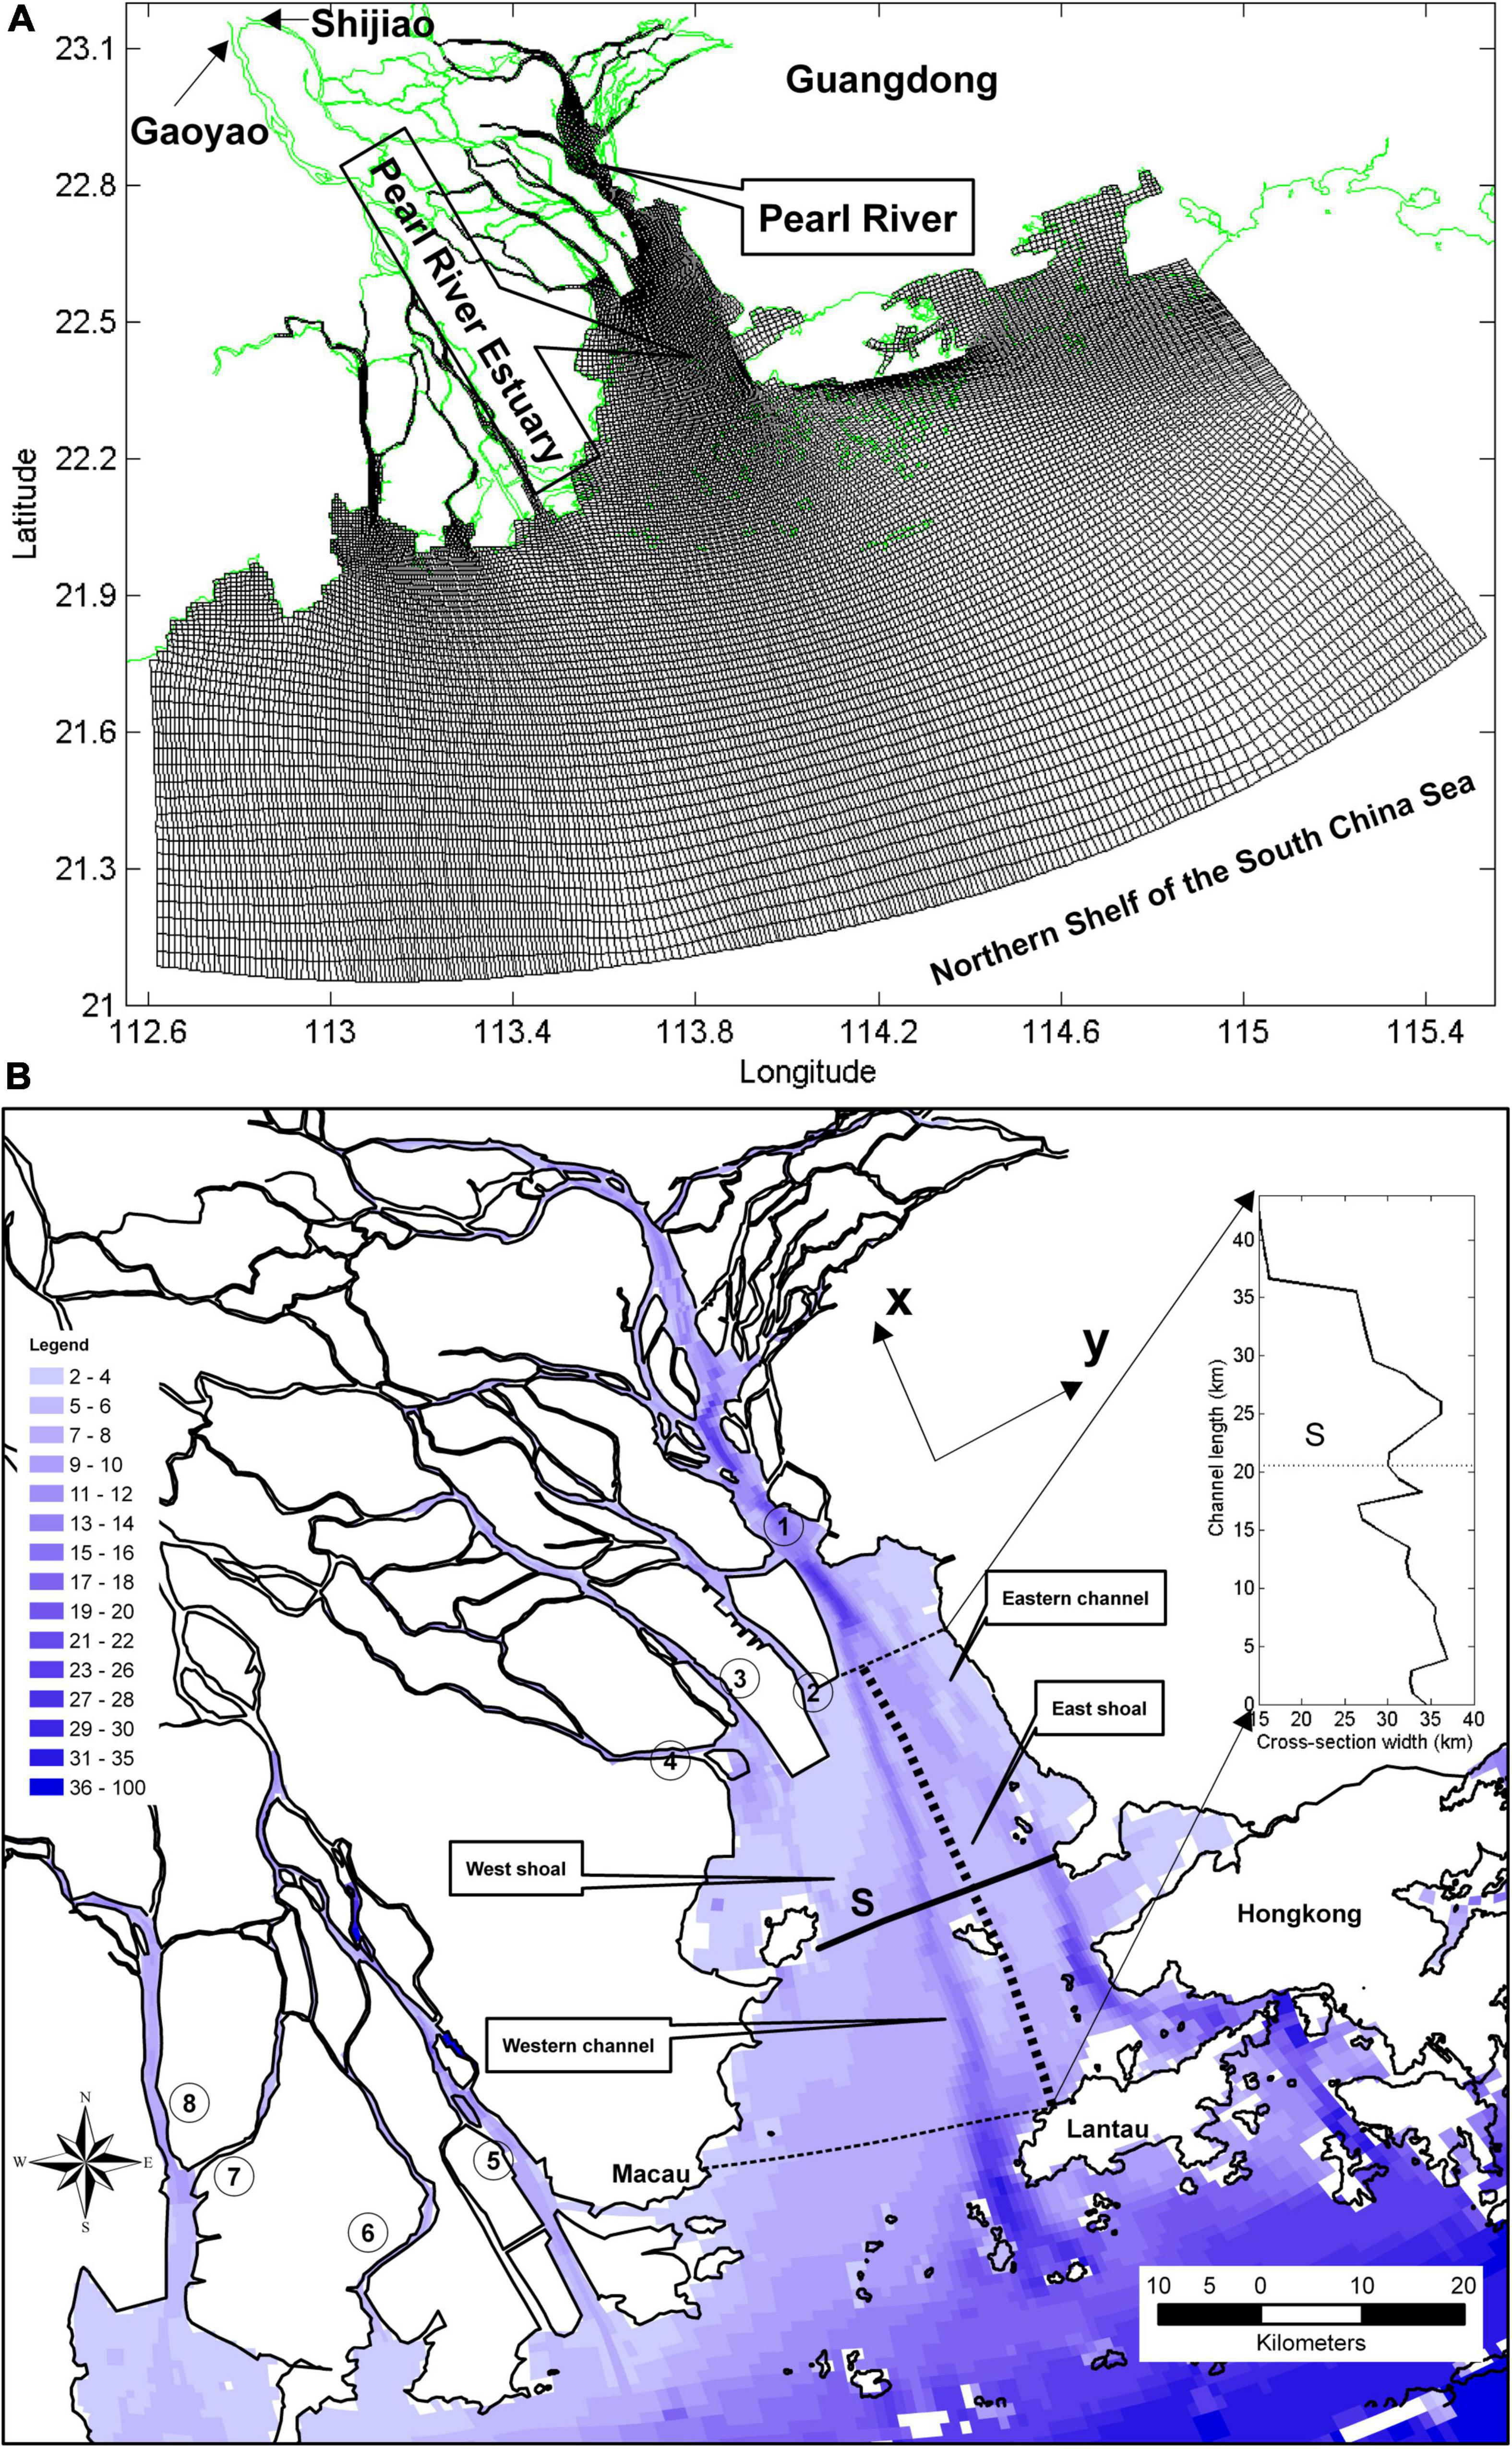
Figure 1. (A) Model grids (black line). Green line represents the coastal line at the Pearl River Estuary (PRE) and its adjacent coastal region. Gaoyao and Shijiao are the two river flow gauge stations. (B) Bathymetry at the model region. Black line represents the coastal line at the PRE. The numbers in circles represent the mouths of the eight inlets in the PRE, ①: Humen, ②: Jiaomen, ③: Hongqimen, ④: Henmen, ⑤: Modaomen, ⑥: Jitimen, ⑦: Hutiaomen, and ⑧: Yamen. Solid lines are model sample cross-channel section S at the middle PRE. Thick dashed line represents the boundary between the western channel and eastern channel of the PRE. Thick dashed lines represent south and north boundaries of the target area in this study. The inserted image in panel (B) represents the variation of channel width (black line) from south (0 km) to north (44 km) of the target area. The dashed lines in the inserted image represent the locations of cross-channel section S. The x–y arrow in the panel (B) represents the coordinates in this study, the x-coordinate indicates the along-channel direction and points from south to north, and the y-coordinate indicates the cross-channel direction and points from west to east.
Study Area and Model Configuration
The PRE, located in South China, originates from the Pearl River and connects with the northern shelf of the South China Sea (Figure 1). It is the third largest river in China, and its drainage basin has been regarded as one of the most developed regions. It elongates about 60 km from its head (near the mouth of Humen) to its mouth (between Macau and Lantau Islands) and gradually widens from 10 to 35 km (Figure 1B). Its depths vary from 2.0 m at the shoal to 30 m at the deep channel. There are two channels (namely, the western channel and the eastern channel) in the PRE connected by a wide shoal (Figure 1B) in which the western channel is the main channel connecting with the coast. On average, there are about 9,000 m3/s of freshwater discharge from the Shijiao and Gaoyao gauges emptying into the PRE drainage basin and the northern shelf of the South China Sea through eight inlets (Figure 1B). The PRE is defined as a micro-tidal, partially mixed estuary with a 1.0–1.7 m mean tidal range propagating from its coast into the estuary (Wong et al., 2003a; Mao et al., 2004). The main tidal constituents include the semi-diurnal M2 and S2 components, and the diurnal K1 and O1 components. Although the tidal amplitude is small along the coast of the PRE, the tidal energy is intensified, and tidal range is amplified significantly with tidal wave propagating upstream due to the convergent channel along the PRE (Mao et al., 2004). At the surface, the PRE is dominated by the Asian Monsoon in which northeasterly and southwesterly winds prevail during winter and summer, respectively.
A 3D numerical model EFDC [Environmental Fluid Dynamic Code (Hamrick, 1996)] with an orthogonal curvilinear grid in the horizontal direction and stretched, terrain-following coordinates in the vertical are used in this study. The model resembles the widely used Princeton Ocean Model (POM; Blumberg and Mellor, 1987) in both physics and the computational scheme, and it has been widely applied to many estuaries, lakes, and coastal bays (Lin and Kuo, 2003; Shen and Haas, 2004; Park et al., 2005; Xu et al., 2008a,b; Xia et al., 2010; Gong and Shen, 2011; Hong and Shen, 2012; Hong et al., 2020b). The model solves the primitive equations for a water body with free surface and incorporates a modified Mellor–Yamada’s level-2.5 turbulence closure sub-model (Mellor and Yamada, 1982; Galperin et al., 1988). The detailed model description can be found in Hamrick (1996).
The model domain is configured to cover the Pearl River Estuary, with its river networks and adjacent Guangdong coastal shelf extending longitudinally from 112.6 to 115.5°E and latitudinally from 21.1 to 23.1°N. The model grid size ranges from 100 m in the inlets to 3 km in the coastal ocean. The model has 263 by 246 grid cells in the horizontal and 20 layers in the vertical. The bathymetry depth data used in the model was provided by the Sun Yat-sen University in Guangzhou. There are three open boundaries along the east, south, and west of the model domain, and eight river boundaries located at the head of the eight inlets (Figure 1A). The target area in this study is the western channel in the PRE, which extends from the mouth of Jiaomen to the north of Lantau Island in longitudinal coordinates (marked by the thin dashed lines in Figure 1B) and from the west bank to its east shoal in lateral coordinates (marked by the thick dashed line in Figure 1B). The total length of this area is about 44 km. The widths of the cross-channel sections over the western and eastern channels vary from 15 km at the northernmost section to 35 km at the southernmost section (inserted image in Figure 1B).
The model calibration and validation can be found in Hong et al. (2020a). In this study, a climatologic case was simulated to study the SEC in the PRE. For the climatologic case, four main tidal constituents, namely, M2, S2, K1, and O1, from the NaoTide data set1 were utilized to force the model open boundary. A radiation boundary condition was used at the open boundary that allowed waves to propagate through the boundary. This dataset has been applied for tide simulation at the coastal region of China successfully (Wu et al., 2011). In addition, the WOA01 climatologic mean salinity data were specified in the vertical at the open boundary. Salinity at the open boundary was calculated by the model during ebb using an upwind scheme and was linearly interpolated between ebb concentrations and specified open boundary conditions for a short interval before being forced by the specified open boundary values. A multi-year mean river discharge of 9,000 m3/s was used at the river boundary, and freshwater discharges were distributed to the eight inlets based on flow ratios in Table 1 from the river boundary (provided by the Pearl River Water Resource Conservancy). The wind effect was not considered in this study. A constant temperature was designated for the simulation. The model was first spun-up for 90 days to obtain the initial condition. Then, it was run for 50 days after the model reached steady state for the dynamic analysis. Model results were low-pass filtered with a 35-h cutoff to obtain the subtidal variables in the estuary.

Table 1. Freshwater discharge ratio for each inlet.
The Subtidal Estuarine Circulation
In an estuary, the SEC is mainly sheared in the vertical under weak friction conditions (Lerczak and Geyer, 2004), and vertical exchange flow is dominated by river flow and density-driven exchange flow as (Hansen and Rattray, 1965; MacCready, 2004; Shen and Lin, 2006):
where the overbar and bracket represent depth and tidal averages, uR = QR/A indicates the net flow caused by the river discharge QR (A is the cross-sectional area), and and P2 = 1−9ξ2−8ξ3 are parameters varying with the dimensionless vertical coordinate , where z is the dimensional vertical coordinate. Eq. 3 suggested a two-layer SEC in which freshwater flow out at the surface and saltwater intrude at the bottom, and the strength of the exchange flow is:
which gives a constant river discharge, Udiff, which is dependent on uE completely, i.e., baroclinic circulation. Similarly, salinity stratification in an estuary can be expressed as function of uE. The vertical variation of salinity is (MacCready, 2004; Shen and Lin, 2006):
where and are parameters varying with ξ. The salinity stratification is:
Eqs 2, 5, and 6 suggested that the exchange flow and salinity stratification in an estuary are determined by horizontal density gradient and vertical mixing in which horizontal density gradient enhances exchange flow and salinity stratification while vertical mixing reduces them (Hansen and Rattray, 1965).
The spring-neap variation of SEC and saltwater intrusion in the PRE has been addressed by many previous studies (Dong et al., 2004; Wong et al., 2004; Hong et al., 2016, 2020b). Here, spring-neap variation of the SEC and salinity along cross-channel section S and the thalweg of the western channel in the middle PRE are shown in Figures 2, 3 as physical background references for this paper. Two-layer structure of SEC dominate the PRE with saltwater intruding landward at the bottom layer and freshwater emptying out at the surface layer. Spring-neap tidal variations of the exchange flow and salinity are significant. At the middle PRE (section S), the exchange flow Udiff is about 11.0 cm/s at the peak neap, while it only reaches 6.0 cm/s at peak spring. Driven by the stronger exchange flow during neap tide, the isohalines extend farther landward and more saltwater intrude landward compared with those during spring tide resulting in about 20.0 and 10.0 psu of salinity vertical difference (Sdiff) at the two peak periods, respectively, at the middle PRE. Although the exchange flow and salinity stratification are reduced largely during spring tide, no significant decrease of the along-channel density gradient is observed from the upper to middle PRE (Figure 3F). The along-channel density gradient increases almost linearly from the head to the mouth of the PRE during neap tide.
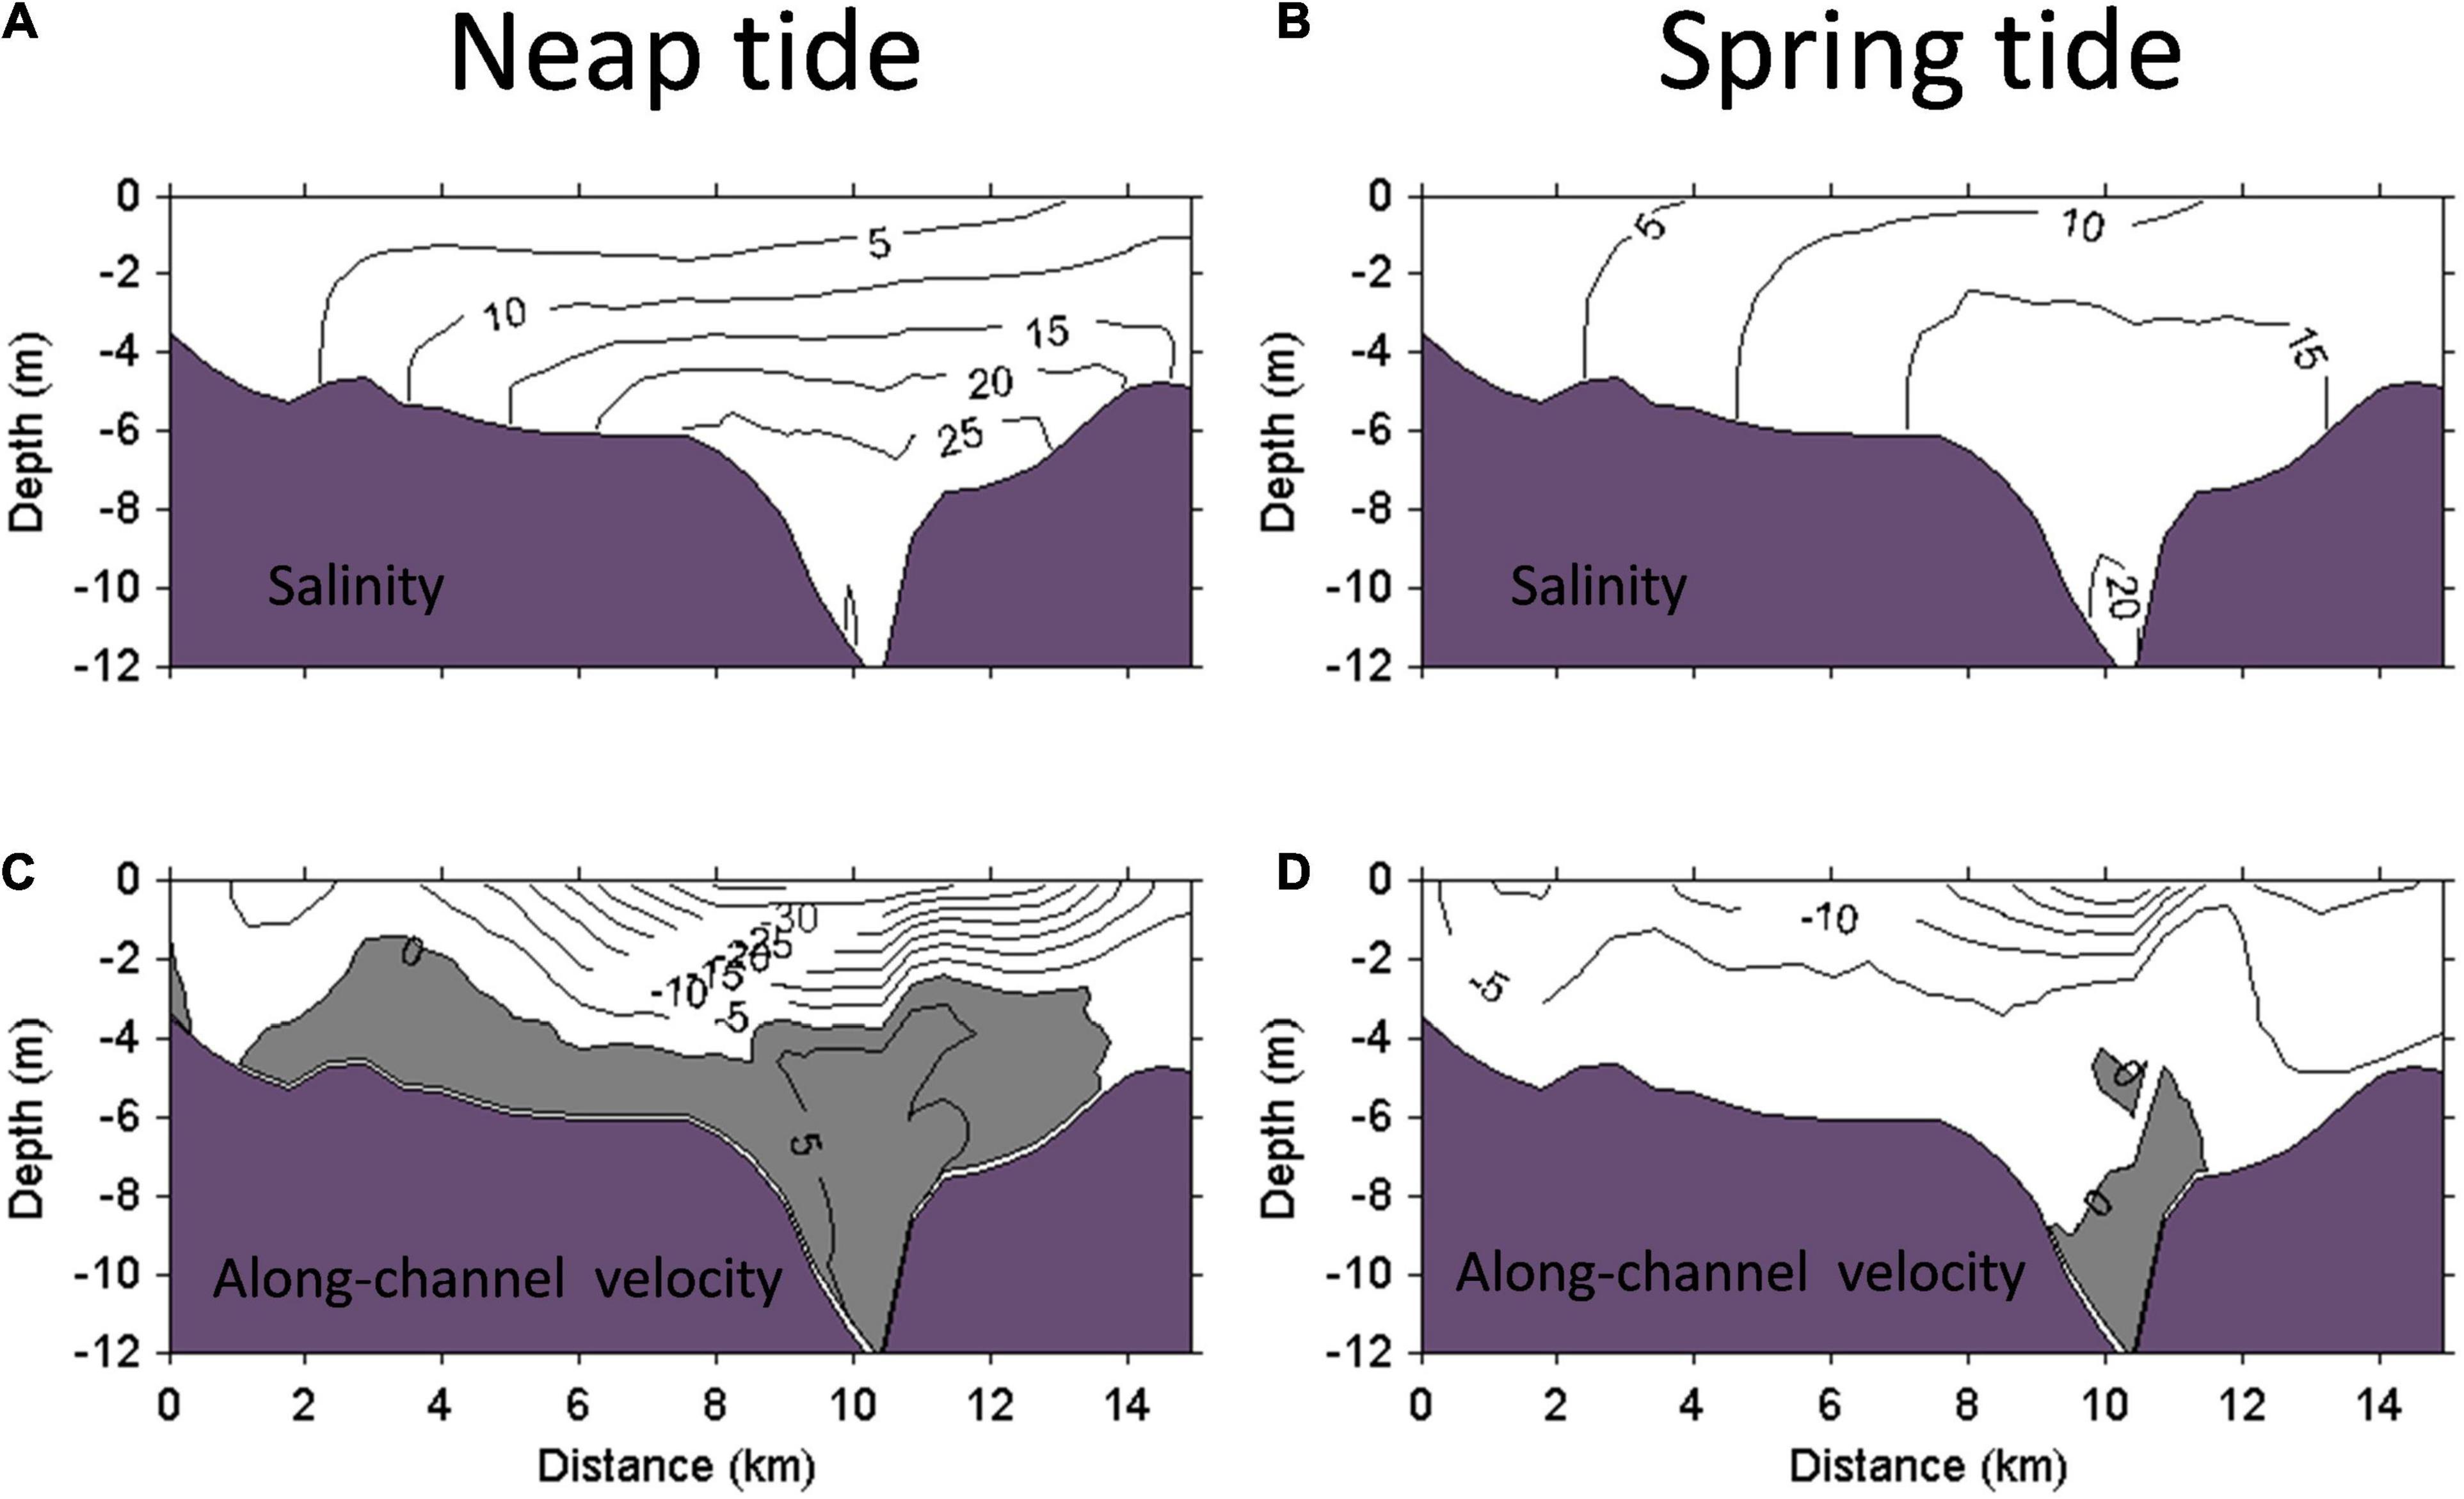
Figure 2. Model simulated subtidal salinity at maximal neap (A) and spring (B) tides and along-channel current velocity (cm/s) at maximal neap (C) and spring (D) tides along the cross-channel section S. The positive velocity indicates along-channel landward current. The x-axis represents the distance from the west shoal to the east shoal as one looks into the PRE.
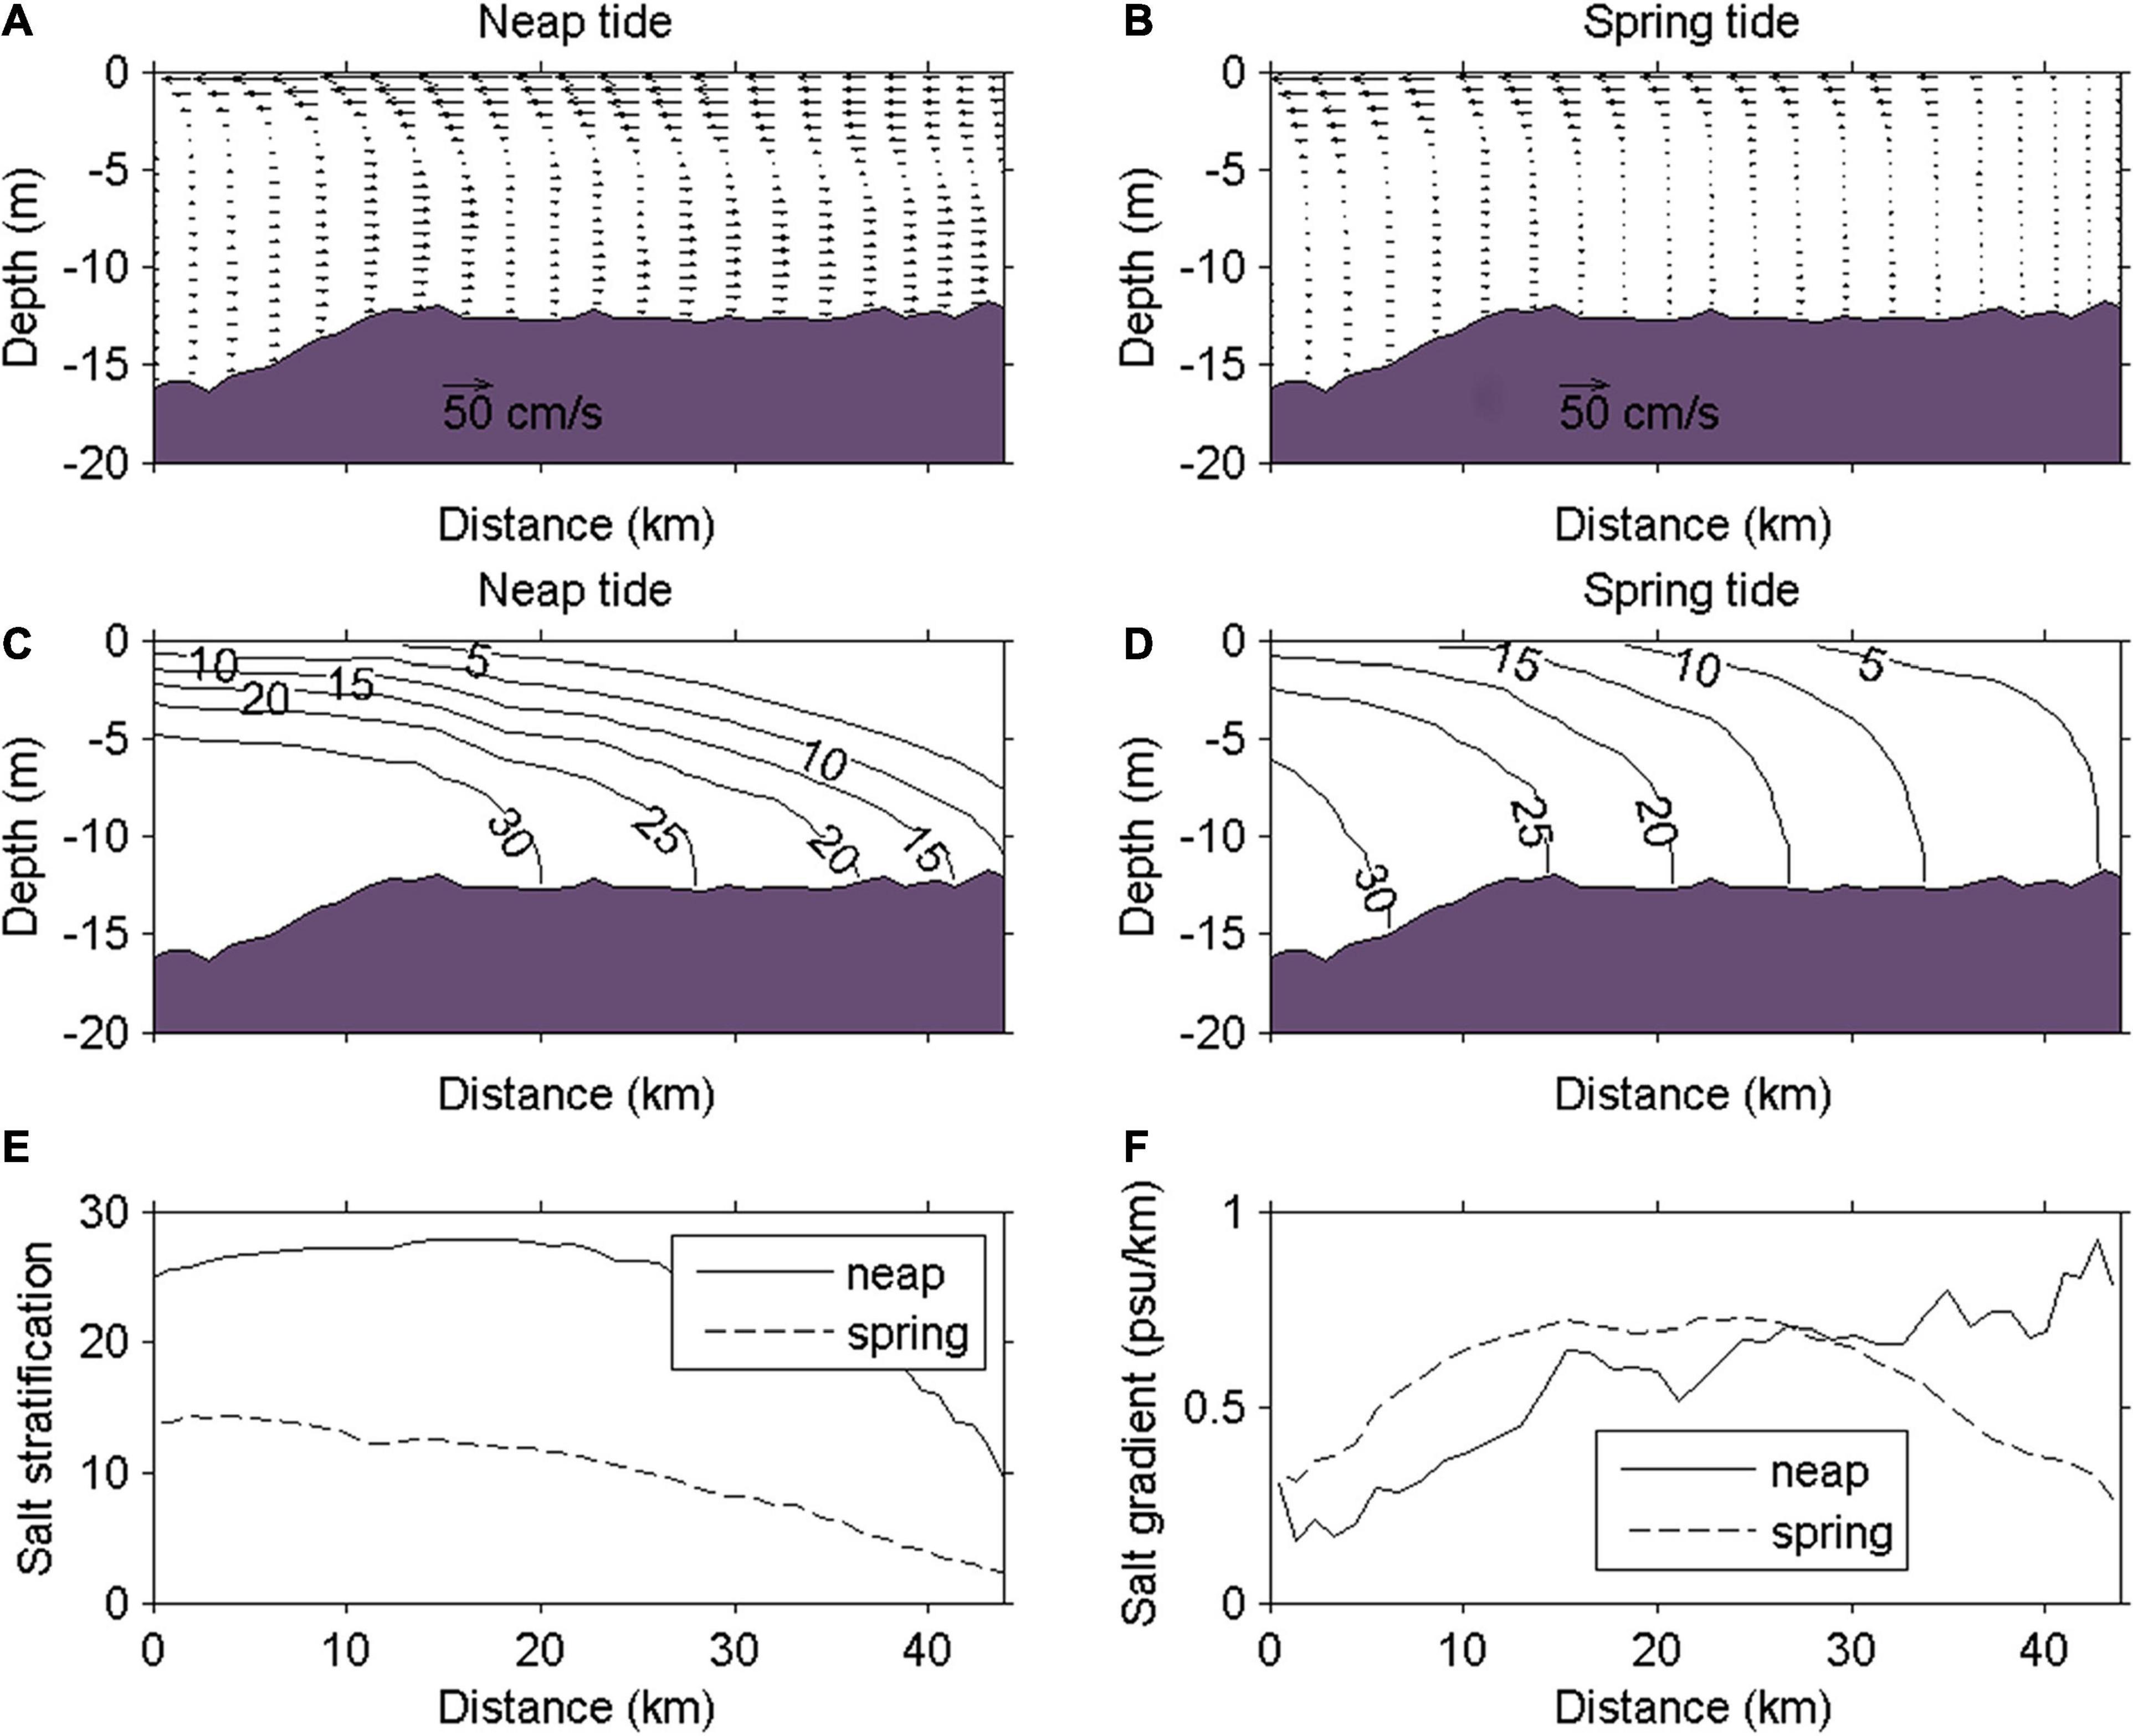
Figure 3. Subtidal along-channel current velocity (cm/s) at maximal (A) neap and (B) spring tides, subtidal salinity at maximal (C) neap and (D) spring tides, and subtidal salinity stratification (E) and along-channel salt gradient (F) at maximal neap and spring tides along the west deep channel. The x-axis represents the distance from the mouth (0 km) to the head (44 km) of the PRE.
Along-Channel Momentum Budget
In this study, along-channel subtidal momentum fluxes (x-direction and positive value is pointed northward) are calculated to diagnose estuarine circulation dynamics in the PRE. It is written as:
The term on the left-hand side is local acceleration. The first two terms on the right-hand side (rhs) are barotropic and baroclinic pressures. The third term on the rhs is nonlinear axial advection. The fourth term on the rhs is the sum of nonlinear lateral and vertical advections that is summarized as lateral advection. The remaining two terms on the rhs are Coriolis and stress divergence. The angle-brackets denote tidal average subtidal components obtained by a 35-h cutoff window. To explore and qualify the relative contributions of along-channel momentum terms on the SEC in the PRE, the cross-sectional average of the absolute value for each term is compared and calculated as:
in which ϕ denotes each term in Eq. 7, and A is the cross-sectional area. The temporal variations of ψ along the western channel are contoured in Figure 4. Although the PRE is a wide estuarine, our results indicate the effects of the tidally averaged Coriolis, and the local acceleration terms are an order of magnitude smaller than the other leading terms, and thus, they are not shown in the plot. The dominant terms are barotropic and baroclinic pressures, vertical diffusion, and axial and lateral advections. Not surprisingly, the lateral advection reaches the leading order in the momentum equation due to the lateral circulation and differential flux of along-channel current. However, the axial advection also has the same order as the lateral advection, and it even contributes more to the along-channel dynamics than the baroclinic pressure in the PRE, which is usually negligible in narrow and straight estuaries (Lerczak and Geyer, 2004; Cheng and Valle-Levinson, 2009; Scully et al., 2009). The dimensionless scales of advection terms may help to understand the robust characteristics of equal contribution of the axial advection to the lateral advection for the along-channel dynamics in a wide and short estuary. Their scales can be written as:
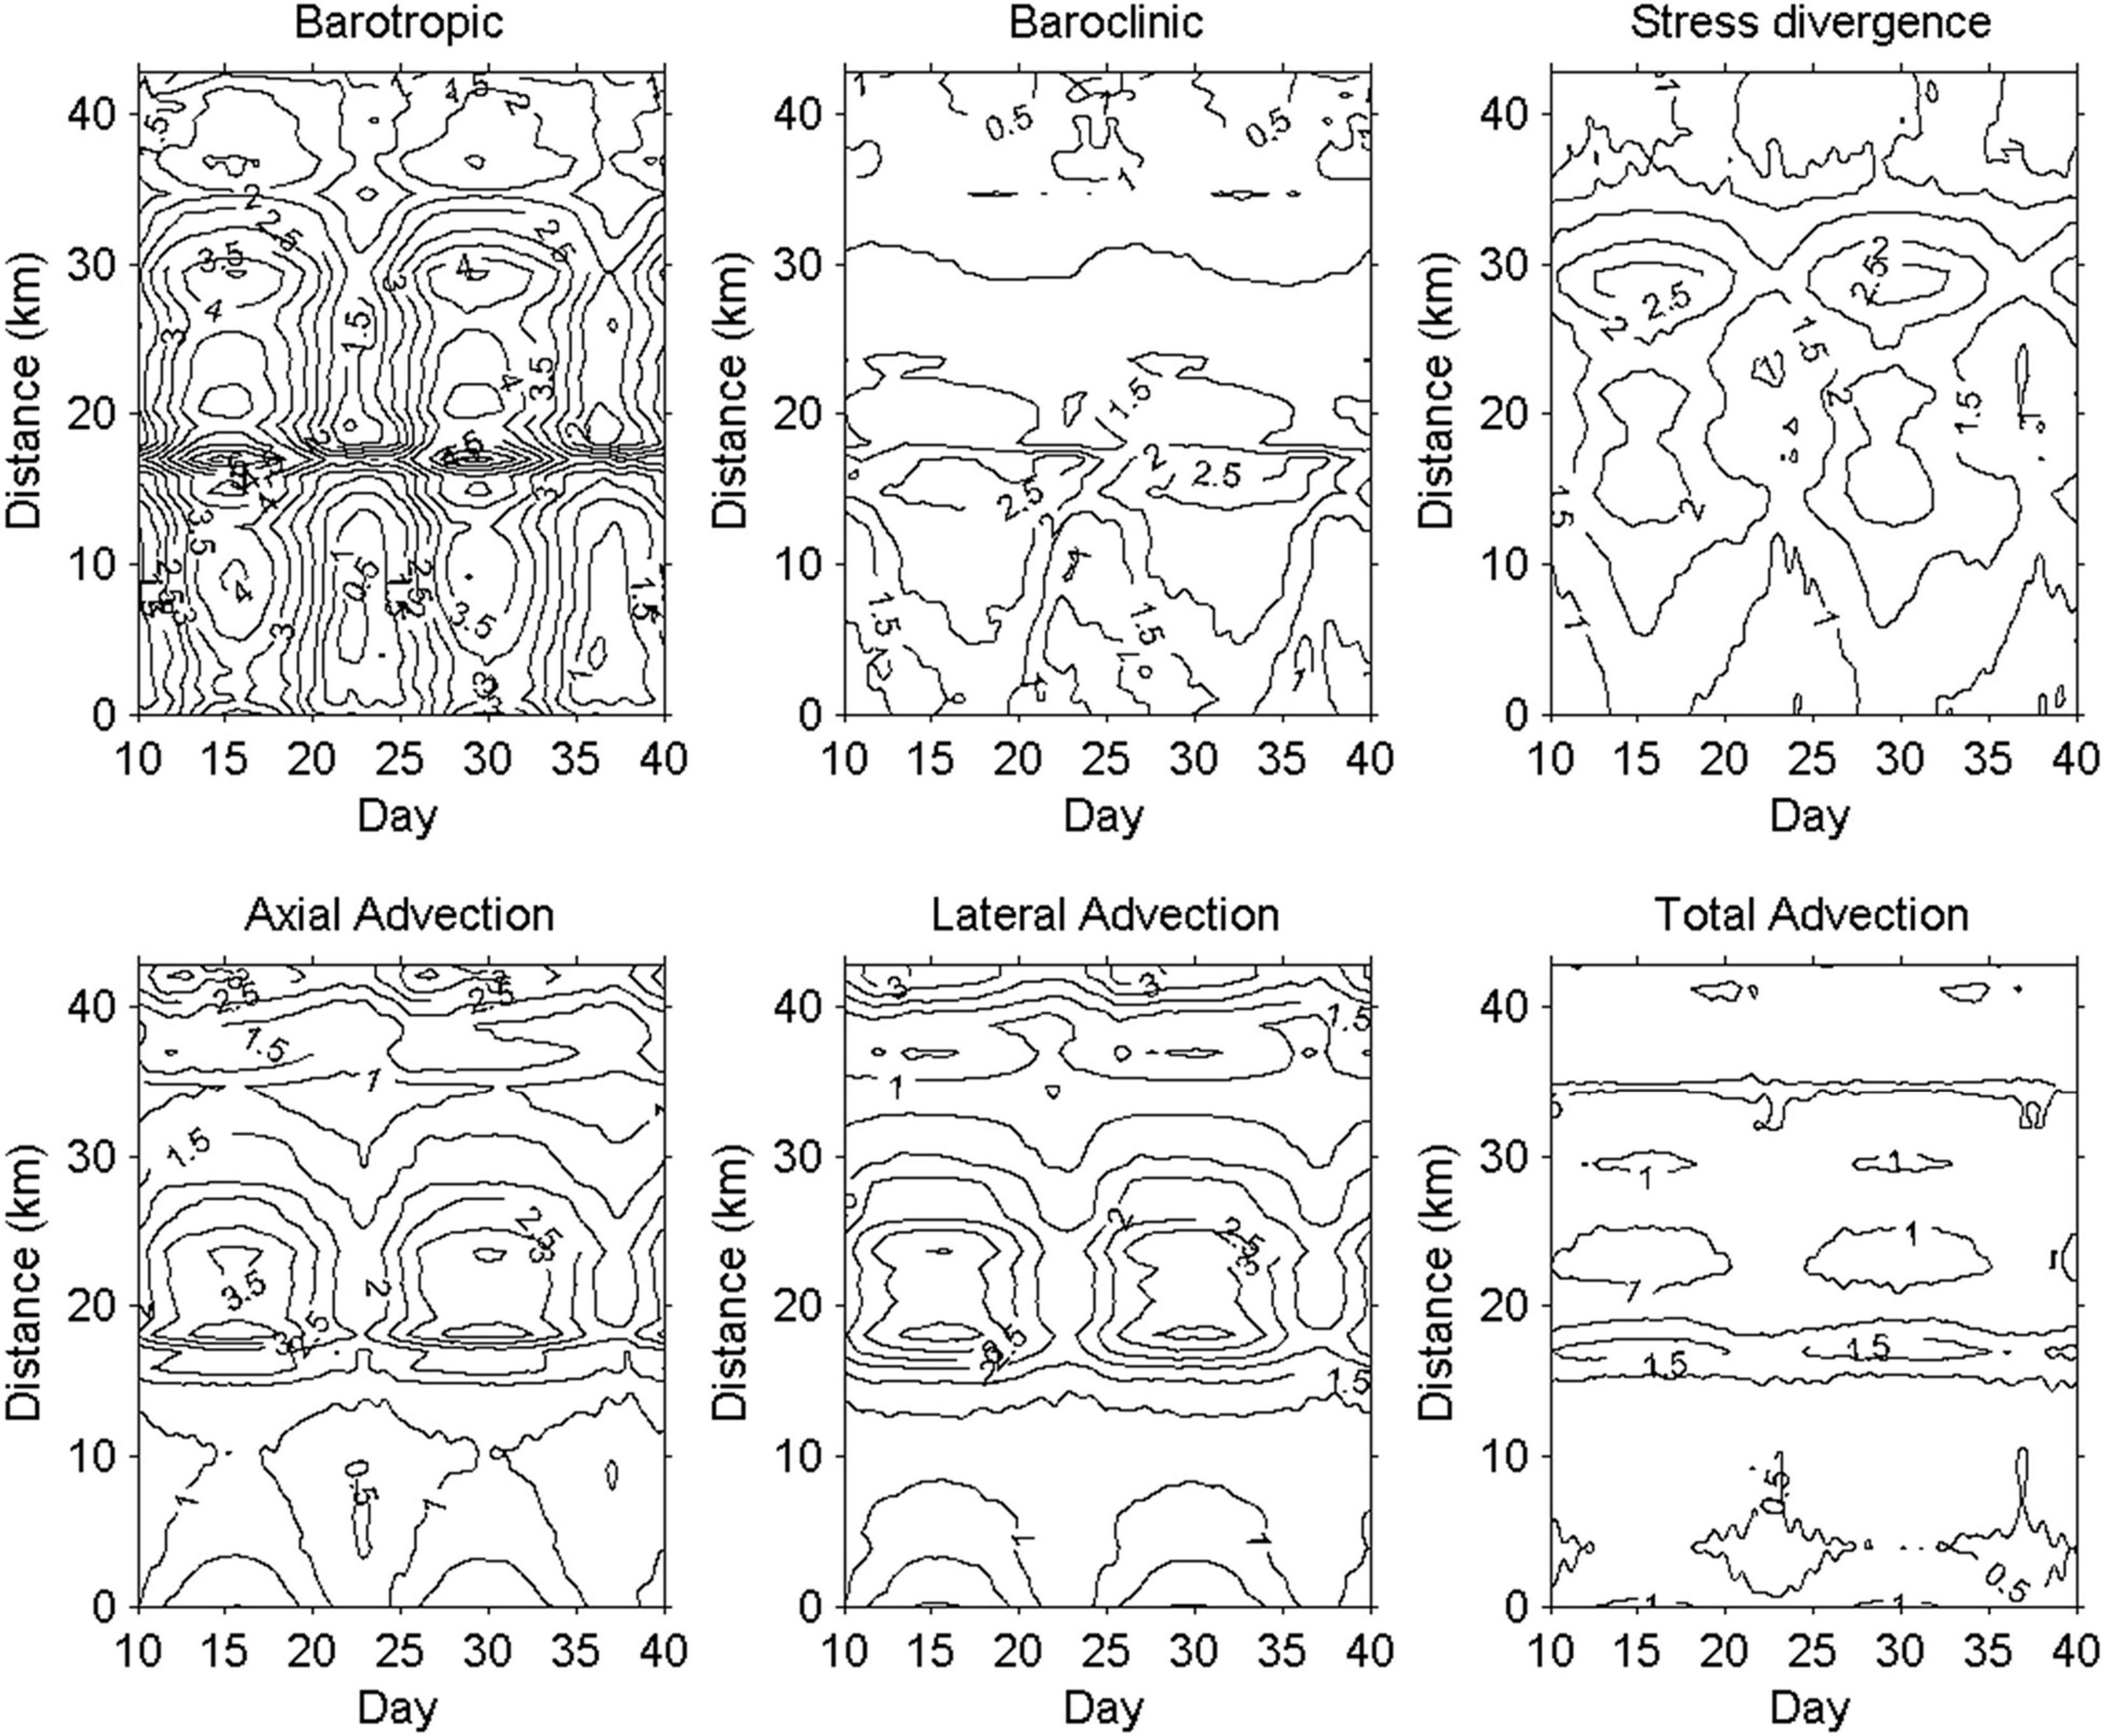
Figure 4. Temporal variations in section-averaged absolute values of tidally averaged momentum terms along the western channel (×10– 5 m2/s). The upper three panels represent barotropic pressure, baroclinic pressure, and stress divergence. The lower three panels represent axial, lateral, and total advections. The total advection is calculated from section-averaged absolute values of the sum of axial and lateral advections. The y-axis represents the distance from the lower (0 km) to the upper (44 km) PRE.
in which L is the estuarine length, and B is the channel width. Their ratio is:
In the PRE, the mean channel width B is about 25 k,m and estuarine length L is about 50 km. Thus, . Model results show that the along-channel current velocity is almost twice larger than the lateral current velocity in most of the areas of the PRE, i.e., r∼1.
Although the absolute magnitudes of two advection terms are markedly high, the cross-sectionally averaged absolute subtidal total advection term (, the top bar indicating cross-sectional average) is much reduced, indicating that the axial and lateral advections almost balance each other in the PRE. But the magnitude of the total nonlinear advection is still comparable with the other terms (Figure 4). The fortnight variation of momentum terms of Eq. 7 are significant in which they have larger values during spring tide (e.g., days 15.5 and 30) than that during neap tide (e.g., days 23 and 37.5) along the channel except the baroclinic pressure term. The baroclinic pressure has a similar trend with other terms from the lower PRE to the low portion of the upper PRE (about 30 km), but it reverses in the remaining portion of the PRE (30–44 km) that is consistent with the along-channel salinity gradient distribution shown in Figure 3F.
Role of Nonlinear Advection on the Along-Channel Subtidal Estuarine Circulation
To evaluate the role of nonlinear advection on the SEC in the PRE, we computed tidally averaged advections at the cross-section S during neap and spring tides (Figure 5). It shows that the negative and positive subtidal axial and lateral advections are symmetrically distributed along the two side of the thalweg with opposite signs. This pattern is clearly different with narrow and long estuaries (Chen et al., 2009; Scully et al., 2009), in which the lateral advection has a two-layer structure at narrow and long estuaries (Lerczak and Geyer, 2004). The large axial advection with an opposite value as the lateral advection has the tendency to balance each other, which results in much reduced total advection at the western channel during spring and neap tides (Figure 5). Nevertheless, it can be seen that the total advection shows a two-layer structure similar to the narrow estuaries, and it acts as a driving term to reinforce the subtidal circulation in the PRE.
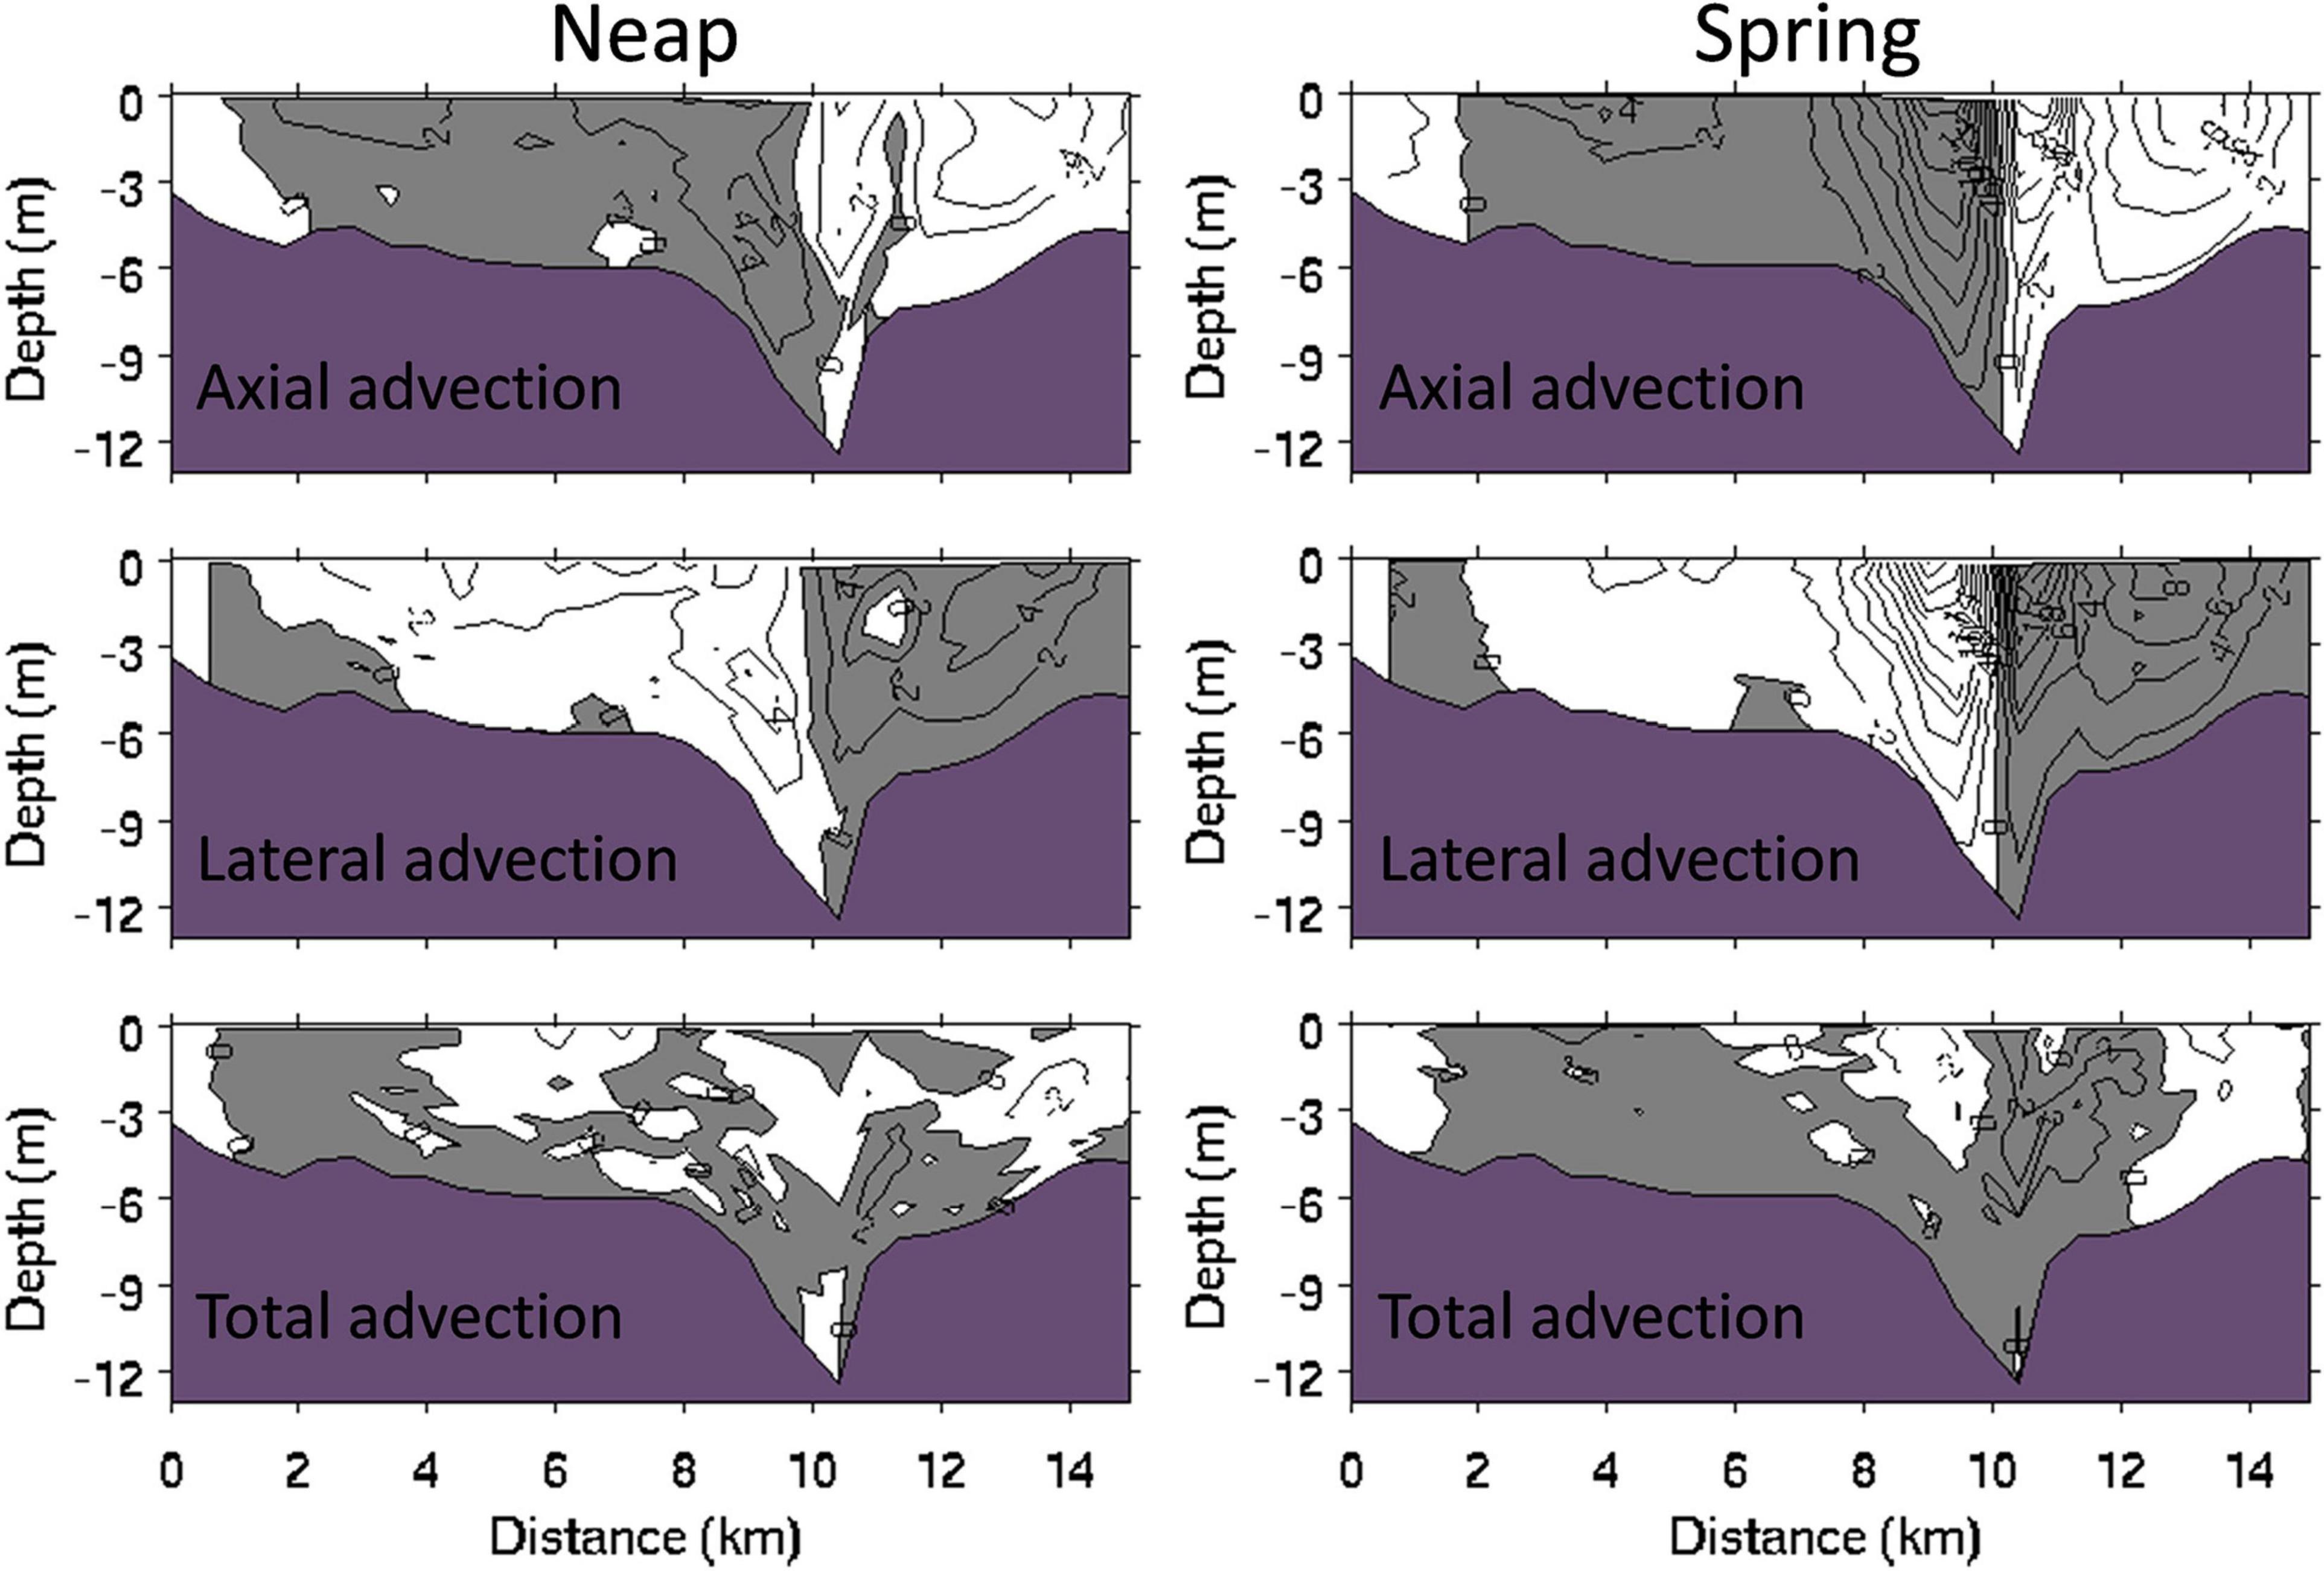
Figure 5. Distributions of the subtidal axial, lateral, and total advections along the cross-channel section S (×10– 5 m2/s) at maximal neap and spring tides. Positive value indicates the force toward land. The x-axis represents the distance from the west to the east shoals as one looks into the PRE.
To quantify the contribution of total advection to the along-channel SEC in the PRE, the spring-neap tidal averaged total advection and baroclinic pressure along the section S are computed and shown in Figure 6. Comparing with the baroclinic pressure, the total advection has a similar effect as the baroclinic pressure to drive the SEC at the middle PRE (except the east shoal of the section, Figure 6), especially during spring tide (Figure 5). In addition, cross-section averaged subtidal total advection also show positive value as the baroclinic pressure during the whole time period along the channel (Figure 7) indicating that the augment in nonlinear advection on baroclinic pressure to force the SEC is a common feature in a bell-shaped estuarine like a straight one (Scully et al., 2009; Basdurak and Valle-Levinson, 2012). However, different from narrow and straight estuaries, it is mainly originated from the axial advection component, and the lateral advection is secondary and plays an inverse role compared with the axial advection (Figure 7).
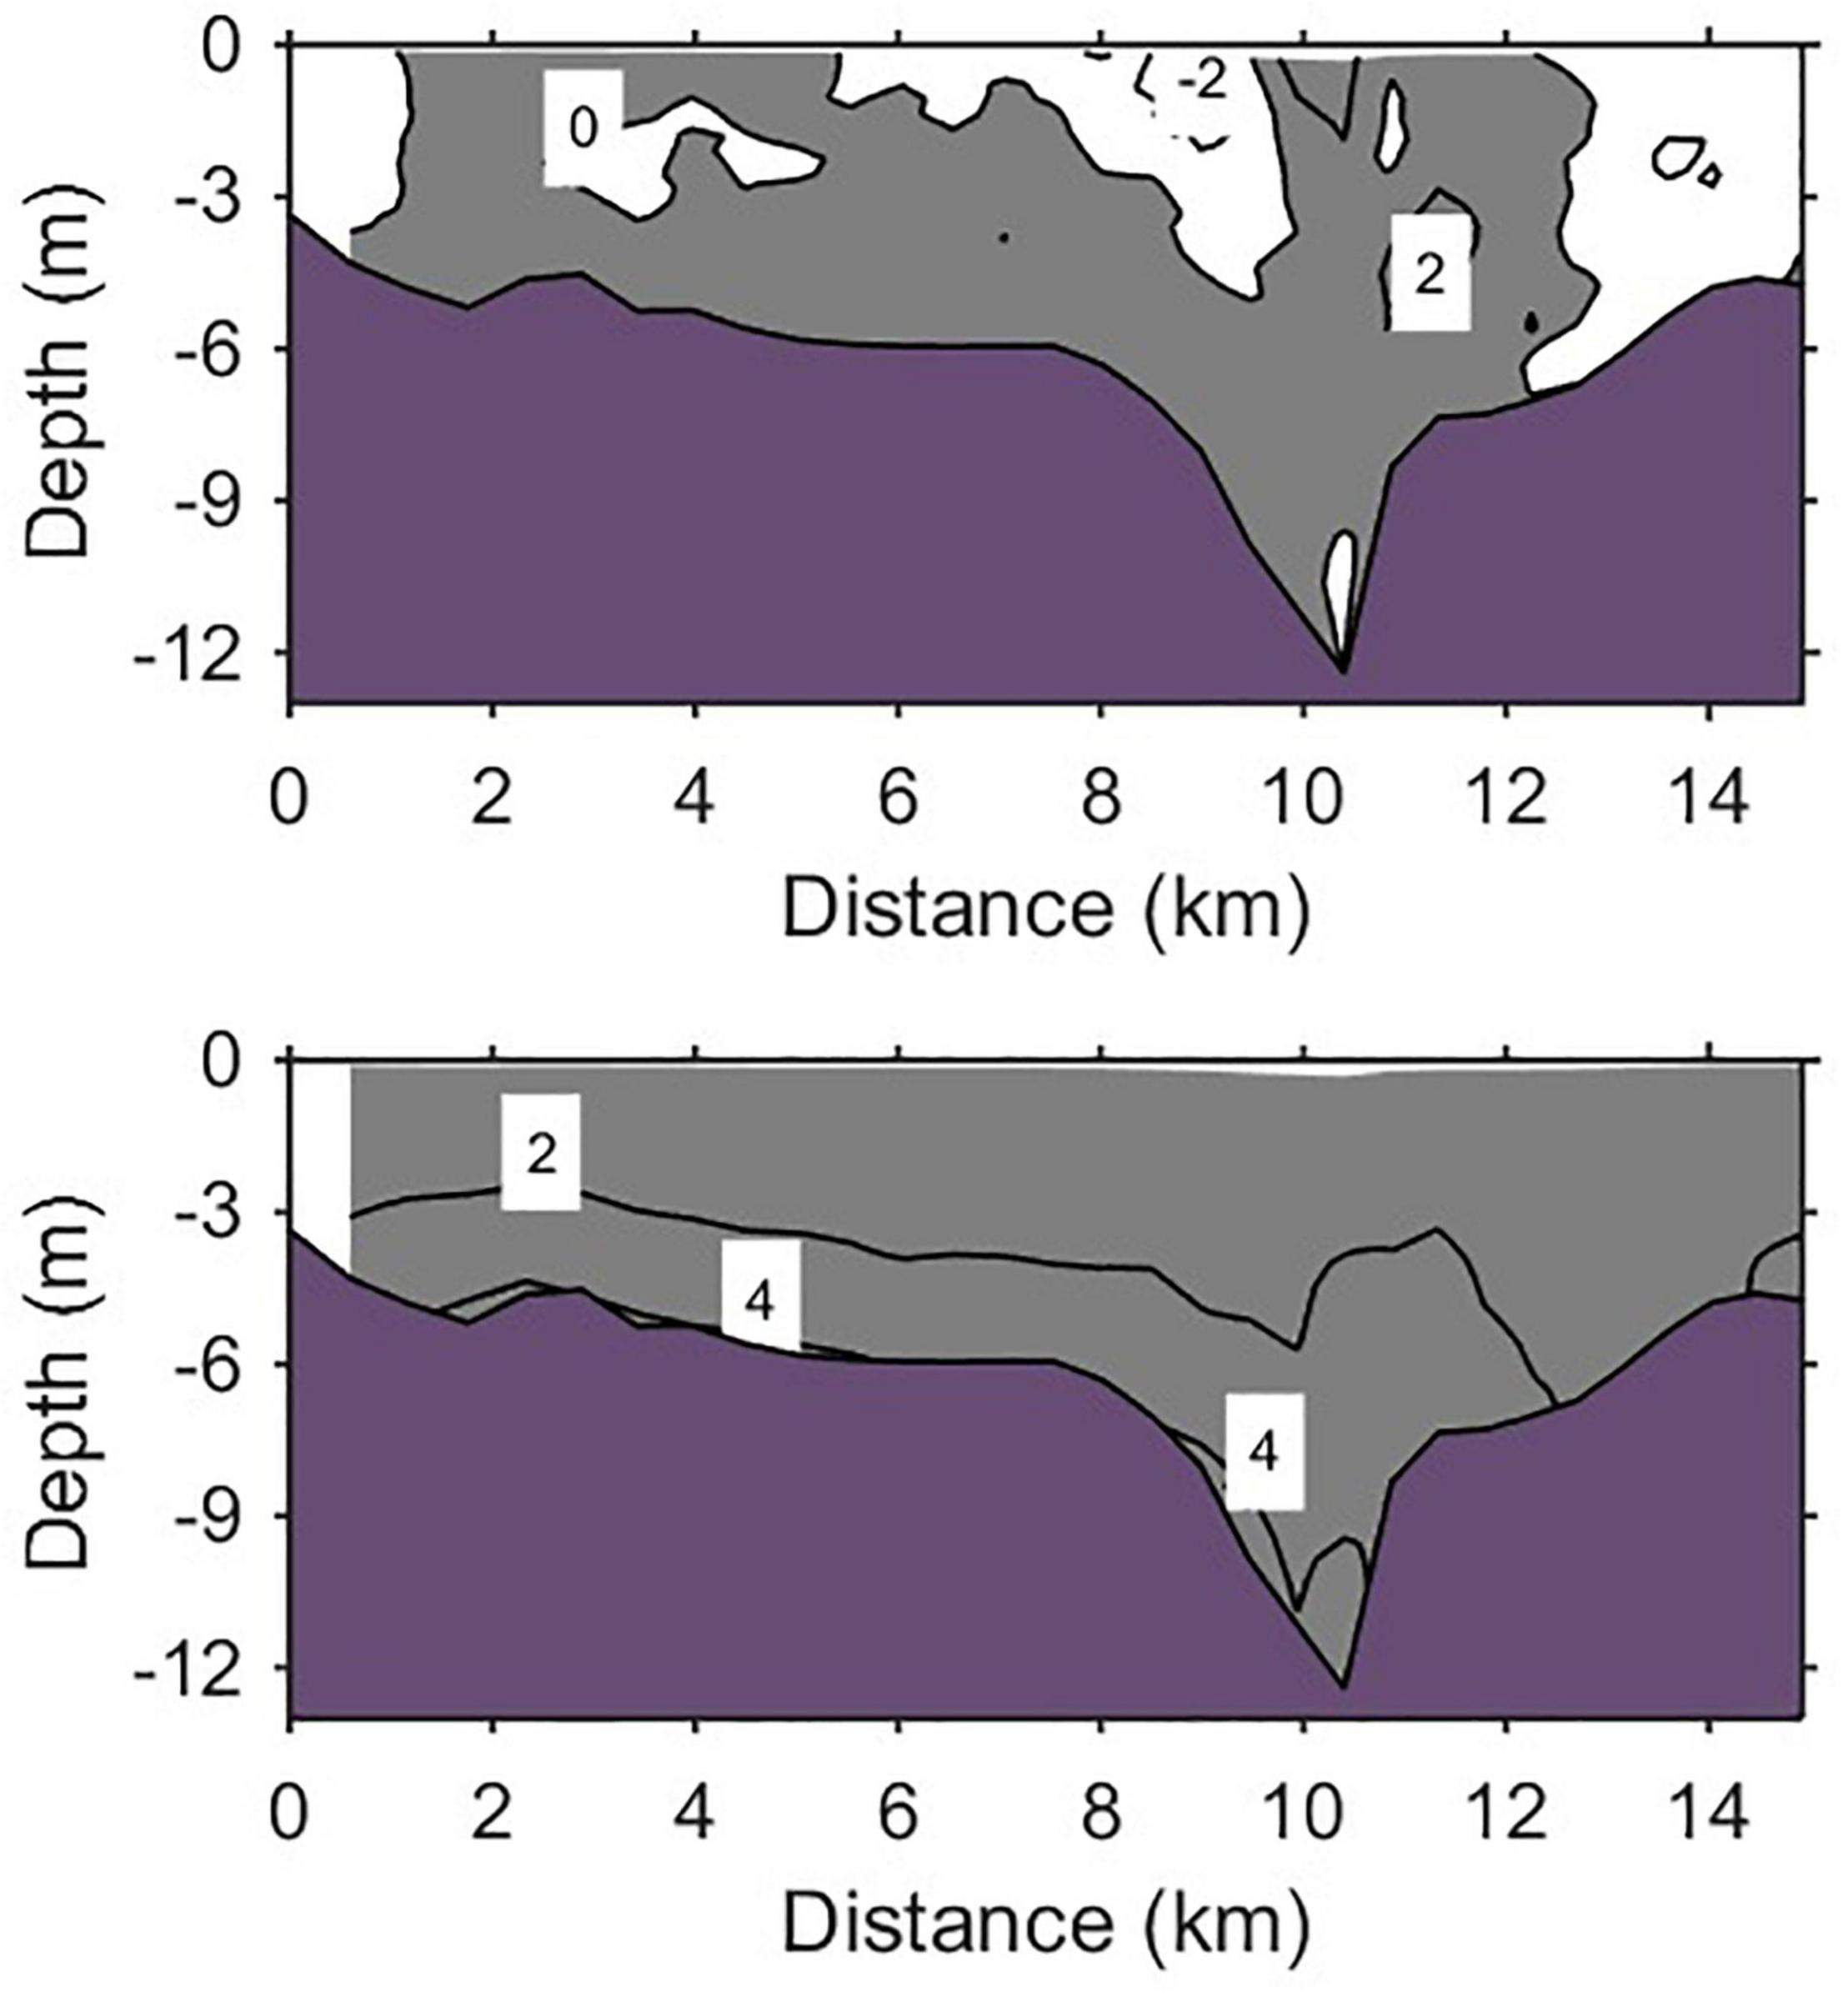
Figure 6. Spring–neap tidal averaged total advection (×10–5 m2/s) (upper panel) and baroclinic pressure (×10–5 m2/s) (lower panel) along the cross-channel section S. Positive value indicates the force toward land. The x-axis represents the distance from the west to the east shoals as one looks into the PRE.
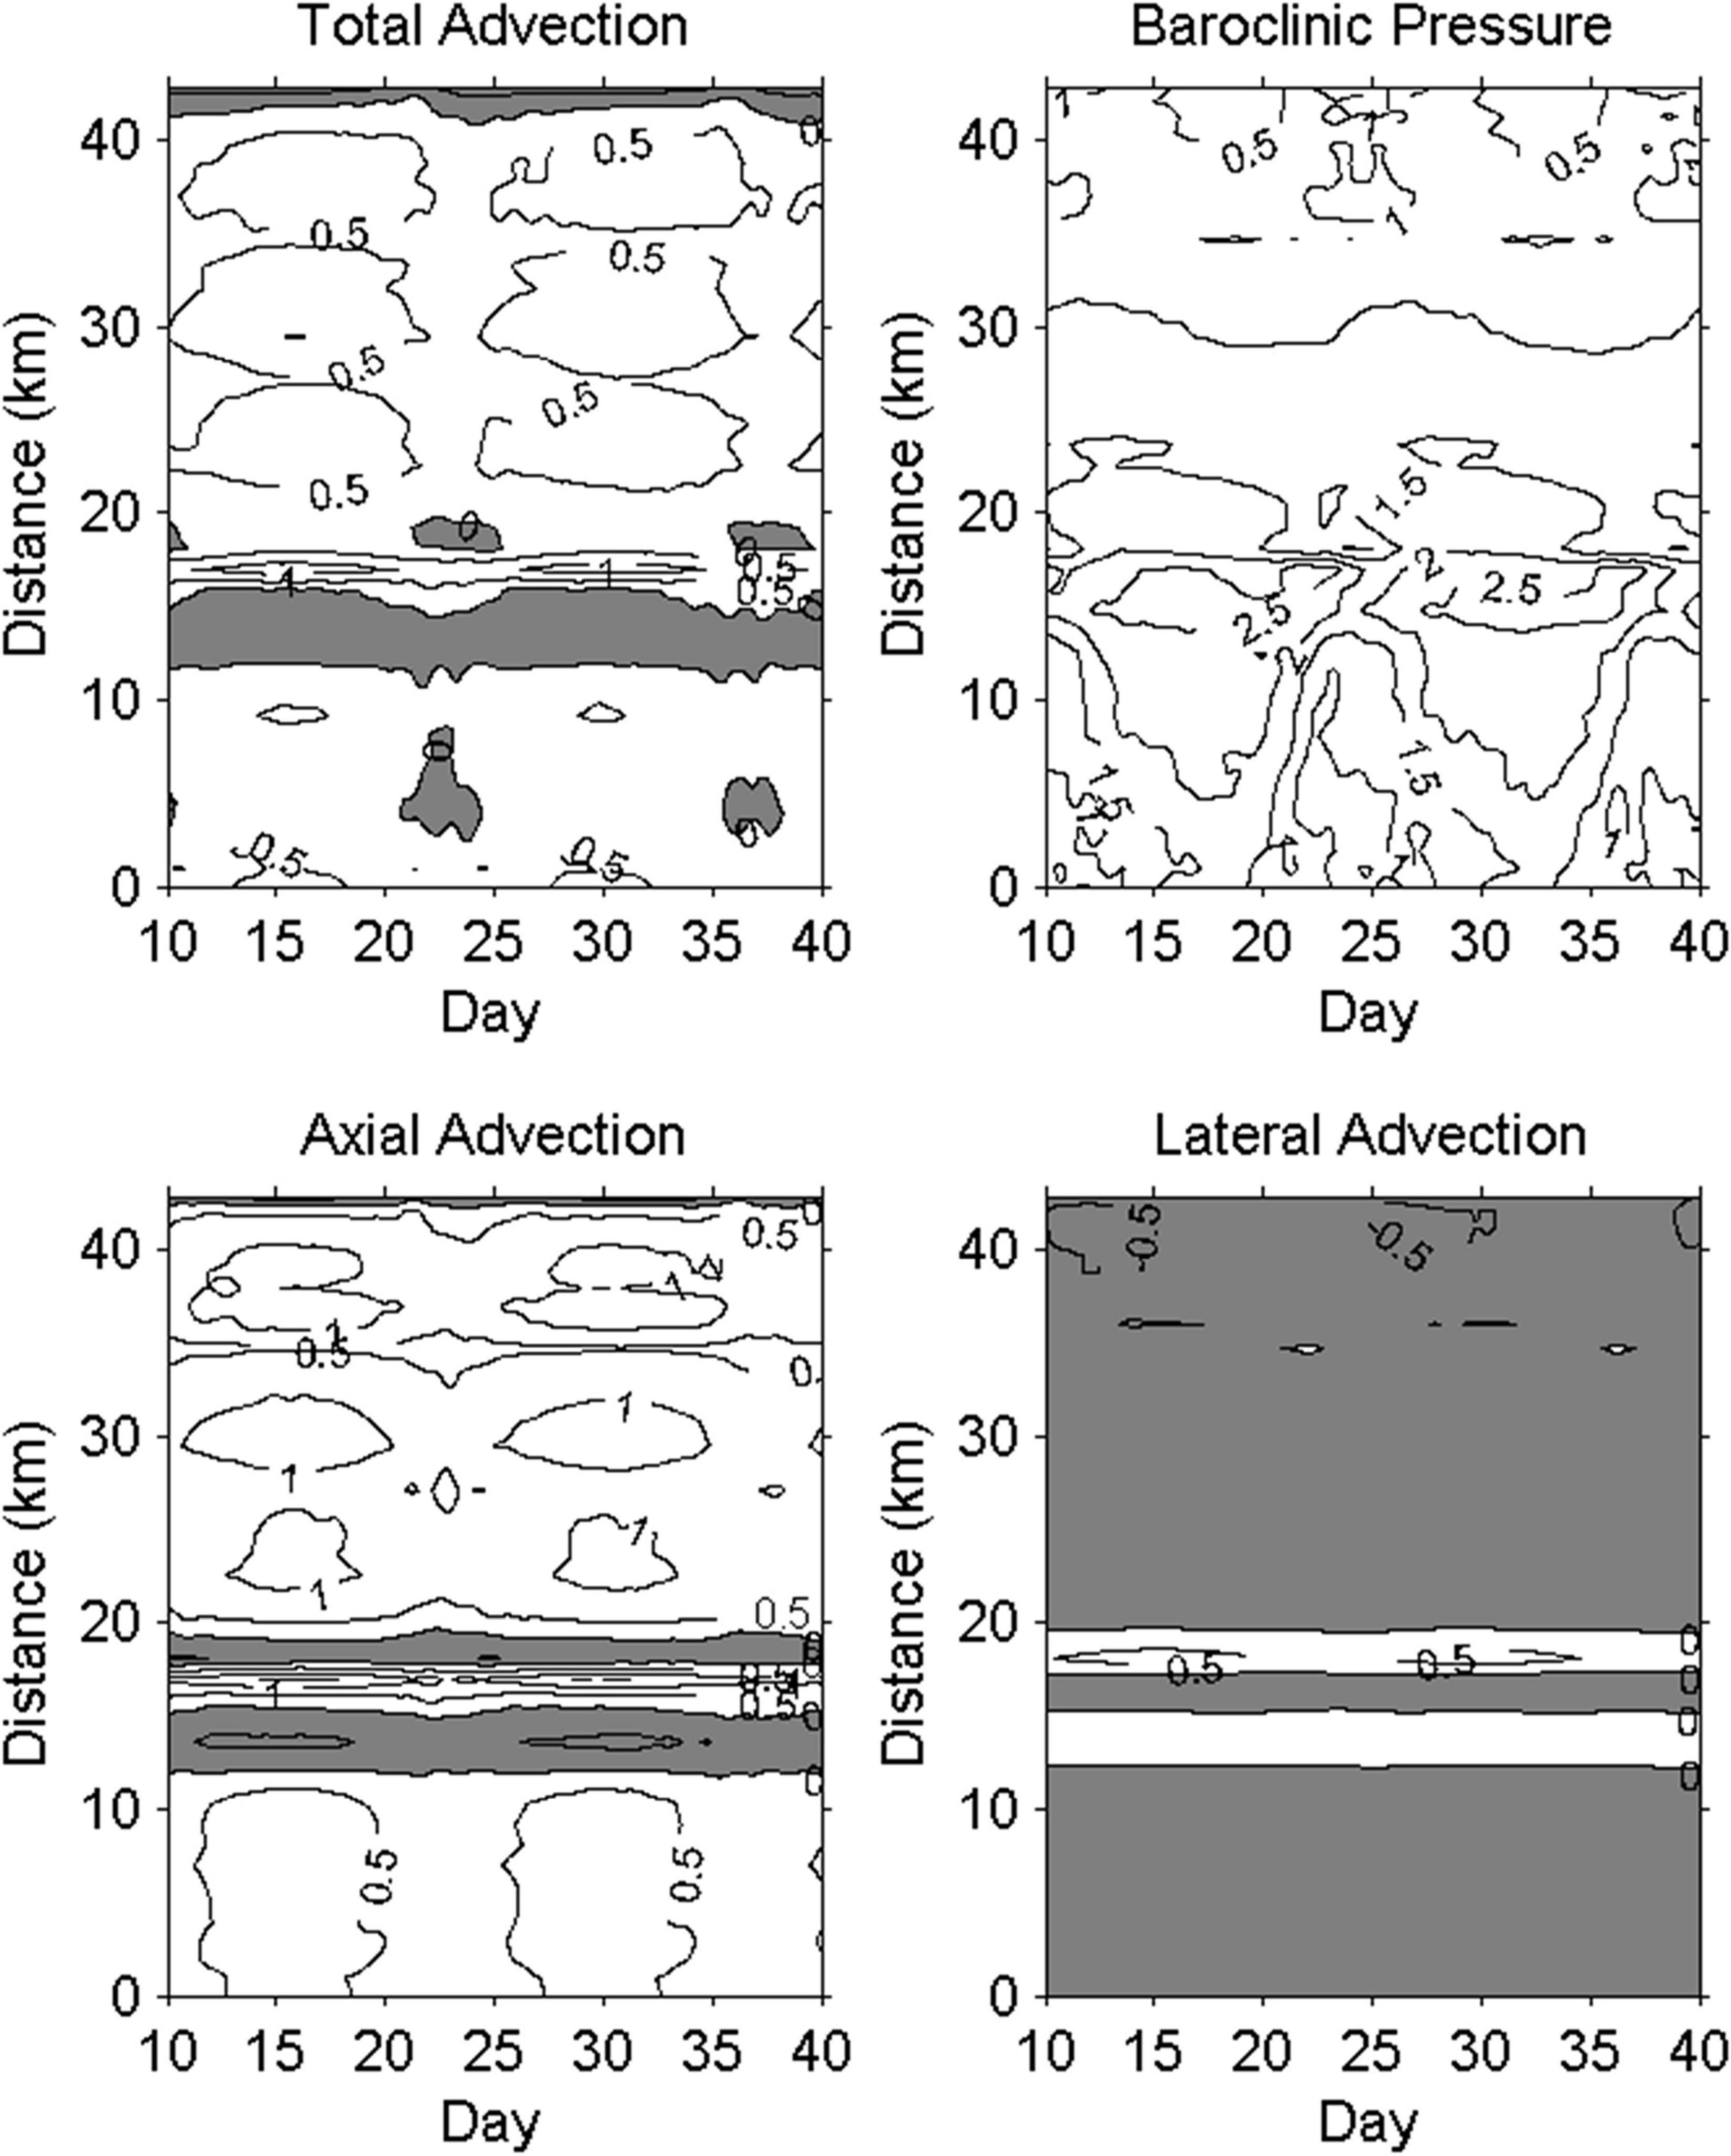
Figure 7. Temporal variations of cross-section averaged subtidal total advection, baroclinic pressure, axial, and lateral advection along the western channel in the PRE (×10–5 m2/s). The y-axis represents the distance from the lower (0 km) to the upper (44 km) PRE.
Flood–ebb Tidal Asymmetry
Figure 8 shows the distributions of instantaneous along-channel and lateral advections overlapped by along-channel and lateral current velocities at maximal flood and ebb during spring and neap tides along the section S. Note that the tide of the PRE is characterized by a mixed tide in which the neap tide is mainly dominated by semi-diurnal tide, and the spring tide is mainly dominated by diurnal tide. Thus, maximal ebb and flood are defined as the minimal and maximal water levels in a semi-diurnal tide cycle for neap tide but not in a diurnal tide cycle for spring tide (gray dashed lines in Figures 9A,B). The salinity distributions show much differences at ebb and flood during neap and spring tides that suggest a high flood-ebb asymmetry of the estuarine dynamics in the PRE (Figures 8A,G,D,J). Overall, it can be seen that the high magnitudes of the advections were located in the west deep channel and decreased from the surface toward the bottom. The positive and negative fluxes were distributed at two sides of the channel axial, respectively, for both axial advection and lateral advection, but had opposite signs between the two advections, which indicate that the two advections play inverse roles on the along-channel circulation.
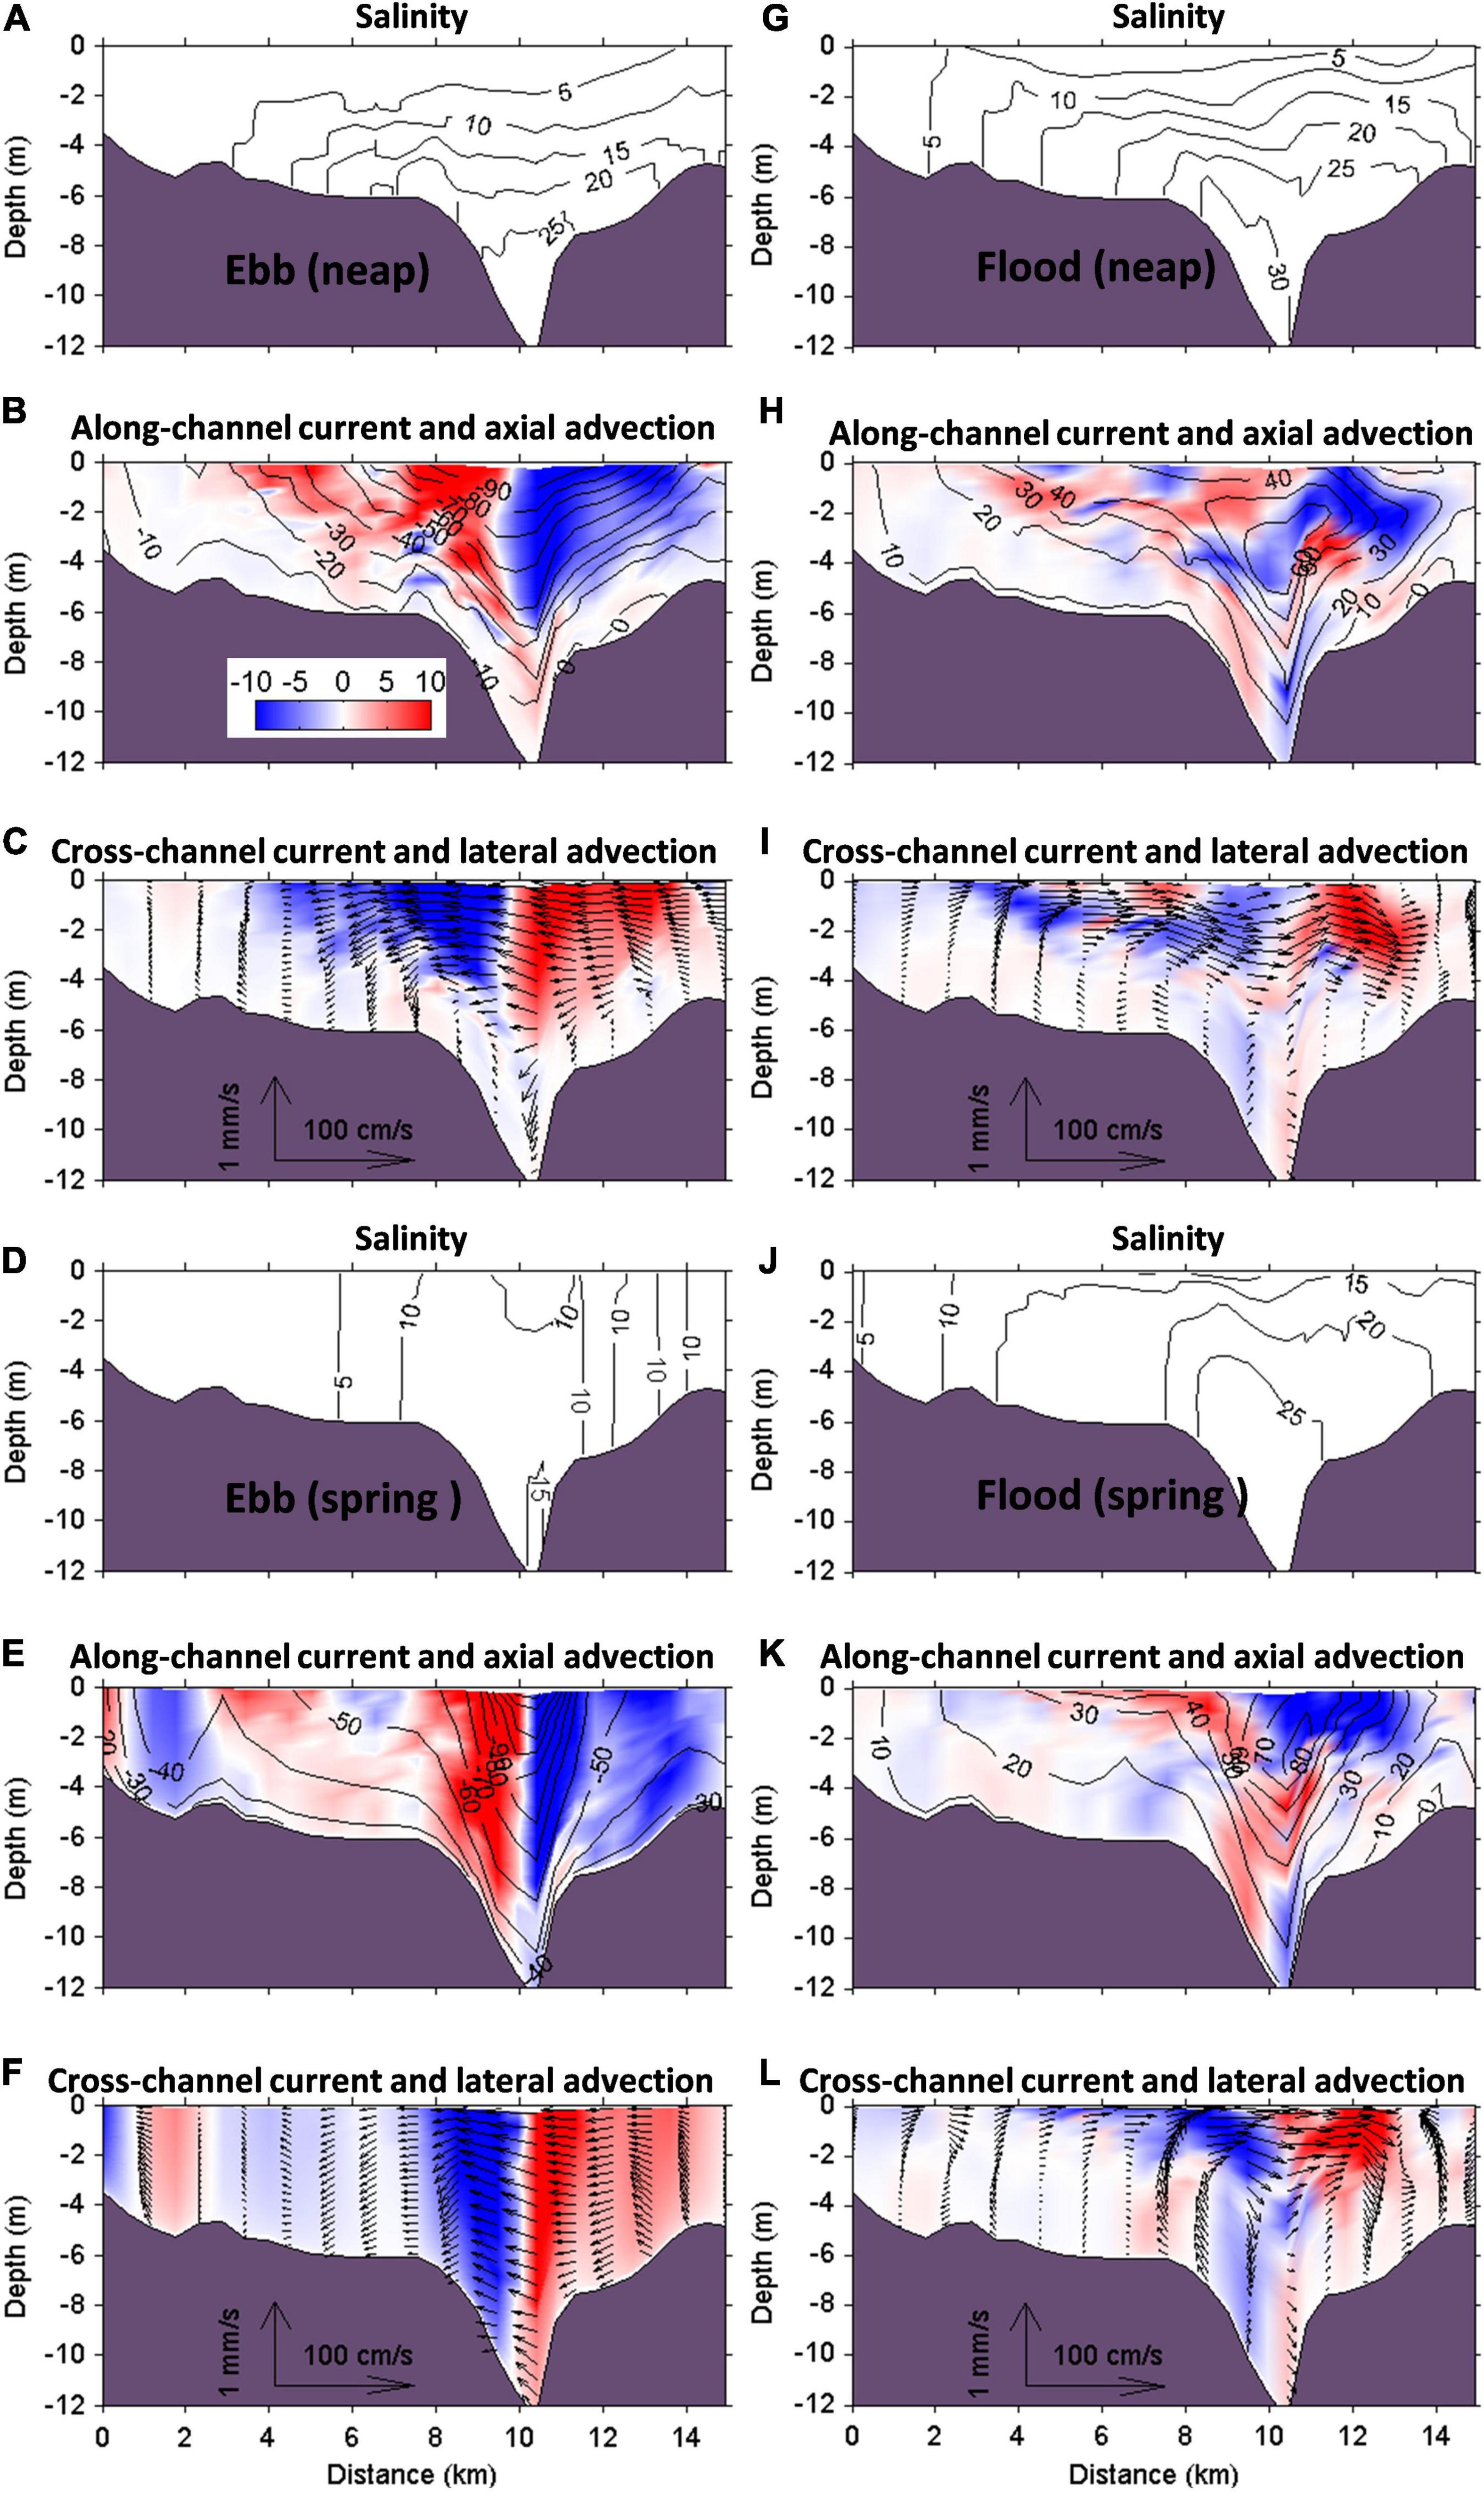
Figure 8. Instantaneous salinity, along-channel current velocity (contour line) with axial advection (color shape), and cross-channel current velocity (contour line) with lateral advection (color shape) at maximal ebb during neap tide (A–C), maximal ebb during spring tide (D–F), maximal flood during neap tide (G–I), and maximal flood during spring (J–L) along the cross-channel section S. The positive along-channel current directs toward land, and positive cross-channel current directs from the west toward the east shoals as one looks into the PRE.
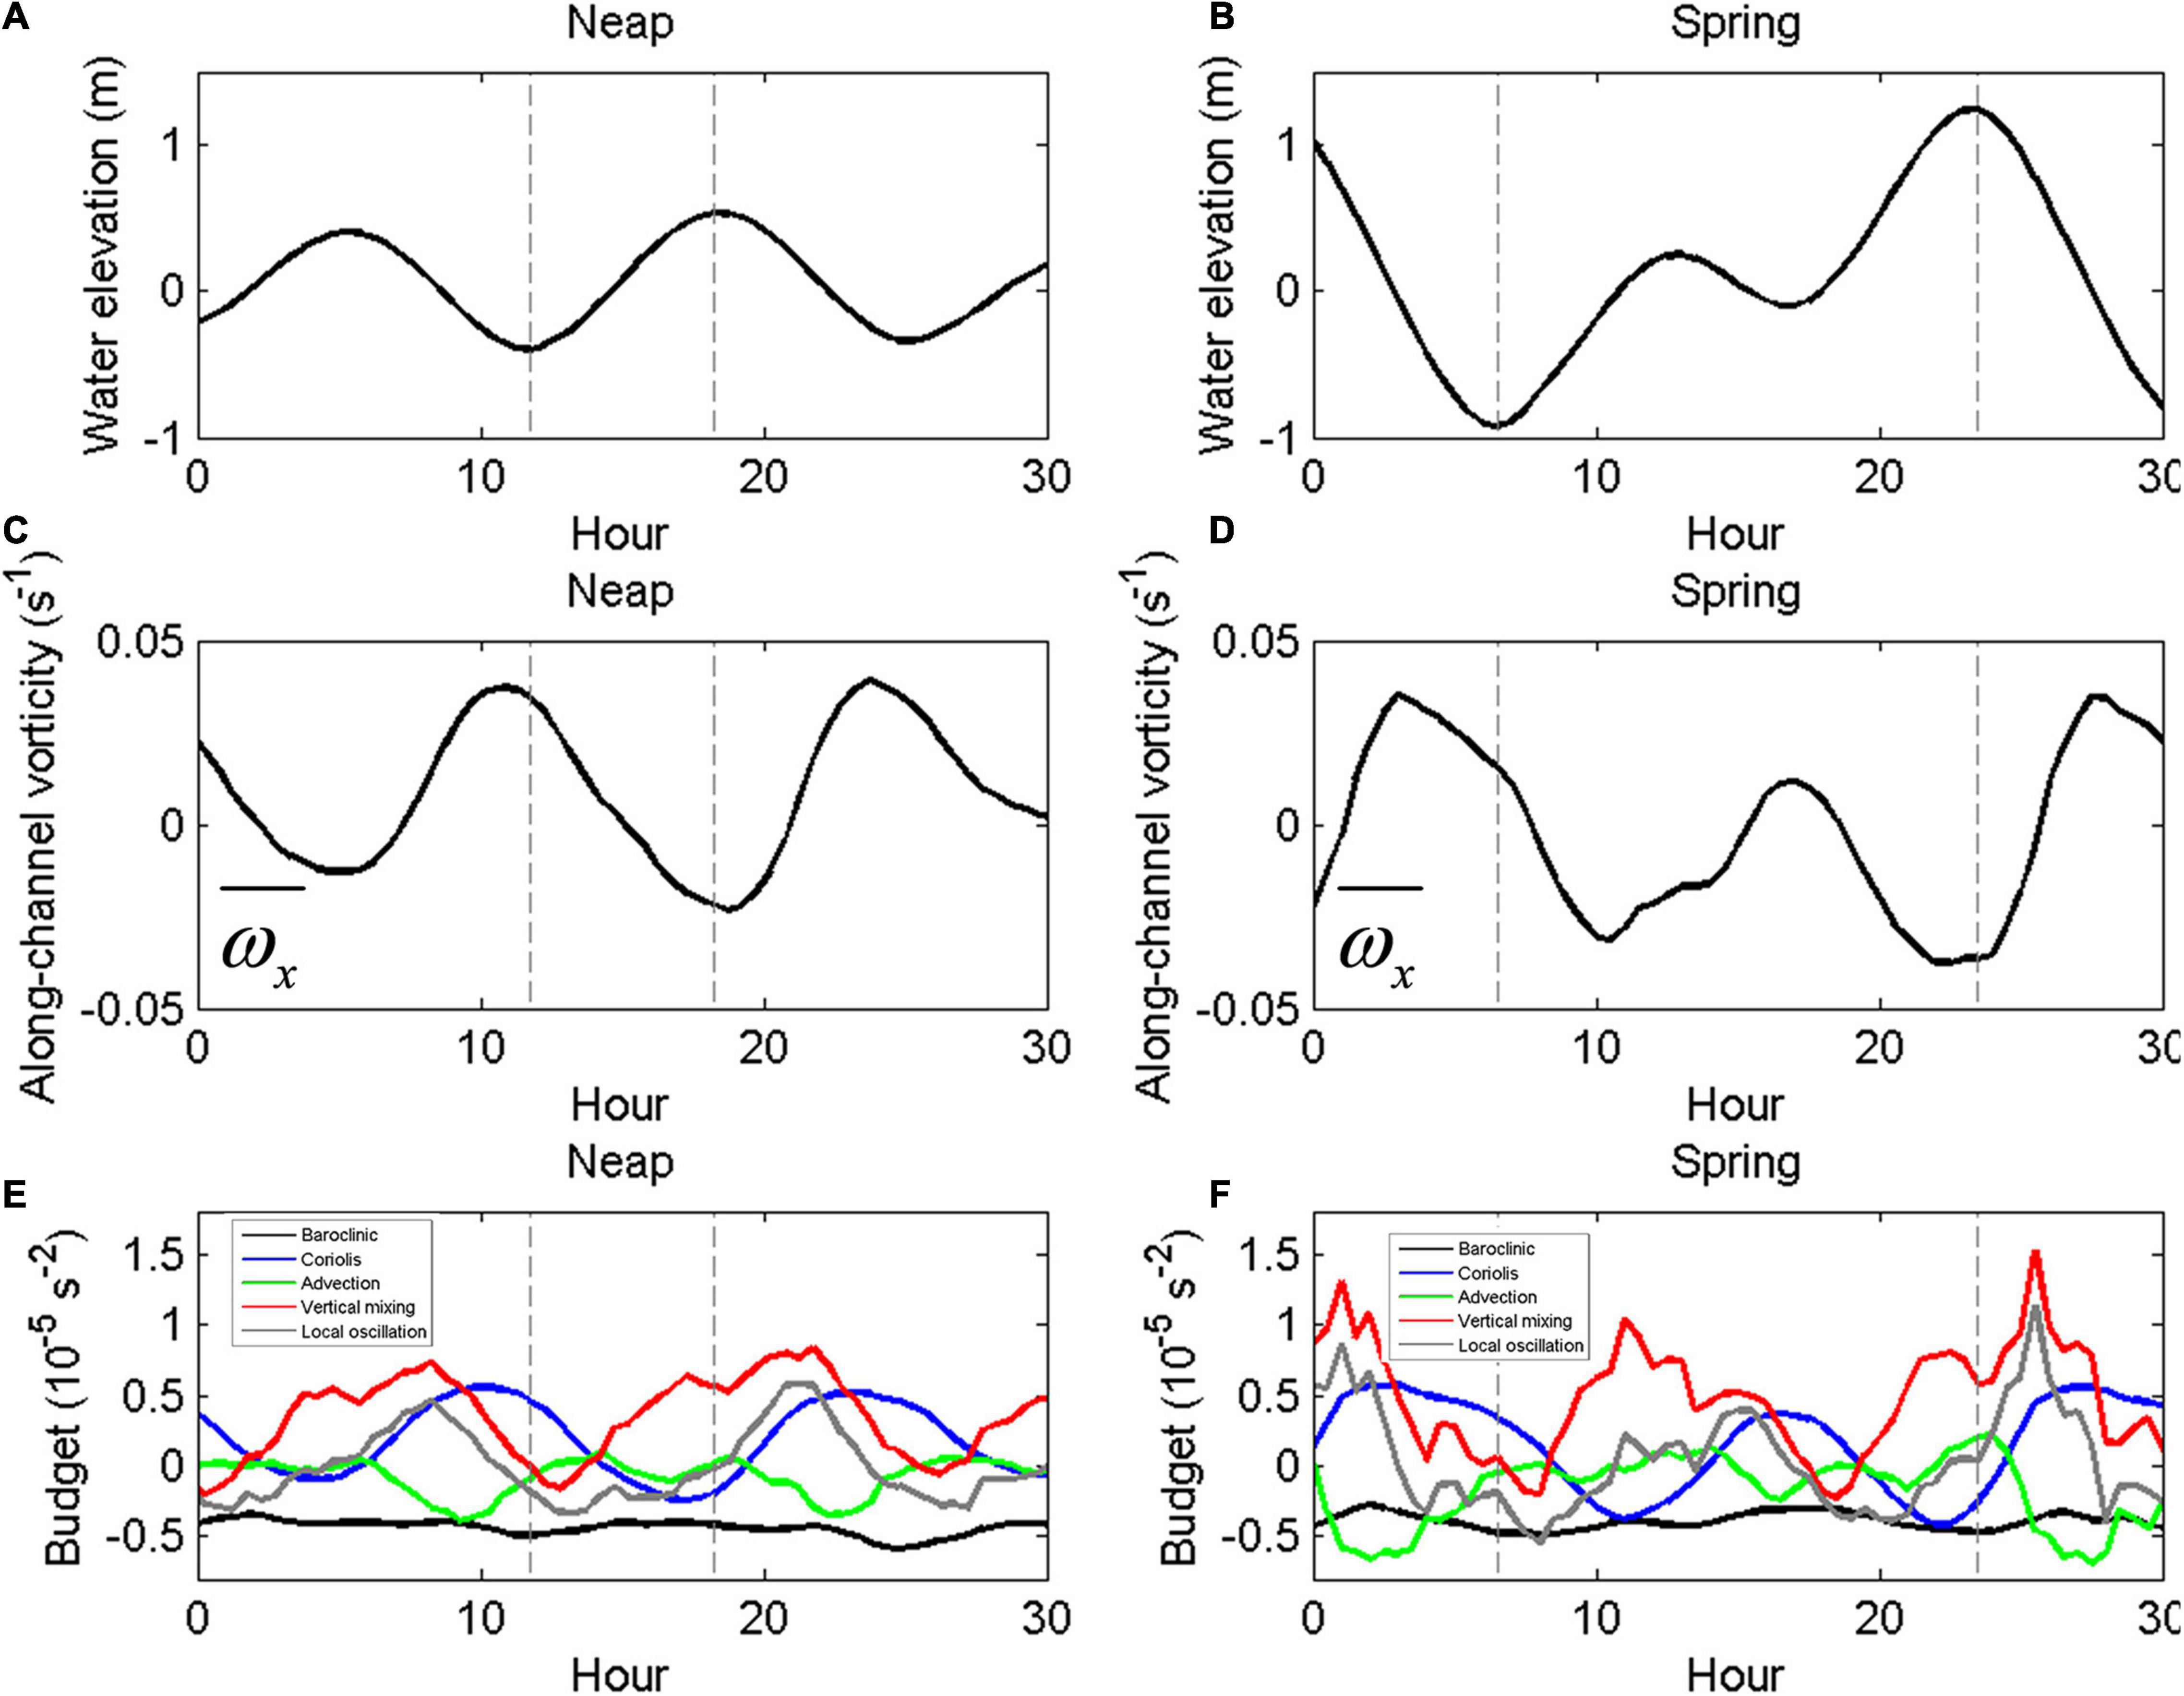
Figure 9. Time variations of water elevation, cross-section averaged along-channel vorticity, and vorticity budget during neap tide (A,C,E) and spring tide (B,D,F) at the cross-channel section S. The gray dashed lines represent times of maximal ebb and flood.
At the maximal ebb during neap tide, the lateral current flows from east to west through the water column, and positive and negative lateral advections are almost symmetrically separated by the thalweg of the west channel (Figure 8C), which are caused by the differential along-channel current over the cross-section in which maximum along-channel seaward current is located at the thalweg (Figure 8B). At this moment, the positive (negative) lateral advection on the right (left) side of the thalweg decelerates (accelerates) along-channel seaward current. As a result, axial advection is negative (positive) on the right (left) side of the thalweg to balance the lateral advection as rest terms in Eq. 7 are almost balanced against each other at this moment. At the maximal ebb during spring tide, the lateral, and along-channel advections have similar structures as the maximal ebb during neap (Figures 8E,F). However, they are more equally distributed in the vertical because of more uniform vertical distribution of lateral and along-channel currents due to strong turbulent mixing. Therefore, the lateral advection still balances the axial advection at this moment.
The magnitude of two advection terms is much reduced at maximal flood (Figures 8H,I,K,L) compared with that at maximal ebb. However, their structures are more complicated than that during ebb. Note that the role of positive and negative values of advection is opposite with that during ebb because of the reversed along-channel and lateral currents. Although the lateral and axial advections are not symmetrically distributed at two sides of the thalweg, the distribution of positive and negative axial advection are appositive to the lateral advection overall, indicating the axial advection has the tendency to balance the lateral advection.
Dynamics of Lateral Circulation
In a uniformly long and narrow channel, the lateral circulation generally has a two-layer structure in which it rotates clockwise (anti-clockwise) during flood (ebb) driven by the geostrophic balance when we look into the estuary in the northern hemisphere. The lateral current flows from the west (east) bank to the east (west) bank at the upper layer that tilts the water level and isopycnals leading adverse lateral barotropic and baroclinic pressures to suppress the lateral circulation and drive a return flow at the lower layer during flood (ebb). However, the western channel in the PRE has wide shoals at its two sides. The effect of lateral boundaries on the tilting of the water level and isopycnals is limited. During the ebb tide, it appears that the two pressures are not strong enough to suppress the lateral circulation to generate a return flow at the lower layer due to the wide lateral topography (Figure 7). To explore the dynamics for driving the lateral circulation in the PRE, a budget for the along-channel vorticity is used to qualify the strength and direction of the lateral circulation as:
The lateral shear of vertical velocity is much smaller than the vertical shear of the lateral current velocity in a wide estuary and, therefore:
In this study, the y-axis directs eastward and the z-axis directs from the bottom to the surface, thus, ωx > 0 (ωx < 0) represents an anti-clockwise (clockwise) lateral circulation if one looks into the PRE, and its absolute values represent the strength of lateral circulation. For hydrostatic approximation, the lateral momentum can be written as:
Taking the vertical derivation of Eq. 14 and assuming , one obtains the budget of the along-channel vorticity:
in which, the term on the left-hand side is the variation rate of the along-channel vorticity, the first term on the rhs is vorticity caused by advection, the second term on the rhs is the tilting of planetary vorticity, and the remaining two terms on the rhs are vorticities due to lateral salinity gradient and vertical mixing. This new concept of the along-channel vorticity budget has been applied to estuarine systems for investigating the dynamics of lateral circulation such as the San Francisco Bay and Chesapeake Bay (Collignon and Stacey, 2012; Li and Li, 2012). In this study, cross-sectionally averaged along-channel vorticity (Eq. 13) and the vorticity budget (Eq. 15) of section S are calculated to investigate dynamics of lateral circulation at the middle PRE (Figure 9). It can be seen that the water level and along-channel vorticity (, top bar represents cross-sectional average) are inversely correlated (correlation coefficient equals -0.6). The along-channel vorticity is positive during ebb tide (an anti-clockwise lateral circulation) and is negative during flood tide (a clockwise lateral circulation) (Figures 9A–D). The along-channel vorticity varies from a maximal value of 0.037 s–1 at 1 h before maximal ebb to a minimal value of −0.023 s–1 at 0.5 h after the maximal flood during neap tide (Figure 9B). For spring tide, it reaches a maximal value of 0.035 s–1 at 3.0 h before the maximal ebb and a minimal value of −0.037 s–1 at 1 h before the maximal flood (Figure 9E). The maximal ebb tidal vorticity was stronger than the maximal flood tidal vorticity during neap tide, whereas the strengths of these vorticities were equal during spring tide.
Figures 9E,F show that the leading terms of the vorticity budget equation are the baroclinic pressure (), Coriolis (), nonlinear advection (), vertical mixing (), and local oscillation () in the middle PRE. This is different from the results of Dong et al. (2004) in which they suggested that the lateral circulation dynamics were mainly in quasi-geostrophic balance in the PRE based on sparse observed data. It can be seen that the baroclinic pressure consistently develops negative along-channel vorticity (i.e., ωx < 0) that tends to form a clockwise lateral circulation during spring and neap tides at the middle PRE. This is because the saltier water occupies the deep channel and fresher water occupies the west shoal due to the differential advection that tilts the isopycnals upward from the west to the east shoals and generates a density flow from the deep channel toward the western shoal (v < 0) and circulates upward and flows to the east at the surface. This differential advection forms a clockwise circulation on the western shoal (Figures 8B,H,E,K). The vertical mixing shows inverse phase as the along-channel vorticity and diffuses the vorticity during the whole period. The Coriolis force plays an inverse role as the baroclinic pressure during ebb tide and generates an anti-clockwise circulation (i.e.,ωx > 0) when it forces a negative flow stronger at the surface than at the bottom, but it augments the baroclinic pressure during flood when it forces a positive flow stronger at the surface than at the bottom to form a clockwise circulation (i.e., ωx < 0). The Coriolis term is partially balanced by the turbulent diffusion, and the Ekman tidal rectification is evident. The contribution of nonlinear advection to lateral circulation is significant in the PRE, and its distribution is more complex than the above terms. In general, it augments the baroclinic pressure, especially during ebb tide and becomes weak during flood tide. The local oscillation is the sum of the four terms on the rhs of Eq. 15 to represent an increment/decrement of the along-channel vorticity. It becomes negative after the along-channel vorticity reaches a maximal value at ebb and positive after the along-channel vorticity reaches a minimal value at flood.
In summary, the along-channel vorticity budget suggests that the dynamics of lateral circulation in the PRE are not merely controlled by Coriolis and baroclinic pressure. The nonlinear advection has a notable contribution that augments the baroclinic pressure, especially during ebb tide. The circulation difference of the estuary to a narrow and straight estuary is the asymmetric feature along the axis of the deep channel as the east shoal extends further eastward, and the lateral boundary effect is limited. The baroclinic pressure-induced density flow on the eastern shoal is depressed by the Ekman tidal rectification and become weak.
Discussion and Conclusion
Based on the tidally averaged eddy viscosity and the horizontal salinity gradient, many studies have found that HR65’s theory is successful in predicting the strengthening of estuarine circulation and salinity intrusion in many narrow and straight estuaries (Geyer et al., 2000; MacCready, 2004, 2007; Ralston et al., 2008; Scully et al., 2009). The PRE is a wide estuary with a convergent channel, and it is uncertain if one can predict the SEC for the PRE using the linear solution. Based on the distribution of the along-channel momentum balance, however, two nonlinear advections almost balance each other resulting in a much reduced nonlinear effect and a quasi-balance between pressure and friction, especially from the lower to middle PRE (Figure 7). Thus, the HR65’s theory is possibly suitable for predicting the SEC in the PRE.
To examine whether the linear scaling based on HR65’s theory can predict the strength of the residual circulation in this bell-shaped PRE, the circulation based on Eq. 2 is calculated to compare with results simulated by the 3D numerical model in this paper. The along-channel gradient and eddy viscosity in Eq. 2 were averaged over the cross-section at the western channel and low-pass filtered with a 35-h cutoff. The model simulated density-driven circulation along a cross-section that is calculated by Eqs 17 and 18:
where uEi represents the SEC at each grid cell along the section driven by the along-channel density gradient, and u0 represents the net outflow driven by the river discharge over the section,hi is the water depth, ηi is the water elevation, ui is the along-channel velocity, and A is the cross-sectional area. The angle-brackets denote low-pass filtering with a 35-h cutoff window. The model simulated the SEC uE on this cross-section, which is the average value of uEi over the inflow layer shown as:
where Ai is the area of each cell at the inflow layer.
To examine it, we compare the linear scaling based on Eq. 2 with the model results along the western channel based on Eq. 18. A predictive skill used by Wilmott (1981) and Scully et al. (2009) is adapted to qualify accuracy of prediction as:
in which Xprediction and Xmod represent prediction and model result, respectively. The overbar indicates a time average. As we expected, the comparisons in Figure 10 show good skill between model results and predictions by HR65’s theory at the lower (10.0 km south of section S) and middle (section S) portions of the PRE. The prediction skill reaches 0.9 in this region (Figure 10D). Despite this, the HR65’s theory still underestimates the SEC at the middle PRE during spring tide (around days 15.5 and 30). This is because the HR65’s theory excludes the contribution of nonlinearity that is still measurable at this region (Figure 7). Compared with the middle PRE, however, HR65’s prediction shows a good skill during spring tide in the lower portion of PRE where nonlinearity is pretty small (Figure 7). During neap tide (around days 23 and 37.5), the HR65’s theory overestimates the SEC both in the two portions when the impact of nonlinear advection is minor. The prediction skill is much reduced in the intermediate region (around 17.0 km) of the two portions. It can be seen that the cross-sectionally averaged nonlinear advection in this region is larger, which can modify the SEC (Figure 7). This large nonlinear advection is caused by the sharp shrink of channel width (inserted image in Figure 1B) in this region. The poor prediction skill of 0.5 is shown in the upstream (10.0 km north of section S), where the HR65’s theory apparently underestimates the SEC. This is understood as this region is beyond the central region with constant horizontal density gradient and it is highly influenced by the freshwater discharge from the Henmen, Hongqimen, and Jiaomen inlets that dominate the west shoal.
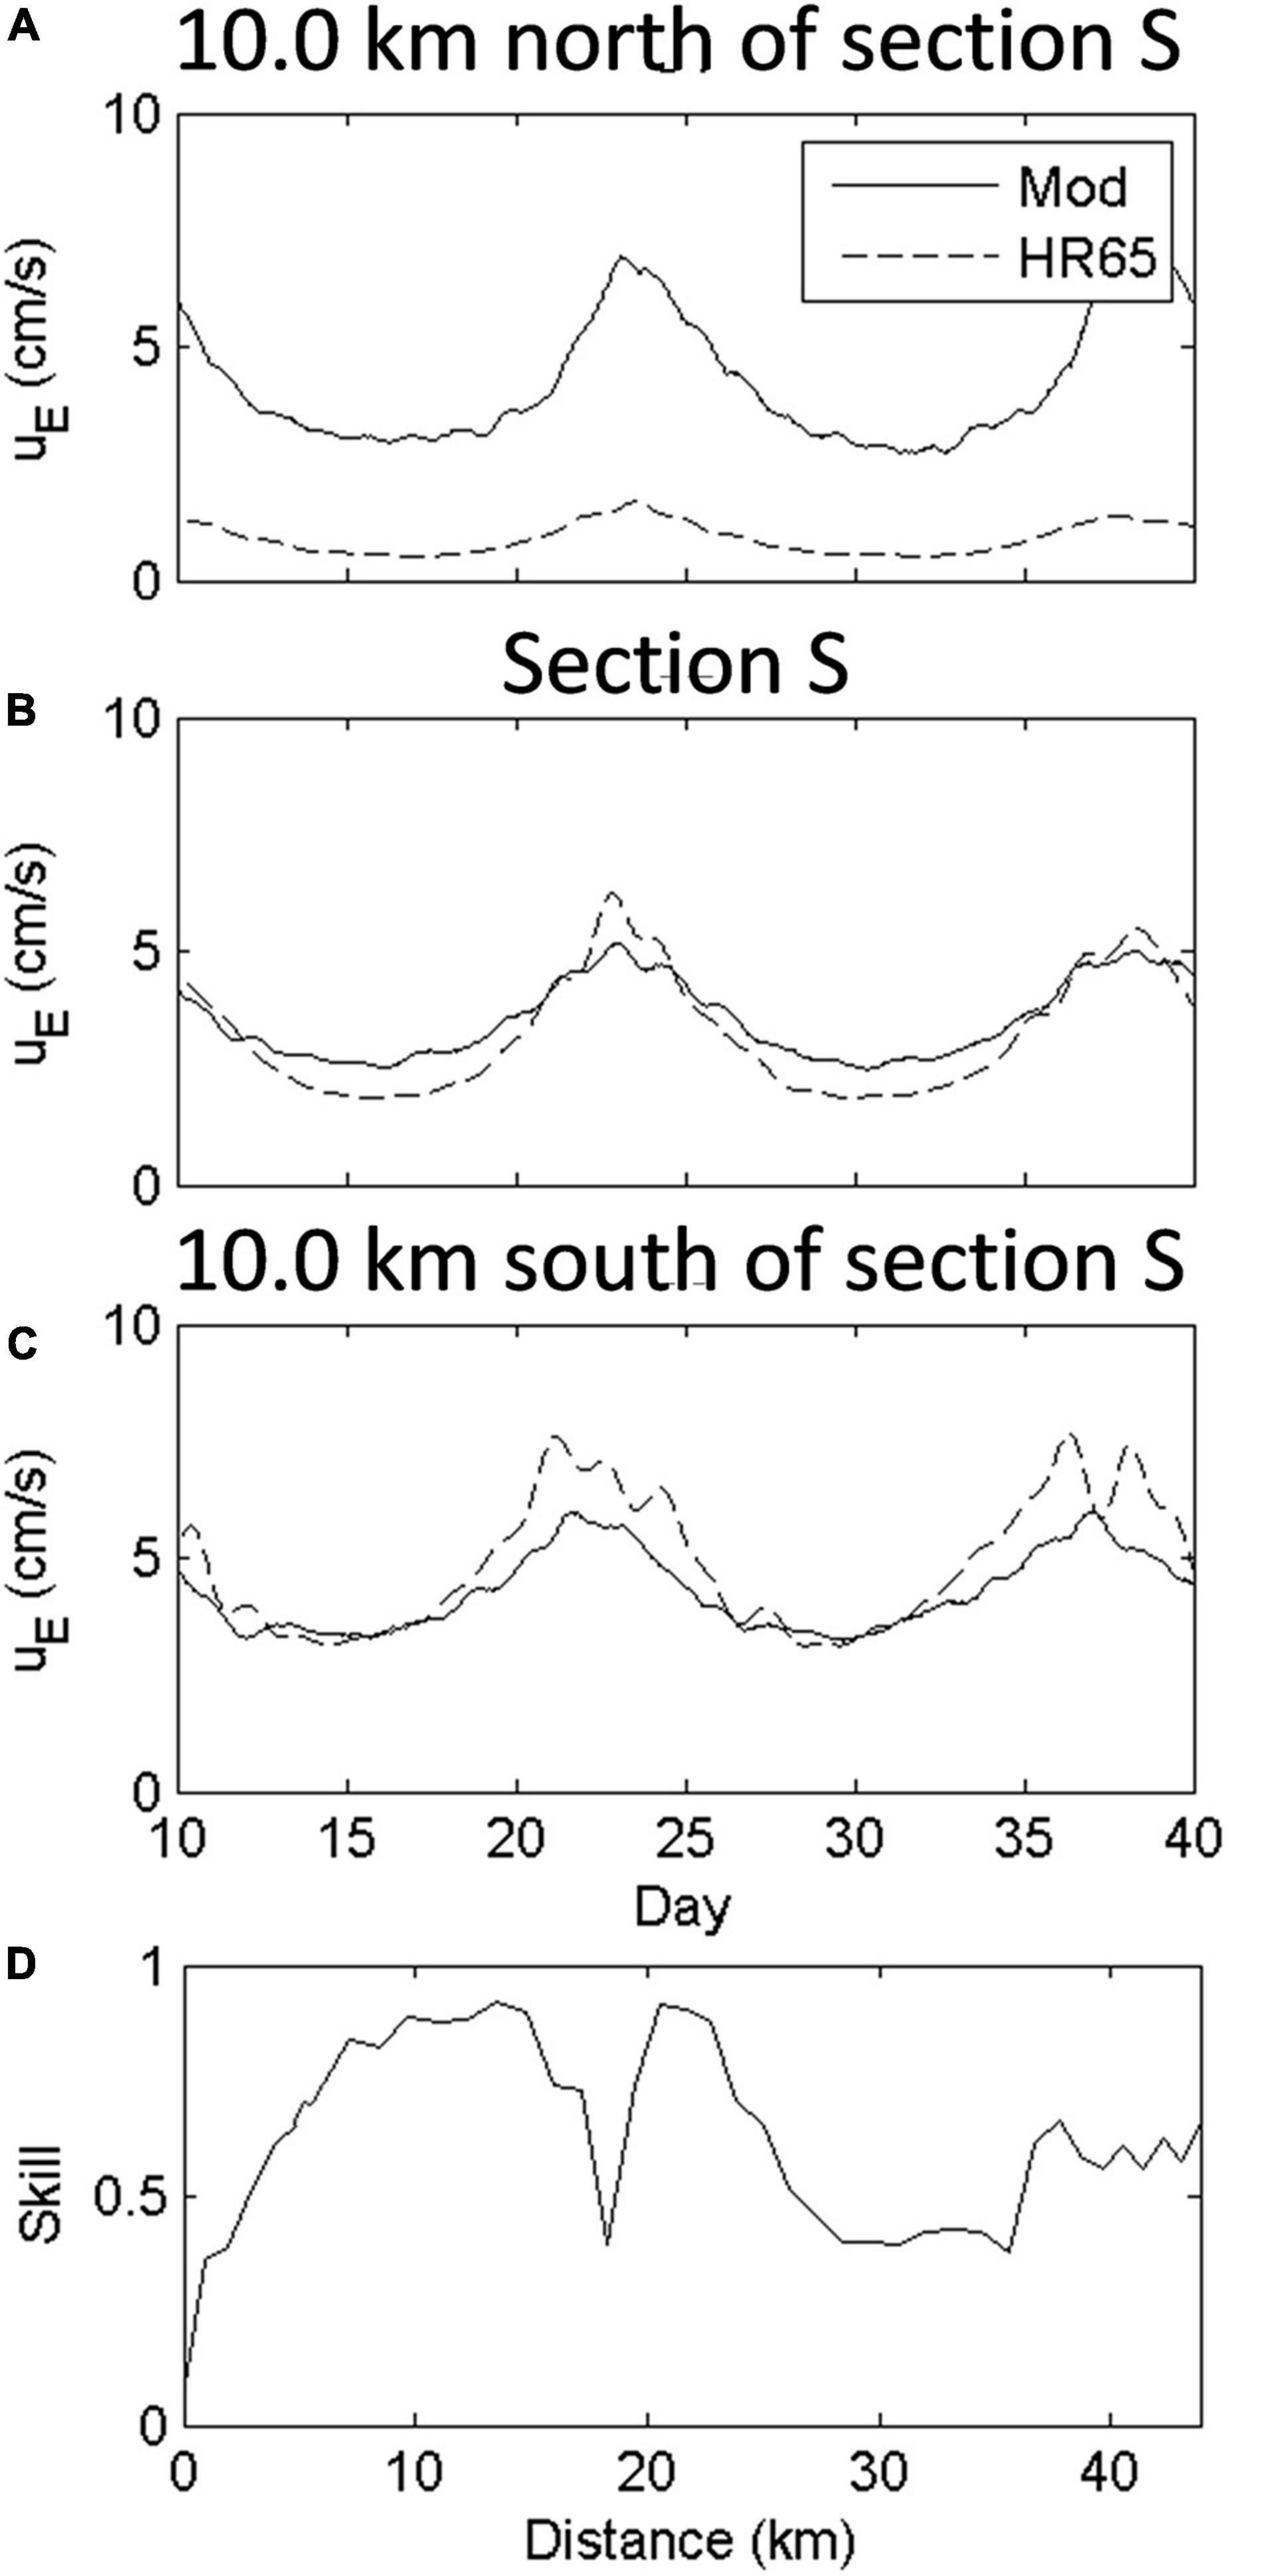
Figure 10. Comparisons between prediction by theory of HR65 (dashed lines) and model simulated (solid lines) subtidal estuarine circulation at (A) 10 km north of the cross-channel section S, (B) the cross-channel section S, and (C) 10 km south of the cross-channel section S. (D) The prediction skill distribution along the western channel. The x-axis represents the distance from the mouth (0 km) to the head (44 km) of the PRE.
In this study, the SEC and its mechanism in the PRE is investigated by a 3D numerical mode. Model results indicate that the dynamics of subtidal estuary circulation in this bell-shaped estuary are much different with narrow and straight estuaries and are highlighted here. The SEC in the PRE has a two-layer structure with inflow at the lower layer and outflow at the upper layer. It is driven by the along-channel density gradient during neap tide period when the tide range is relatively small. However, it is mainly controlled by tidal mixing rather than the along-channel density gradient during spring tide period when tide with large range converges toward the bell-shaped estuary and generates a strong energy of tidal mixing. As a result, the salinity stratification and intrusion are much weakened in this period. The along-channel momentum balance shows that both lateral and axial advections reach the leading order as pressure and stress divergence terms. Under impact of varying lateral geometry, the positive and negative fluxes are distributed on the two sides of the thalweg, which is different from a narrow and uniform estuary. The lateral momentum flux has the opposite sign as the axial flux, and they largely balance each other. However, the net momentum flux has a two-layer structure as baroclinic pressure to reinforce the SEC in the PRE, especially during spring tide. The cross-sectionally averaged total advection is mostly contributed from axial advection. The cross-sectionally and tidally averaged lateral advection is secondary and plays a role to reduce the SEC. The lateral circulation in the western channel is mainly driven by geostrophic balance and density circulation. The Ekman tidal rectification is evident. Nonlinear effect influences on the lateral circulation, especially during ebb tide, which functions as baroclinic pressure. The impact of sectionally averaged nonlinear advection on the SEC is limited at the central region of the PRE where the SEC strongly depends on the along-channel density gradient and tidal mixing that can be predicted by the linear scaling based on HR65’s theory with high predictive skill.
Data Availability Statement
The original contributions presented in the study are included in the article/supplementary material, further inquiries can be directed to the corresponding author.
Author Contributions
HX took part in the most works of this research, including writing the manuscript draft, model running, and result analyses. JS helped to design model experiments and modified the manuscript draft. DW and LL revised the manuscript and gave advices on manuscript structure. BH provided validated model and guided the whole theoretic diagnoses as project PI. All authors contributed to the article and approved the submitted version.
Funding
This research was funded by the National Natural Science Foundation of China (41666001 and 41976014), the Natural Science Foundation of Guangdong (2018A030313901), the CAS Frontier Basic Research Project (QYJC201910), and the Strategic Priority Research Program of the CAS (XDA13030302).
Conflict of Interest
The authors declare that the research was conducted in the absence of any commercial or financial relationships that could be construed as a potential conflict of interest.
Footnotes
References
Basdurak, N. B., and Valle-Levinson, A. (2012). Influence of advective accelerations on estuarine exchange at a Chesapeake Bay tributary. J. Phys. Oceanogr. 42, 1617–1634. doi: 10.1175/Jpo-D-11-0134.1
Blumberg, A. F., and Mellor, G. L. (1987). “A description of a three-dimensional coastal ocean circulation model,” in Three-Dimensional Coastal Ocean Models, Coastal Estuarine Sci, Vol. 4, ed. N. S. Heaps (Washington, DC: AGU), 1–16. doi: 10.1029/CO004p0001
Chatwin, P. C. (1976). Some remarks on the maintenance of the salinity distribution in estuaries. Estuar. Coast. Mar. Sci. 4, 555–566. doi: 10.1016/0302-3524(76)90030-x
Chen, S. N., Sanford, L. P., and Ralston, D. K. (2009). Lateral circulation and sediment transport driven by axial winds in an idealized, partially mixed estuary. J. Geophys. Res. Oceans 114:C12006. doi: 10.1029/2008JC005014
Cheng, P. (2014). Decomposition of residual circulation in estuaries. J. Atmos. Ocean. Technol. 31, 698–713. doi: 10.1175/jtech-d-13-00099.1
Cheng, P., Mao, J., Yu, F., Chen, N., Wang, A., and Xu, F. (2019). A numerical study of residual flow induced by eddy viscosity-shear covariance in a tidally energetic estuary. Estuar. Coast. Shelf Sci. 230:106446. doi: 10.1016/j.ecss.2019.106446
Cheng, P., and Valle-Levinson, A. (2009). Influence of lateral advection on residual currents in microtidal estuaries. J. Phys. Oceanogr. 39, 3177–3190. doi: 10.1175/2009jpo4252.1
Cheng, P., Wang, A., and Jia, J. (2017). Analytical study of lateral-circulation-induced-exchange flow in tidally dominated well-mixed estuaries. Continent. Shelf Res. 140, 1–10. doi: 10.1016/j.csr.2017.03.013
Collignon, A. G., and Stacey, M. T. (2012). Intratidal dynamics of fronts and lateral circulation at the shoal-channel interface in a partially stratified estuary. J. Phys. Oceanogr. 42, 869–883. doi: 10.1175/jpo-d-11-065.1
Dong, L. X., Su, J. L., Wong, L. A., Cao, Z. Y., and Chen, J. C. (2004). Seasonal variation and dynamics of the Pearl River plume. Continent. Shelf Res. 24, 1761–1777. doi: 10.1016/j.csr.2004.06.006
Galperin, B., Kantha, L. H., Hassid, S., and Rosati, A. (1988). A Quasi-equilibrium turbulent energy model for geophysical flows. J. Atmos. Sci. 45, 55–62. doi: 10.1175/1520-0469(1988)045<0055:aqetem>2.0.co;2
Geyer, W. R., Trowbridge, J. H., and Bowen, M. M. (2000). The dynamics of a partially mixed estuary. J. Phys. Oceanogr. 30, 2035–2048. doi: 10.1175/1520-0485(2000)030<2035:tdoapm>2.0.co;2
Gong, W. P., and Shen, J. (2011). The response of salt intrusion to changes in river discharge and tidal mixing during the dry season in the Modaomen Estuary, China. Continent. Shelf Res. 31, 769–788. doi: 10.1016/j.csr.2011.01.011
Hamrick, J. M. (1996). User’s Manual for the Environmental Fluid Dynamics Computer Code, Dept. of Physical Sciences, School of Marine Science. Gloucester Point, VA: Virginia Institute of Marine Science College of William and Mary.
Hansen, D. V., and Rattray, M. (1965). Gravitational circulation in straits and estuaries. J. Mar. Res. 23, 104–122.
Hong, B., Gong, W. P., Peng, S. Q., Xie, Q., Wang, D. X., and Xu, H. Z. (2016). Characteristics of vertical exchange process in the Pearl River Estuary. Aquat. Ecosyst. Health Manag. 19, 286–295. doi: 10.1080/14634988.2016.1205438
Hong, B., Liu, Z. H., Shen, J., Wu, H., Gong, W. P., Xu, H. Z., et al. (2020a). Potential physical impacts of sea-level rise on the Pearl River Estuary, China. J. Mar. Syst. 201:103245. doi: 10.1016/j.jmarsys.2019.103245
Hong, B., and Shen, J. (2012). Responses of estuarine salinity and transport processes to potential future sea-level rise in the Chesapeake Bay. Estuar. Coast. Shelf Sci. 104, 33–45. doi: 10.1016/j.ecss.2012.03.014
Hong, B., Wang, G. Y., Xu, H. Z., and Wang, D. X. (2020b). Study on the transport of terrestrial dissolved substances in the pearl river estuary using passive tracers. Water 12:1235. doi: 10.3390/w12051235
Huijts, K. M. H., Schuttelaars, H. M., de Swart, H. E., and Friedrichs, C. T. (2009). Analytical study of the transverse distribution of along-channel and transverse residual flows in tidal estuaries. Continent. Shelf Res. 29, 89–100. doi: 10.1016/j.csr.2007.09.007
Ji, X. M., Sheng, J. Y., Tang, L. Q., Liu, D. B., and Yang, X. L. (2011). Process study of circulation in the Pearl River Estuary and adjacent coastal waters in the wet season using a triply-nested circulation model. Ocean Model. 38, 138–160. doi: 10.1016/j.ocemod.2011.02.010
Lacy, J. R., Stacey, M. T., Burau, J. R., and Monismith, S. G. (2003). Interaction of lateral baroclinic forcing and turbulence in an estuary. J. Geophys. Res. Oceans 108:3089. doi: 10.1029/2002JC001392
Lerczak, J. A., and Geyer, W. R. (2004). Modeling the lateral circulation in straight, stratified estuaries. J. Phys. Oceanogr. 34, 1410–1428. doi: 10.1175/1520-0485(2004)034<1410:mtlcis>2.0.co;2
Li, Y., and Li, M. (2012). Wind-driven lateral circulation in a stratified estuary and its effects on the along-channel flow. J. Geophys. Res. Oceans 117:C09005. doi: 10.1029/2011JC007829
Lin, J., and Kuo, A. (2003). A model study of turbidity maxima in the York River estuary, Virginia. Estuaries 26, 1269–1280. doi: 10.1007/bf02803629
Lin, Z., Zhang, H., Lin, H., and Gong, W. (2019). Intraseasonal and interannual variabilities of saltwater intrusion during dry seasons and the associated driving forcings in a partially mixed estuary. Continent. Shelf Res. 174, 95–107. doi: 10.1016/j.csr.2019.01.008
MacCready, P. (2004). Toward a unified theory of tidally-averaged estuarine salinity structure. Estuaries 27, 561–570. doi: 10.1007/bf02907644
MacCready, P. (2007). Estuarine adjustment. J. Phys. Oceanogr. 37, 2133–2145. doi: 10.1175/JPO3082.1
Mao, Q., Shi, P., Yin, K., Gan, J., and Qi, Y. (2004). Tides and tidal currents in the Pearl River Estuary. Continent. Shelf Res. 24, 1797–1808. doi: 10.1016/j.csr.2004.06.008
Martin, W. D., and MacCready, P. (2011). Influence of large-scale tidal asymmetry on subtidal dynamics in the western Strait of Juan de Fuca. J. Geophys. Res. Oceans 116:C02009. doi: 10.1029/2010JC006363
Mellor, G., and Yamada, T. (1982). Development of a turbulent closure model for geophysical fluid problems. Rev. Geophys. Space Phys. 20, 851–875. doi: 10.1029/rg020i004p00851
Pan, J., Lai, W., and Devlin, A. T. (2020). Channel-trapped convergence and divergence of lateral velocity in the Pearl River Estuary: influence of along-estuary variations of channel depth and width. J. Geophys. Res. Oceans 125:e2019JC015369. doi: 10.1029/2019JC015369
Park, K., Jung, H. S., Kim, H. S., and Ahn, S. M. (2005). Three-dimensional hydrodynamic-eutrophication model (HEM-3D): application to Kwang-Yang Bay, Korea. Mar. Environ. Res. 60, 171–193. doi: 10.1016/j.marenvres.2004.10.003
Ralston, D. K., Geyer, W. R., and Lerczak, J. A. (2008). Subtidal salinity and velocity in the Hudson River estuary: observations and modeling. J. Phys. Oceanogr. 38, 753–770. doi: 10.1175/2007jpo3808.1
Savenije, H. H. G., Toffolon, M., Haas, J., and Veling, E. J. M. (2008). Analytical description of tidal dynamics in convergent estuaries. J. Geophys. Res. Oceans 113:C10025. doi: 10.1029/2007JC004408
Scully, M. E., Geyer, W. R., and Lerczak, J. A. (2009). The influence of lateral advection on the residual estuarine circulation: a numerical modeling study of the Hudson River Estuary. J. Phys. Oceanogr. 39, 107–124. doi: 10.1175/2008jpo3952.1
Shen, J., and Haas, L. (2004). Calculating age and residence time in the tidal York River using three-dimensional model experiments. Estuar. Coast. Shelf Sci. 61, 449–461. doi: 10.1016/j.ecss.2004.06.010
Shen, J., and Lin, J. (2006). Modeling Study of the influences of tide and stratification on age of water in the tidal James River. Estuar. Coast. Shelf Sci. 68, 101–112. doi: 10.1016/j.ecss.2006.01.014
Trowbridge, J. H., Geyer, W. R., Bowen, M. M., and Williams, A. J. (1999). Near-bottom turbulence measurements in a partially mixed estuary: turbulent energy balance, velocity structure, and along-channel momentum balance. J. Phys. Oceanogr. 29, 3056–3072. doi: 10.1175/1520-0485(1999)029<3056:nbtmia>2.0.co;2
Valle-Levinson, A., and Guo, X. Y. (2009). Asymmetries in tidal flow over a Seto Inland Sea scour pit. J. Mar. Res. 67, 619–635. doi: 10.1357/002224009791218850
Wong, L. A., Chen, J., Xue, H., Dong, L. X., Su, J. L., and Heinke, G. (2003a). A model study of the circulation in the Pearl River Estuary (PRE) and its adjacent coastal waters: 1. Simulations and comparison with observations. J. Geophys. Res. Oceans 108:3156. doi: 10.1029/2002JC001451
Wong, L. A., Chen, J. C., and Dong, L. X. (2004). A model of the plume front of the Pearl River Estuary, China and adjacent coastal waters in the winter dry season. Continent. Shelf Res. 24, 1779–1795. doi: 10.1016/j.csr.2004.06.007
Wong, L. A., Chen, J. C., Xue, H., Dong, L. X., Guan, W. B., and Su, J. L. (2003b). A model study of the circulation in the Pearl River Estuary (PRE) and its adjacent coastal waters: 2. Sensitivity experiments. J. Geophys. Res. Oceans 108:3157. doi: 10.1029/2002JC001452
Wu, H., Zhu, J., Shen, J., and Wang, H. (2011). Tidal modulation on the Changjiang River plume in summer. J. Geophys. Res. Oceans 116:C08017. doi: 10.1029/2011jc007209
Xia, M., Xie, L., and Pietrafesa, L. J. (2010). Winds and the orientation of a coastal plane estuary plume. Geophys. Res. Letter 37:L19601. doi: 10.1029/2010GL044494
Xu, H. Z., Lin, J., Shen, J., and Wang, D. X. (2008a). Wind impact on pollutant transport in a shallow estuary. Acta Oceanol. Sin. 27, 147–160.
Xu, H. Z., Lin, J., and Wang, D. X. (2008b). Numerical study on salinity stratification in the Pamlico River Estuary. Estuar. Coast. Shelf Sci. 80, 74–84. doi: 10.1016/j.ecss.2008.07.014
Keywords: nonlinearity, subtidal estuarine circulation, advection, lateral circulation, the Pearl River Estuary, EFDC model
Citation: Xu H, Shen J, Wang D, Luo L and Hong B (2021) Nonlinearity of Subtidal Estuarine Circulation in the Pearl River Estuary, China. Front. Mar. Sci. 8:629403. doi: 10.3389/fmars.2021.629403
Received: 14 November 2020; Accepted: 28 April 2021;
Published: 15 June 2021.
Edited by:
Pengfei Xue, Michigan Technological University, United StatesCopyright © 2021 Xu, Shen, Wang, Luo and Hong. This is an open-access article distributed under the terms of the Creative Commons Attribution License (CC BY). The use, distribution or reproduction in other forums is permitted, provided the original author(s) and the copyright owner(s) are credited and that the original publication in this journal is cited, in accordance with accepted academic practice. No use, distribution or reproduction is permitted which does not comply with these terms.
*Correspondence: Bo Hong, bohong@scut.edu.cn