Article

A Low-Cost System for Moisture Content Detection of Bagasse upon a Conveyor Belt with Multispectral Image and Various Machine Learning Methods

by
Natrapee Nakawajana
1,
Patchara Lerdwattanakitti
2,3,
Wanphut Saechua
1,*,
Jetsada Posom
2,3,*,
Khwantri Saengprachatanarug
2,3 and
Seree Wongpichet
2
1
Department of Agricultural Engineering, School of Engineering, King Mongkut’s Institute of Technology Ladkrabang, Bangkok 10520, Thailand
2
Department of Agricultural Engineering, Faculty of Engineering, Khon Kaen University, Khon Kaen 40002, Thailand
3
Applied Engineering for Important Crops of the North East Research Group, Department of Agricultural, Engineering, Faculty of Engineering, Khon Kaen University, Khon Kaen 40002, Thailand
*
Authors to whom correspondence should be addressed.
Processes 2021, 9(5), 777; https://doi.org/10.3390/pr9050777
Submission received: 31 March 2021 / Revised: 24 April 2021 / Accepted: 27 April 2021 / Published: 28 April 2021

Abstract

:
This research aimed to propose an online system based on multispectral images for the real-time estimation of the moisture content (MC) of sugarcane bagasse. The system consisted of a conveyor belt, four halogen bulbs, and a multispectral camera. The MC models were developed using machine learning algorithms, i.e., multiple linear regression (MLR), principal component regression (PCR), artificial neural network (ANN), PCA-ANN, Gaussian process regression (GPR), PCA-GPR, random forest regression (RFR), and PCA-GPR. The models were developed using 150 samples (calibration set) meanwhile the remaining 50 samples were applied as a validation set. The comparison of all developed models showed that the PCA-RFR model achieved better detection with a higher accuracy of MC prediction. The PCA-RFR model showed the best results which were a coefficient of determination of prediction (r2) of 0.72, root mean square error of prediction (RMSEP) of 11.82 wt%, and a ratio of the standard error of prediction to standard deviation (RPD) of 1.85. The results show that this technique was very useful for MC rapid screening of the sugarcane bagasse.

1. Introduction

Sugarcane is one of the most important agricultural crops in Thailand and plays a significant role in the country′s economics [1]. Sugarcane bagasse (SB) was a residue waste from the juice extracting process in the sugar production which was approximately 29% of as-received sugarcane weight [2]. In the harvesting season of 2019/2020, around 130 million tons of sugarcane were sent to sugarcane mill plants [3] which produced a total SB of approximately 37.7 million tons. Sugarcane bagasse normally can be used as a major source of energy and as a raw material in combustion, gasification, and pyrolysis processes. Approximately 99.96% of the total SB was used within the combustion process to operate a steam turbine for generating electricity by direct combustion [4]. The energy characteristics of SB were as follows: as-received SB contained a water content of about 50%, and dried SB contained 50% cellulose, 25% lignocellulose, and 25% lignin [5]. The proximate analysis of SB showed that it contained 14.95% volatile matter (VM), 73.78% fixed carbon (FC), 11.27% ash, and calorific measurement revealed a higher heating value (HHV) of 17.33 MJ/kg [6], and lower heating value (LHV) of 19.37 MJ/kg dry basis [7]. Isabirye et al. [8] suggested that one ton of SB could produce up to two tons of steam, and five tons of steam could produce 1.0 MWh of electricity. Therefore, efficient SB use is significant in the power plant economy and sugar production.
Moisture content (MC) is the main factor negatively impacting the combustion process [9]. High MC levels reduced the energy potential of SB during combustion [7], and a high MC in SB also required a high amount of energy to release water [7]. Generally, the MC of SB is around 50% after the milling process [10], which is normally used for the boilers. Therefore, SB with an MC ≤ 50% is considered to be a good quality feedstock [1,10]. High moisture content in SB caused the reduction of combustion degradation [10], which induced a decrease in temperature, leading to delay in combustion [4]. The storage method was one of the factors affecting the MC of SB. Various initial properties of sugarcane, such as variety, harvesting age, and harvesting methods (auto-sugarcane harvester, manual harvester, and harvester by burning fields), led to varying SB properties. During the extraction process, water was sprayed on the sugarcane to maintain high juice quality and yield.
Currently, MC is estimated by either an MC sensor probe or visual checking, with the latter being labor intensive and lower accurate. When the operator observes SB with a high MC, other fuels as wood chip and rice husk are mixed with the SB to obtain lower MC. For this reason, inline MC monitoring should be implemented as a real-time measurement of MC in order to provide more reliable results within a shorter time.
The multispectral image camera, a low-cost device, provides three visible bands (blue, B; green, G; red, R) and two invisible bands (RedEdge and near-infrared, NIR); these wavelengths interact with the chemical substances i.e., carbon (C), hydrogen (H), nitrogen (N), oxygen (O), and sulfur (S). The reflectance value can be presented in a 2D image. The image provides the spatial information presented in the picture-pixel. The prediction of the organic matter was also presented in the 2D image. The information of the sample surface, MC, chemical properties, and physical properties interacting with VIS/NIR was reflected to the detector and recorded as a reflectance value. The optical information was used for modeling when using multivariate analysis.
The multispectral camera consisted of five bands i.e., blue (430–520 nm), green (520–600 nm), red (630–690 nm), NIR (760–900 nm), and RedEdge (710–730 nm). According to the summarization from Wu et al. [11], the wavebands of the blue, green, and NIR regions were related to the vibrational band of water and hydrocarbon, which corresponds to the O–H 2nd overtone (450 (blue) and 528 (green) nm), and the 3rd overtone of OH-stretching + OH-bending (815–985 nm). In addition, the wavelength range of 870–885 nm was a vibrational band of the 3rd overtone of -CH3 stretching. Spectral reflectance, in particular wavelengths of approximately 800 nm, was selected as an optimal band for predicting vegetation water content due to deep penetration of radiation into the leaf surface [11]. Liu et al. [12] reported that the combination of NIR spectra with R, G, B data could increase the model accuracy for the prediction of water-injected beef samples using multispectral imaging analysis.
The use of a multispectral camera has many advantages; for example, the 2D camera display can demonstrate the status of the sample on the conveyor which is useful to estimate the volume of the sample. The predicted value can be displayed via distribution mapping, and the camera can detect any impurities such as stones and pieces of wood.
Real-time measurement of MC in biomass (sawdust) using microwave reflection was reported with SEC values from 1.28 to 1.75% [13]. In several studies, the imaging device for online MC measurement of tea leaves was also applied, using hyperspectral imaging (Rv2 values between 0.918 and 0.951) [14] and water-injected meat using multispectral imaging (r2 = 0.946) [12]. However, there were no reports on the possible use of the multispectral image camera for real-time measurement of MC, and its accuracy in the prediction of MC. The measurement of MC has mainly been performed via NIR spectroscopy, e.g., MC of bamboo chips (root mean square error of prediction (RMSEP) of 0.18%) [15], online measurement MC of biomass (relative standard deviations (RSD) of 9.04%) [16], and inline prediction of moisture content in tapioca starch during drying (SEP of 0.61%) [17].
According to our knowledge, there is no research reporting on the application of five-band multispectral imaging for detecting MC distribution in bagasse biomass during conveyor belt transportation. Therefore, the low-cost multispectral image for the real-time estimation of the MC was applied in this research. The prediction model of the MC of SB, based on real-time measurement, was then developed and improved using various machine learning techniques.

2. Materials and Methods
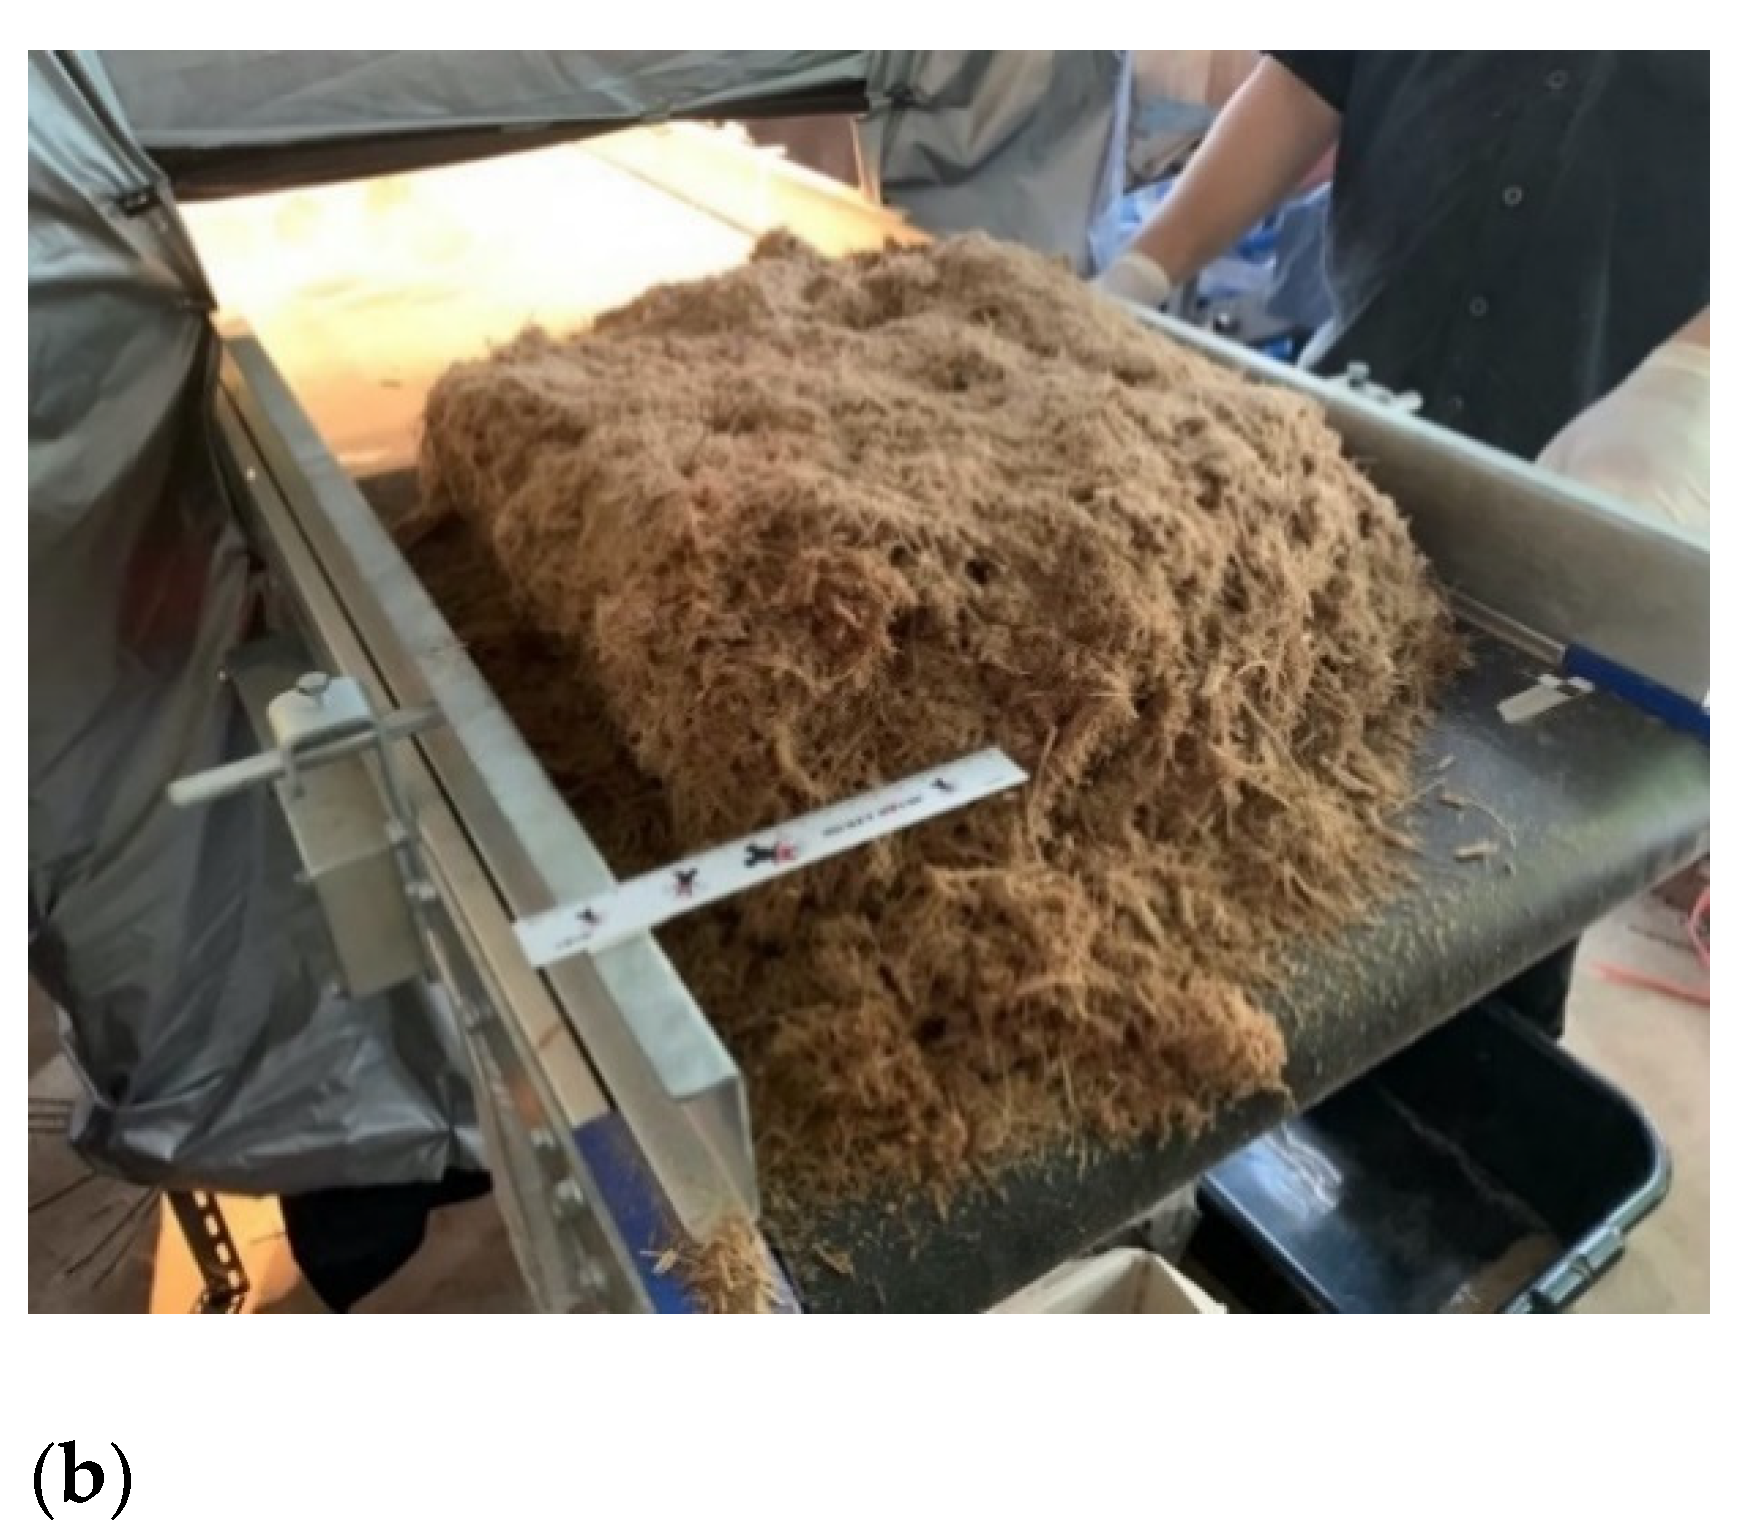
2.1. Sample

Each sample was approximately 3 kg and was randomly collected from different bagasse piles, pile position, and depth and then stored in a plastic bag. In total, 70 bags of SB were collected from the sugarcane mill over 4 months and 3 samples were collected from each bag from December 2019 to March 2020 which is the normal milling season of sugarcane in Thailand. The samples were brought to the Bio-Sensing and Field Robotic (BSFR) Laboratory, Khon Kean University, Thailand, for further experiments.

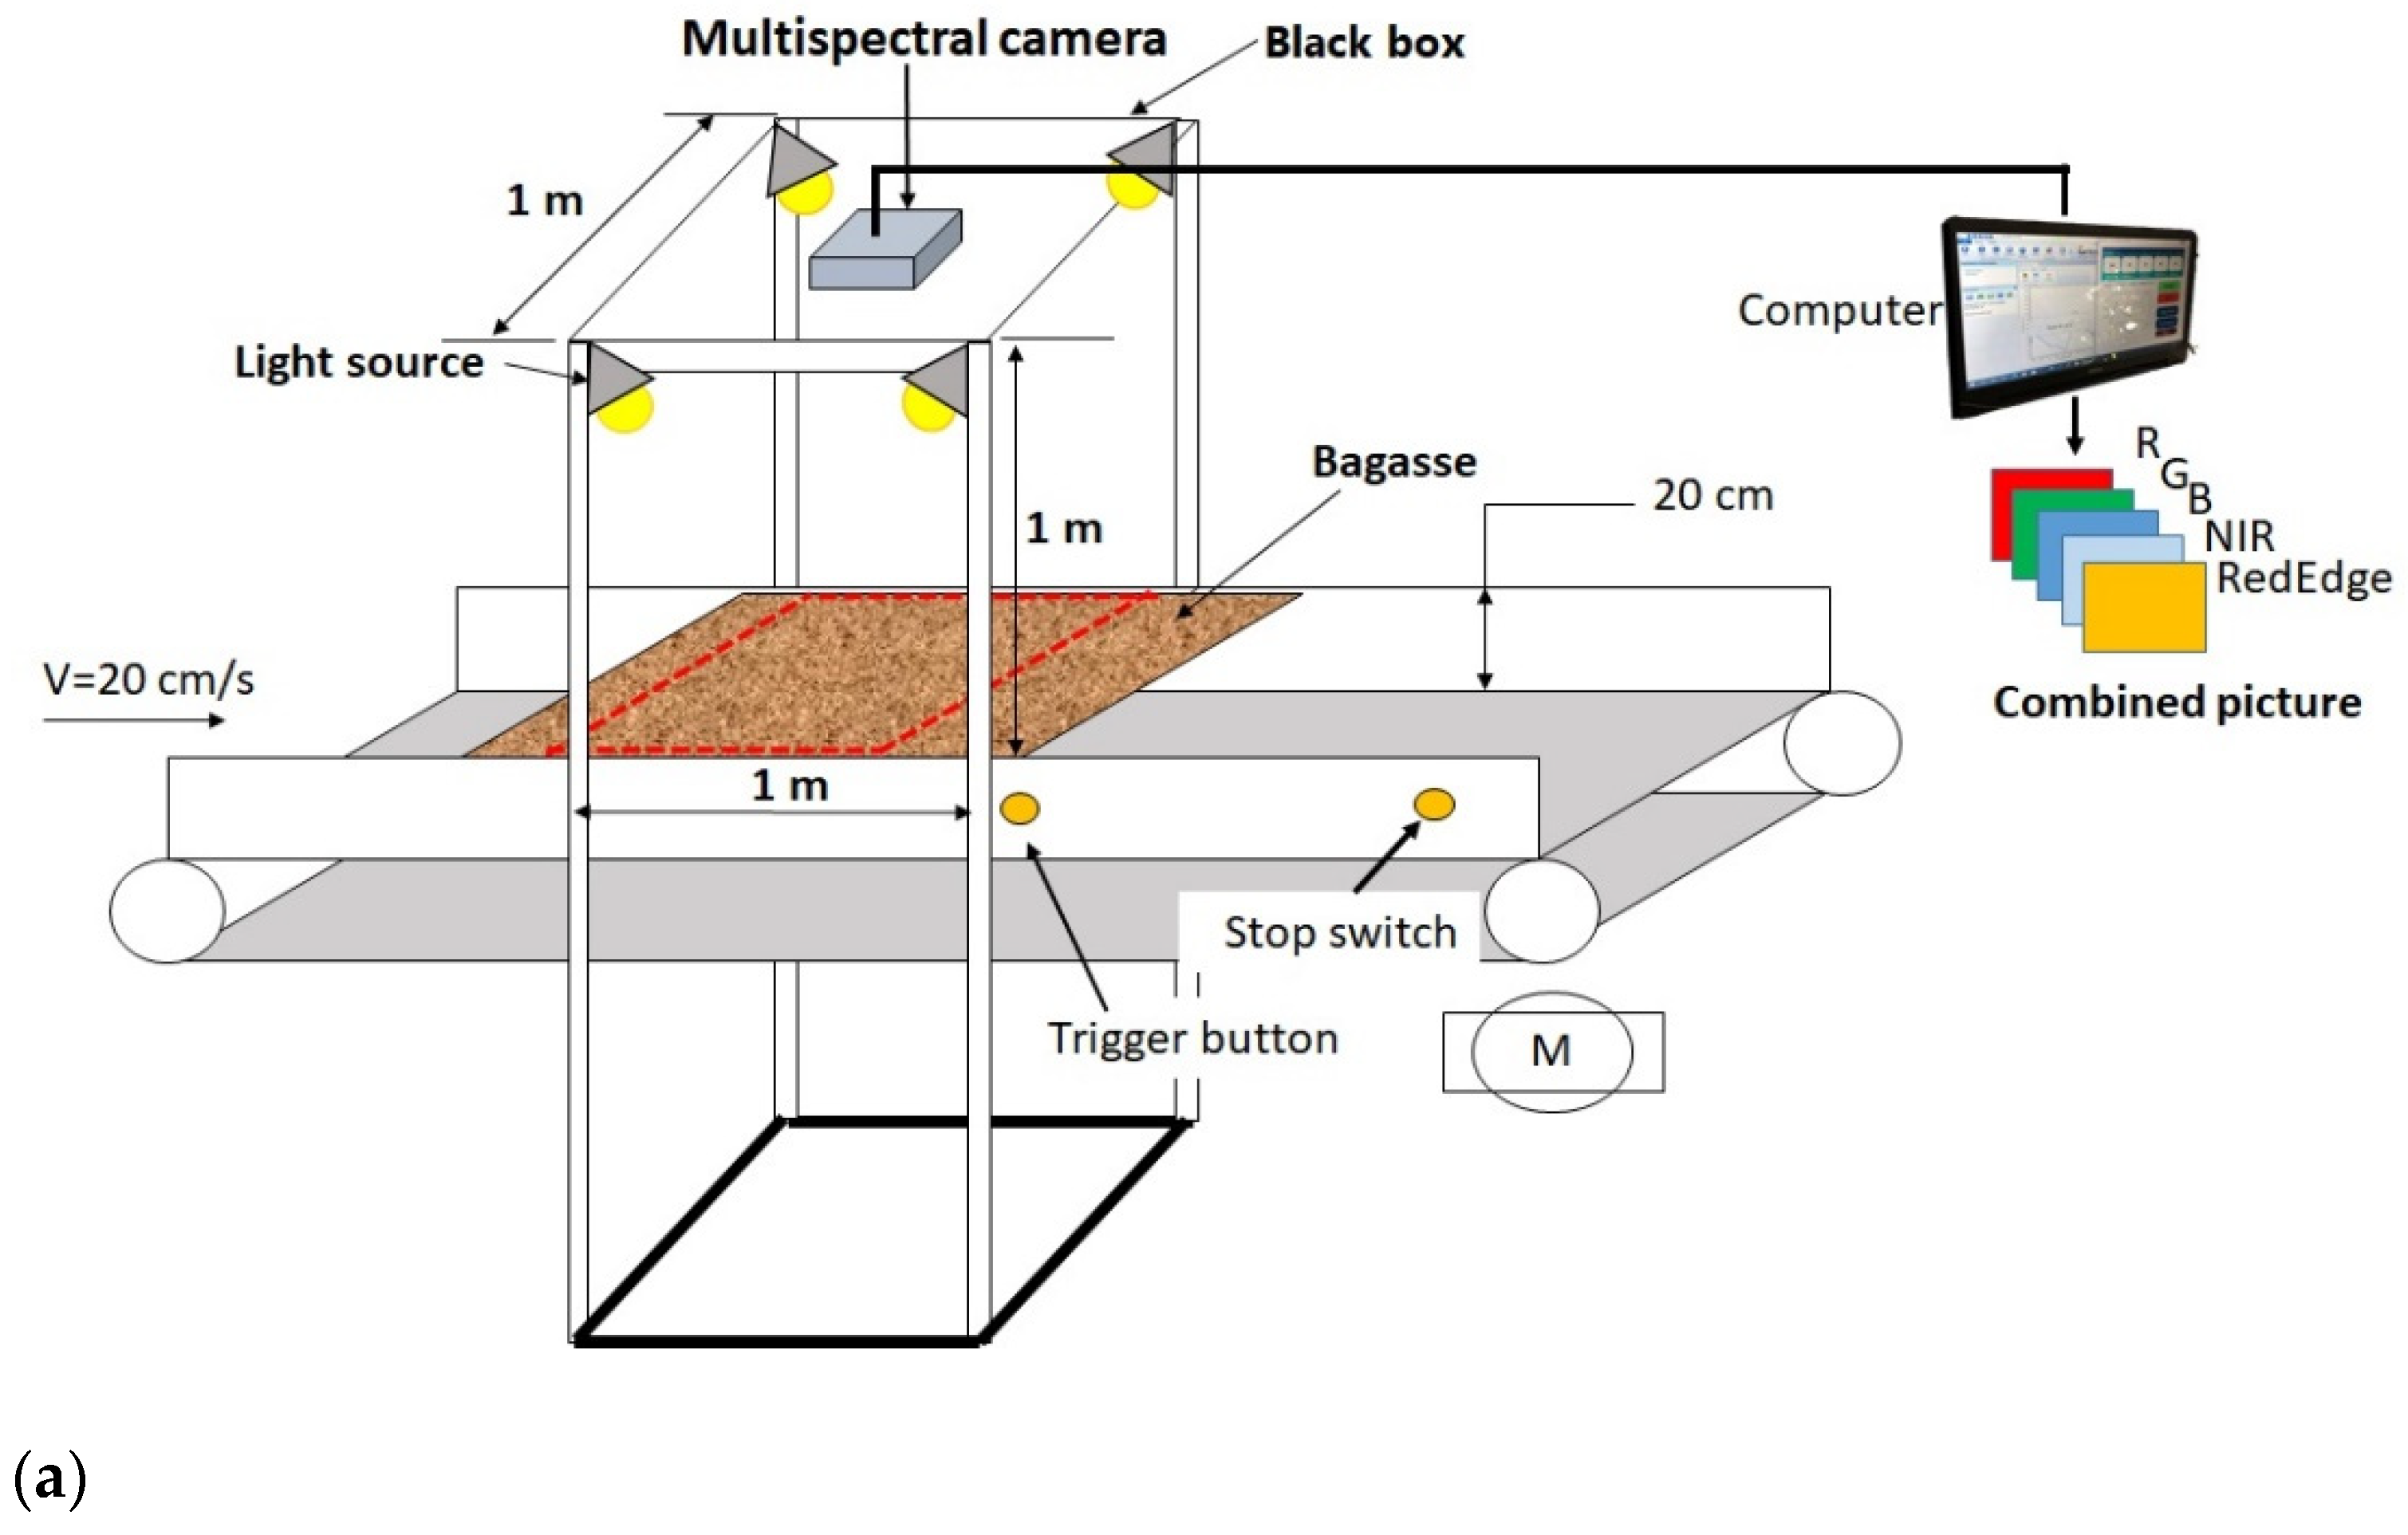
2.2. Measurement System

The experimental unit in Figure 1a, consisted of (1) a conveyor belt (4 m long, 1 m width, and 1.2 m height), (2) a measuring chamber (1 m long, 1 m width, and 1 m height), (3) a multispectral camera (RedEdge, MicaSense, Wichita, KS, USA) providing five wavebands, i.e., R, G, B, NIR, and RedEdge with a center wavelength (nm) of 668, 560, 475, 840, and 717, respectively, (4) four 75W halogen lamps (SYLVANIA Halogen 12 V SA111, Feilo Sylvania company, Hungary). Halogen lamps were installed at each corners of the measuring chamber (Figure 1a) in order to be used as the light source, to eliminate shadow problem and avoid different light intensities. The light source was also used to confirm that the light intensity was not different during experiments. In addition, the halogen lamp provided the infrared radian, which had interaction with the moisture content. The multispectral camera was installed on the top of the measuring chamber at a height of 1 m from the flat conveyor belt. The 20 cm-deep SB sample was poured onto the conveyor, as shown in Figure 1b.

2.3. Image Acquisition

The experimental procedure of real-time MC measurement of bagasse using multispectral images was illustrated in Figure 2. Before capturing, the sample was mixed thoroughly to ensure homogeneity. Images were acquired as follows: (1) the light source was turned on and left for 5 min to ensure a stable light, (2) approximately 3 kg of SB was poured onto the conveyor belt, (3) the dark and white references were collected, (4) the conveyor belt switch was turned on (belt velocity of 20 cm/s) and (4) the bagasse image was captured while the sample was moving under the measuring chamber. The images, collected with five bands (R, G, B, NIR, and RedEdge), were arranged into a 3D format using MatLab (license no: 40846673, MathWorks, Natick, MA, USA). The image resolution was 1280 × 960 pixels with 16-bit.
After capturing, three regions of interest (ROI) in each image (sample) were cropped to 15 × 15 cm, each ROI was assigned as an individual sample then the total was 210 samples, and the reflectance value of each crop was averaged (see Figure 2). The reflectance value was then calculated using Equation (1). The SB at the ROI was taken to determine the MC by oven-drying. Each ROI sample consisted of two replicates; MC was calculated on a wet basis. The relative reflectance value (R) was calculated as described elsewhere [18,19]:
R = ( R sample R dark ) ( R white R dark )
where Rsample is the reflectance of the sample, Rdark is the collected reflectance value while turning off the light source, and Rwhite is the reflectance of the Teflon plate, which was placed on the conveyor belt at the same level as the sample and photographed together with the SB sample (Rwhite was the averaged ROI of the Teflon plate which was assumed to have 100% reflection).

2.4. Reference Method

After capturing and cropping, each cropped sample was assigned as an individual sample. Approximately 5 g of each sample was put into aluminum cans (5 cm diameter and 4 cm height) for determining the MC using a hot air oven (Memmert, model ULM 500, Germany) at 105 °C for 24 h. After that, the samples were re-heated at 6 h intervals until the sample weights remained constant. The weighing was done using a digital balance (AE-ADAM digital balance, Adam Equipment Inc, Fox Hollow Road, Oxford, New York, USA, resolution of 0.001 g). The MC (wt%) was calculated as Equation (2).
MC ,   wt % = ( m i m f m i )   ×   100
where MC (wt%) is moisture content based on wet basis by weight (wt%), mi denoted mass of the sample in g, and the subscripts i and f were initial and final weighing, respectively. There were three replications per sample.

2.5. Modeling and Performance Analysis

The total sample was divided into calibration (70% for the training set) and validation sets (30% for the testing set) of 150 and 50 samples, respectively. The calibration set was used to develop the predictive model, meanwhile, the validation set was used to test the performance of the created model, to confirm whether the developed model could be applied in the future because the independent variable of the test set was not included in the calibration set. Model development included two steps: (1) utilization of various machine learning algorithm techniques to link wavebands features to their MC, (2) testing of the predictive model using independent variables of the test set and examining their performance, and (3) the selection of the optimal algorithm that could predict MC with the highest accuracy.
The relationship between the feature of reflectance value and its corresponding MC was linked together using multivariate analyses including multiple linear regression (MLR), artificial neural networks (ANNs), Gaussian process regression (GPR), and random forest regression (RFR). Finally, their performances were compared.
The five variables, i.e., R, G, B, NIR, and Red-Edge bands were assigned as independent variables (raw) while the measured MC of a sample was the dependent variable. The input data were either raw reflectance data or principal component (PC-score) created by principal component analysis (PCA). The MLR, ANN, GPR, and RFR algorithm were run using PC-score to be the independent variable, called PCA-MLR or principal component regression (PCR); PCA-ANN, PCA-GPR, and PCA-RFR, respectively. The MLR is used to find the regression coefficients with which the best fit of data was performed using the method of least squares. For ANN, we used the optimal number of errors approach. The number of hidden layers was varied between 1 and 10. The optimal number of hidden layer neurons was found if it achieved the minimum of the mean square error. For RER, the minimum number of trees required was obtained where the number of trees provided the minimum mean square error which remained constant.
After modeling, the performance of the model was examined using statistical terms including the coefficient of determination (R2), root mean square error of calibration (RMSEC), root mean square error of prediction (RMSEP), and root mean square error of prediction to standard deviation (RPD). Models providing the highest performance were selected. For example, the model with high r2, low RMSEP, and high RPD has high accuracy. The model with the lowest RMSEP was selected. The RMSEP was the error uncertainty that could be expected for predictions of future samples [20]. The usefulness of a developed model in application was indicated by the performance of the validation set. Considering the application of NIR spectroscopy, the r2 value was used to consider the application level. The r2 value of 0.00−0.49 indicates a poor correlation and the model was not recommended, 0.50−0.64 for rough screening, 0.66−0.81 for screening, 0.83−0.90 with caution for most applications, 0.92−0.96 for quality assurance, and >0.98 for any application. An RPD between 1.5 and 2 means that the model can discriminate between low and high values of the response variable; a value between 2 and 2.5 indicates that coarse quantitative predictions are possible; a value between 2.5 and 3 or above corresponds to good and excellent prediction accuracies, respectively [20].

3. Results and Discussion
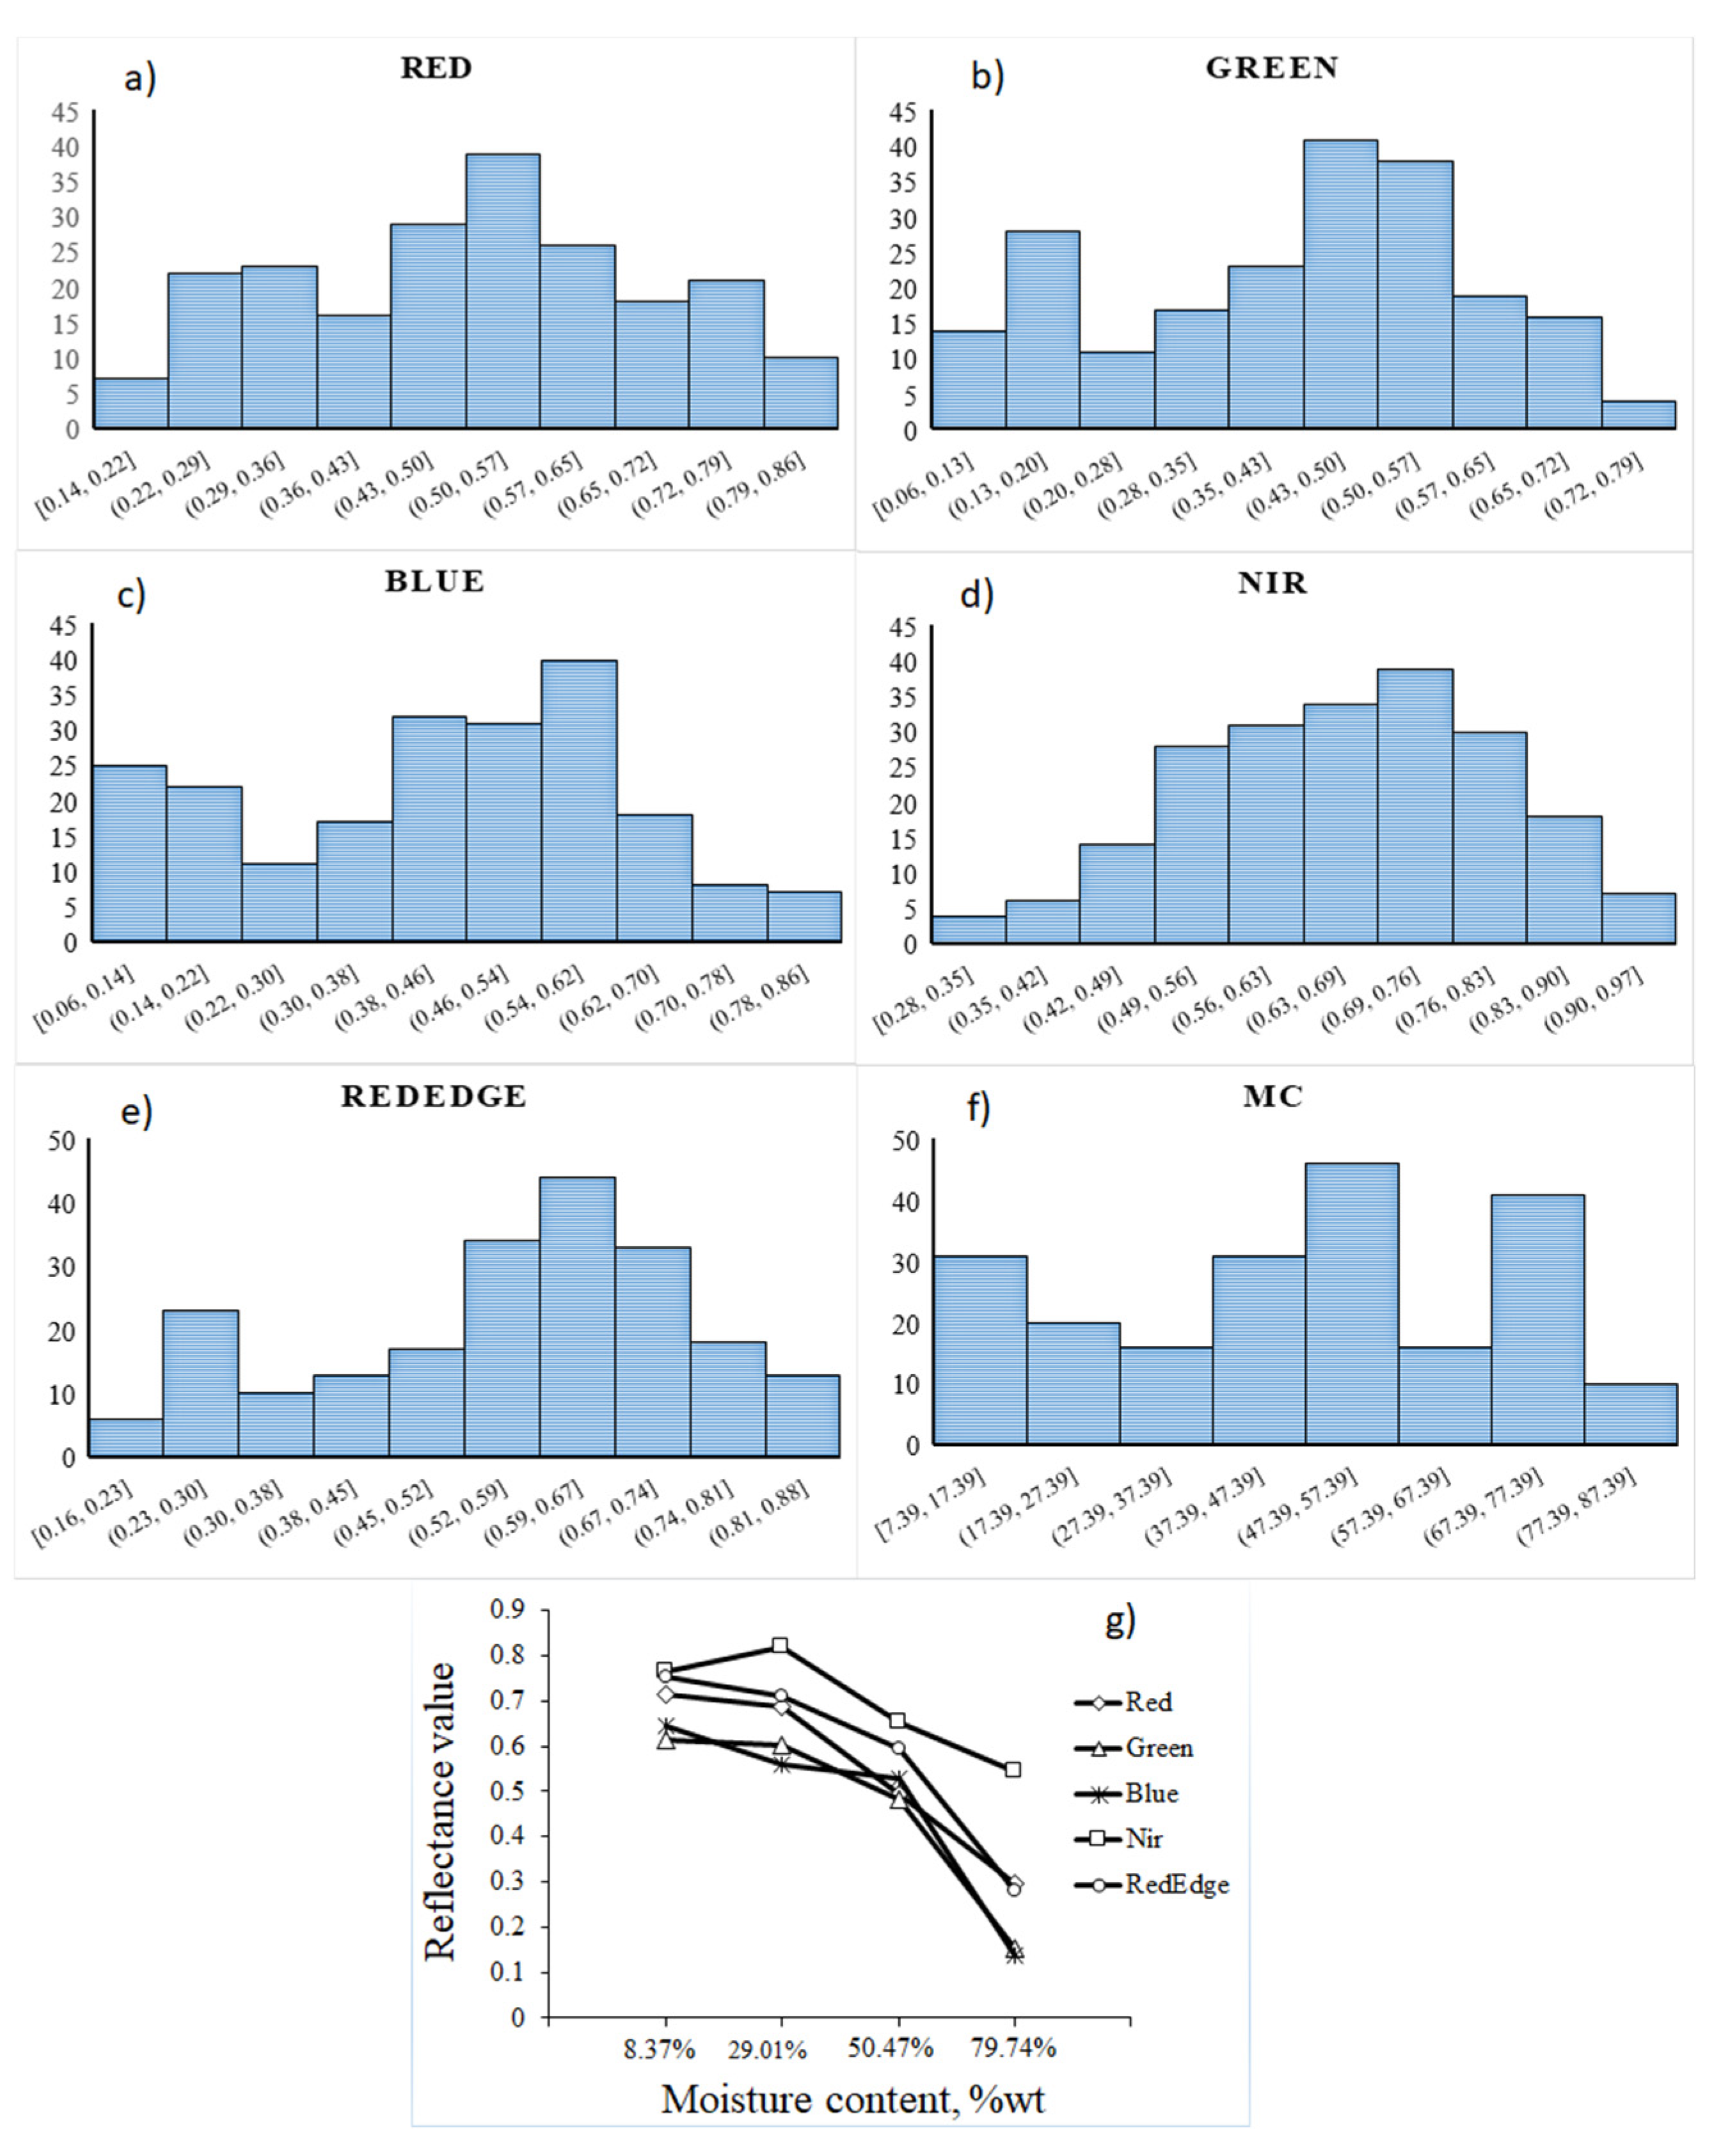
3.1. Measured MC

The relative reflectance values of multispectral images including red, green, blue, NIR, and RedEdge, and MC data used for model development are shown in Table 1, including minimum, maximum, average, and standard deviation (SD). The range of MCs was 21.79 wt% (w.b.), indicating that within the same pile, MC varied to a large extent.
Max denotes maximum; Min denotes minimum; AVE denotes average; SD denotes standard deviation; MC denotes moisture content. The histogram in Figure 3a–f shows the pixel intensity distribution of the bagasse for the red, green, blue, NIR, and RedEdge, respectively. Figure 3g shows the relationship between the intensity of the relative reflectance and the MC of the bagasse sample—it can be seen that the relative reflectance decreased with increasing in MC. This means that bagasse with much higher moisture content absorbed light more than a lower MC sample. Correlation between the relative reflectance value of a multispectral image and moisture content was demonstrated in Table 2, which shows that the red band had a strong correlation with MC, followed by RedEdge, green, NIR, and lastly, the blue band. All image bands correlated negatively with moisture content, meaning that as the moisture content of bagasse increased, reflectance from the sample decreased. It could be indicated that water was a strong light absorber and a very good absorber in the visible and IR region [21]. Figure 4 shows the principal components of the relative reflectance image for the bagasse sample. The first two principal components, accounting for 96% (87% + 9%), showed that the sample distribution was very wide and these samples were good representative samples [22].

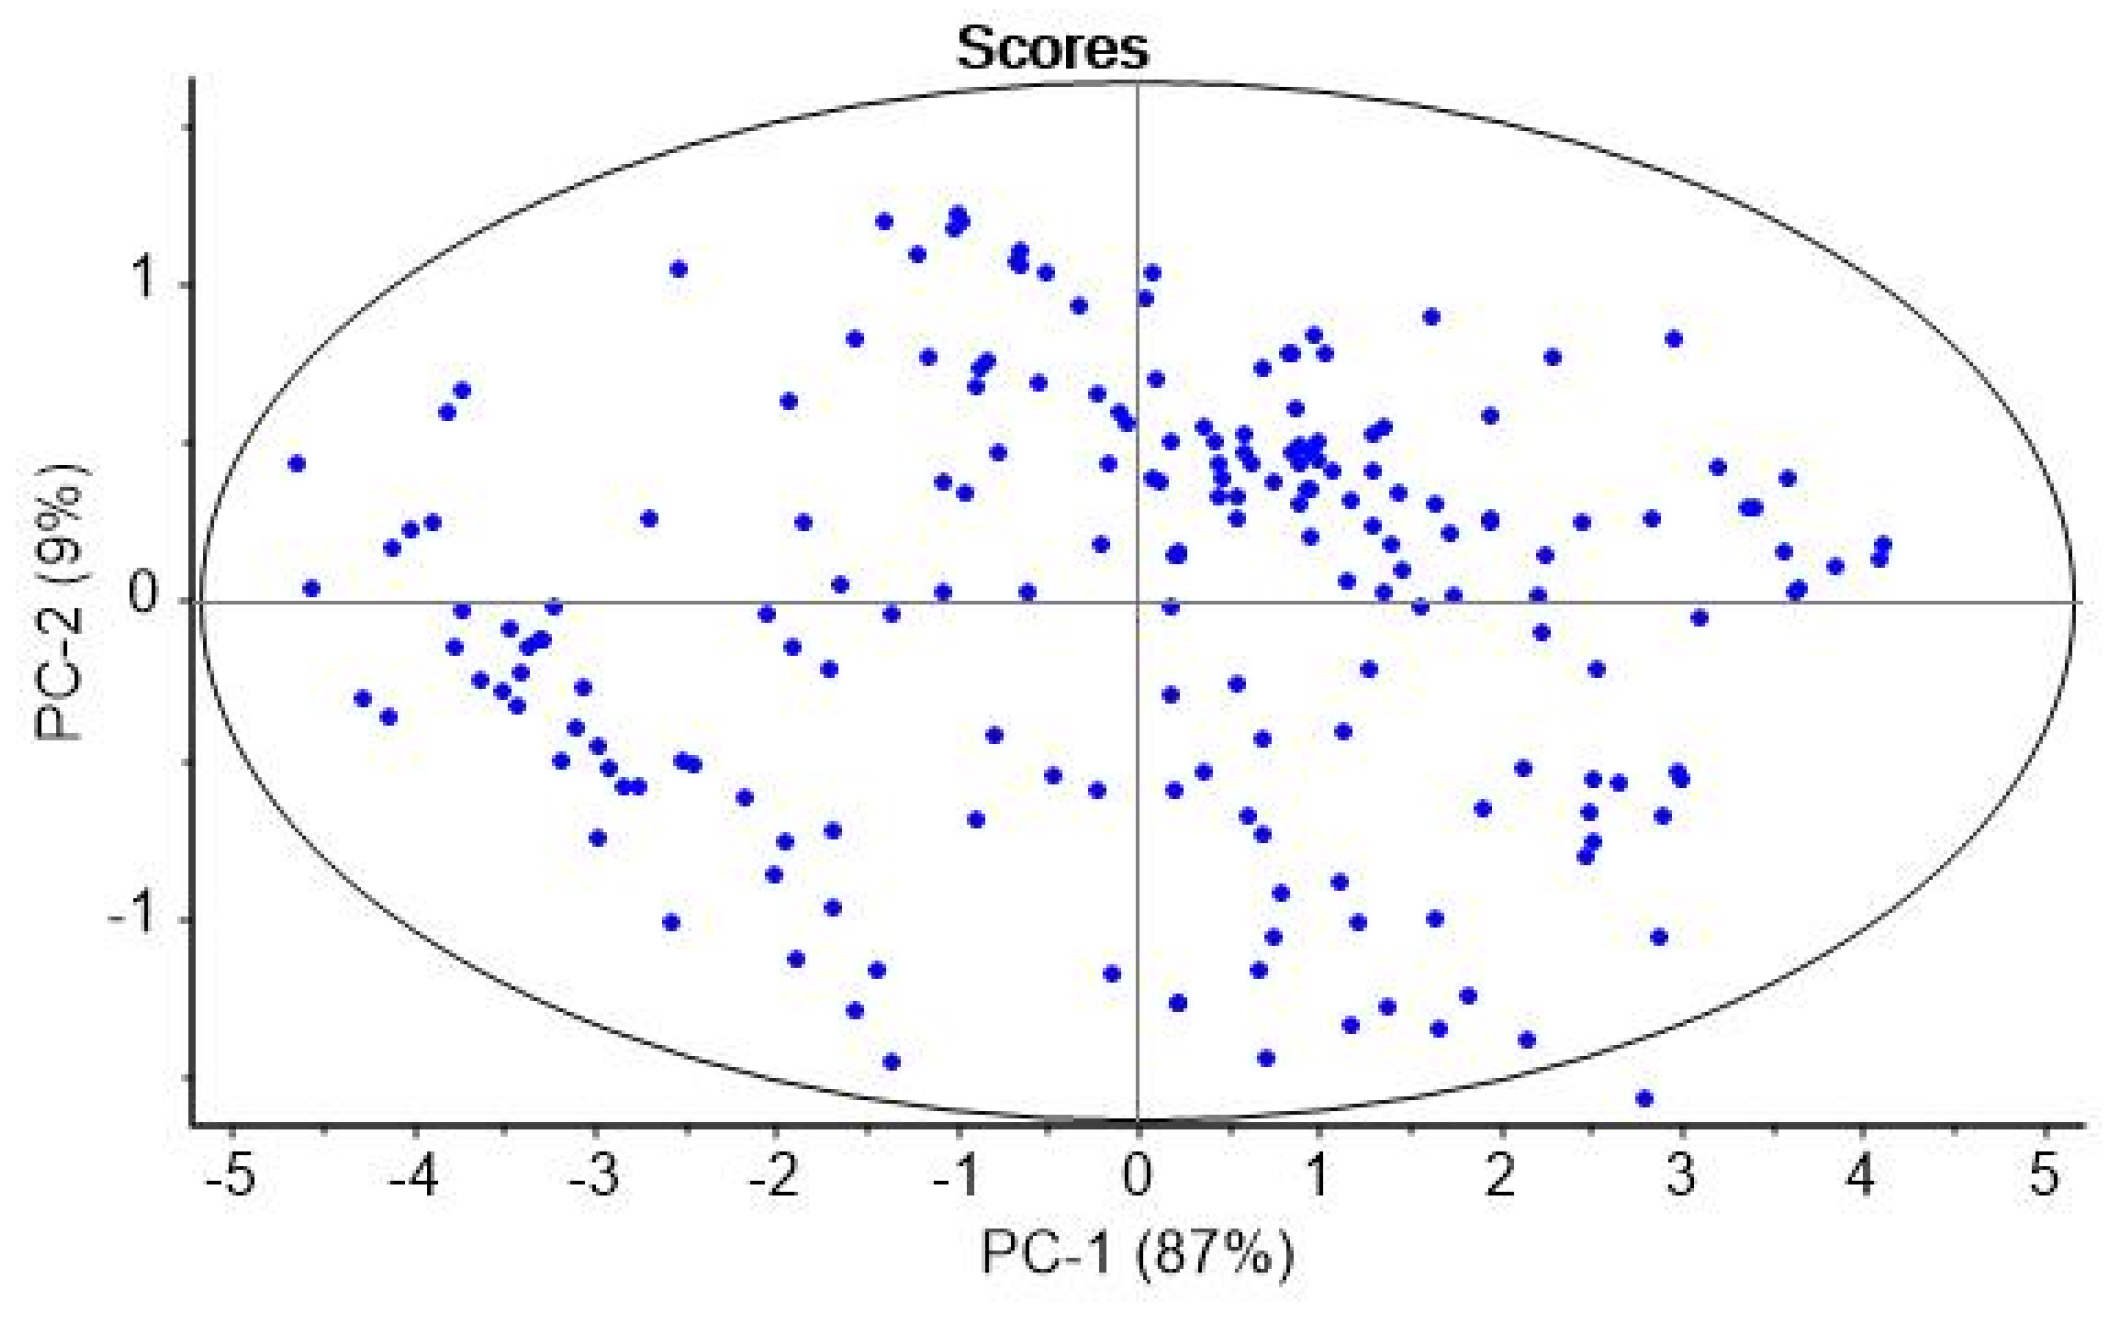
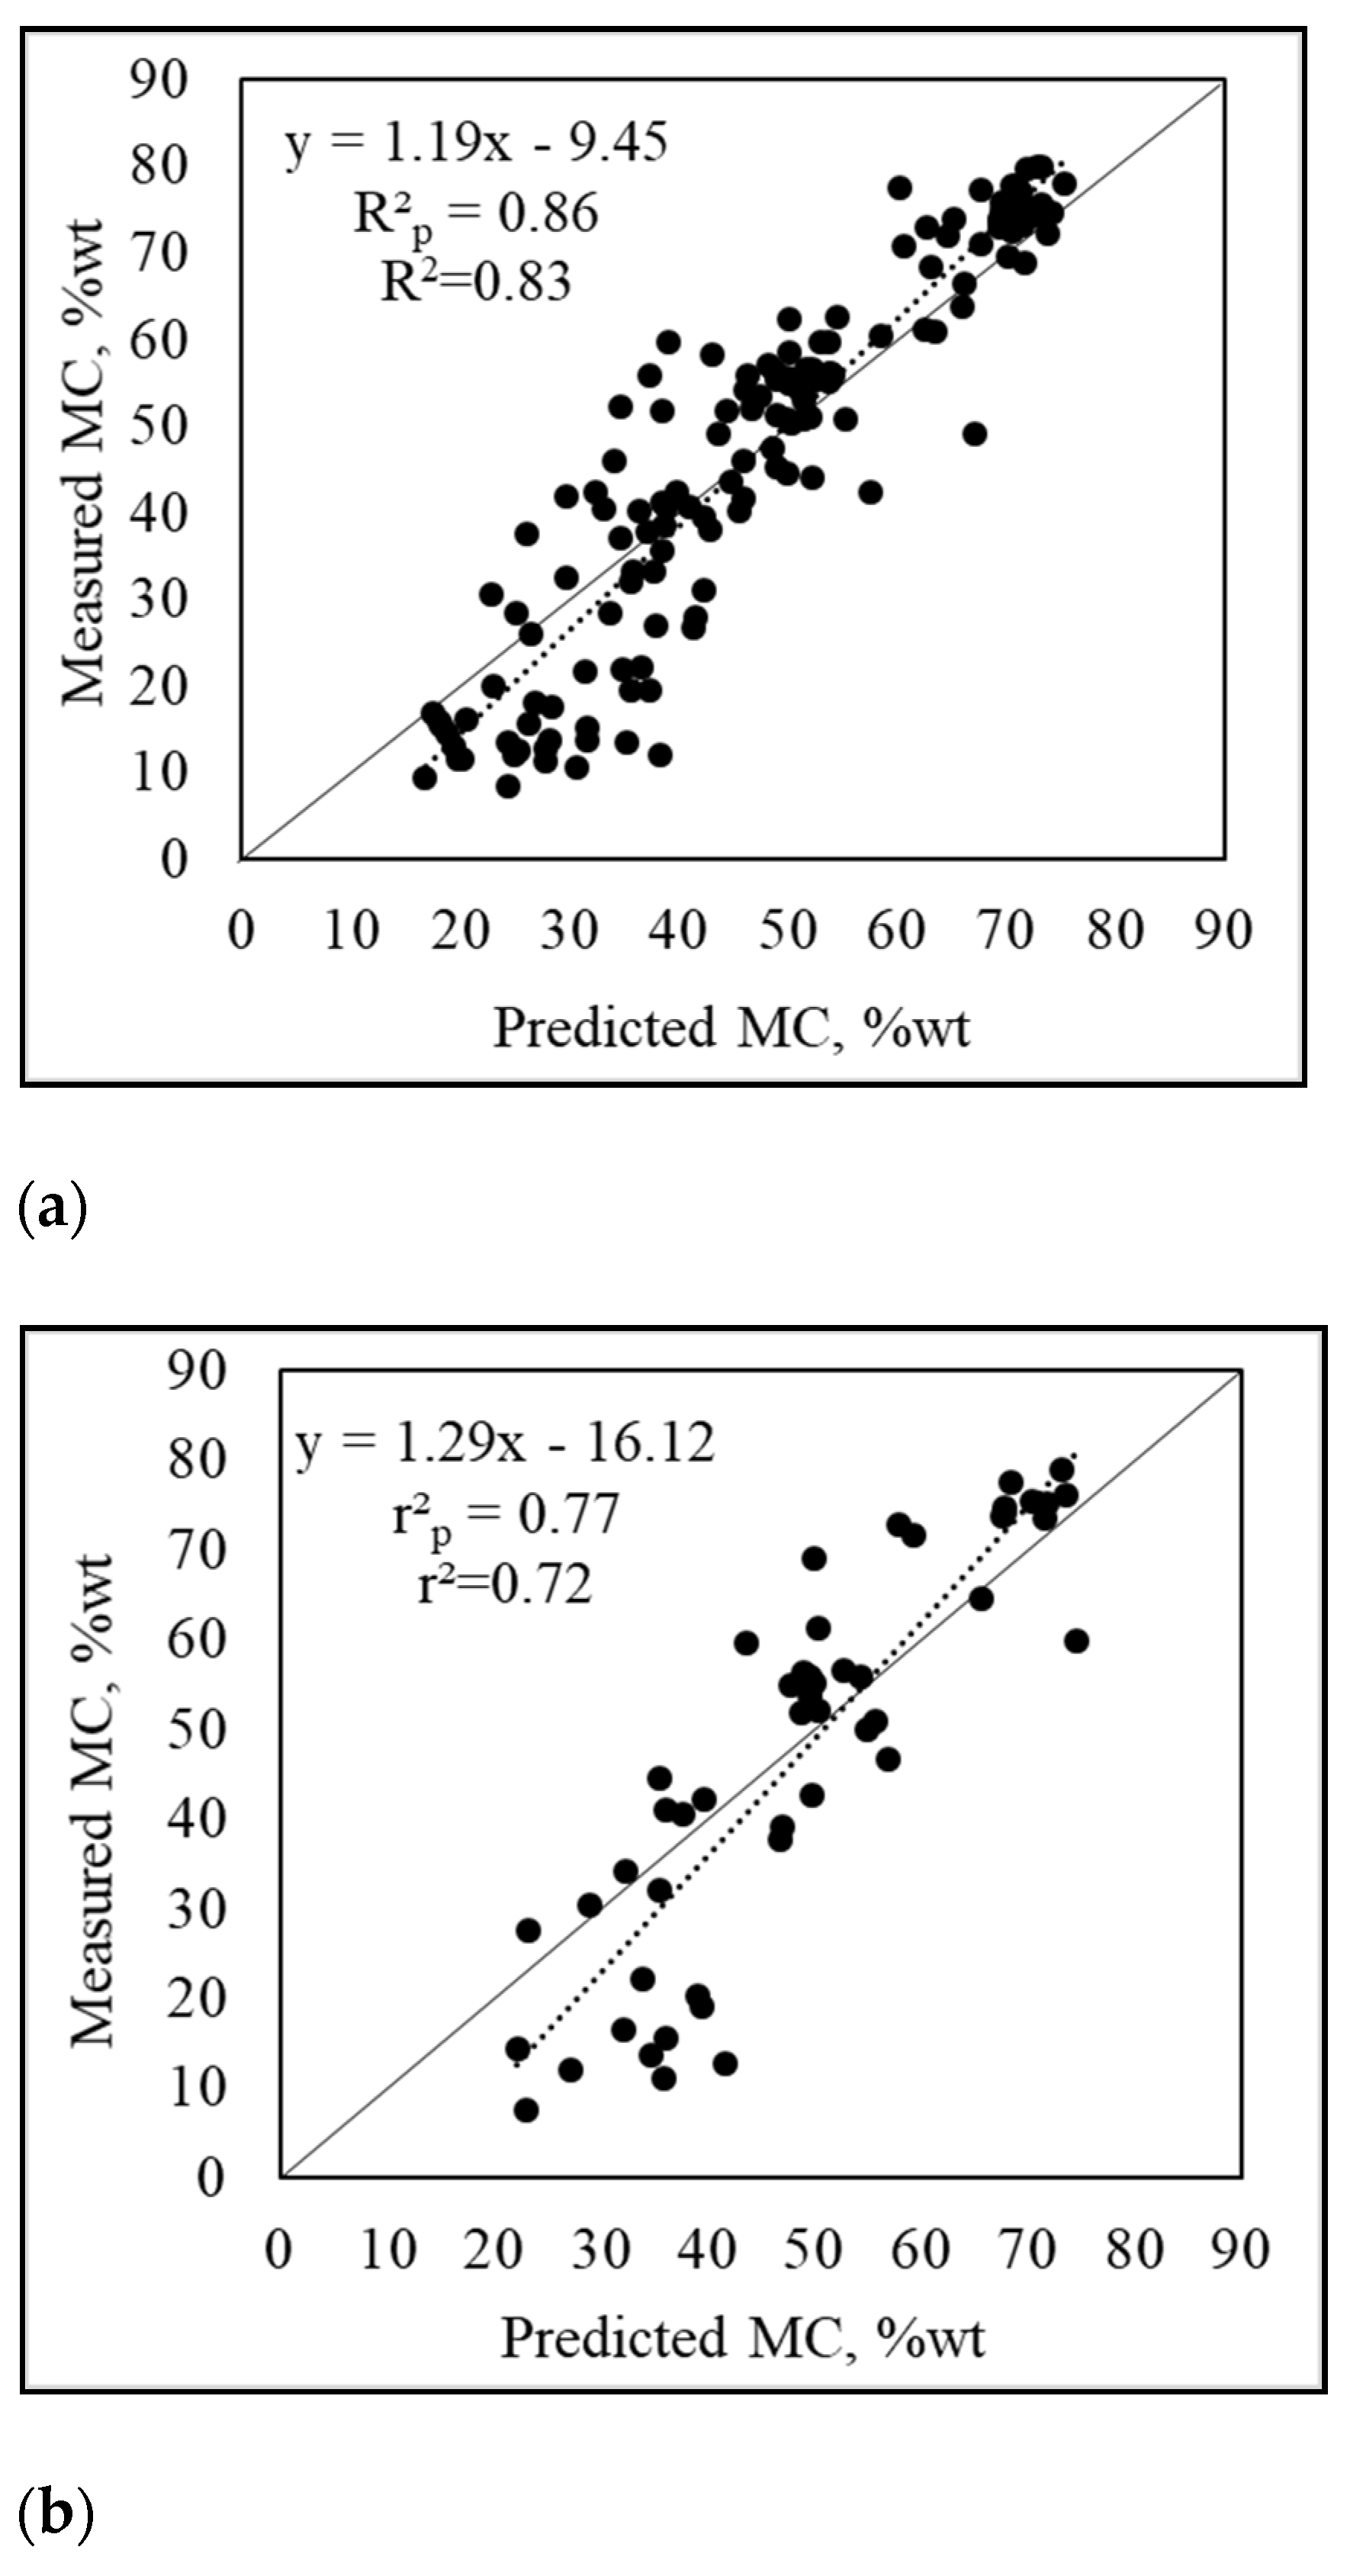
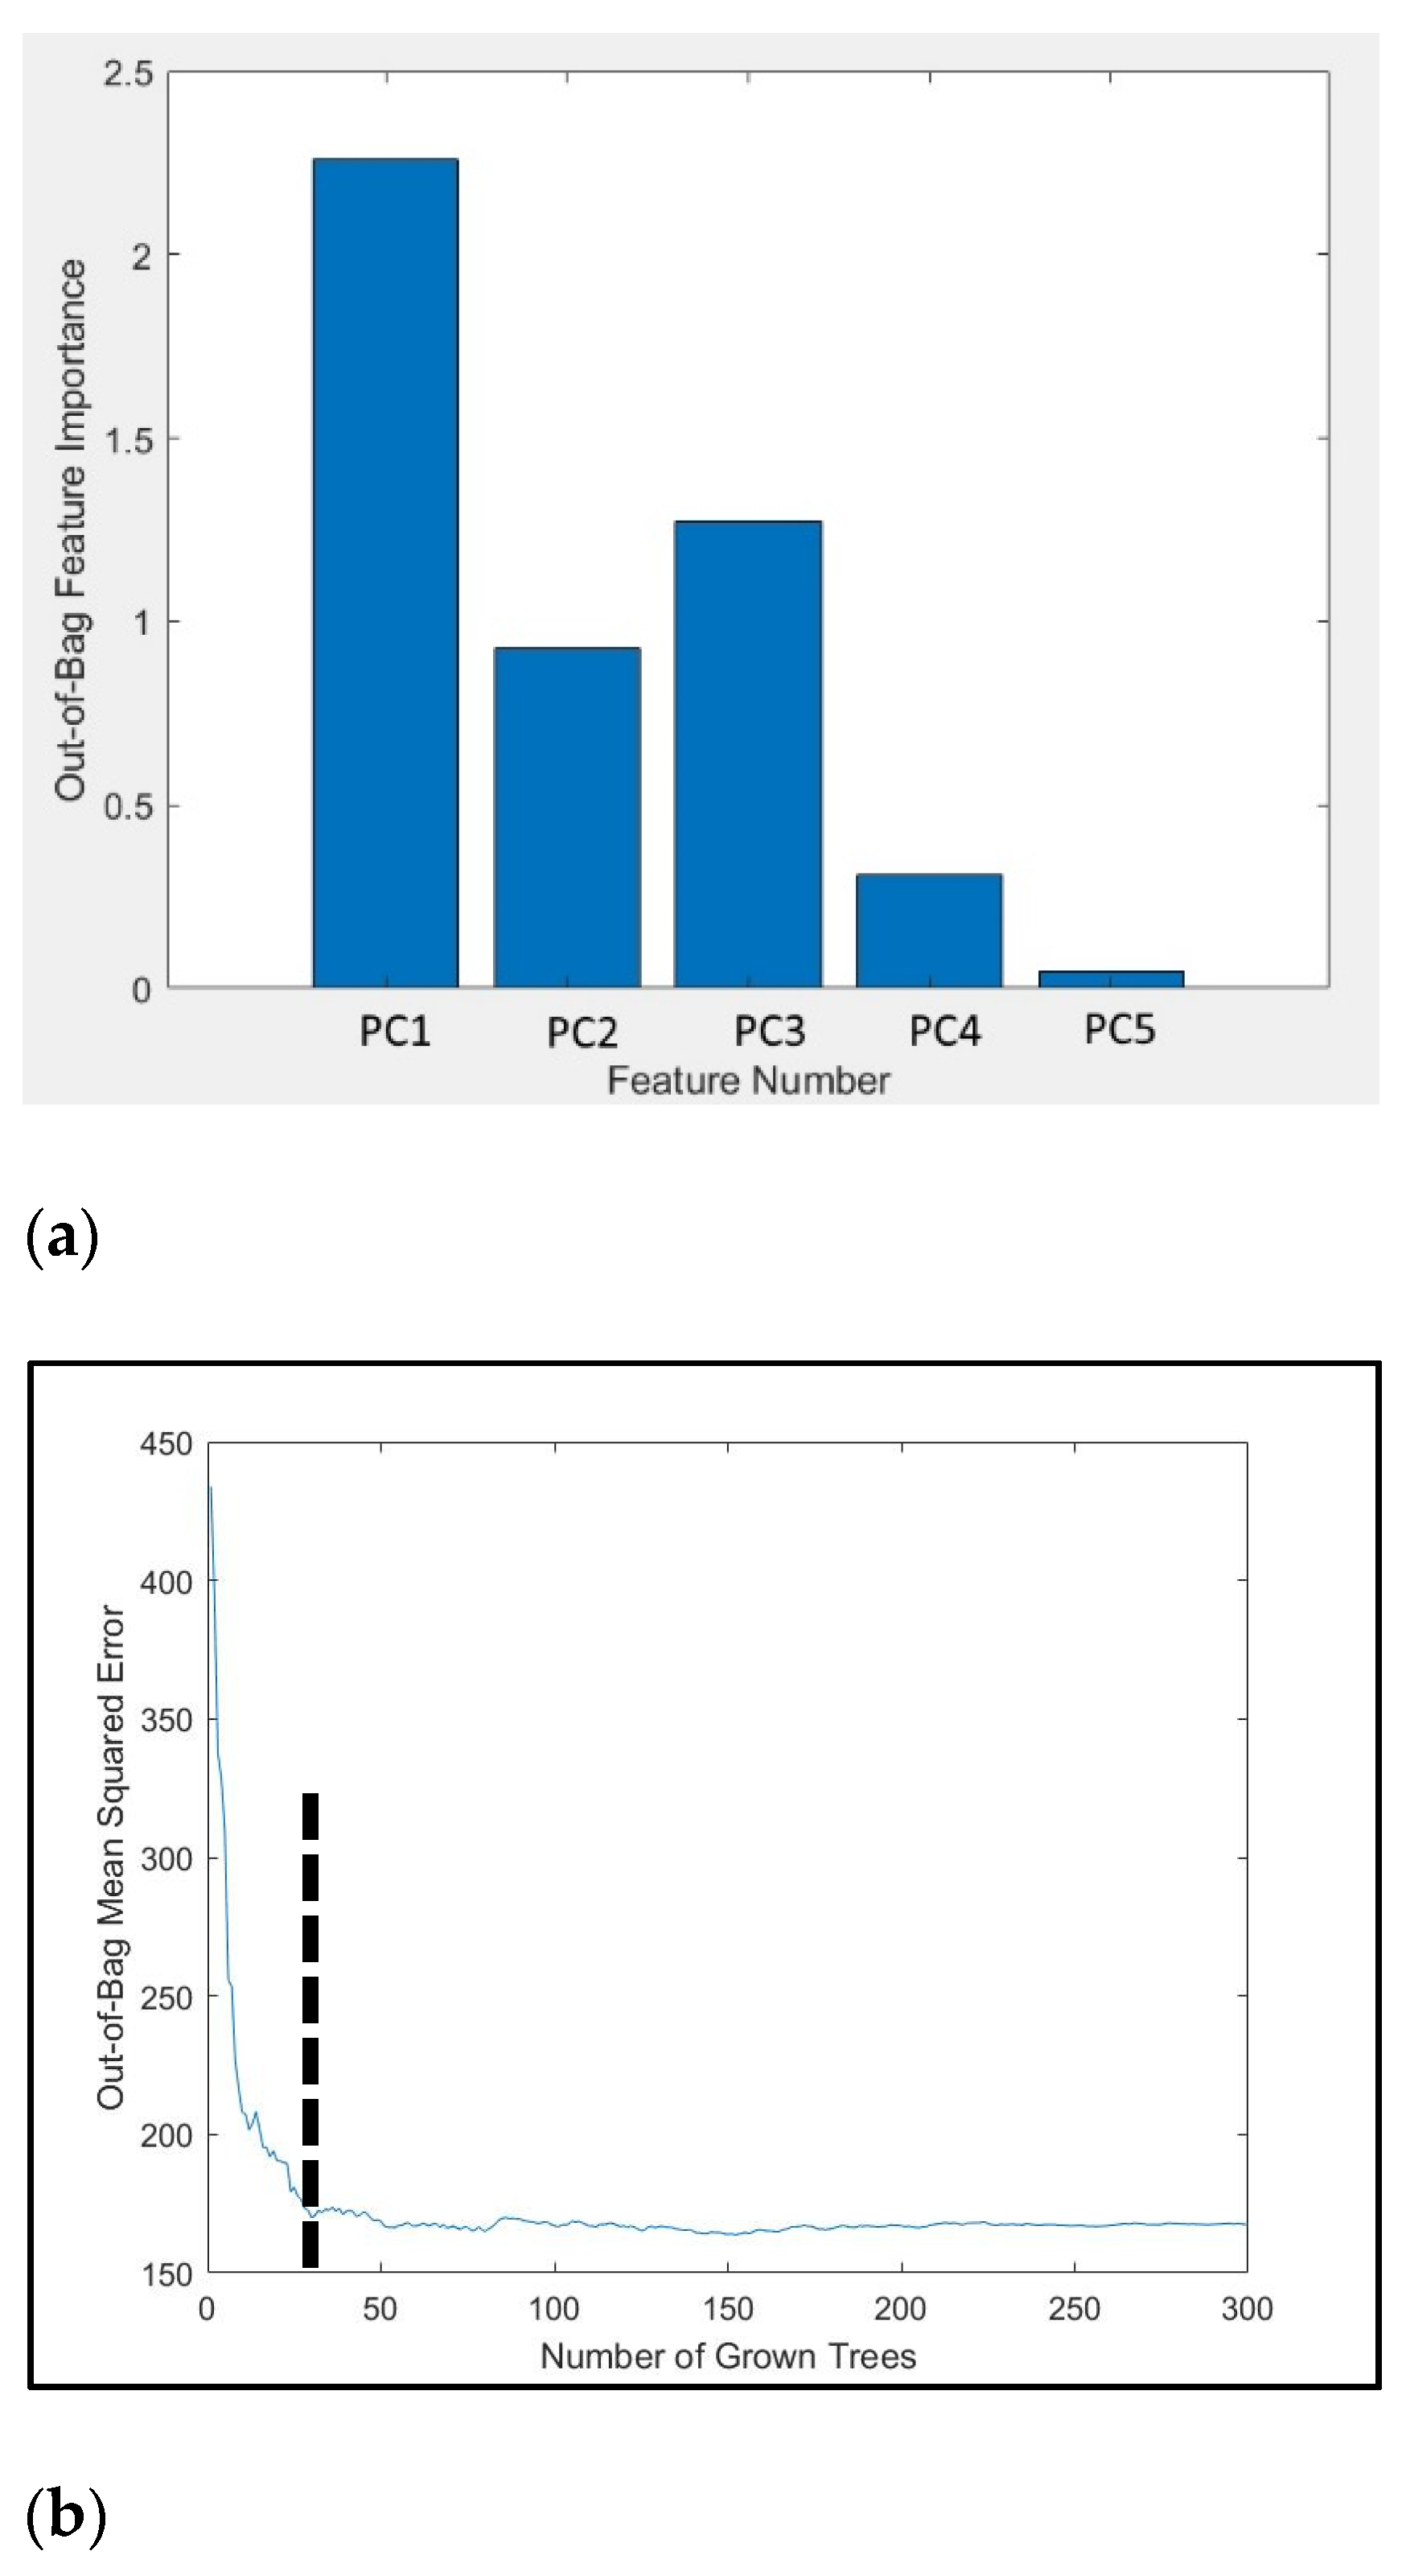
3.2. Prediction Models for Estimation of Moisture Content in the Bagasse Samples

The performance of the MC model created using different machine learning techniques including MLR, PCR, ANN, PCA-ANN, GPR, PCA-GPR, RFR, and PCA-RFR are shown in Table 3, demonstrating the R2, RMSEC, r2, RMSEP, and RPD. Either the reflectance values of five variable bands (R, G, B, NIR, and RedEdge) or their PC-score from PCA coupled with various machine learning algorithms were used for model development based on the same calibration and prediction set. The feature used for model development is demonstrated in Table 3.
The models PCR, ANN, and PCA-ANN had low accuracy, followed by MLR, RFR, and PCA-GPR, respectively. The performance of GPR and PCA-RFR was the same. However, the PCA-RFR model resulted in the highest accuracy. The moisture content model provided an R2 of 0.83, RMSEC of 8.71 wt% (w.b.), r2 of 0.72, RMSEC of 11.28 wt% (w.b.), and RPD of 1.85. The model showed excellent prediction if R2 > 0.90, good prediction if 0.81 < R2 < 0.90, approximate prediction if 0.66 < R2 < 0.80, and poor prediction if R2 < 0.66 [23]. An RPD between 1.5 and 2 means that the model can discriminate between low and high values of the response variable [20]. Therefore, this model was acceptable for screening.
Figure 5a,b shows the scatter plot between the reference value and predicted value of the calibration and validation sets, respectively, illustrating the coefficient of determination (R2 = 0.83 and r2 = 0.72) and Pearson’s coefficient of determination (Rp2 = 0.86 and rp2 = 0.77). As a result, that the use of the prediction model in lower moisture contents (moisture content < 20%wt) was not recommended due to the fact that the predicted value was more than that of the measured value. There is information to support [23]—the absorption coefficient became higher with increasing moisture percentage. Therefore, for lower moisture contents, there was less absorption.
Figure 6a shows the important feature including PC1, PC2, PC3, PC4 and PC5. The figure shows a bar chart plotted between the out-of-bag feature importance and PC-score, which showed that feature number 1 (PC1) was the most important in prediction, followed by PC3, PC2, PC4, and PC5. It is a fact that PC1 was the direction with the largest variance and was the most important. The optimal tree number and mean squared error (RME) is demonstrated in Figure 6b. This showed that the number of tree of 30 was optimal due to starting with a constant value of RME and providing a low RME.

4. Conclusions

A fast and non-destructive inline detection method using five-band multispectral imaging was proposed to estimate the quality of bagasse in terms of moisture content. This method can be used for detecting the moisture content of bagasse upon conveyor belt movement. The RFR algorithm coupled with PC-scores (PC1, PC2, PC3, PC4, and PC5) of five-band multispectral images called “PCA-RFR” was the most suitable for model creation because its accuracy was the lowest with an RMSEP of 11.82 wt%. For measurement of bagasse sample, four light bulbs were installed in the corner area of measurement chamber, and the speed of belt of 20 cm/s was set for multispectral images acquisition. This system could be applied with the bagasse sample obtained after juice extraction because the sample is homogeneous. The prediction model for the estimation of moisture content provides the RPD of 1.85, this corresponded to the screening use application. Therefore, the multispectral imaging technique system could be used as a low-cost system for screening moisture content, and improving accuracy.

Author Contributions

Conceptualization, J.P., W.S., and N.N.; methodology, W.S.; software, P.L.; validation, K.S., S.W., and J.P.; formal analysis, P.L. and N.N.; investigation, K.S. and J.P.; resources, N.N.; data curation, P.L.; writing—original draft preparation, N.N.; writing—review and editing, J.P. and W.S.; visualization, P.L.; supervision, J.P.; project administration, J.P.; funding acquisition, J.P. All authors have read and agreed to the published version of the manuscript.

Funding

This research was funded by Research and Academic Services, Khon Kaen University, Thailand, Research and Graduate Studies Khon Kaen University, Thailand and Research Grant for New Scholar, grant number MRG6280078 of the Thailand Research Fund (TRF), Thailand and the APC was funded by the authors.

Institutional Review Board Statement

Not applicable.

Informed Consent Statement

Not applicable.

Data Availability Statement

Not report any data.

Acknowledgments

This work was supported by Research and Academic Services, Khon Kaen University, Thailand, Research and Graduate Studies Khon Kaen University, Thailand and Research Grant for New Scholar (MRG6280078) of the Thailand Research Fund (TRF), Thailand.

Conflicts of Interest

The authors declare no conflict of interest.

References

  1. Production of Electricity from Bagasse: The Major Help of the Alternative Energy and Alternative Energy Development Plan 2015 (AEDP 2015). Available online: http://webkc.dede.go.th/testmax/node/2331 (accessed on 10 August 2020).
  2. Utilization of Sugarcane and Sugarcane Products. Available online: http://www.ocsb.go.th/upload/bioindustry/fileupload/9659-4776.pdf (accessed on 10 August 2020).
  3. Statistical Data of Sugarcane and Sugar in Thailand for Innovation Development of Competitiveness in Sugarcane and Sugar. Available online: http://opendata.ocsb.go.th/ (accessed on 10 August 2020).
  4. Demirbas, A. Potential applications of renewable energy sources, biomass combustion problems in boiler power systems and combustion related environmental issues. Prog. Energ. Combust. 2005, 31, 171–192. [Google Scholar] [CrossRef]
  5. Chen, C.; Qin, S.; Chen, F.; Lu, Z.; Cheng, Z. Co-combustion characteristics study of bagasse, coal and their blends by thermogravimetric analysis. J. Energy Inst. 2019, 92, 364–369. [Google Scholar] [CrossRef]
  6. Uzun, H.; Yıldız, Z.; Goldfarb, J.L.; Ceylan, S. Improved prediction of higher heating value of biomass using an artificial neural network model based on proximate analysis. Bioresour. Technol. 2017, 234, 122–130. [Google Scholar] [CrossRef] [PubMed]
  7. Castro, Z.S.; Gauthier-Maradei, P.; Hernández, H.E. Effect of particle size and humidity on sugarcane bagasse combustion in a fixed bed furnace. Rev. Ion 2013, 26, 73–85. [Google Scholar]
  8. Isabirye, M.; Raju, D.V.N.; Kitutu, M.; Yemeline, V.; Deckers, J.; Poesen, J. Sugarcane Biomass Production and Renewable Energy, Biomass Now-Cultivation and Utilization, Miodrag Darko Matovic, IntechOpen. Available online: https://www.intechopen.com/books/biomass-now-cultivation-and-utilization/sugarcane-biomass-production-and-renewable-energy. [CrossRef] [Green Version]
  9. Nakawajana, N.; Posom, J.; Paeoui, J. Prediction of higher heating value, lower heating value and ash content of rice husk using FT-NIR spectroscopy. Eng. J. 2018, 22, 45–56. [Google Scholar] [CrossRef]
  10. Sims, R.E.H. The Brilliance of Bioenergy: In Business and in Practice, 1st ed.; Earthscan: London, UK, 2009; p. 70. [Google Scholar]
  11. Wu, C.; Niu, Z.; Tang, Q.; Huang, W.J. Predicting vegetation water content in wheat using normalized difference water indices derived from ground measurements. J. Plant Res. 2019, 122, 317–326. [Google Scholar] [CrossRef] [PubMed]
  12. Liu, J.; Cao, Y.; Wang, Q.; Pan, W.; Ma, F.; Liu, C.; Chen, W.; Yang, J. Rapid and non-destructive identification of water-injected beef samples using multispectral imaging analysis. Food Chem. 2016, 190, 938–943. [Google Scholar] [CrossRef] [PubMed]
  13. Julrat, S.; Trabelsi, S. In-line microwave reflection measurement technique for determining moisture content od biomass. Biosyst. Eng. 2019, 188, 24–30. [Google Scholar] [CrossRef]
  14. Wei, Y.; Wu, F.; Xu, J.; Sha, J.; Zhao, Z.; He, Y.; Li, X. Visual detection of the moisture content of tea leaves with hyperspectral imaging technology. J. Food Eng. 2019, 248, 89–96. [Google Scholar] [CrossRef]
  15. Sirisomboon, P.; Funke, A.; Posom, J. Improvement of proximate data and calorific value assessment of bamboo through near infrared wood chips acquisition. Renew Energ. 2020, 147, 1921–1931. [Google Scholar] [CrossRef]
  16. Xue, J.; Yang, Z.; Han, L.; Liu, Y.; Liu, Y.; Zhou, C. On-line measurement of proximates and lignocellulose components of corn stover using NIRS. Appl. Energ. 2015, 137, 18–25. [Google Scholar]
  17. Phetpan, K.; Udompetaikul, V.; Sirisomboon, P. In-line near infrared spectroscopy for the prediction of moisture content in the tapioca starch drying process. Powder Technol. 2019, 345, 608–615. [Google Scholar] [CrossRef]
  18. Liu, D.; Sun, D.W.; Qu, J.; Zeng, X.A.; Pu, H.; Ma, J. Feasibility of using hyperspectral imaging to predict moisture content of porcine meat during salting process. Food Chem. 2014, 152, 197–204. [Google Scholar] [CrossRef] [PubMed]
  19. Zhang, C.; Wang, Q.; Liu, F.; He, Y.; Xiao, Y. Rapid and non-destructive measurement of spinach pigments content during storage using hyperspectral imaging with chemometrics. Measurement 2017, 97, 149–155. [Google Scholar] [CrossRef]
  20. Nicolaï, B.M.; Beullens, K.; Bobelyn, E.; Peirs, A.; Saeys, W.; Theron, K.I.; Lammertyn, J. Nondestructive measurement of fruit and vegetable quality by means of NIR spectroscopy: A review. Postharvest Biol. Technol. 2007, 46, 99–118. [Google Scholar] [CrossRef]
  21. Williams, P.C.; Norris, K.H. Qualitative applications of near-infrared reflectance spectroscopy. In Near-Infrared Technology in the Agricultural and Food Industries; Williams, P.C., Norris, K.H., Eds.; American Association of Cereal Chemistry: Saint Paul, MN, USA, 1987; pp. 241–246. [Google Scholar]
  22. Acquah, G.E.; Via, B.K.; Fasina, O.O.; Eckhardt, L.G. Non-destructive prediction of the properties of forest biomass for chemical and bioenergy applications using near infrared spectroscopy. J. Near Infrared Spec. 2015, 23, 93–102. [Google Scholar] [CrossRef]
  23. Oshima, T.; Hiraguri, Y.; Okuzono, T. Distinct effects of moisture and air contents on acoustic properties of sandy soil. J. Acoust. Soc. Am. 2015, 138, 258–263. [Google Scholar] [CrossRef] [Green Version]
Figure 1. (a) Schematic of the multispectral image acquisition system; (b) bagasse sample used for the experiment.
Processes 09 00777 g001aProcesses 09 00777 g001b
Figure 2. Experimental procedure of real-time MC measurement of bagasse using multispectral images.
Processes 09 00777 g002
Figure 3. Histogram of relative reference value for (a) red; (b) green; (c) blue; (d) NIR; (e) RedEdge; (f) moisture content; (g) the relationship between relative reflectance value and moisture content.
Processes 09 00777 g003
Figure 4. Principal components (PC_1 and PC_2) of the relative reflectance images obtained from bagasse.
Processes 09 00777 g004
Figure 5. Scatter plots of the measured MC vs. predicted MC estimated from multispectral imaging using the PCA–RFR algorithm for (a) the calibration set; (b) the validation set. Rp2 and rp2 are Pearson’s coefficient of determination.
Processes 09 00777 g005
Figure 6. (a) Out-of-bag feature importance for the RDF modeling; (b) hyper-parameter optimization results of the PCA-RDF model for MC. It is worth noting that the black dash lines represent the optimal tree number (a tree number of 30 was optimal).
Processes 09 00777 g006
Table 1. Statistical data of multispectral images and moisture content.
RedGreenBlueNirRedEdgeMC
Max0.85970.79380.86500.97090.882879.885
Min0.14490.05680.05770.27940.16007.394
AVE0.50790.41410.43160.66300.566046.956
SD0.17750.17800.20190.13930.174621.580
Table 2. Correlation between the relative reflectance values of the multispectral image and moisture content.
RGBNIRRedEdgeMC
R1
G0.8417831
B0.7626760.9523361
NIR0.8772050.7340130.6708821
RedEdge0.9104610.9148750.8553790.8635421
MC−0.75247−0.6161−0.52945−0.56149−0.639221
MC is moisture content.
Table 3. Modeling results developed from various machine learning methods.
AlgorithmCalibration SetValidation Set
NVariables or PCR2RMSEC, %wtnr2RMSEP, %wtRPD
MLR150R, G, B, NIR, RedEdge0.6512.69500.6712.421.76
PCR150PC1, PC2, PC30.6512.76500.4815.631.40
ANN150R, G, B, NIR, RedEdge0.7011.82500.6313.091.67
PCA-ANN150PC1, PC2, PC3, PC4, PC50.4515.43500.3517.281.26
GPR150R, G, B, NIR, RedEdge0.7011.58500.6911.961.82
PCA-GPR150PC1, PC2, PC3, PC4, PC50.7311.04500.6812.191.79
RFR150R, G, B, NIR, RedEdge0.838.83500.6512.731.71
PCA- RFR150PC1, PC2, PC3, PC4, PC50.838.71500.7211.281.85
N is the number of samples in the calibration set; n is the number of samples in the validation set; PC is the principal component scores; MLR is multiple linear regression; PCR is principal component regression; ANN is artificial neural network; GPR is Gaussian process regression; RFR is random forest regression.
Publisher’s Note: MDPI stays neutral with regard to jurisdictional claims in published maps and institutional affiliations.

