the Creative Commons Attribution 4.0 License.
the Creative Commons Attribution 4.0 License.
 | 28 Apr 2021
Tree-ring-based spring precipitation reconstruction in the Sikhote-Alin' Mountain range
Olga Ukhvatkina
Alexander Omelko
Dmitriy Kislov
Alexander Zhmerenetsky
Tatyana Epifanova
Jan Altman
Climate reconstructions provide important insight into past climate variability and help us to understand the large-scale climate drivers and impact of climate change. However, our knowledge about long-term year-to-year climate variability is still limited due to the lack of high-resolution reconstructions. Here, we present the first precipitation reconstructions based on tree rings from Pinus koraiensis (Korean pine) from three sites placed along a latitudinal (330 km) gradient in the Sikhote-Alin' mountains in the Russian Far East. The tree-ring width chronologies were built using standard tree-ring procedures. We reconstructed the April–June precipitation for the southern Sikhote-Alin' (SSA), March–June precipitation for the central Sikhote-Alin' (CSA) and March–July precipitation for the northwestern Sikhote-Alin' (NSA) over the years 1602 to 2013, 1804 to 2009 and 1858 to 2013, respectively. We found that an important limiting factor for Korean pine growth was precipitation within the period when the air current coming from the continent during the cold period is replaced with the impact of the wet ocean air current. We identified that common wet years for SSA, CSA and NSA occurred in 1805, 1853, 1877, 1903, 1906, 1927, 1983 and 2009 and common dry years occurred in 1821, 1869, 1919, 1949 and 2003. Our reconstructions have 3-, 15- and 60-year periods, which suggests the influence of the El Niño–Southern Oscillation and Pacific Decadal Oscillation on the region's climate and relevant processes. Despite the impact of various global processes, the main contribution to precipitation formation in the study area is still made by the Pacific Ocean, which determines their amount and periodicity.
- Article
(8229 KB) -
Supplement
(3010 KB) - BibTeX
- EndNote


Water resources are a crucial driving force behind the development of human society (e.g., Vorosmarty et al., 2010). The hydrological regime depends directly on the precipitation regime, which forms as a result of the interactions among various global climate processes. The intensification of the global hydrological regime is attracting attention and becoming a crucial topic with regard to the analysis and forecasting of the impacts of global changes (Allen and Ingram, 2002; Dai et al., 1998; Gedney et al., 2006; Huntington, 2008; Yang et al., 2003; Li et al., 2008; Shamov, 2010).
The climate of northeast Asia is largely determined by the East Asian monsoon (Tao et al., 2004; Ding and Chan, 2005; Huang et al., 2012; Alessio et al., 2014), which results from the temperature difference between the Pacific Ocean and the continent. The East Asian monsoon is divided into summer monsoon and winter monsoon. During the winter monsoon, the area is dominated by northeast winds blowing from Siberian and Mongolian areas, which causes a cold and dry climate. During the summer monsoon (April to September/October), the air masses are brought from the northeast part of the Pacific and Indian oceans, causing abundant precipitation and high air temperatures (Alessio et al., 2014). The temperature contrast between the continent and ocean affects the intensity in the Asian Pacific monsoon system and meridional heat exchange, which corresponds to particular types of atmospheric circulation in the Asian Pacific region (Ponomarev et al., 2015). In the southern part of the Russian Far East, the meridional nature of the air current direction becomes stronger, which is due to the presence of the Sikhote-Alin' Mountain range. The meridional direction of the Sikhote-Alin' Mountain range causes a sharp difference among local climate phenomena due to the highly rugged relief (Kozhevnikova, 2009). Because of the location of the Sikhote-Alin' Mountain range, the western areas have a greater expression of inland climate features, while the eastern areas clearly express a climate of a monsoon nature (Mezentseva and Fedulov, 2017). As a result, areas that are separated from each other by 150 to 200 km may substantially differ in terms of temperature and precipitation.
Dendrochronology is a widespread method for the reconstruction of past climate processes with high spatiotemporal resolution at the century to millennial scale (Corona et al., 2010; Popa and Bouriaud, 2014; Kress et al., 2014; Lyu et al., 2016). Dendrochronological studies in northeast Asia are mostly concentrated in the northeast China, Mongolia, Korean Peninsula and Japanese archipelago (Chen et al., 2016, 2012; Li et al., 2013; Liu et al., 2009, 2013). The southern Russian Far East, however, remains a blind spot in terms of dendrochronological and overall paleoclimatological studies despite its large area of about 1.5 km2. There are only few available studies, for example, from Sakhalin Island (Wiles et al., 2014), the Kuril Islands (Jacoby et al., 2004) and the Primorsky Krai (Ukhvatkina et al., 2018), and they are purely focused on temperature reconstruction.
No studies, however, have been conducted in this region regarding the dependency of the annual radial growth width on precipitation amount. The nearest precipitation reconstructions that were carried out were in Inner Mongolia (Liu et al., 2009; Chen et al., 2012; Liu et al., 2004), parts of China further to the south and the Korean Peninsula (Chen et al., 2016). These reconstructions mainly focused on the interrelation between the summertime precipitation amount and plant growth, which is quite justified since virtually all of northeast Asia is exposed to the monsoon impact to some extent and the maximum precipitation amount is often registered in the second half of the summer. At the same time, the southern Far East is characterized by a seasonal division in the summer monsoon impact degree: the first stage of the Far Eastern summer monsoon lasts from April to June, while the second stage lasts from July to September (Mezentseva and Fedulov, 2017). The first summer monsoon stage is a very cold and wet sea air current, which is intermittent with the impact of air masses coming from Central Asia, and the second stage is a warm wet sea air current with abundant precipitation (Mezentseva and Fedulov, 2017). Thus, most of the studies analyze the second stage of the monsoon impact and tend to overlook the importance of the spring-to-early-summer precipitation abundance in the region. The issue of what determines the nature of precipitation occurrence during the spring-to-early-summer period and how the presence of dry and wet years affects the growth and development of plants during this season remains unstudied. Another unstudied issue is the importance of the precipitation abundance during the second monsoon phase in terms of the growth and development of woody plants.
As the analysis of modern global meteorological trends clearly shows, recently the Far Eastern region has been characterized by increasing variability in temperature and precipitation, which leads to a higher frequency of extreme hydrological events (Gartsman, 2008; Dobrovolsky, 2011; Khon and Mokhov, 2012; Dai et al., 2009; Huntington, 2008; J. Liu et al., 2003; Milly et al., 2002; Ukhvatkina et al., 2018; Altman et al., 2018; Janda et al., 2021). Therefore, the issues of hydrological regime changes are of great importance for humankind and nature (Shamov et al., 2014).
The main objectives of this study are (1) to develop and compare the tree-ring width chronology for three sites in the southern part of the Russian Far East; (2) to analyze the regime of precipitation variation during past centuries in the southern part of the Russian Far East and compare it with neighboring territories; and (3) to investigate the influence of modes of variability such as El Niño–Southern Oscillation (ENSO) and Pacific Decadal Oscillation (PDO) on tree growth (or on the Sikhote-Alin' Mountain range).
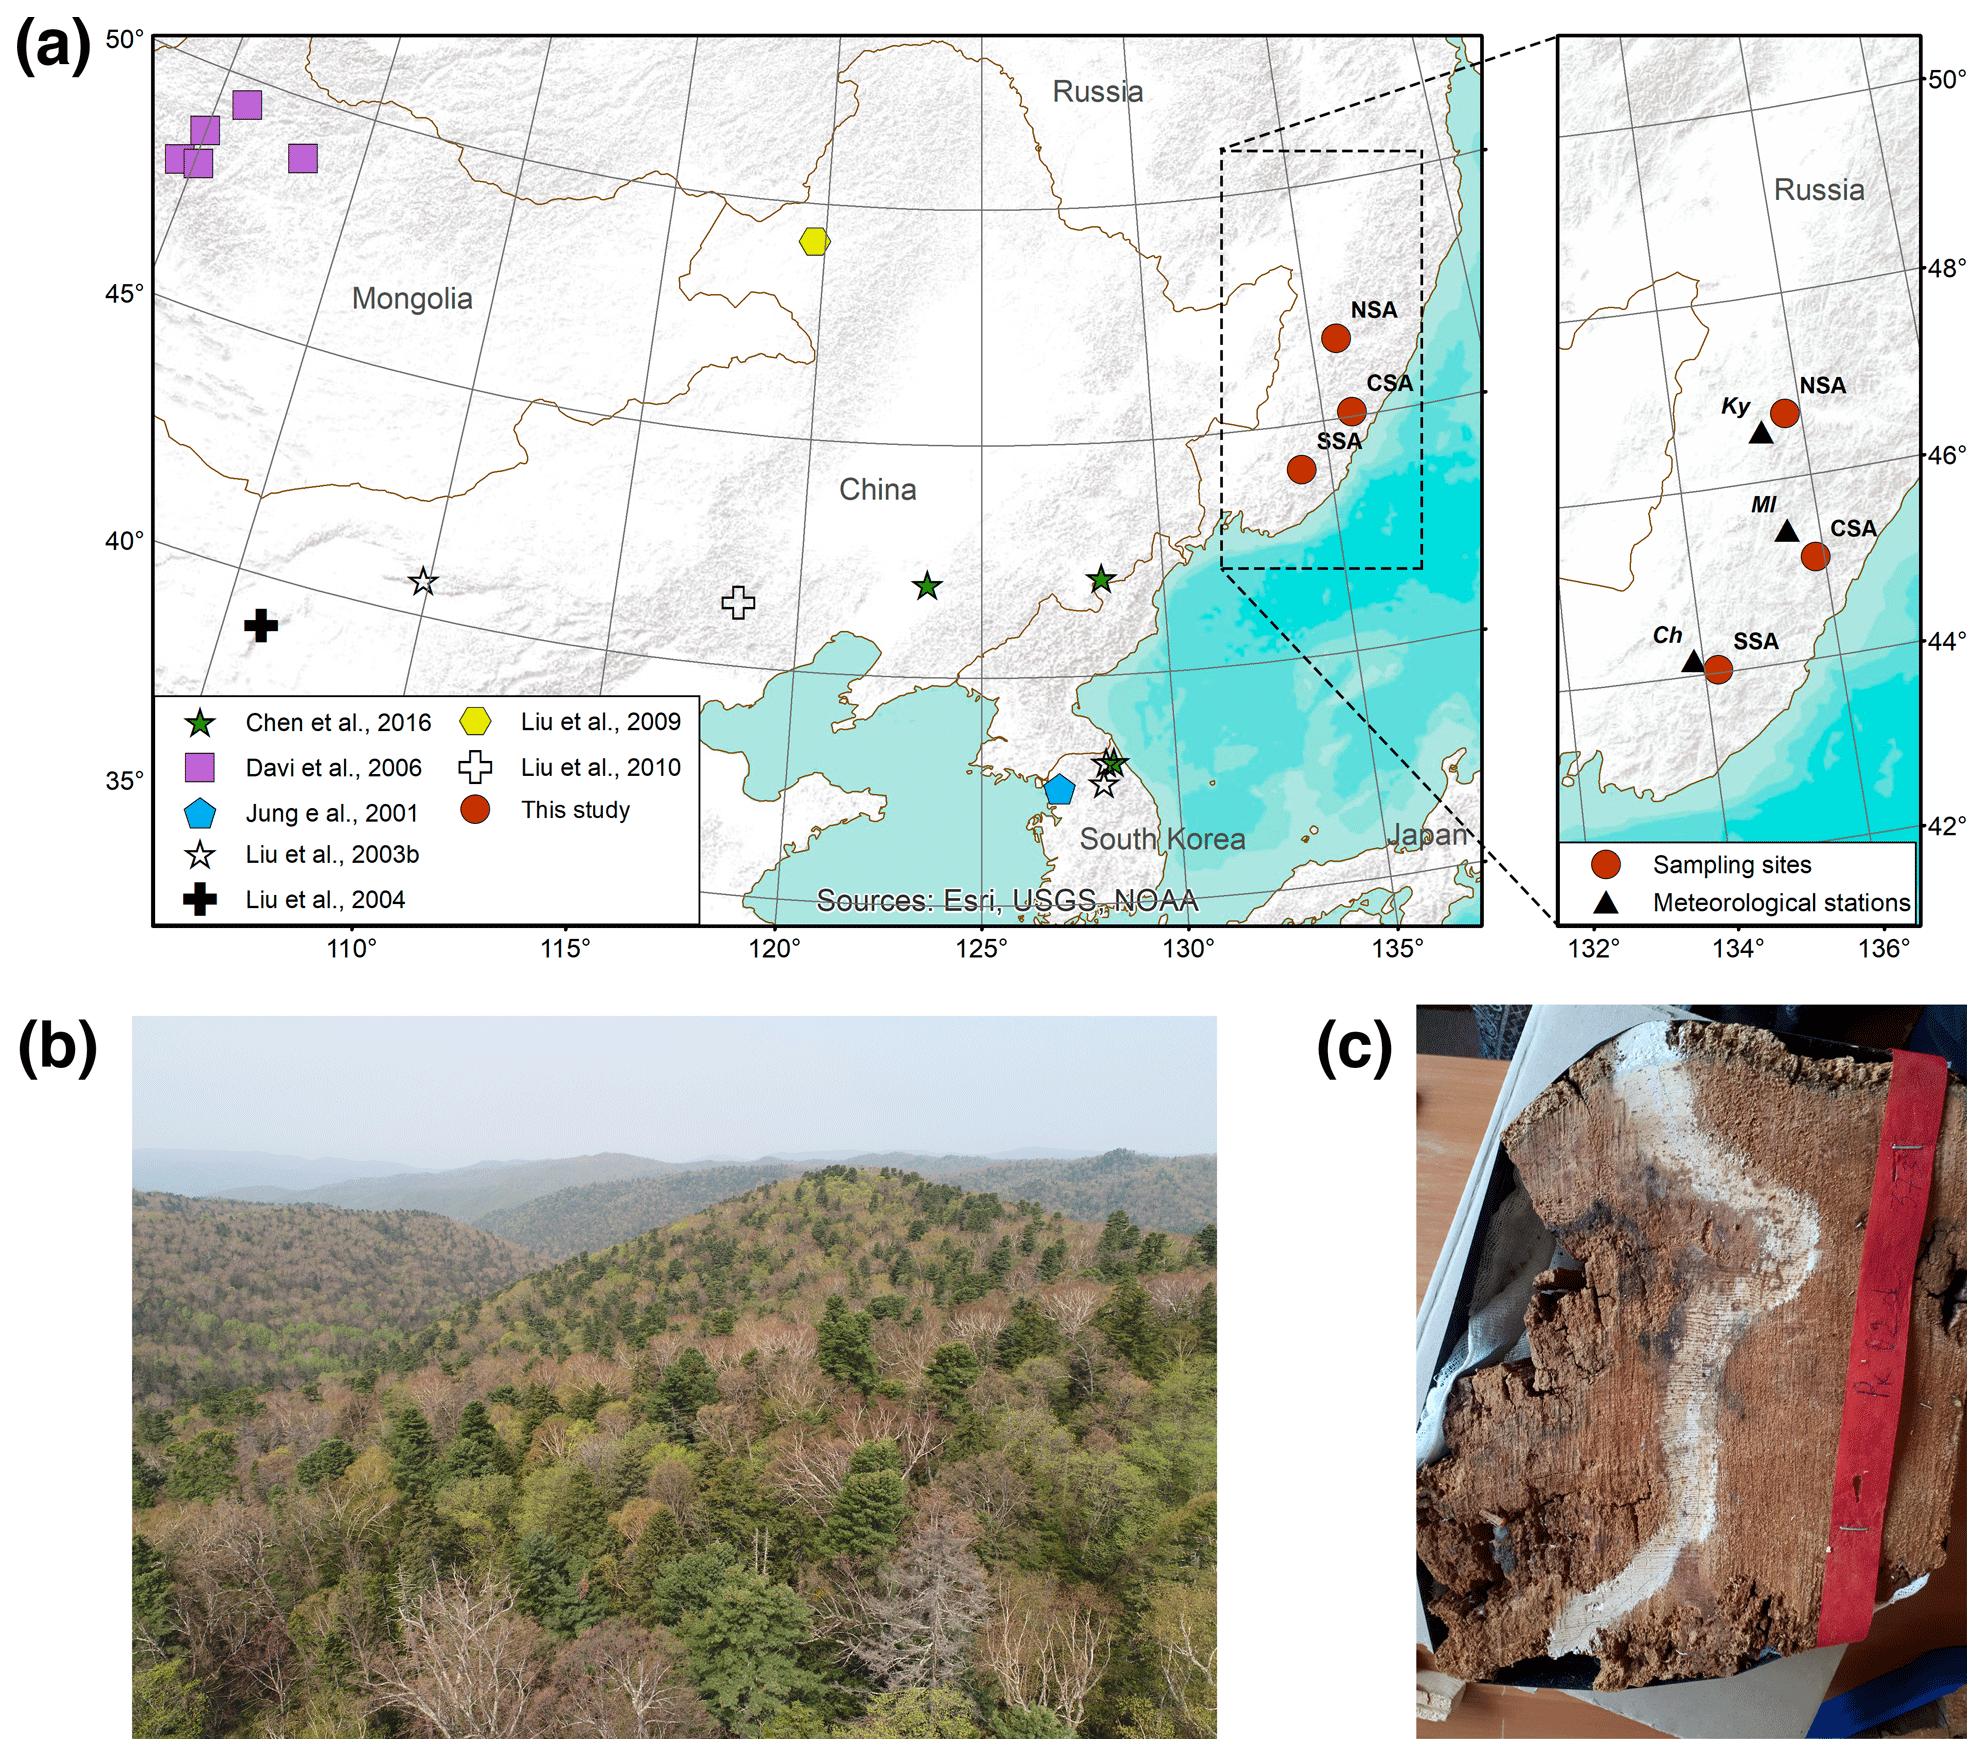
Figure 1Location of the study area. (a) Location of the sample sites of this study and nearest study areas with precipitation reconstructions in continental northeast Asia. SSA, CSA and NSA are the southern, central and northwestern Sikhote-Alin' Mountains, respectively; Ch, Ml and KY are the Chuguyevka, Mel'nichoye and Krasnyy Yar meteorological stations, respectively. Basemap: Esri. “Topographic”. Scale not given. “World Topographic Map”, 14 June 2013. http://www.arcgis.com/home/item.html?id=30e5fe3149c34df1ba922e6f5bbf808f (last access: 7 April 2020). (b) Korean-pine–broadleaved forest at the SSA site in late spring; tallest conifer trees are Korean pine. (c) Wood sample obtained from dead Korean pine tree.
2.1 Study area
The study area is located in northeast Asia and includes three sites located in the southern, central and northwestern parts of the Sikhote-Alin' Mountain range, in southeastern Russia (Fig. 1). The first site was the Verkhneussuriysky Research Station (SSA) of the Federal Scientific Center of the East Asia terrestrial biodiversity Far East Branch of the Russian Academy of Sciences (Fig. 1), which is along the western side of the south Sikhote-Alin' Mountain range. The second site was in the central part of the Sikhote-Alin' Nature Reserve (CSA) (Fig. 1), which is approximately 220 km northwest of SSA. The third site (NSA) was in the valley of the Bikin River on the western side of the Sikhote-Alin' Mountain range, approximately 200 km northwest of CSA and 330 km north of the SSA. Geographical coordinates and other characteristics of the studied locations are given in Table 1.
Table 1The sampling information and descriptive statistics of the residual chronologies. MS: mean sensitivity; SD: standard deviation; AC1: first-order autocorrelation; EPS: expressed population signal.
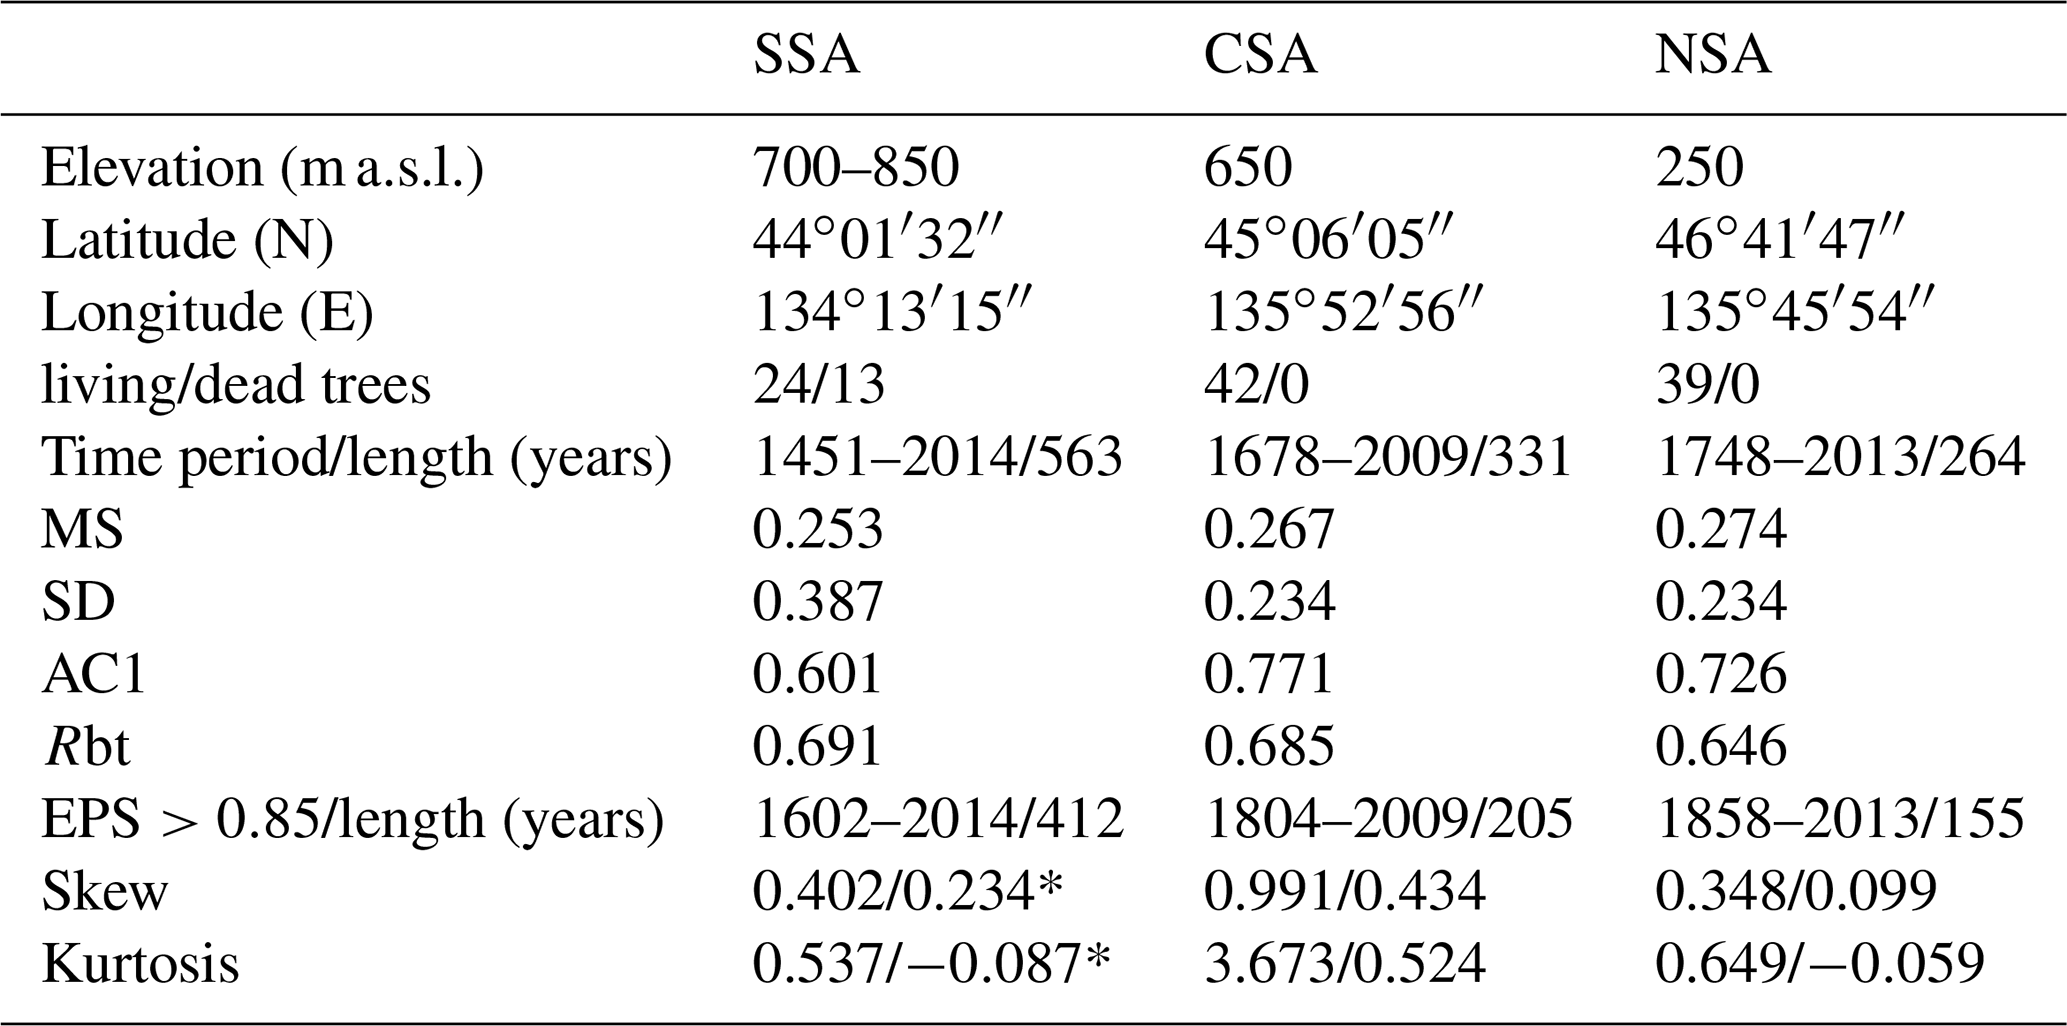
Note: * before/after filtering outliers in the beginning of the chronologies (where EPS <0.85); see Supplement, Figs. S2 and S3 for the details.

Figure 2Monthly total precipitation, minimum and maximum temperature at (a) Krasnyy Yar (1940–2013), (b) Mel'nichoye (1941–2009) and (c) Chuguyevka (1936–2004) meteorological stations.
The SSA, CSA and NSA are characterized by a monsoon climate with relatively long, cold winters and warm, rainy summers (Figs. 2, S1 in the Supplement). The average annual air temperatures are 0.9 ∘C for SSA, 0.2 ∘C for CSA and 0.8 ∘C for NSA. January is the coldest month (average minimum temperatures are −35.8, −38.5 and −30.5 ∘C for SSA, CSA and NSA, respectively), and July is the warmest month (average maximum temperatures are 27.4, 31.8 and 27.6 ∘C for SSA, CSA and NSA, respectively). In general, most of the precipitation falls in the summer period. The precipitation amount during the coldest months, i.e., the previous November to the subsequent February/March was 10 %–13 % (13 %–17 %) (Fig. S1). The driest areas are at the southern site (SSA) and central site (CSA), where the annual precipitation reaches approximately 700 mm. Higher precipitation is seen at the northwestern site – NSA (ca. 900 mm).
Korean-pine–broadleaved forests are the main forest vegetation type in the Sikhote-Alin' Mountain range of the southern Russian Far East. This area is the northeastern limit of the range of Korean-pine–broadleaved forests, which are also found in northeastern China (the central part of the range), on the Korean Peninsula and in Japan. The Sikhote-Alin' Mountains are among the few places where significant areas of old-growth Korean-pine–broadleaved forests remain.
All samples were collected from old-growth trees in natural closed-canopy Korean-pine–broadleaved forests. All trees were located in places where the direct anthropogenic impact and human economic activity had been absent for at least 300 to 500 years (for details, see Altman et al., 2018; Omelko et al., 2018).
2.2 Tree-ring chronology development
The data collection was carried out on permanent sample plots from 2010 to 2016 (Table 1). Two increment cores were extracted from living trees (then we used only one core for the measurement, without rotten parts and other damage) and one core from dead trees at breast height. In addition, in SSA, discs from dead trees were collected (one disc per tree). Together we used 169 wood samples (149 cores and 20 discs) from 169 trees: 45 for SSA, 77 for CSA and 47 for NSA. In the laboratory, all tree-ring samples were mounted, dried and progressively sanded to a fine polish until individual tracheids within annual rings were visible under the microscope according to standard dendrochronological procedures (Fritts, 1976; Cook and Kairiukstis, 1990). The cores were measured using the semi-automatic Velmex measuring system (Velmex, Inc., Bloomfield, NY, USA) with a precision of 0.001 mm. We firstly cross-dated ring sequences visually and consequently the COFECHA program (Holmes, 1983) was used to check the accuracy of the cross-dated measurements. Chronologies were developed using ARSTAN (Cook, 1985). To remove non-climatic and tree-age-related growth trends, individual series were detrended prior to standardization with spline smoothing (60-year low-pass filter). This detrending method was chosen because trees in a closed canopy forest usually have several abrupt growth increases (“releases”), and they are clearly visible in our raw ring width data. Chronologies computations were done by means of a biweight robust mean estimation. As a result, we obtained standard and residual chronologies for each sample site. Compared to residual chronologies (Table 1), standard chronologies (Supplement, Fig. S4) had lower sensitivity (0.210, 0.192 and 0.196 for SSA, CSA and NSA, respectively) and had a weaker correlation with precipitation (Supplement, Fig. S5). Therefore, we used residual chronologies for precipitation reconstruction.
2.3 Climate data
Monthly precipitation and temperature were obtained from the Chuguyevka meteorological station (44∘09′05′′ N, 133∘52′10′′ E) for SSA, from the Mel'nichoye meteorological station (45∘26′06′′ N, 135∘31′27′′ E) for CSA and from the Krasnyy Yar meteorological station (46∘32′27′′ N, 135∘21′29′′ E) for NSA; the available periods of monthly data for the stations are 1936–2004, 1941–2009 and 1940–2013, respectively. The sampling sites are located 31, 45 and 30 km from the weather stations of SSA, CSA and NSA, respectively (Fig. 1).
2.4 Statistical analyses
A correlation analysis (static bootstrapped correlation functions) was used to evaluate the relationships between the ring width index and observed monthly climate records from the previous June to the subsequent September. We used a traditional split-period calibration and verification method to explore the temporal stability and reliability of the reconstructions (Fritts, 1976; Cook and Kairiukstis, 1990). Pearson's correlation coefficient (r), R squared (R2), the reduction of the error (RE), the coefficient of efficiency (CE) and the product means test (PMT) were the tools used to verify the results. Analyses were carried out in R (R Core Team, 2019) using the treeclim package (Zang and Biondi, 2015) and STATISTICA (StatSoft®) software.
We used runs analysis (Dracup et al., 1980) on the reconstructions to study extreme dry and wet events. Empirical thresholds for the dry and wet events were defined as the 25th and 75th percentiles of instrumental measurements of precipitation for the periods 1936–2004, 1941–2009 and 1940–2013 for Chuguyevka (SSA), Mel'nichoye (CSA) and Krasnyy Yar (NSA), respectively. Multi-annual time series variations in reconstructed precipitation were obtained with moving averages (5-year).
Periodicity of reconstructed series at the three sites was investigated using a wavelet analysis with the significance estimation of the identified periods using the methodology of Torrence and Compo (1998). The computing environment used for the calculations was built on the basis of the Python programming language and scientific computing packages: NumPy, SciPy and waipy. The function “Morlet” was used as the mother wavelet.
Since the study area is located on the western coast of the Pacific Ocean at the boundary of the zone of influence of tropical cyclones (Altman et al., 2018), we tried to find static correlations between our precipitation reconstructions and El Niño–Southern Oscillation (Allan et al., 1996; Allan, 2000) indexes (SOI, NINO3, NINO4, NINO3.4) and a Pacific Decadal Oscillation (Mantua and Hare, 2002) index. We also tried to find a static correlation between the precipitation reconstructions and Arctic Oscillation (AO), which affects the climate of the Northern Hemisphere. Additionally, we looked for static correlation between the reconstructions and the Palmer Drought Severity Index (PDSI), which is used to describe the moisture environment (Palmer, 1965; Dai et al., 2004). All correlation analyses were performed using the KNMI Climate Explorer (http://climexp.knmi.nl, last access: 26 April 2021, see Table S1 in the Supplement for the details).
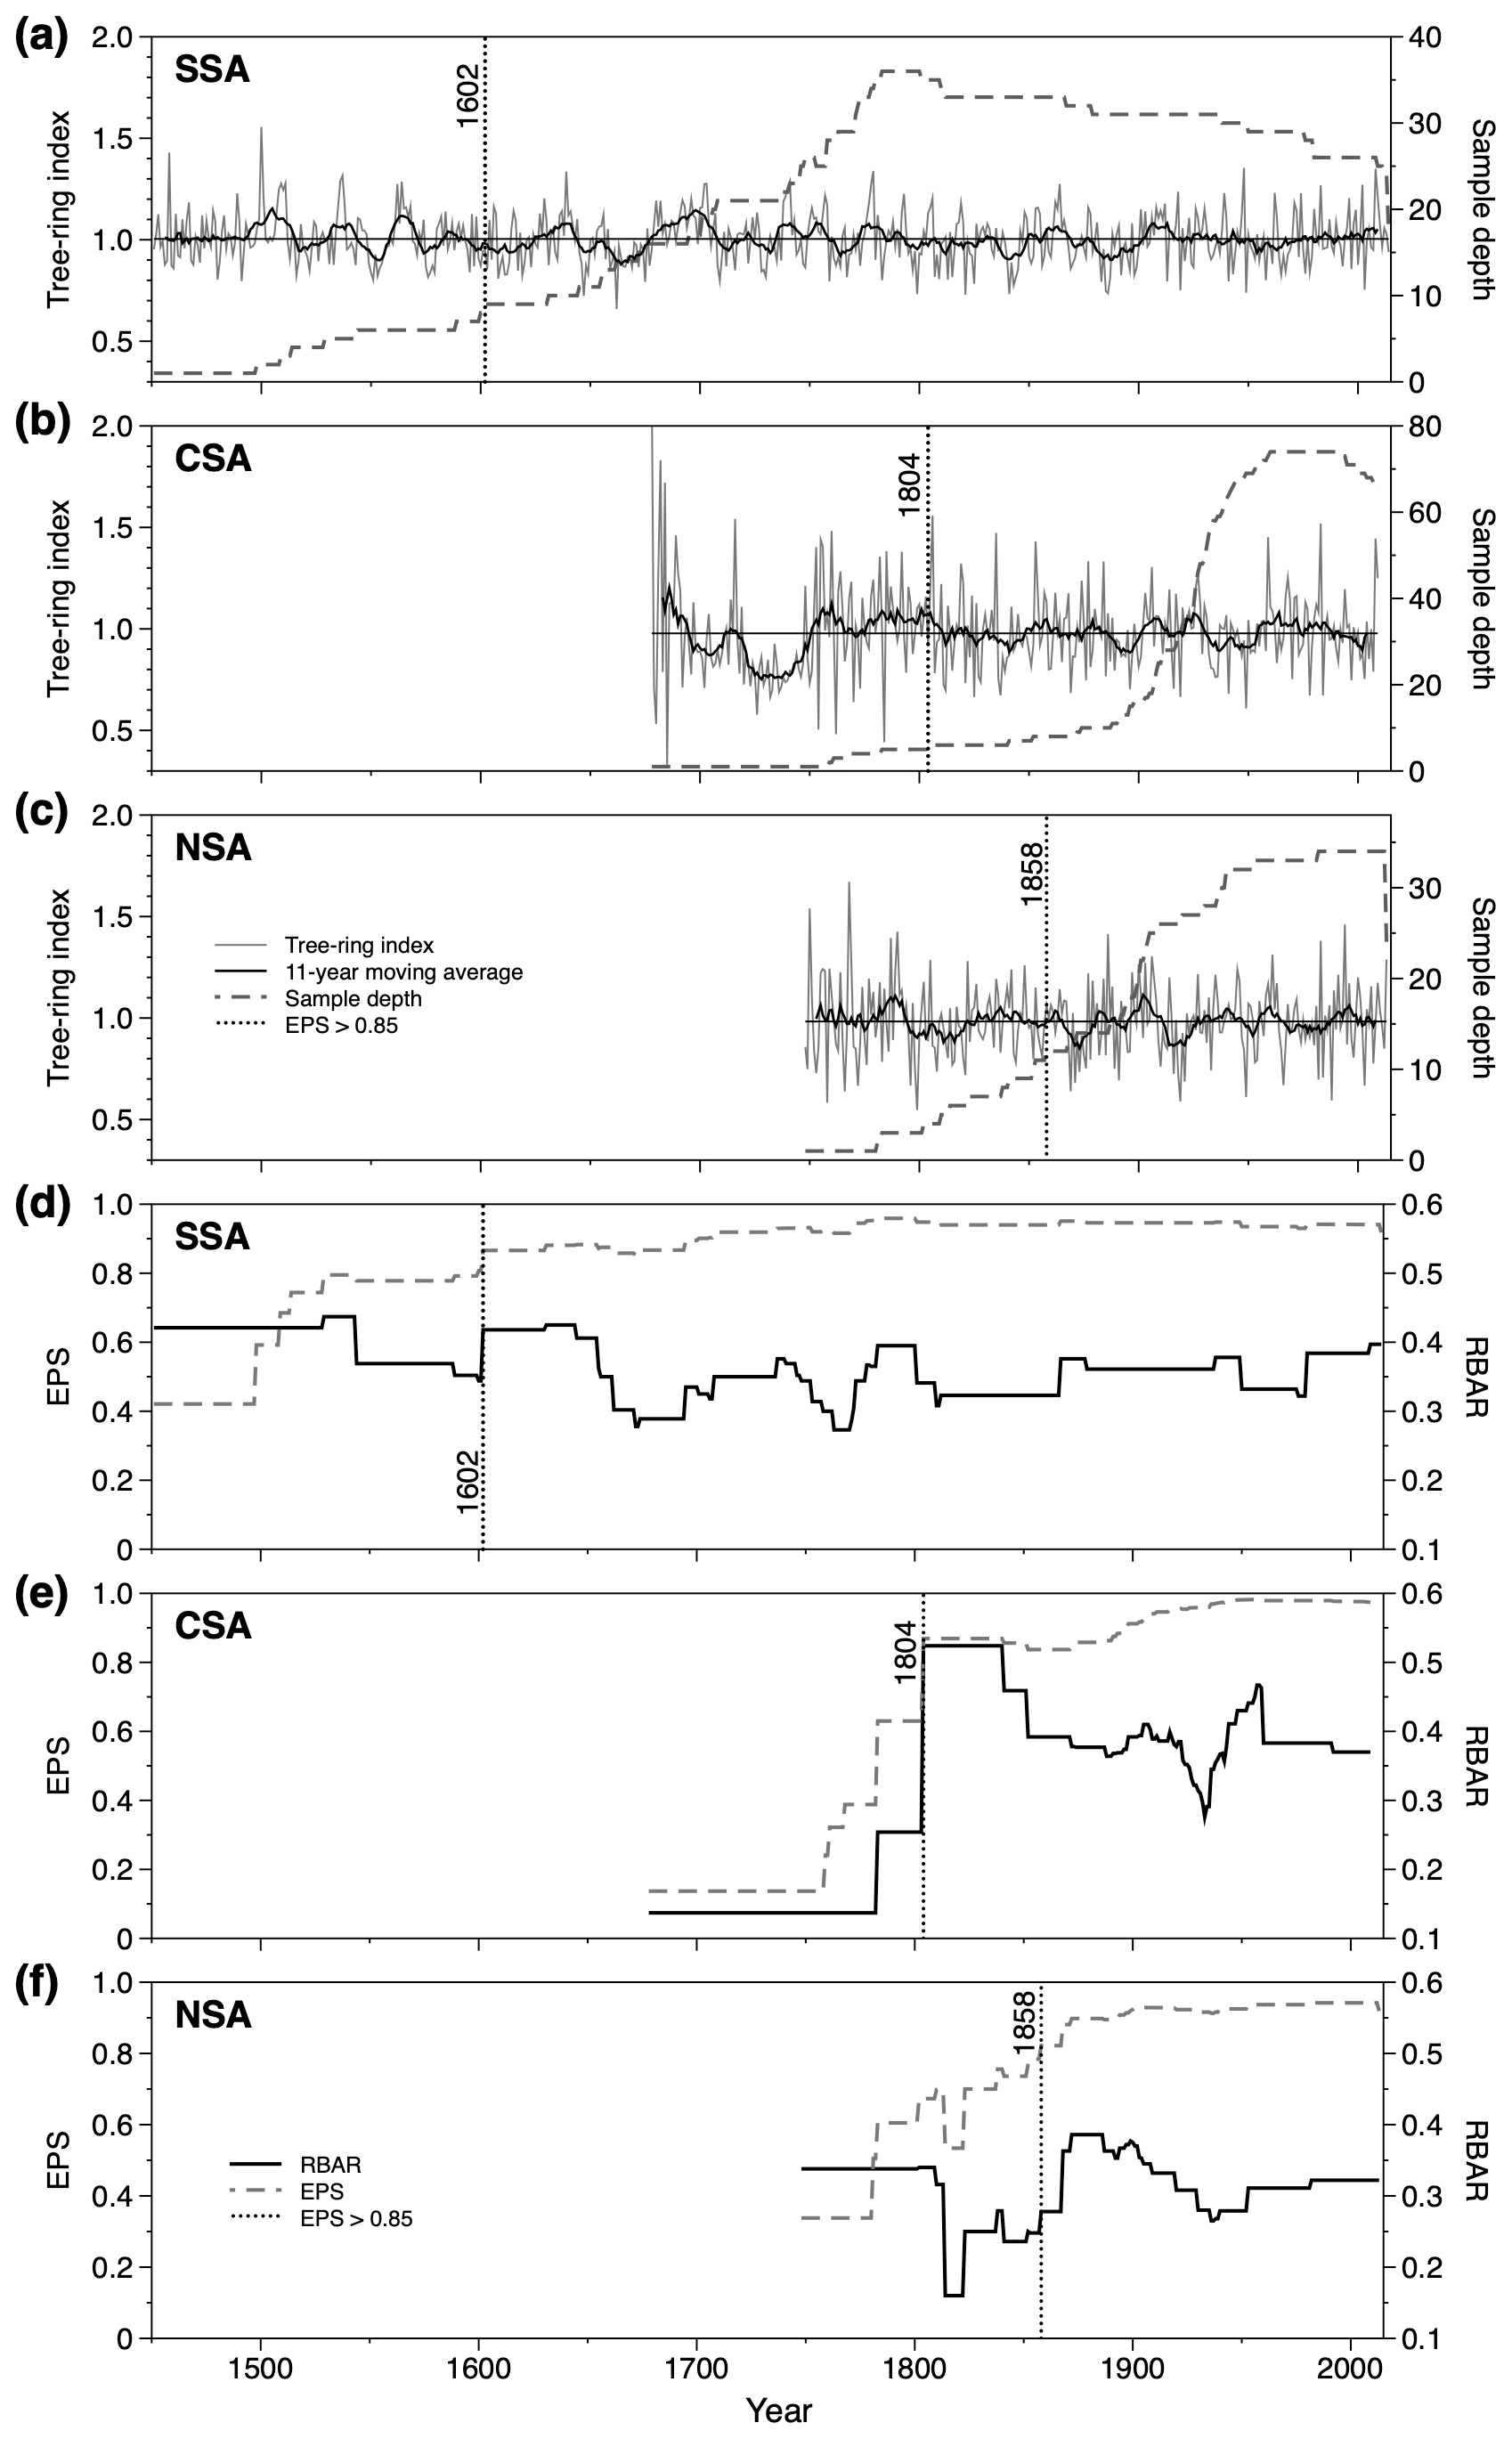
Figure 3Variations in the tree-ring width chronologies and sample depth (a–c), expressed population signal (EPS) and average correlation between all series (RBAR) (d–f).
3.1 Climate–radial-growth relationship
The full length of the tree-ring chronologies spanned 1451 to 2014 for SSA, 1678 to 2009 for CSA and 1748 to 2013 for NSA (Fig. 3). A reliable period of chronologies (EPS >0.85) was identified from 1602 to 2014 (9 trees; Fig. 3a) for SSA, from 1804 to 2009 CE for CSA (6 trees; Fig. 3b) and from 1858 to 2013 CE for NSA (11 trees; Fig. 3c).
The mean correlation between trees (Rbt), mean sensitivity (MS) and expressed population signal (EPS) were calculated to evaluate the chronology quality (Fritts, 1976; Cook and Kairiukstis, 1990) (Table 1). EPS indicates the extent to which the sample size is representative of a theoretical population with an infinite number of individuals. A level of 0.85 in EPS is considered to indicate a satisfactory quality of the chronology (Wigley et al., 1984). The calibration and verification statistics of the reconstruction equations are listed in Table 2.
Table 2Calibration and verification statistics of the reconstruction equations for the common periods 1936–2004 and 1941–2009.
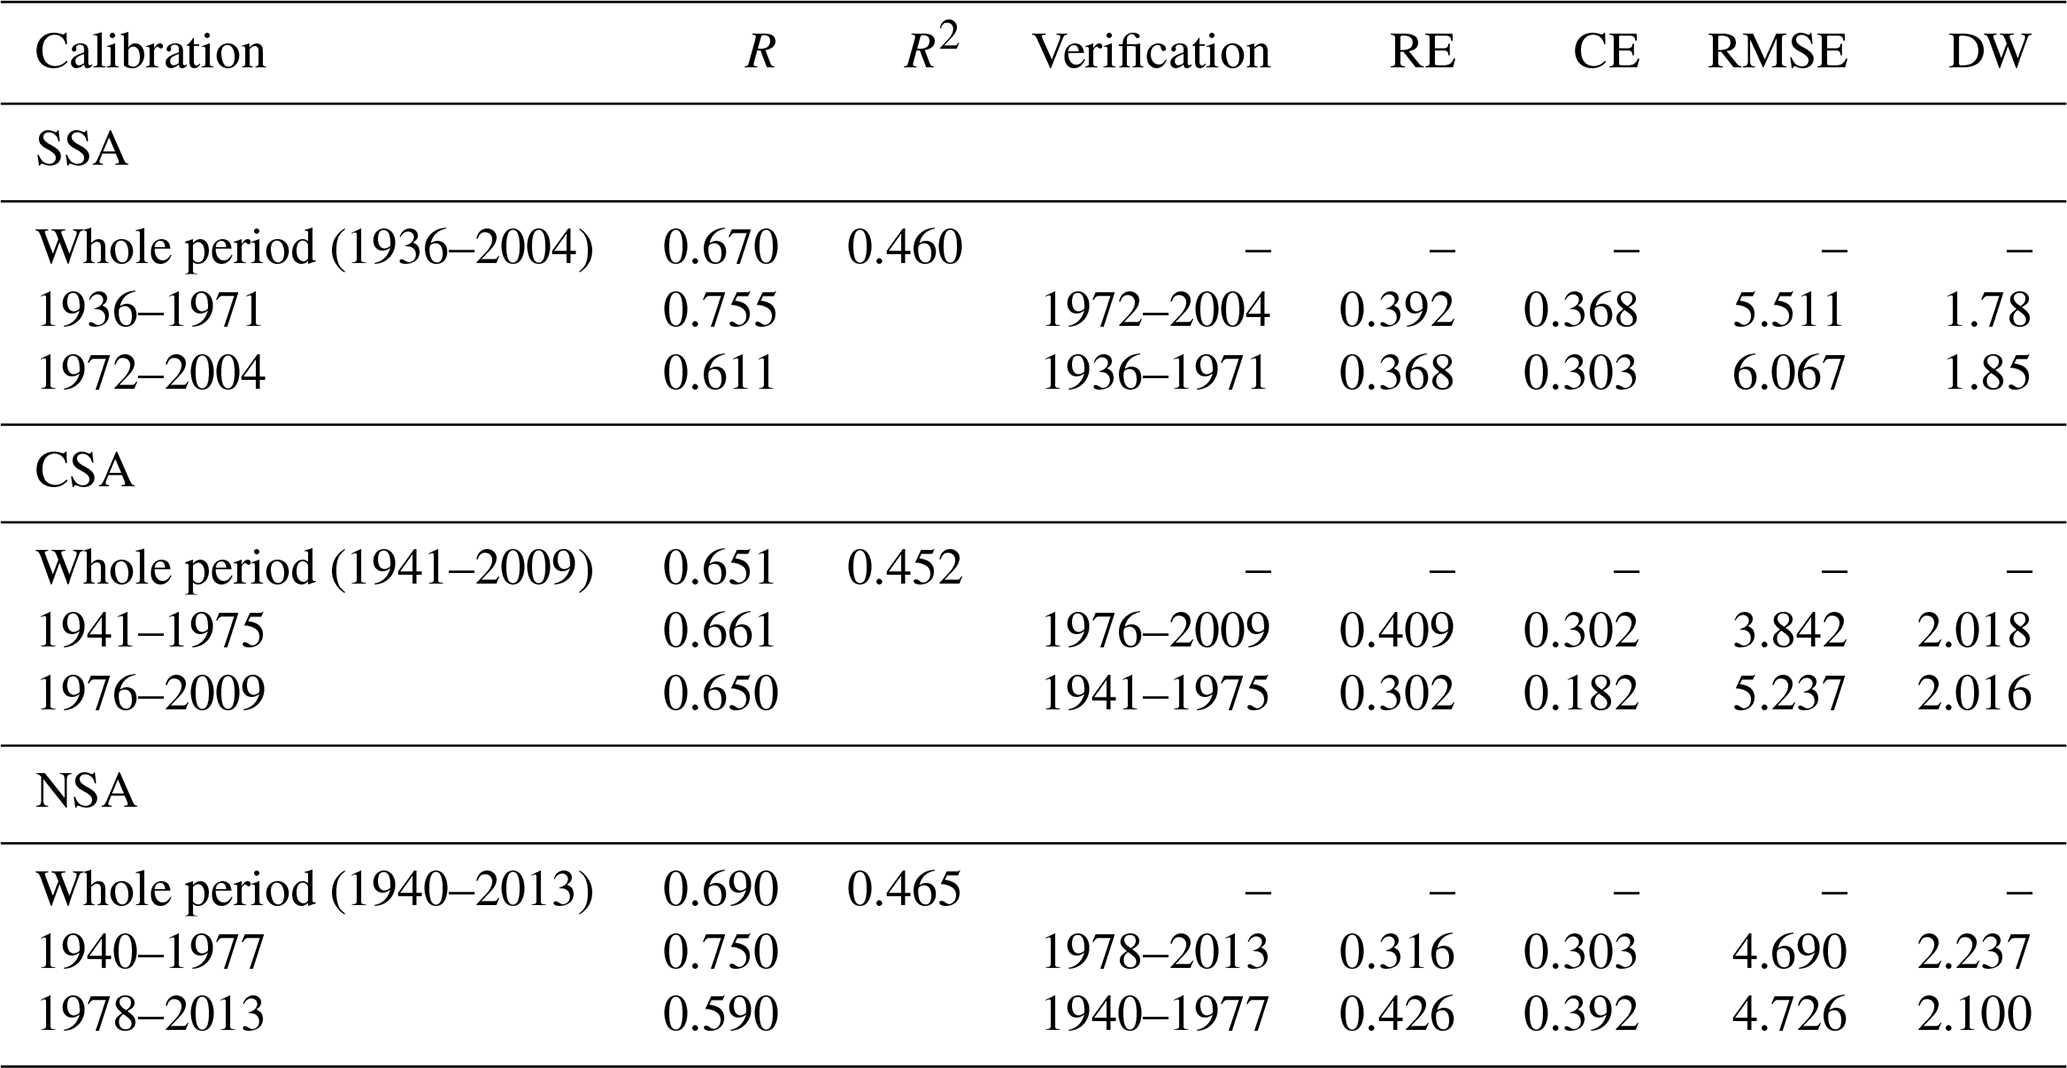
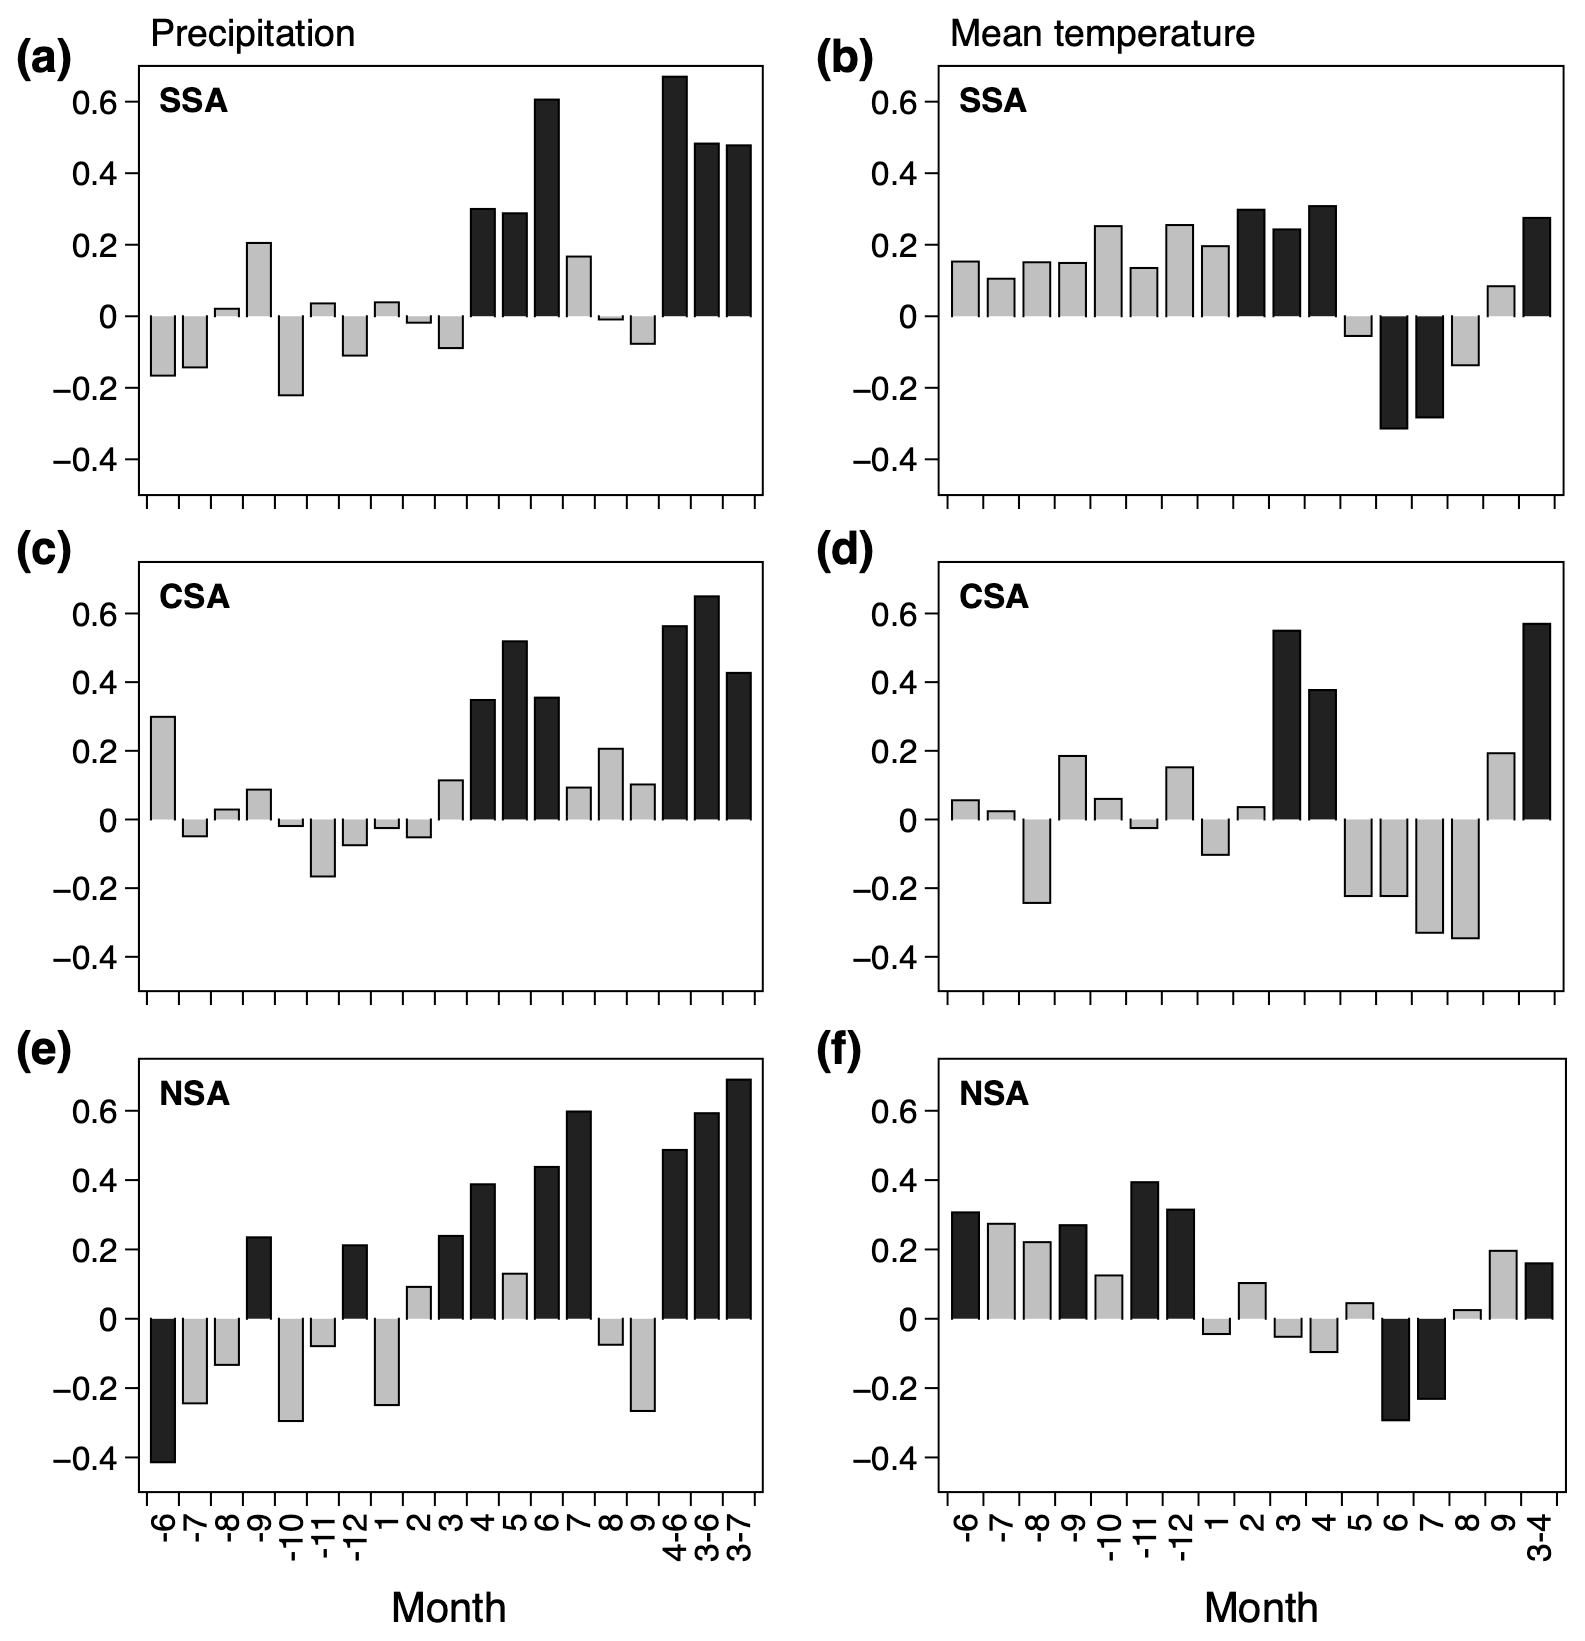
Figure 4The correlation between the meteorological data (total precipitation and mean temperature) from Chuguyevka meteorological station and SSA tree-ring width index (a, b), Mel'nichoye meteorological station and CSA tree-ring width index (c, d), and Krasnyy Yar meteorological station and NSA tree-ring width index (e, f). Black bars denote significant values (α=0.01).
All three created chronologies show substantially better correlations with precipitation than with temperatures (Fig. 4). In terms of precipitation, there is an identifiable and significant spring-to-early-summer period common to all three study sites. For instance, in the SSA case, the growth of Korean pine is positively related to precipitation during April–June of the subsequent year (Fig. 4a), in the case of CSA the growth is positively related to precipitation during April–June of the subsequent year (Fig. 4c), and in the case of NSA the growth is positively related to precipitation during the previous June, September and December and also March–July (except May) of the subsequent year (Fig. 4e). Based on the results of the analysis of the precipitation correlation with individual months, we tried to select combinations of months that give the highest correlation. In the SSA case it is the period from April to June (correlation 0.67), in the CSA case it is the period from March to June (correlation 0.65), and in the NSA case it is the period from March to July (correlation 0.69) (Fig. 4a, c, e).
Regarding temperature, significant months for the SSA are February to April (positive correlation) and June and July (negative correlation) (Fig. 4b). For the CSA there is a positive significant correlation with the temperatures during the March and April (Fig. 4d). For the NSA the temperature shows positive yet significant correlations with the previous June, September, November and December period and negative correlations with the June and July of the subsequent year (Fig. 4f).
3.2 Precipitation reconstructions
Based on the analytical results, we created a linear regression equation to reconstruct the aggregate precipitation amount during April to June for SSA, March to June for CSA and March to July for NSA. The transfer function was as follows:
where YSSA, YCSA and YNSA is the April–June (for SSA), March–July (for CSA) or March–June (for NSA) precipitation and Xp is the tree-ring index of the Korean pine chronology for each site at year p. The comparison between the reconstructed and observed mean growth season temperatures during the calibration period is shown in Fig. 5a, c and e. The cross-validation test yielded a positive RE and CE, confirming the predictive ability of the model (Table 2).
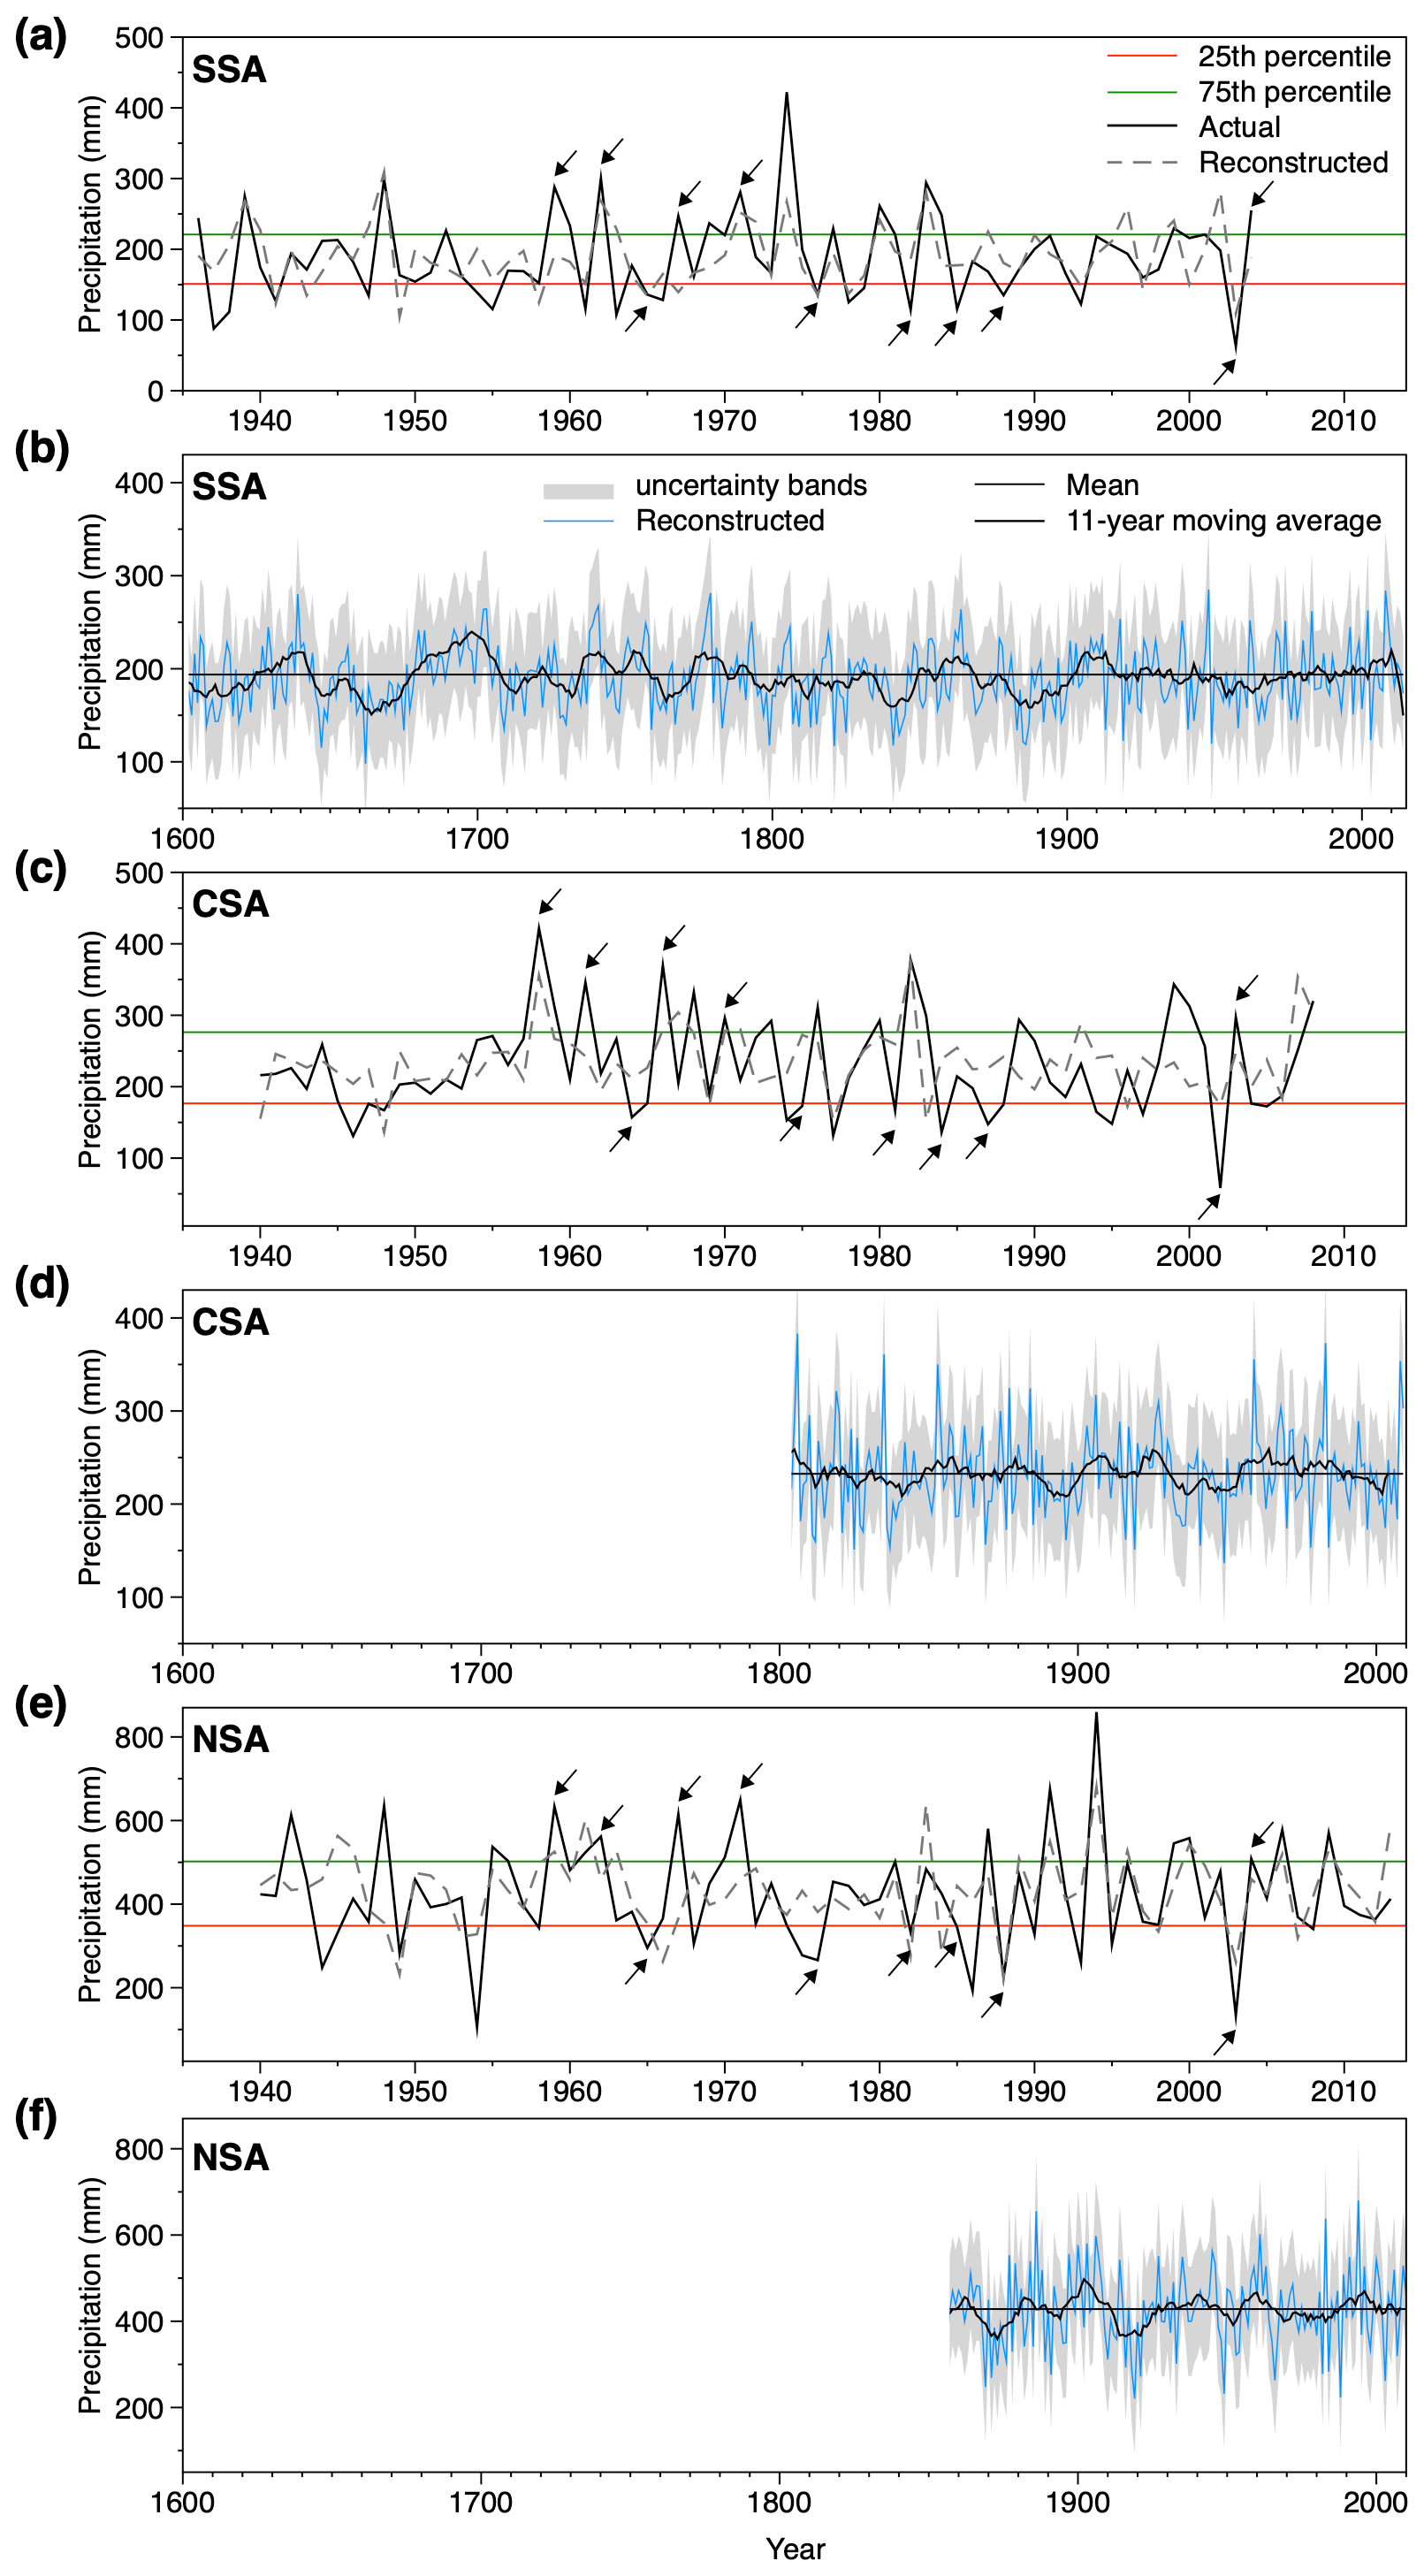
Figure 5Actual and reconstructed precipitation for the SSA (a, b), CSA (c, d) and NSA (e, f). Uncertainty bands estimated as twice the standard error of prediction (±2σ) (Wilks, 1995). Arrows indicate common extreme wet and dry years in instrumental data (values above 75th and below 25th percentiles of measurements, respectively).
The correlation between the precipitation reconstructions was significant at all three sites yet varied as follows: 0.35 in the case of CSA-NSA, 0.22 in the case of NSA–SA and 0.44 in the case of CSA-SSA. Correlation between the weather stations was as follows: CSA-NSA – 0.46; NSA–SA – 0.43; CSA-SSA – 0.64.
3.3 Precipitations variations to each site and its periodicity
The reconstructed sum of the April–June (SSA), March–July (CSA) and March–June (NSA) precipitation variations and its 11-year moving average are shown in Fig. 5b, d and f. The mean value of the reconstructed precipitation was 190 mm (SD ±34 mm) for SSA, 232 mm (SD ±55 mm) for CSA and 348 mm (SD ±56 mm) for NSA. We defined the wet and dry years for each reconstruction and also common wet and dry years (Fig. 6). Additionally, we verified the identified wet and dry years for the relevant data period (Fig. 5a, c, e).
Table 3Characteristics of drought events (DEs) and wet events (WEs) identified based on the precipitation reconstructions.
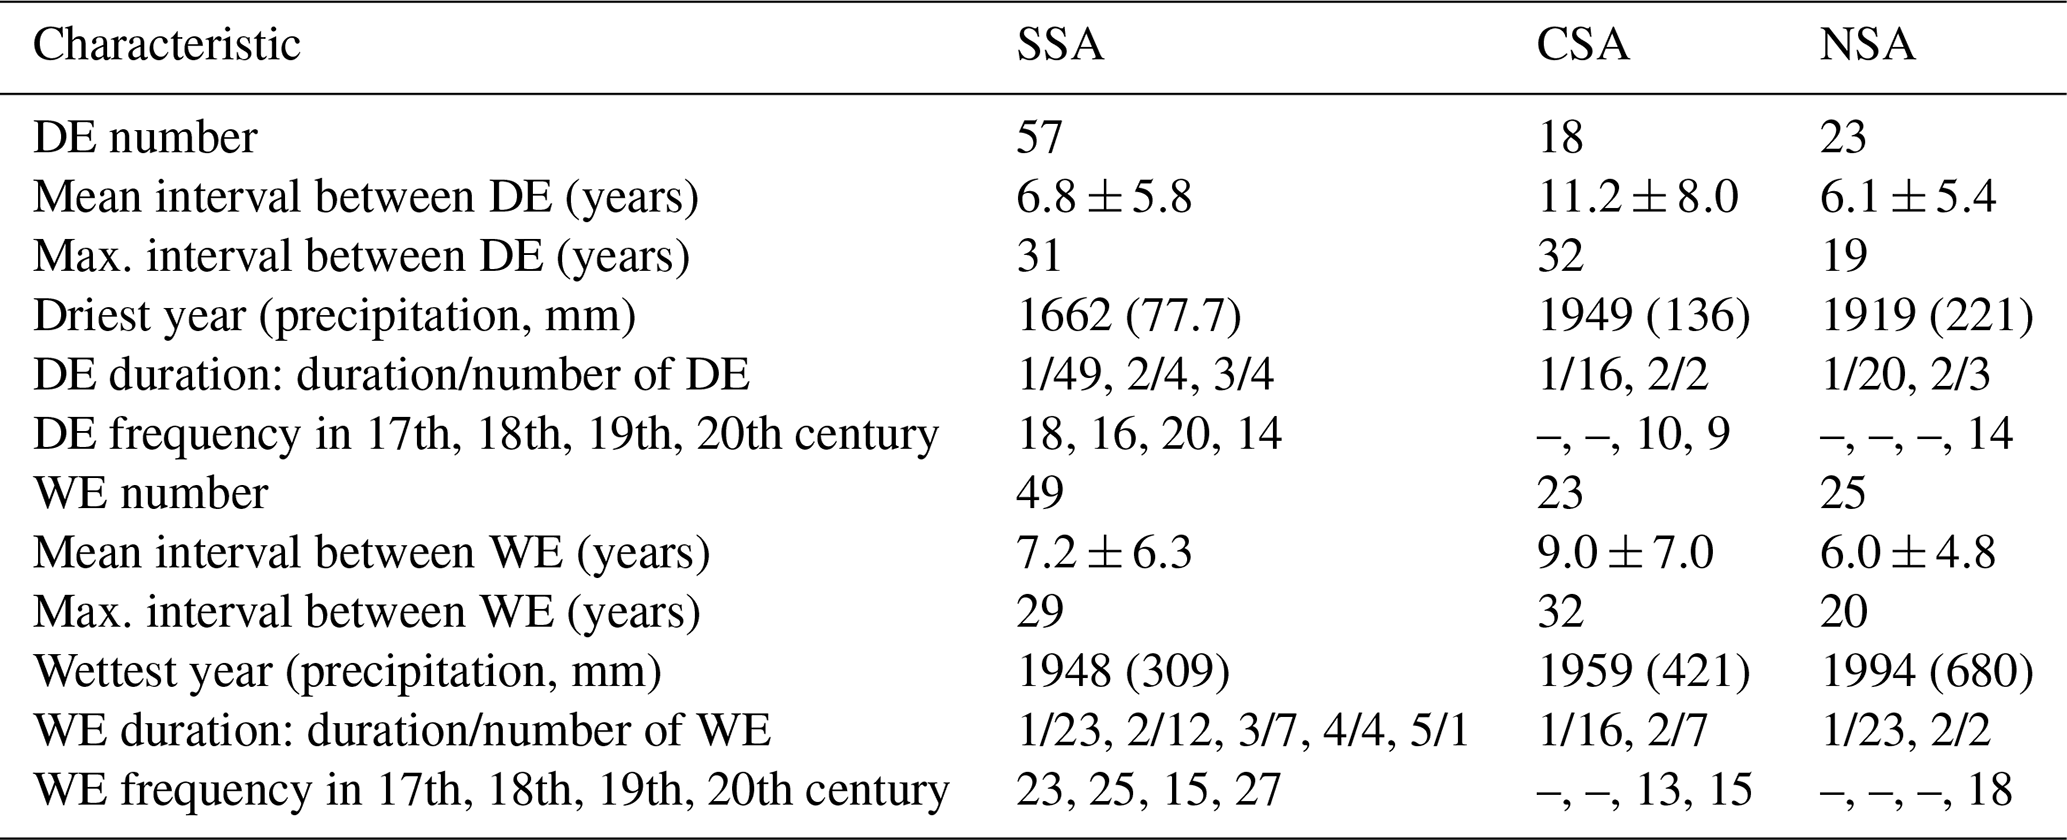

Figure 6Extreme wet and dry years for SSA (a), CSA (b) and NSA (c). Gray lines indicate reconstructed precipitation values, and bold black lines are the 5-year moving average; horizontal solid black lines are mean values of the instrumental data; red and green dashed horizontal lines are empirical thresholds of the 25th and 75th percentile of the instrumental data, respectively. Uncertainty bands (gray areas) are estimated as twice the standard error of prediction (±2σ). Asterisks indicates common extreme wet and dry years for all three reconstructions; common period from 1800.
The April–June reconstruction for SSA from 1602 to 2014 contains 57 drought events and 47 wet events (Table 3). The percentage of droughts with a duration of more than 1 year is 14 %, while the proportion of wet events with a duration of more than 1 year is 49 %. The longest droughts are 3-year events in 1647–1649, 1728–1730, 1843–1845 and 1885–1887. The frequency of dry years is highest in the 19th century. The frequency of wet events is at a maximum in the 20th century. A 5-year moving average of the reconstruction demonstrates multi-annual variation in April–June precipitation and suggests prolonged wet and dry events; most of them occurred in the 17th and 18th centuries. The driest 5-year reconstructed period is 1883–1887 (128 mm). The wettest 5-year reconstructed period is 1738–1742 (256 mm).
The March–June reconstruction for CSA from 1804 to 2009 contains 18 drought events and 23 wet events. The proportion of wet events with a duration of more than 1 year is 11 %, while the proportion of wet events with a duration of more than 1 year is 44 %, and this is 4 times more than for dry events. Two-year drought events occurred in 1811–1812 and 1836–1837. Two-year wet events occurred in 1805–1806, 1819–1820, 1853–1854, 1926–1927, 1967–1968, 1971–1972 and 2008–2009. The frequency of wet and dry years in the 19th and 20th century is similar. A 5-year moving average of the reconstruction does not reveal prolonged dry events. There is only one wet 5-year reconstructed period from 1802–1806 (285 mm).
The March–July reconstruction for NSA from 1858 to 2013 contains 23 drought events and 25 wet events. Two-year drought events occurred in 1875–1876, 1918–1919 and 1953–1954. Two-year wet events occurred in 1906–1907 and 1945–1946. Since the reliable reconstruction interval (EPS >0.85) starts from 1858, there are insufficient data to compare the frequency of dry and wet years in different centuries. A 5-year moving average reveals several prolonged wet and dry events. The driest 5-year reconstructed period is 1917–1921 (323 mm) and the wettest 5-year reconstructed period is 1903–1907 (515 mm).
Common wet years for SSA, CSA and NSA were identified in the following years: 1877, 1903, 1906, 1927, 1983 and 2009 (Fig. 6). For SSA and CSA common wet years were additionally identified in 1805 and 1853. Common dry years for SSA, CSA and NSA occurred in 1869, 1919, 1949 and 2003; for SSA and CSA there is one more common dry event in 1821. We did not identify common wet and dry events with a duration of more than 1 year.
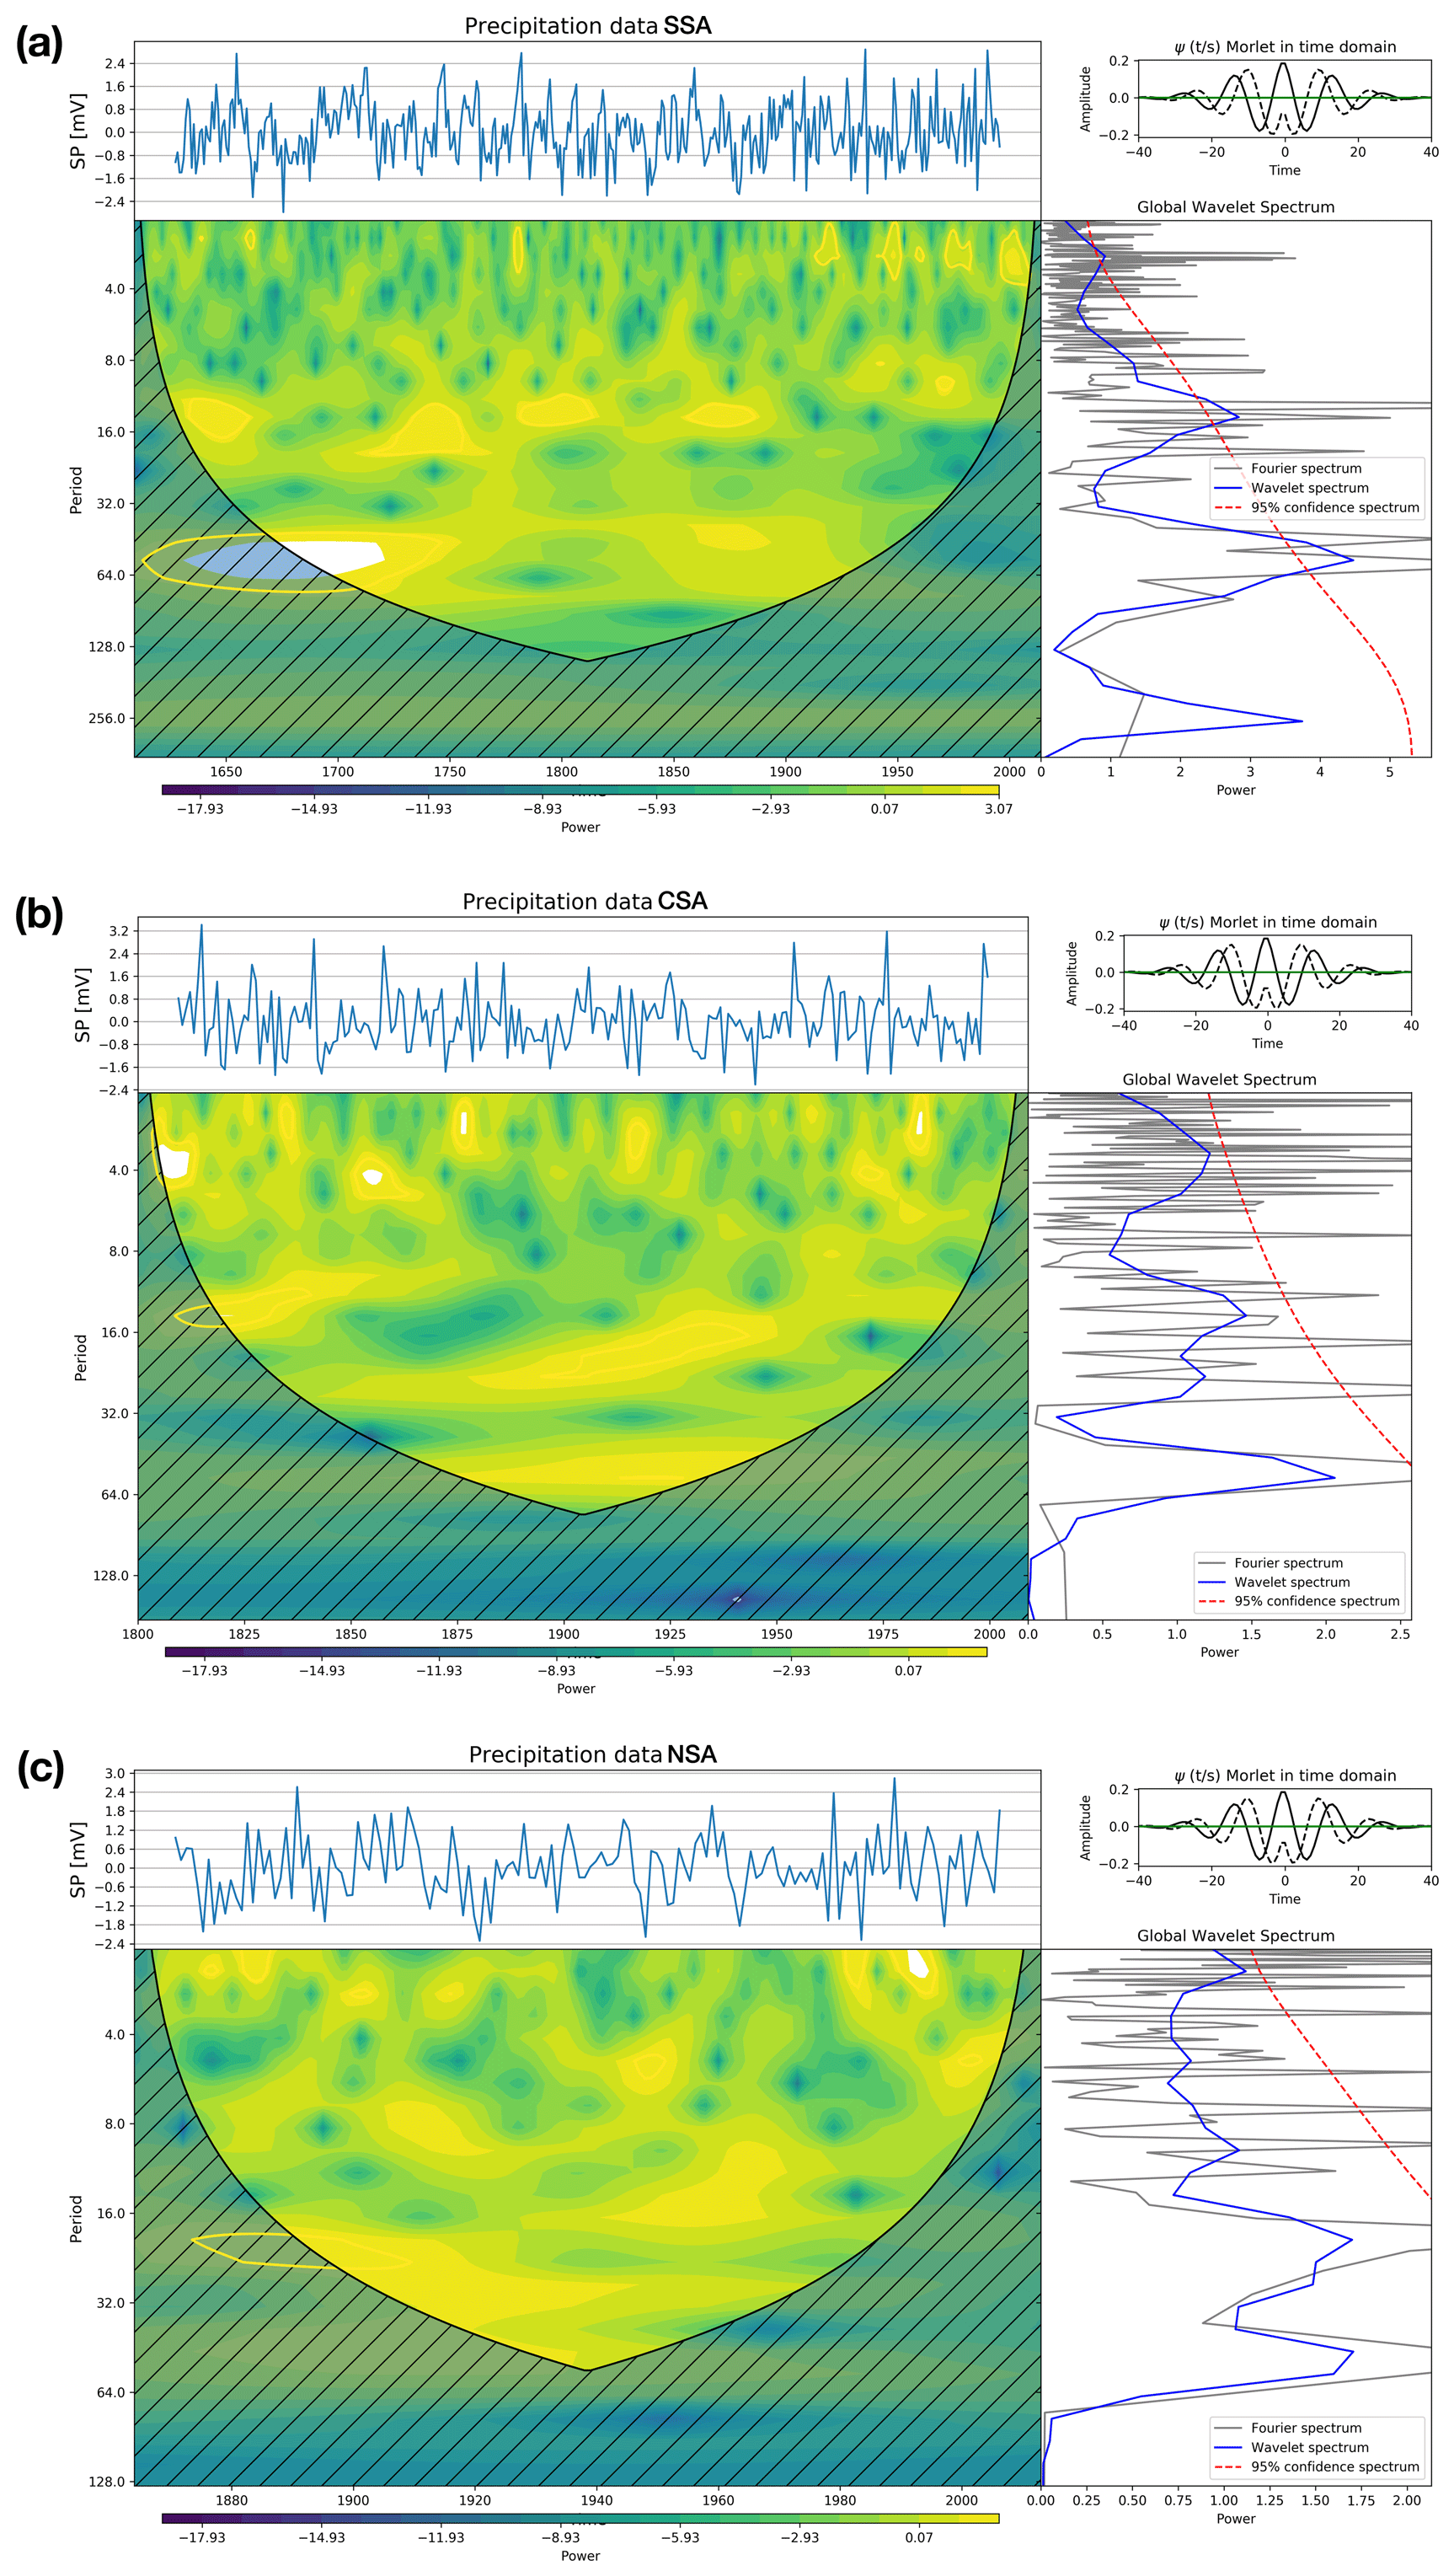
Figure 7The wavelet power spectrum of the reconstructed precipitation at the SSA (a), CSA (b) and NSA (c); powers are given in log2-scale. Significant are the periods that intersect the dashed red region of significance (blue curve) in the graph on the right, constructed for a significance level of 0.05. At the top of the graph is a time series and to the right is the view of the mother wavelet used. The influence cone is indicated by hatching on the wavelet transform graph (this graph is filled). Values falling into the hatched region could be affected by the continuation of the signal due to its artificial periodization beyond the interval of its actual determination.
The wavelet analysis for the three sites yielded the following results. In the case of SSA, a significant time series periodicity component with a duration of 57 to 60 years was detected (Fig. 7a). This cycle (given the intensity of the conversion diagram's color filling (yellow and white) is expressed in the late 17th and early 18th centuries. Other noteworthy cycles were 12 to 15 and 2 to 3 years, which were also identified as significant. The former mostly took place until the 20th century, and the latter was typical for the 20th century. No significant cycles were detected for CSA and NSA; however, power graph shows that there is a tendency for the existence of a periodicity component of 58 to 60 years and 60 to 62 years for CSA and NSA, respectively (Fig. 7b, c). There were also identified periods of approximately 15 and 2 to 4 years for CSA and NSA, yet the periods themselves coincided in terms of duration with significant periods identified for SSA.
For all three sample sites, we found significant (p<0.01) correlations between the precipitation reconstructions and PDSI: r=0.276 for SSA, 0.365 for CSA and 0.372 for NSA. No significant correlation was found between precipitation reconstructions and large-scale oscillation indices.
The precipitation reconstructions are significantly correlated with the CRU TS4.03 gridded precipitation data (SSA: r=0.382, p<0.05; CSA: r=0.350, p<0.05; NSA: r=0.440, p<0.001). Spatial correlations between our precipitation reconstructions and the gridded precipitation data set (CRU TS 4.03) reveal that our reconstructions, especially for NSA, have large-scale implications (Fig. 8).
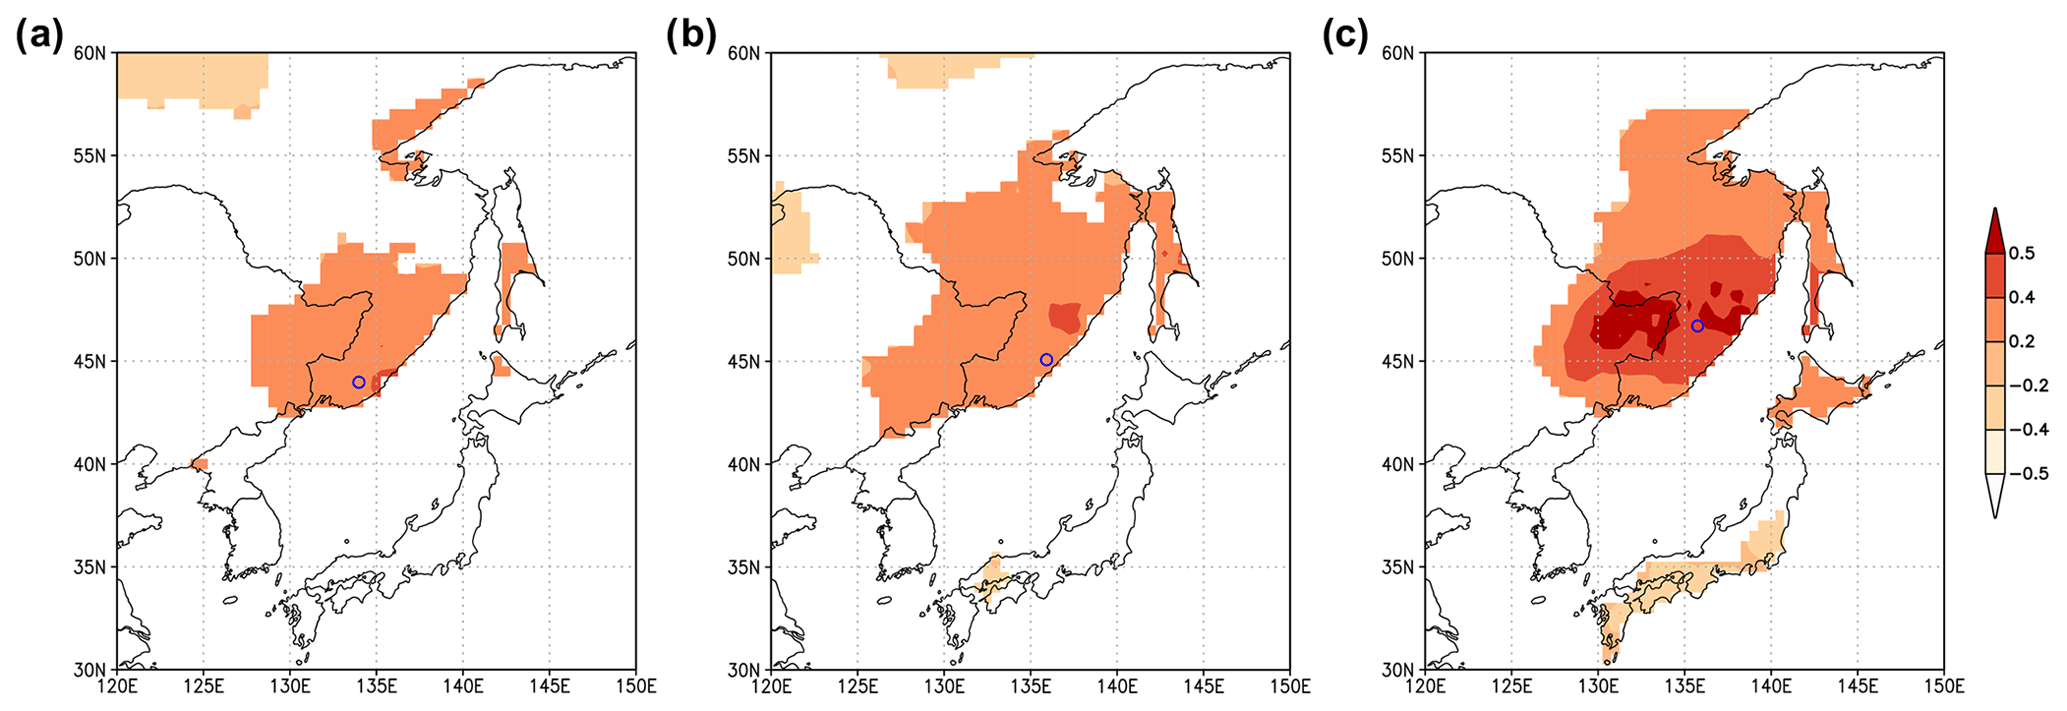
Figure 8Spatial correlation pattern of gridded precipitation CRU TS 4.03 with the reconstructed precipitation using the Climate Explorer website (http://climexp.knmi.nl, last access: 26 April 2021): (a) April–June (SSA), (b) March–June (CSA) and (c) March–July (NSA). The sample sites are marked with circles. Analysis periods are 1936–2004, 1941–2009 and 1940–2013 for SSA, CSA and NSA, respectively; p<0.1.
4.1 Climate–growth response
As the analytical results of the correlation between the tree growth and climate factors showed, the spring-to-early-summer precipitation played an important role in the growth of Korean pine at all study sites. As previous studies have shown, the growth of pines in northeast Asia tended to be limited by a moisture deficit (Y. Liu et al., 2003, 2004; Gao et al., 2005; Li et al., 2006, 2007; Liang et al., 2007; Fang et al., 2009; Li et al., 2009a, b; Liu et al., 2009; Fang et al., 2010a, b; Chen et al., 2012). During springtime the moisture deficit is of great importance for plants, since it is exactly the period when their active growth begins (Kozhevnikova, 2009).
Since a relatively small amount of precipitation falls during the cold months, precipitation at the beginning of the growing season is of great importance for plants. During the dry years, the periods in which trees were sensitive to precipitation (March to June, March to July and April to June in the cases of CSA, NSA and SSA, respectively) were characterized by precipitation that amounted to up to 25 % (CSA and NSA) and up to 32 % (SSA) of the multiyear mean value (Fig. S1). During the wet years, precipitation amounted to 181 %, 201 % and 218 % of the multiyear mean value for CSA, NSA and SSA, respectively. For instance, in the case of NSA, the March–July precipitation in the driest year was 106 mm, while that in the wettest year was 860 mm.
The months with significant precipitation–growth relationships belong to the first stage of the Far Eastern summer monsoon, which lasts on average from April to June (Mezentseva and Fedulov, 2017). This monsoon stage is a very cold wet sea air current, which is intermittent with the impact of air masses coming from Central Asia (Mezentseva and Fedulov, 2017). The variation in the significant months could be explained by their locations. April to June were significant months for the southernmost site (SSA), which completely coincides with the first monsoon stage (Sorochan, 1957; Lisogurskiy and Petrichev, 1980). The period between March and June was identified as the most important for the site which is located further east and nearest to the shore (CSA) because for this site the influence of the oceanic current is longer and more pronounced. In the case of the inland part, located further west (NSA), March to July precipitation plays the most important role as this area is more frequently exposed to the springtime arrival of southern wet air masses, and during summer the first (drier) monsoon stage is later replaced with the second stage (with abundant precipitation).
Growth–climate analysis identified the effect of temperature for different seasons at individual sites. Extreme temperatures are widely known to have a severe and limiting impact on the growth of trees located at the boundary of their growth region (northern boundary of the distribution area and altitudinal forest limit) (Wilson and Luckman, 2002; Körner and Paulsen, 2004; Porter et al., 2013; Yin et al., 2015; Ukhvatkina et al., 2018). At sites where the ocean (monsoon) influence is stronger, the average temperatures of the early spring – February–April for the SSA and March–April for the CSA – become significant for plant growth. Moreover, for coast site (CSA), which is relatively further north and closer to the coast, the correlation is approximately 2 times higher than for the site (SSA), which is southern and remote from the ocean. For the more continental site (NSA), the months of the previous season are significant, especially winter temperatures. One reason for this may be that low winter temperatures may lead to thicker snow cover, which melts far more slowly in spring (Zhu et al., 2009; Zhang et al., 2015). If the vegetation period of the plant cannot begin at the end of March due to prolonged melting of snow, plant growth may be reduced. Also, although cambial activity stops in the winter, organic components are still synthesized by photosynthesis. Low temperatures may induce a loss of accumulated materials, which adversely affects growth (Zhang et al., 2015).
4.2 Analysis of spring precipitation reconstructions
Differences in correlation between precipitation reconstructions for SSA, CSA and NSA could be explained by several factors. First, the months important for tree growth varied at all three sites, with the weakest correlation of NSA–SA coinciding with March–July being important for NSA and April–June being important for only SSA. Second, the weather pattern itself differed between sites. As numerous authors have noted (Kozhevnikova, 2009; Shamov, 2010; Shamov et al., 2014), the highly rugged relief and meridional location of the main mountain range leads to high variability in climate parameters, especially precipitations (Sohar et al., 2017), even at small distances within the region.
Notably, although after 1950 the general direction of long-term trends in precipitation change at all three sites tended not to coincide, the total fluctuation in the precipitation amount remained around the mean values. Smoother precipitation dynamics were registered after the 1950s for SSA and CSA and the 1960s for NSA, which generally coincide with the start of the active warming period in the region (Ukhvatkina et al., 2018; Mezentseva and Fedulov, 2017).
Most of the studies available from China, South Korea or Japan (Gao et al., 2013; Y. Liu et al., 2004; J. Liu et al., 2003; Chen et al., 2012, 2016; Sakashita et al., 2016) were aimed at precipitation reconstructions during the summertime monsoon period and rarely covered the spring-to-early-summer period. Thus, comparing our spring-to-early-summer precipitation reconstruction with the generally available summertime monsoon period (June to August) is not suitable as these two periods featured entirely different weather patterns (Mezentseva and Fedulov, 2017). The only available spring-to-early-summer precipitation reconstruction was carried out in the inland part of northeast Asia, in Inner Mongolia (Liu et al., 2004). The distance between our study area and that site is more than 2400 km (Fig. 1), and, in addition, Inner Mongolia's climate features a much higher degree of continentality (Liu et al., 2009). Thus, comparing our results with other available precipitation reconstruction(s) is not suitable. Therefore, it was deemed practically impossible to assess the reliability of our reconstructions based on a comparison with the reconstructions for adjacent areas. Hence, we decided to conduct only a qualitative analysis of the wet- and dry-period coincidences with other reconstructions.
We compared the data obtained with the identified wet/dry periods in terms of precipitation from the previous October to the subsequent September, which were studied by Chen et al. (2016) for the southern part of northeast China (Changbai Mountains, Qian Mountains) and the northern part of South Korea. Chen et al. (2016) identified several dry periods between 1833 and 1862, 1911 and 1925, and 1964 and 1987. The dry period of 1833 to 1862 (Chen et al., 2016) coincided with the period of 1841 to 1845 (SSA). According to numerous studies, this period coincided with the historical records on severe droughts during the 1840s in northeast China (Liu et al., 2010, 2009; Chen et al., 2016), Mongolia (Davi et al., 2006) and Korea (Jung et al., 2001; Y. Liu et al., 2003; Cook et al., 2010). The identified dry period of 1911 to 1925 (Chen et al., 2016) coincided with the period of 1918 to 1922 (NSA); also 1919 is a common dry year for all three reconstructions. The dry period of 1964 to 1987 (Chen et al., 2016), however, did not coincide with the data obtained in our work but was seen as a clear trend in SSA and NSA reconstructions. Critically, according to the state record data (Sheingauz, 2008), the dry year 2003, which is clearly identified in all three reconstructions, coincided with the peak in the number of springtime fires observed in the studied region.
For the wet periods, in the case of adjacent regions, the years identified were between 1863 and 1879, 1884 and 1898, and 1934 and 1963 (Chen et al., 2016). The first of these periods coincides with the wet period of 1862–1866 (SSA); the last of these periods coincides with the wet period of 1960–1964 (NSA). At the same time, the periods from 1869 to 1873 and from 1882 to 1886 were dry periods for NSA and SSA, respectively. Such non-coincidence of wet periods could be explained by the fact that the (spring-to-early-summer) season analyzed in our study did not coincide with the compared season, which included the season of the monsoon's maximum impact (last October to subsequent September). Furthermore, the compared regions were located in more inland areas, where the monsoon's effect during the spring-to-early-summer period was less obvious and overlapped with the impact of the continent (Gao et al., 2013; Y. Liu et al., 2004, 2003; Chen et al., 2012, 2016).
4.3 Links to global climate processes
A significant correlation between precipitation reconstructions for all three sites and PDSI showed the importance of moisture sufficiency for the growth of Korean pine, which was also confirmed by other studies (Yu et al., 2013; Wang et al., 2016). Simultaneously, the studied region had no reported general trend towards more severe droughts, which has been globally observed since the 1950s (Dai, 2011).
At the same time, we did not find significant correlations between our precipitation reconstructions and the SOI, NINO3, NINO4, NINO3.4, PDO and AO indices. In order to understand the reason for this, we tried to find correlations between these indices and instrumental measurements of precipitation for three different periods – from April to June (the first phase of the summer monsoon), from July to September (the second phase of the summer monsoon) and from April to September (entire summer monsoon period). We found significant correlations between the indices and precipitation; however, they appear only when we take into account the entire summer monsoon period and not its first or second phase separately (Table S2). In particular, we found significant (p<0.05) correlations between precipitation in Chuguyevka (SSA) and SOI, NINO3.4 and PDO indices (r=0.351, −0.399 and −0.331, respectively), precipitation in Mel'nichoye (CSA) (CSA) and the PDO index (), and precipitation in Krasnyy Yar (NSA) and the AO index (r=0.267).
The influence of ENSO appears only for the southernmost site. According to the instrumental data during the El Niño period in the southern part of the Russian Far East the winter monsoon became stronger, while the summer monsoon became weaker (Bishev et al., 2014). Weakening of the summer Far Eastern monsoon, which brings wet air and precipitation, led to a decrease in river water volume (Bishev et al., 2014; Ponomarev et al., 2015). The PDO influence appears for Chuguyevka (SSA) and Mel'nichoye (CSA). During the positive PDO phase, precipitation decreases as in the case of El Niño. For the northernmost site, only the influence of AO turned out to be significant. During the positive AO phase, moist air penetrates further north, and as a result, the amount of precipitation increases. Thus, despite the fact that the distance between the SSA and NSA sites is relatively small (about 330 km), the influence of ENSO in PDO along the gradient formed by these sites weakens, and for the northern site we found significant correlation only with AO. This is consistent with earlier results (Altman et al., 2018), where it was shown that in this region the influence of tropical cyclones decreases relatively rapidly northward.
Therefore, the oscillations influence the climate of sample sites within the region of study, but we cannot find correlations with the precipitation reconstructions, since the reconstruction period covers only part of the summer monsoon period. An indirect confirmation of this is the results of the wavelet analysis, which revealed cycles of about 3, 15 and 60 years. As it appears, a quasi-cyclic short-term frequency (about 3 years) may be associated with ENSO, which is a variability with a 2- to 2.5-year frequency coupled with a low-frequency component of 2.5 to 7 years (Allan et al., 1996; Bridgman and Oliver, 2006; Gaire et al., 2017). Cycles of about 15 and 60 years may reflect the influence of PDO variability, which has been found at 15–25- and 50–70-year cycles (Ma, 2007). These cycles are significant for SSA and marginally significant for CSA and NSA. Most likely, this insignificance of cycles is explained by the fact that reconstructions of precipitation for CSA and NSA are much shorter than reconstructions for SSA. These results will be more accurate when we collect additional data, and chronologies will be expanded. It should be noted, that in this study area, we can only use cores from living trees and discs of dead Pinus koraiensis trees for several reasons. First, due to high humidity in summer wood decomposes very quickly, so it is very difficult to find a well-preserved dead tree. Secondly, the old wooden buildings are completely absent. Finally, sub-fossil trees are extremely rare and are found only in one location within the study area not far from the NSA. Therefore, taking into account the maximum age of Pinus koraiensis trees and the rate of wood decomposition, we believe that the maximum length of chronologies can be about 600–700 years.
Thus, features of distribution and the amount of precipitation were likely to be determined by a combination of the impacts of various air currents, which caused frequent change and large differences in the precipitation amount on a year-to-year basis. Our results suggest that the main contribution to precipitation is still made by the impact of the Pacific Ocean. However, further research is needed to be able to fully understand the mechanisms behind the effect of large-scale oscillations on climate and tree growth.
The results of this study show that the radial growth of Korean pine is greatly limited by precipitation during the early and middle parts of the growing season in the Sikhote-Alin' area. Based on this, we first created three precipitation reconstructions for the southern (April to June), central (March to June) and northwestern (March to July) parts of the Sikhote-Alin' covering the past 412, 205 and 162 years, respectively. Our precipitation reconstruction records fill the knowledge gap in the existing reconstructions for northeast Asia and provide first evidence of past precipitation variability over large area of the Russian Far East. The wavelet analysis of the reconstruction identifies cycles possibly related to the processes influenced by the El Niño–Southern Oscillation and Pacific Decadal Oscillation. We also found that precipitation in different parts of the Sikhote-Alin' is to some extent influenced by different oscillations (ENSO and PDO for the southern part, PDO for the central part and AO for the northwestern part), which is probably one of the important reasons for the climate features of these parts. Our tree-ring chronologies also could be used by the PAGES Hydro2k consortium and/or to update the MADA PDSI data set developed by Cook et al. (2010).
We used the R package treeclim (https://CRAN.R-project.org/package=treeclim, last access: 26 April 2021; Zang and Biondi, 2015) to explore the temporal stability and reliability of the reconstructions. We also used three Python packages to perform a wavelet analysis: NumPy (https://github.com/numpy/numpy, last access: 26 April 2021; Harris et al., 2020), SciPy (https://github.com/scipy/scipy, last access: 26 April 2021; Peterson, 2009) and waipy (https://github.com/mabelcalim/waipy, last access: 26 April 2021; Calim, 2014).
All tree-ring chronologies presented in this paper are available at https://doi.org/10.5281/zenodo.4721910 (Ukhvatkina et al., 2021).
The supplement related to this article is available online at: https://doi.org/10.5194/cp-17-951-2021-supplement.
OU and AO designed the research; OU, AO and DK performed analyses; OU, AO and JA wrote the paper; OU, AO, AZ, TE and JA contributed to data collection.
The authors declare that they have no conflict of interest.
This work was supported by the Russian Foundation for Basic Research (grant numbers 18-04-00120, 18-04-00278). Jan Altman was supported by research grants 17-07378S and 20-05840Y of the Czech Science Foundation, MSM200051801 of the Czech Academy of Sciences, and long-term research development project RVO 67985939 of the Institute of Botany of the Czech Academy of Sciences.
This research has been supported by the Russian Foundation for Basic Research (grant nos. 18-04-00120 and 18-04-00278), the Czech Science Foundation (grant nos. 17-07378S and 20-05840Y), the Czech Academy of Sciences (grant no. MSM200051801), and the Institute of Botany of the Czech Academy of Sciences (grant no. RVO 67985939).
This paper was edited by Chantal Camenisch and reviewed by Matthew Therrell and three anonymous referees.
Alessio, S., Taricco, C., Rubinetti, S., Vivaldo, G., and Mancuso, S.: Temperature and precipitation in Northeast China during the last 150 years: relationship to large-scale climatic variability, Ann. Geophys., 32, 749–760, https://doi.org/10.5194/angeo-32-749-2014, 2014.
Allan, R., Lindesay, J., and Parker, D.: El Nino-Southern Oscillation and Climatic Variability, CSIRO Publishing, Collingwood, Australia, 1996.
Allan, R. J.: ENSO and climatic variability in the past 150 years, in: ENSO: Multiscale Variability and Global and Regional Impacts, edited by: Diaz, H. F. and Markgraf, V., Cambridge Univ. Press, New York, 3–55, 2000.
Allen, M. R. and Ingram, W. J.: Constraints on future changes in climate and the hydrologic cycle, Nature, 419, 224–232, 2002.
Altman, J., Ukhvatkina, O. N., Omelko, A. M., Macek, M., Plener, T., Pejcha, V., Cerny, T., Petrik, P., Srutek, M., Song, J.-S., Zhmerenetsky, A. A., Vozmishcheva, A. S., Krestov, P. V., Petrenko, T. Y., Treydte, K., and Dolezal, J.: Poleward migration of the destructive effects of tropical cyclones during the 20th century, P. Natl. Acad. Sci. USA, 115, 11543–11548, https://doi.org/10.1073/pnas.1808979115, 2018
Bishev, V. I., Neyman, V. G., Ponomarev, V. I., Romanov, Y. A., Serykh, I. V., and Tzurikova, T. V.: The role of global atmosphere oscillation in a climate anomaly formation in the Russian Far East, Doklady Academii Nauk, 458, 92–96, https://doi.org/10.7868/S0869565214250148, 2014.
Bridgman, H. A. and Oliver, J. E.: The Global Climate System: Patterns Processes and Teleconnections, Cambridge University Press, UK, 2006.
Calim, M.: WAIPY, wavelet analysis in Python, Researchgate, https://doi.org/10.13140/RG.2.2.29148.28804, 2014.
Chen, Z., Zhang, X., Cui, M., He, X., Ding, W., and Peng, J.: Tree-ring based precipitation reconstruction for the forest-steppe ecotone in Northern Inner, Mongolia, China and its linkages to the Pacific Ocean variability, Global Planet. Change, 86–87, 45–56, https://doi.org/10.1016/j.gloplacha.2012.01.009, 2012.
Chen, Z., He, X., Davi, N. K., and Zhang, X.: A 258-year reconstruction of precipitation for southern Northeast China and the northern Korean peninsula, Clim. Change, 139, 609–622, https://doi.org/10.1007/s10584-016-1796-9, 2016.
Cook, E. R.: A time series analysis approach to tree ring standardization, Dissertation, The University of Arizona, Tucson, 1985.
Cook, E. R. and Kairiukstis, L. A.: Methods of dendrochronology: applications in the environmental sciences, Springer Netherlands, Dordrecht, the Netherlands, 394 pp., https://doi.org/10.1007/978-94-015-7879-0, 1990.
Cook, E. R., Anchukaitis, K. J., Buckley, B. M., D'Arrigo, R. D., Jacoby, G. C., and Wright, W. E.: Asian monsoon failure and megadrought during the last millennium, Science, 328, 486–489, https://doi.org/10.1126/science.1185188, 2010.
Corona, C., Guiot, J., Edouard, J. L., Chalié, F., Büntgen, U., Nola, P., and Urbinati, C.: Millennium-long summer temperature variations in the European Alps as reconstructed from tree rings, Clim. Past, 6, 379–400, https://doi.org/10.5194/cp-6-379-2010, 2010.
Dai, A.: Characteristics and trends in various forms of the Palmer Drought Severity Index during 1900–2008, J. Geophys. Res.-Atmos., 116, D12115, https://doi.org/10.1029/2010JD015541, 2011.
Dai, A., Trenberth, K. E., and Karl, T. R.: Global variations in draughts and wet spells: 1900–1995, Geophys. Res. Lett., 25, 3367–3370, 1998.
Dai, A., Qian, T., Trenberth, K. E., and Milliman, J. D.: Changes in continental freshwater discharge from 1948 to 2004, J. Climate, 22, 2773–2792, https://doi.org/10.1175/2008JCLI2592.1, 2009.
Dai, A. G., Trenberth, K. E., and Qian, T.: A global dataset of Palmer Drought Severity Index for 1870–2002: relationship with soil moisture and effects of surface warming, J. Hydrometeorol., 5, 1117–1130, https://doi.org/10.1175/JHM-386.1, 2004.
Davi, N. K., Jacoby, G. C., Curtis, A. E., and Baatarbileg, N.: Extension of Drought Records for Central Asia Using Tree Rings: West-Central Mongolia, J. Climate, 19, 288–299, https://doi.org/10.1175/JCLI3621.1, 2006.
Ding, Y. H. and Chan, J. C.: The East Asian summer monsoon: an overview, Meteorol. Atmos. Phys., 89, 117–142, https://doi.org/10.1007/s00703-005-0125-z, 2005.
Dobrovolsky, S. G.: Global changes of river runoff, GEOS, Moscow, Russia, 660 pp., 2011 (in Russian).
Dracup, J. A., Lee, K. S., and Paulson Jr., E. G.: On the definition of droughts, Water Resour. Res., 16, 297–302, https://doi.org/10.1029/WR016i002p00297, 1980.
Fang, K., Gou, X., Chen, F., Yang, M., Li, J., He, M., Zhang, Y., Tian, Q., and Peng, J.: Drought variations in the eastern part of Northwest China over the past two centuries: evidence from tree rings, Clim. Res., 38, 129–135, https://doi.org/10.3354/cr00781, 2009.
Fang, K., Davi, N., Gou, X., Chen, F., Cook, E., and D'Arrigo, R.: Spatial drought reconstructions for central High Asia based on tree rings, Clim. Dynam., 35, 941–951, https://doi.org/10.1007/s00382-009-0739-9, 2010a.
Fang, K., Gou, X., Chen, F., D'Arrigo, R., and Li, J.: Tree-ring based drought reconstruction for the Guiqing Mountain (China): linkages to the Indian and Pacific Oceans, Int. J. Climatol., 30, 1137–1145, https://doi.org/10.1007/s11434-010-4215-z, 2010b.
Fritts, H. C.: Tree rings and climate, Academic Press Inc., London, 567 pp., 1976.
Gaire, N. P., Bhuju, D. R., Koirala, M., Shah, S. K., Carrer, M., and Timilsena, R.: Tree-ring based spring precipitation reconstruction in western Nepal Himalaya since AD 1840, Dendrochronologia, 42, 21–30, https://doi.org/10.1016/j.dendro.2016.12.004, 2017.
Gao, L. S., Wang, X. M., and Zhao, X. H.: Growth response of two coexisting species to climate change in broadleaved Korean pine forests in Changbai Mountain, north-eastern China, J. Beijing For. Univ., 35, 24–31, 2013.
Gao, S. Y., Lu, R. J., Qiang, M. R., Hasi, E., Zhang, D. S., Chen, Y., and Xia, H.: Reconstruction of precipitation in the last 140 years from tree ring at south margin of the Tengger Desert, China, Chin. Sci. Bull., 50, 2487–2492, 2005.
Gartsman, B. I.: Rain floods on the rivers in the south of the Far East: methods of calculations, forecasts, risk assessments, Dalnauka, Vladivostok, Russia, 223 pp., 2008 (in Russian).
Gedney, N., Cox, P. M., Betts, R. A., Boucher, O., Huntingford, C., and Stott, P. A.: Detection of a direct carbon dioxide effect in continental river runoff records, Nature, 439, 835–838, https://doi.org/10.1038/nature04504, 2006.
Harris, C. R., Millman, K. J., van der Walt, S. J., Gommers, R., Virtanen, P., Cournapeau, D., Wieser, E., Taylor, J., Berg, S., Smith, N. J., Kern, R., Picus, M., Hoyer, S., van Kerkwijk, M. H., Brett, M., Haldane, A., Fernández del Río, J., Wiebe, M., Peterson, P., Gérard-Marchant, P., Sheppard, K., Reddy, T., Weckesser, W., Abbasi, H., Gohlke, C., and Oliphant, T. E.: Array programming with NumPy, Nature, 585, 357–362, https://doi.org/10.1038/s41586-020-2649-2, 2020.
Holmes, R. L.: Computer-assisted quality control in tree-ring dating and measurement, Tree-Ring Bull., 43, 69–78, 1983.
Huang, R., Chen, J., Wang, L., and Lin, Z.: Characteristics, processes and causes of the spatio-temporal variabilities of the East Asian Monsoon system, Adv. Atmos. Sci., 29, 910–942, https://doi.org/10.1007/s00376-012-2015-x, 2012.
Huntington, T. G.: CO2-induced suppression of transpiration cannot explain increasing runoff, Hydrol. Process., 22, 311–314, https://doi.org/10.1002/hyp.6925, 2008.
Jacoby, G., Solomina, O., Frank, D., Eremenko, N., and D'Arrigo, R. D.: Kunashir (Kuriles) Oak 400-year reconstruction of the temperature and relation to the Pacific Decadal Oscillation, Palaeogeogr. Palaeocl., 2009, 303–311, https://doi.org/10.1016/j.palaeo.2004.02.015, 2004.
Janda, P., Ukhvatkina, O. N., Vozmishcheva, A. S., Omelko, A. M., Dolezal, J., Krestov, P. V., Zhmerenetsky, A. A., Song, J.-S., and Altman., J.: Tree canopy accession strategy changes along the latitudinal gradient of temperate Northeast Asia, Global Ecol. Biogeogr., 30, 738–748, https://doi.org/10.1111/geb.13259, 2021.
Jung, H.-S., Lim, G.-H., and Oh, J.-H.: Interpretation of the transient variations in the time series of precipitation amounts in Seoul, Korea. Part I: diurnal variation, J. Climate, 14, 2989–3004, https://doi.org/10.1175/1520-0442(2001)014<3C2989:IOTTVI>3E2.0.CO;2, 2001.
Khon, V. C. and Mokhov, I. I.: The hydrological regime of large river basins in Northern Eurasia in the XX-XXI centuries, Water Resour., 39, 1–10, 2012.
Körner, C. and Paulsen, J.: A world-wide study of high altitude treeline temperatures, J. Biogeogr., 31, 713–732, https://doi.org/10.1111/j.1365-2699.2003.01043.x, 2004.
Kozhevnikova, N. K.: Dynamics of weather and climatic characteristics and ecological functions of a small forest basin, Contemp. Probl. Ecol., 5, 93–703, https://doi.org/10.1134/S1995425509050087, 2009.
Kress, A., Hangartner, S., Bugmann, H., Büntgen, U., Frank, D. C., Leuenberger, M., Siegwolf, R. T. W., and Saurer, M.: Swiss tree rings reveal warm and wet summers during medieval times, Geophys. Res. Lett., 41, 1732–1737, https://doi.org/10.1002/2013GL059081, 2014.
Li, J., Gou, X., Cook, E. R., and Chen, F.: Tree-ring based drought reconstruction for the central Tien Shan area in northwest China, Geophys. Res. Lett., 33, L07715, https://doi.org/10.1029/2006GL025803, 2006.
Li, J., Cook, E. R., Chen, F., Davi, N., D'Arrigo, R., Gou, X., Wright, W. E., Fang, K., Jin, L., Shi, J., and Yang, T.: Summer monsoon moisture variability over China and Mongolia during the past four centuries, Geophys. Res. Lett., 36, L22705, https://doi.org/10.1029/2009GL041162, 2009a.
Li, J., Cook, E. R., D'arrigo, R., Chen, F., and Gou, X.: Moisture variability across China and Mongolia: 1951–2005, Clim. Dynam., 32, 1173–1186, https://doi.org/10.1007/s00382-008-0436-0, 2009b.
Li, J. B., Chen, F. H., Cook, E. R., Gou, X. H., and Zhang, Y. X.: Drought reconstruction for north central China from tree rings: the value of the Palmer drought severity index, Int. J. Climatol., 27, 903–909, https://doi.org/10.1002/joc.1450, 2007.
Li, Q., Liu, Q., Song, H., Cai, O., and Yang, Y.: Long-term variation of temperature over North China and its links with large-scale atmospheric circulation, Quaternary Int., 283, 11–20, https://doi.org/10.1016/j.quaint.2012.03.017, 2013.
Li, Z., Bhatt, U. S., and Mölders, N.: Impact of doubled CO2 on the interaction between the global and regional water cycles in four study regions, Clim. Dynam., 30, 255–275, https://doi.org/10.1002/joc.1666, 2008.
Liang, E. Y., Shao, X. M., Liu, H. Y., and Eckstein, D.: Tree-ring based PDSI reconstruction since AD 1842 in the Ortindag Sand Land, east Inner Mongolia, Chin. Sci. Bull., 52, 2715–2721, 2007.
Lisogurskiy, N. I. and Petrichev, A. Z.: Monsoon distribution over East Asia and degree of its stability, Meteorologiya i gidrologiya, 5, 54–59, 1980 (in Russian).
Liu, J., Hayakawa, N., Lu, M., Dong, S., and Yuan, J.: Hydrological and geocryological response of winter streamflow to climate warming in Northeast China, Cold Reg. Sci. Technol., 37, 15–24, 2003.
Liu, Y., Park, W.-K., Cai, Q., Seo, J.-W., and Sook, J.-H.: Monsoonal precipitation variation in the East Asia since A.D. 1840-tree-ring evidences from China and Korea, Sci. China, Ser. D, 46, 1031–1039, 2003.
Liu, Y., Shi, J. F., Shishov, V., Vaganov, E., Yang, Y. K., Cai, Q. F., Sun, J. Y., and Wang, L.: Reconstruction of May–July precipitation in the north Helan Mountain, Inner Mongolia since A.D. 1726 from tree-ring late-wood widths, Chin. Sci. Bull., 49, 405–409, 2004.
Liu, Y., Bao, G., Song, H., Cai, Q., and Sun, J.: Precipitation reconstruction from Hailar pine (Pinus sylvestris var. mongolica) tree rings in the Hailar region, Inner Mongolia, China back to 1865 AD, Palaeogeogr. Palaeocl., 282, 81–87, https://doi.org/10.1016/j.palaeo.2009.08.012, 2009.
Liu, Y., Tian, H., Song, H., and Liang, J.: Tree ring precipitation reconstruction in the Chifeng-Weichang region, China, and east Asian summer monsoon variation since a.d. 1777, J. Geophys. Res., 115, 1–9, https://doi.org/10.1029/2009JD012330, 2010.
Liu, Y., Sun, B., Song, Lei Y., and Wang, S.: Tree-ring-based precipitation reconstruction for Mt. Xinglong, China, since AD 1679, Quaternary Int., 283, 46–54, https://doi.org/10.1016/j.quaint.2012.03.045, 2013.
Lyu, S., Li, Z., Zhang, Y., and Wang, X.: A 414-year tree-ring-based April–July minimum temperature reconstruction and its implications for the extreme climate events, northeast China, Clim. Past, 12, 1879–1888, https://doi.org/10.5194/cp-12-1879-2016, 2016.
Ma, Z.: The interdecadal trend and shift of dry/wet over the central part of North China and their relationship to the Pacific Decadal Oscillation (PDO), Chin. Sci. Bull., 52, 2130–2139, 2007.
Mantua, N. and Hare, S.: The Pacific decadal oscillation, J. Oceanogr., 58, 35–44, https://doi.org/10.1023/A:1015820616384, 2002.
Mezentseva, L. I. and Fedulov, A. S.: Climate trends of the atmospheric circulation in the Far East region (Russia), Izvestia KGTU, 46, 1–9, 2017 (in Russian).
Milly, P. C. D., Wetherald, R. T., Dunne, K. A., and Delworth, T. L.: Increasing risk of great floods in a changing climate, Nature, 415, 514–517, https://doi.org/10.1038/415514a, 2002.
Omelko, A. M., Ukhvatkina, O. N., Zhmerenetsky, A. A., Sibirina L. A., Petrenko T. Y., and Bobrovsky, M.: From young to adult trees: How spatial patterns of plants with different life strategies change during age development in an old-growth Korean pine-broadleaved forest, For. Ecol. Manag., 411, 44–46, https://doi.org/10.1016/j.foreco.2018.01.023, 2018.
Palmer, W. C.: Meteorological Drought, Research Paper No. 45, US Department of Commerce, Washington D.C., 58 pp., 1965.
Peterson, P.: F2PY: a tool for connecting Fortran and Python programs, Int. J. Comput. Sci. Eng., 4, 296–305, https://doi.org/10.1504/IJCSE.2009.029165, 2009.
Ponomarev, V. I., Dmitrieva, E. V., and Shkorba, S. P.: Features of climate regimes in the North Asian Pacific, J. Systems of Environment Control, 1, 67–72, 2015 (in Russian).
Popa, I. and Bouriaud, O.: Reconstruction of summer temperatures in Eastern Carpathian Mountain (Rodna Mts, Romania) back to AD 1460 from tree-rings, Int. J. Climatol., 34, 871–880, https://doi.org/10.1002/joc.3730, 2014.
Porter, T. J., Pisaric, M. F. J., Kokelj, S. V., and deMontigny, P.: A ring-width-based reconstruction of June-July minimum temperatures since AD 1245 from white spruce stands in the Mackenzie Delta region, northwestern Canada, Quaternary Res., 80, 167–179, https://doi.org/10.1016/j.yqres.2013.05.004, 2013.
R Core Team: R: A language and environment for statistical computing, R Foundation for Statistical Computing, Vienna, Austria, available at: https://www.R-project.org/ (last access: 26 April 2021), 2019.
Sakashita, W., Yokoyama, Y., Miyahara, H., Yamaguchi, Y. T., Aze, T., Obrochta, S. P., and Natakatsuka, T.: Relationship between early summer precipitation in Japan and the El Nino-Southern and Pacific Decadal Oscillations over the past 400 years, Quaternary Int., 398, 300–306, https://doi.org/10.1016/j.quaint.2015.05.054, 2016.
Shamov, V. V.: Large-scale climate change-induced hydrological processes: evidences and consequences, Izvestiya Irkutskogo gosudarstvennogo universiteta, 3, 183–193, 2010 (in Russian).
Shamov, V. V., Gartsman, B. I., Gubareva, T. S., and Makagonova, M. A.: Studies of the hydrological consequences of modern climate change in the Far Eastern region of Russia, Vestnik DVO RAN, 2, 15–23, 2014 (in Russian).
Sheingauz, A. S. (Ed.): Forest complex of the Russian Far East: analytical review, 2nd ed., RIOTIP, Khabarovsk, Russia, 192 pp., 2008 (in Russian).
Sohar, K., Altman, J., Leheckova, E., and Dolezal, J.: Growth–climate relationships of Himalayan conifers along elevational and latitudinal gradients, Int. J. Climatol., 37, 2593–2605, https://doi.org/10.1002/joc.4867, 2017.
Sorochan, O. G.: Some features of the monsoon circulation over the East Asia, Tr. GGO, 70, 92–108, 1957 (in Russian).
Tao, F., Yokozawa, M., Zhang, Z., Hayashi, Y., Grassl, H., and Fu, C. B.: Variability in climatology and agricultural production in China in association with the East Asian summer monsoon and El Niño Southern Oscillation, Clim. Res., 28, 23–30, https://doi.org/10.3354/cr028023, 2004.
Torrence, C. and Compo, G.: A practical guide to wavelet analysis, B. Am. Meteorol. Soc., 79, 61–78, https://doi.org/10.1175/1520-0477(1998)079<0061:APGTWA>2.0.CO;2, 1998.
Ukhvatkina, O. N., Omelko, A. M., Zhmerenetsky, A. A., and Petrenko, T. Y.: Autumn–winter minimum temperature changes in the southern Sikhote-Alin mountain range of northeastern Asia since 1529 AD, Clim. Past, 14, 57–71, https://doi.org/10.5194/cp-14-57-2018, 2018.
Ukhvatkina, O., Omelko, A., Zhmerenetsky, A., and Altman, J.: Residual chronologies (Russian Far East – Sikhote-Alin) (Version 1.0) [Data set]. Climate of the Past, Zenodo, https://doi.org/10.5281/zenodo.4721910, 2021.
Vorosmarty, C. J., McIntyre, P. B., Gessner, M. O., Dudgeon, D., Prusevich, A., Green, P., Glidden, S., Bunn, S. E., Sullivan, C. A., Liermann, C. R., and Davies, P. M.: Global threats to human water security and river biodiversity, Nature, 467, 555–561, https://doi.org/10.1038/nature09549, 2010.
Wang, X., Zhang, M., Ji, Y., Li, Z., Li, M., and Zhang, Y.: Temperature signals in tree-ring width and divergent growth of Korean pine response to recent climate warming in northeast Asia, Trees, 31, 415–427, https://doi.org/10.1007/s00468-015-1341-x, 2016.
Wigley, T. M. L., Briffa, K. R., and Jones, P. D.: On the average value of correlated time series, with applications in dendroclimatology and hydrometeorology, J. Clim. Appl. Meteorol., 23, 201–213, https://doi.org/10.1175/1520-0450(1984)023<0201:OTAVOC>2.0.CO;2, 1984.
Wiles, G. C., Solomina, O., D'Arrigo, R., Anchukaitis, K. J., Gensiarovsky, Y. V., and Wiesenberg, N.: Reconstructed summer temperatures over the last 400 year a based on larch ring widths: Sakhalin Island, Russian Far East, Clim. Dynam., 45, 397–405, https://doi.org/10.1007/s00382-014-2209-2, 2014.
Wilks, D. S.: Statistical Methods in the Atmospheric Sciences, Academic Press, San Diego, United States, 467 pp., 1995.
Wilson, R. J. S. and Luckman, B. H.: Tree-ring reconstruction of maximum and minimum temperatures and the diurnal temperature range in British Columbia, Canada, Dendrochronologia, 20, 1–12, https://doi.org/10.1078/1125-7865-00023, 2002.
Yang, F. L., Kumar, A., Schlesinger, M. E., and Wang, W. Q.: Intensity of hydrological cycles in warmer climates, J. Climate, 16, 2419–2423, https://doi.org/10.1175/2779.1, 2003.
Yin, H., Liu, H., Linderholm, H. W., and Sun, Y.: Tree ring density-based warm-season temperature reconstruction since AD 1610 in the eastern Tibetan Plateau, Palaeogeogr. Palaeoecl., 426, 112–120, https://doi.org/10.1016/j.palaeo.2015.03.003, 2015.
Yu, D., Liu, J., Benard J. L., Zhou, L., Zhou, W., Fang, X., Wei, Y., Jiang, S., and Dai, L.: Spatial variation and temporal instability in the climate-growth relationship of Korean pine in the Changbai Mountain region of Northeast China, Forest Ecol. Manag, 300, 96–105, https://doi.org/10.1016/j.foreco.2012.06.032, 2013.
Zang, C. and Biondi, F.: Treeclim: an R package for the numerical calibration of proxy-climate relationships, Ecography, 38, 001–006, https://doi.org/10.1111/ecog.01335, 2015.
Zhang, R. B., Yuan, Y. J., Wei, W. S., Gou, X. H., Yu, S. L., Shang, H. M., Chen, F., Zhang, T. W., and Qin, L.: Dendroclimatic reconstruction of autumn-winter mean minimum temperature in the eastern Tibetan Plateau since 1600 AD, Dendrochronologia, 33, 1–7, https://doi.org/10.1016/j.dendro.2014.09.001, 2015.
Zhu, H. F., Fang, X. Q., Shao, X. M., and Yin, Z. Y.: Tree ring-based February–April temperature reconstruction for Changbai Mountain in Northeast China and its implication for East Asian winter monsoon, Clim. Past, 5, 661–666, https://doi.org/10.5194/cp-5-661-2009, 2009.