


1. Introduction
Longevity risk stems from the fact that people are uncertain about how long they will live. Such uncertainty makes it difficult for individuals to plan how to draw down one's retirement assets so as to not run out of money in old age, in which case they may be forced to substantially reduce their living standards. Life annuities offer retirees one way to insure against longevity risk. In exchange for an up-front premium, a life annuity provides a periodic (e.g., monthly) payment stream for as long as the insured individual is alive. Although annuities are a theoretically appealing way to manage longevity risk, few consumers purchase them at retirement.Footnote 1 Adverse selection has been suggested as a potential explanation for the limited size of voluntary annuity markets in the USA, UK, Chile, Australia, Canada, Netherlands, and Singapore (Mitchell et al., Reference Mitchell, Poterba, Warshawsky and Brown1999; James and Song, Reference James and Song2001; Finkelstein and Poterba, Reference Finkelstein and Poterba2002; Cannon and Tonks, Reference Cannon and Tonks2004; Reference Cannon and Tonks2010; Thorburn et al., Reference Thorburn, Rocha and Morales2007; Kaschützke and Maurer, Reference Kaschützke, Maurer, Mitchell, Piggott and Takayama2010; Fong et al., Reference Fong, Mitchell and Koh2011; Cannon et al., Reference Cannon, Stevens and Tonks2015). This arises because the typical annuitant is longer-lived than the typical individual in the population. As life annuities are priced to reflect the longevity of annuitants, adverse selection makes annuities appear ‘expensive’ for a typical individual in the population.
Yet, in compulsory annuity markets, the role of adverse selection is potentially small or even non-existent. Mandatory annuitization, assuming sufficiently large risk pools are formed, can eliminate adverse selection. In particular, Cannon and Tonks (Reference Cannon and Tonks2016) found suggestive empirical evidence of a small role for adverse selection in the UK compulsory annuity market. By contrast, cohort (or aggregate) mortality risk played a critical and larger role in explaining much of the observed variations in annuity values. The authors quantified the importance of cohort mortality risk using the Lee and Carter (Reference Lee and Carter1992) model and then assessed its consequences on the money's worth (MW) distribution of annuity values. In relation, recent theoretical study by Andersen and Gestsson (Reference Andersen and Gestsson2021) showed that aggregate mortality risk affects the scope for annuitization in that agents do not fully annuitize their savings in an overlapping generations setting, which underscores the role of aggregate mortality risk in annuity markets.
In this paper, we examine the impact of uncertainties in the future trends of mortality on annuity values in Singapore's compulsory purchase market in 2017. We begin by comparing the trends of mortality improvements in Singapore against those of peer countries, and then obtain mortality forecasts for the resident population using the Lee-Carter family of models. Monte-Carlo simulations are performed to derive a range of high- and low-systematic longevity risk scenarios, and the resulting impact of these projections on the annuity values for different annuity products is evaluated using the conventional MW framework. Finally, we test the sensitivity of the computation results to alternative mortality forecasting models and also implement a stress-test to determine robustness. The stress-test is based on a modification of the base mortality forecasting model to allow for future structural changes in longevity (or conversely, mortality).
The mandatory annuity market in Singapore presents an appealing setting for studying the impact of aggregate longevity risk on annuity values. First, Singaporeans enjoy one of the highest life expectancies in the world. Between 2008 and 2018, total life expectancy at birth of the resident population increased from 80.9 to 83.2 years (SDOS, 2019). The median age of residents rose from 36.7 to 40.8 years over the same period. It is forecasted that average lifespan will increase further to 85.4 years by 2040 and that Singaporeans will have the third-longest lifespans in the world (Foreman et al., Reference Foreman, Marquez, Dolgert, Fukutaki, Fullman, McGaughey, Pletcher, Smith, Tang, Yuan and Brown2018).Footnote 2 Sustained increases in life expectancies imply that the annuity providers will face considerable uncertainty in terms of predicting cohort mortality over a fairly long duration. Aggregate longevity risk, defined as the mis-estimation of future trends in mortality, is also especially pertinent to this population.
Second, Singapore is the first country in the Asia Pacific region to mandate annuitization in its national pension system as a policy response to managing longevity risk. The Singaporean pension system is called the Central Provident Fund (CPF) which was set up in the 1950s. It is a fully funded defined-contribution (DC) system based on individual accounts. Both employers and workers make monthly contributions to the system. CPF members may invest their pension savings in a default CPF which yields risk-free returns of about 2.5–4% per annum, as well as in a variety of commercial financial instruments such as stocks and bonds (Fong, Reference Fong2020). The CPF Board, as the administrator, enforces the withdrawal rules. In particular, it has established a concept of minimum retirement sum that requires participants to set aside a specific amount of monies (e.g., S$166,000 in 2017) before any excess accumulations can be withdrawn as a lump sum at age 55. This minimum retirement sum is preserved to age 65 (being invested in the default CPF) before drawdowns are permitted. In common with other DC schemes elsewhere, phased withdrawal was traditionally the default decumulation option in CPF and the minimum retirement sum was paid out over about 20 years (or until the balance was exhausted). Nonetheless, this framework exposed participants to significant longevity risk.
In 2009, the government introduced a pilot annuity scheme under CPF's auspices on a voluntary basis. This scheme allowed CPF members who turned age 55 to choose between the default phased withdrawal option or use part of their savings to purchase a life annuity. Four years later in 2013, compulsory annuitization for a portion of retirement savings was implemented for all CPF members. In other words, the drawdown modality was changed to annuitization (details are provided in Section 3). This was around the same time that UK decided to repeal its mandatory minimum annuity laws for DC pension schemes in 2014 (Hurwitz et al., Reference Hurwitz, Sade and Winter2020). Accordingly, Singapore's policy experience in calibrating its national longevity risk scheme is of relevance to neighboring economies in the region, many which are also aging rapidly and possibly keen to deploy annuitization in DC-type pension systems.
Our study also contributes to the rich, extant MW literature on annuity pricing. Since the introduction of the MW framework by Friedman and Warshawsky (Reference Friedman, Warshawsky, Bodie, Shoven and Wise1988) and Mitchell et al. (Reference Mitchell, Poterba, Warshawsky and Brown1999), it has been used to assess the annuity markets in various countries. The MW metric, defined as the ratio of the expected value of annuity payments to the premium paid, measures the value of life annuities to a prospective retiree. Nonetheless, with few exceptions, most empirical studies have calculated MW based on a deterministic projection of mortality. This means that only the average sex-specific survival probability (either for the general or insured population) is used to derive the expected value of annuity payments, resulting in a single MW ratio (MWR) for a single product. In the Singaporean context, for instance, Fong et al. (Reference Fong, Mitchell and Koh2011) evaluated four different products in the 2009 pilot CPF annuity scheme and reported MWRs of 1.24, 1.25, 1.29, and 1.31 for males. By embedding a stochastic mortality model within the annuity valuation framework in this present paper, we are able to derive the distribution of MWRs for each product so as to evaluate the confidence intervals of the MWRs, in addition to the mean.
The focus in this paper, thus, is whether the Singaporean annuities deliver a fair value for money and the consequences of systematic longevity risk on the actuarial value of these products. We do not evaluate the insurance value of annuitization for representative life cycle consumers (e.g., Kotlikoff and Spivak, Reference Kotlikoff and Spivak1981; Mitchell et al., Reference Mitchell, Poterba, Warshawsky and Brown1999; Brown et al., Reference Brown, Mitchell, Poterba and Warshawsky2001; Davidoff, Brown, and Diamond, Reference Davidoff, Brown and Diamond2005) nor examine the potential redistribution between groups with differential mortality in the CPF annuity system, as these aspects are beyond the scope of this current paper. Note also that in a mandatory risk pool, there is minimal concern regarding idiosyncratic mortality risks as they are supposed to be diversified away.
The remainder of the paper is structured as follows. Section 2 examines general trends in mortality rates in Singapore. We implement a stochastic mortality model and demonstrate that mortality improvements in the resident population have been steady and persistent over the past few decades, thus characterizing the importance of longevity risk for this population. Section 3 introduces the CPF annuity scheme and outlines the main design features of the deferred life annuity products. Section 4 outlines the MW valuation methodology and the various data inputs required, drawing on the two prior sections. Section 5 presents the stochastic MW results and explores extensions and sensitivity analysis. The final section concludes with a discussion of policy implications and areas for future research.
2. Mortality trends in Singapore
2.1 Mortality improvements in aging Asian economies
Asia-Pacific is the fastest aging region in the world. By 2050, one in four people in the region will be 60 years old or older, whereas those 80 years or older will constitute about one-fifth of all older persons (United Nations, 2019). Economies that are most rapidly aging include Singapore, Hong Kong (SAR), South Korea, and Taiwan. Figure 1 compares the mortality rates of resident populations in these four economies from 1980 to 2017. Death rates are plotted for different age groups (ages 50–59, 60–69, 70–79, and 80+), and separately for males and females. The solid black lines in the plots reveal that Singapore has one of the highest rates of mortality improvements among its peers. We see that in the 1980s and early 1990s, Taiwan and Singapore have relatively comparable death rates. By the mid-1990s, however, Singapore's mortality levels have notably dropped below those of the former. Mortality decline in Singapore continued at a staggering pace over the next two decades. By around 2010, death rates of the resident Singapore population have declined to levels that are almost alike those of Hong Kong, which has the lowest mortality levels among the four economies since the mid-1980s.
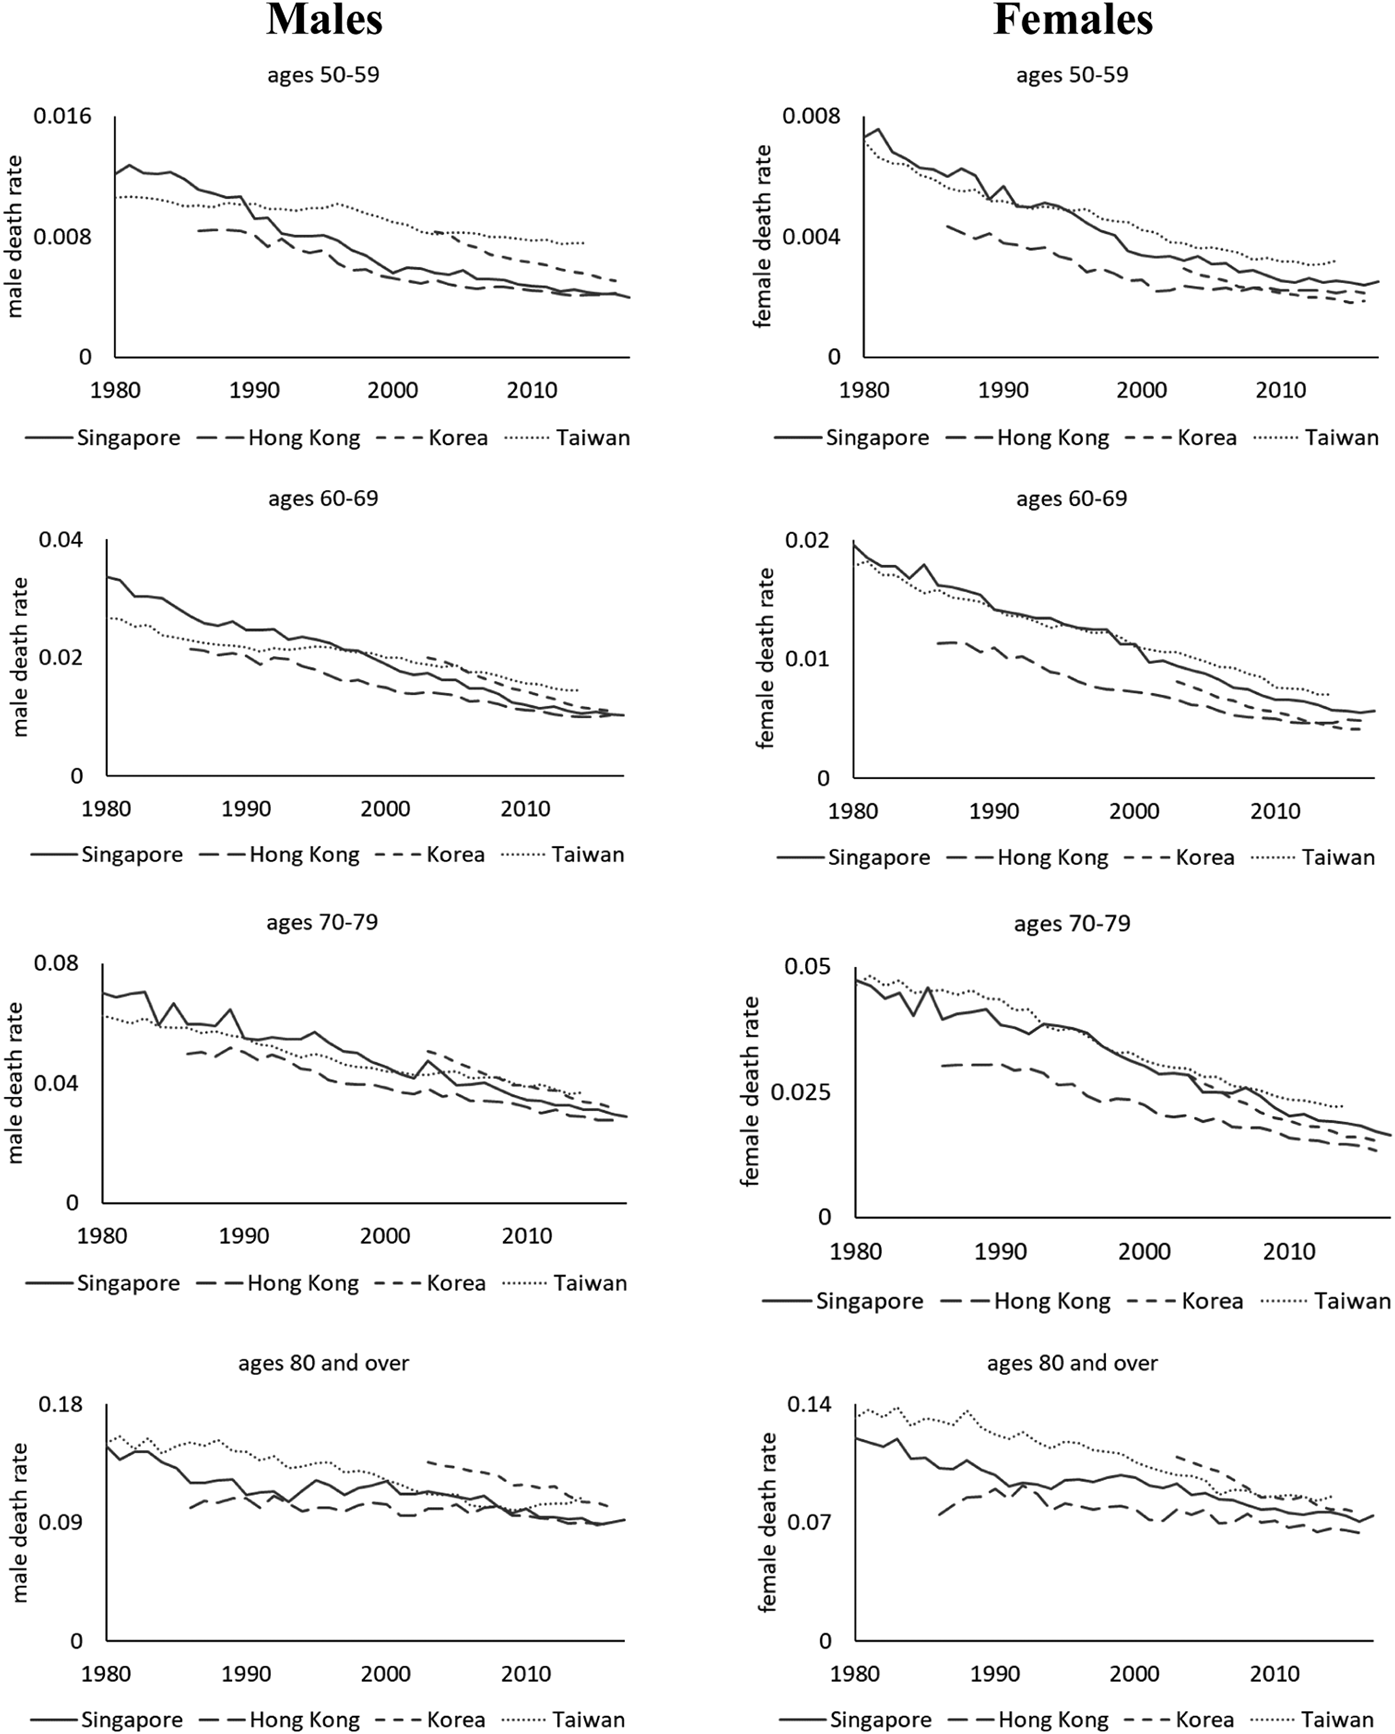
Figure 1. Observed death rates of Hong Kong, South Korea, Singapore, and Taiwan from 1980 to 2017. Source: Authors' calculations derived from Human Mortality Database, Singapore Department of Statistics, and Census and Statistics Department of Hong Kong. Notes: For Singapore, annual mortality rates for 5-year abridged age groups are obtained from the Department of Statistics for 1980–2017 (SDOS, 2018). Death rates pertain only to the resident population (i.e., Singapore citizens and permanent residents). Mortality data for Hong Kong data are sourced from the Census and Statistics Department of Hong Kong (2017). Annual mortality data for South Korea and Taiwan are obtained from the Human Mortality Database (HMD, 2019).
In addition, mortality improvements in Singapore have been strong and persistent over the past four decades. Between 1980 and 2000, the observed annual rates of mortality decline were 3.8%, 2.9%, 2.1%, and 1.0%, respectively, for males ages 50–59, 60–69, 70–79, and 80+. Notably, the pace of mortality improvements has slowed somewhat for those aged 50–59; their death rates declined at about 2.6% per annum between 2001 and 2017. In contrast, the pace of mortality improvements has increased for those ages 60+ over time. Between 2001 and 2017, annual rates of decline were 3.4%, 2.5%, and 1.2%, respectively, for males ages 60–69, 70–79, and 80+. Similar patterns are observed for females. The higher rates of mortality improvement among older-old Singaporeans (as compared to previous decades) are worrisome from a longevity risk management standpoint. It implies that average life expectancy at older ages may continue to rise to new levels, and longevity risk would become more prominent going forward.Footnote 3
2.2 Stochastic mortality modeling
In the actuarial and demographic literature, several methods of stochastic mortality modeling have been proposed to allow researchers to capture the mortality trends of a population. One of the most widely-known approaches is the method proposed by Lee and Carter (Reference Lee and Carter1992), which demonstrated that the essential features of the mortality profile of a population over time can be described by an age-specific intercept plus a common trend for all age groups multiplied by an age-specific coefficient. Building on this study, various extensions have been proposed to improve the modeling procedure and forecasting performance (see, e.g., Li and Lee, Reference Li and Lee2005; Renshaw and Haberman, Reference Renshaw and Haberman2006; Cairns et al., Reference Cairns, Blake, Dowd, Coughlan, Epstein, Ong and Balevich2009; Li, Reference Li2013). The choice of a suitable model for forecasting survival probabilities for the resident population in Singapore is an important one. Given that the average life expectancy of Singaporeans has risen significantly in the past several decades, it is critical to adopt a statistical model that can accurately and robustly predict the longevity gains.
In this present analysis, we implement the augmented common factor Lee-Carter model based on Li and Lee (Reference Li and Lee2005). This is an extended version of the Lee and Carter (Reference Lee and Carter1992) mortality model, and has been widely applied in multi-population mortality forecasting. A key strength of the model is that it defines a common mortality index that represented the shared period effect for all populations (or subpopulations) considered, and additional factors to account for short-term deviations from the main trend for each population (or subpopulation). Li (Reference Li2013) applied the augmented common factor model to Australian population data and showed that it produces coherent mortality forecasts between males and females. This is because the time-series processes for the additional factors are chosen in such a way that the projected male-to-female ratio of death rates at each age converges to a constant over time.
Formally, let m(x, t, i) be the central death rate at age x in year t of sex i. The Li and Lee (Reference Li and Lee2005) model is specified as:

where a(x, i) is the general mortality schedule over age, K(t) is the common mortality index over time with age-sensitivity B(x), and k(t, i) is the time-varying component of the additional factor with age-sensitivity b(x, i). Note that B(x) and K(t) are common parameters for both sexes being modeled, while the other parameters are specific to either sex. Following Li (Reference Li2013), we assume that the number of deaths follows the (over-dispersed) Poisson distribution and allow for more than one additional sex-specific factor.
2.3 Singapore's mortality improvements over time
Mortality data for the Singaporean resident population are sourced from the Singapore Department of Statistics (SDOS, 2018). Specifically, we use 1980–2017 abridged period life tables which specify sex-specific crude central death rates data in 5-year age groups, i.e., ages 0–4, 5–9, 10–14, and so on. The oldest observed age group is age 85 and over. Total exposure was 1.16 million (1.12 million) for males (females) in 1980 and this increased to 1.94 million and 2.02 million respectively in 2017. This dataset covers the entire resident Singaporean population, including citizens and permanent residents. Official mortality improvement tables are unavailable. To model and construct projected survival probabilities, we first fit the augmented common factor Lee-Carter model to the population data and then employ the estimated parameters from the fitted model to project sex-specific survival probabilities into the future using time-series processes.
Figure 2 shows the estimated parameters of the augmented common factor Lee-Carter model fitted to the 1980–2017 Singaporean mortality data. Importantly, we observe that the common mortality index K(t) exhibits a linearly decreasing trend over the last four decades. K(t) represents the shared period effect for both males and females in the resident population. The linear decline is not an inherent feature of the index, so that the fact that K(t) declines about linearly in Singapore's population for the past four decades is striking. In addition, the index declines at about the same pace during the first half of the period (1980–99) as it does during the second half (2000–17). Overall, this model fitting confirms our earlier observation from Figure 1 that Singapore's historical trends in mortality improvements have been steady and persistent, and also characterizes the nature of longevity risk for this population.
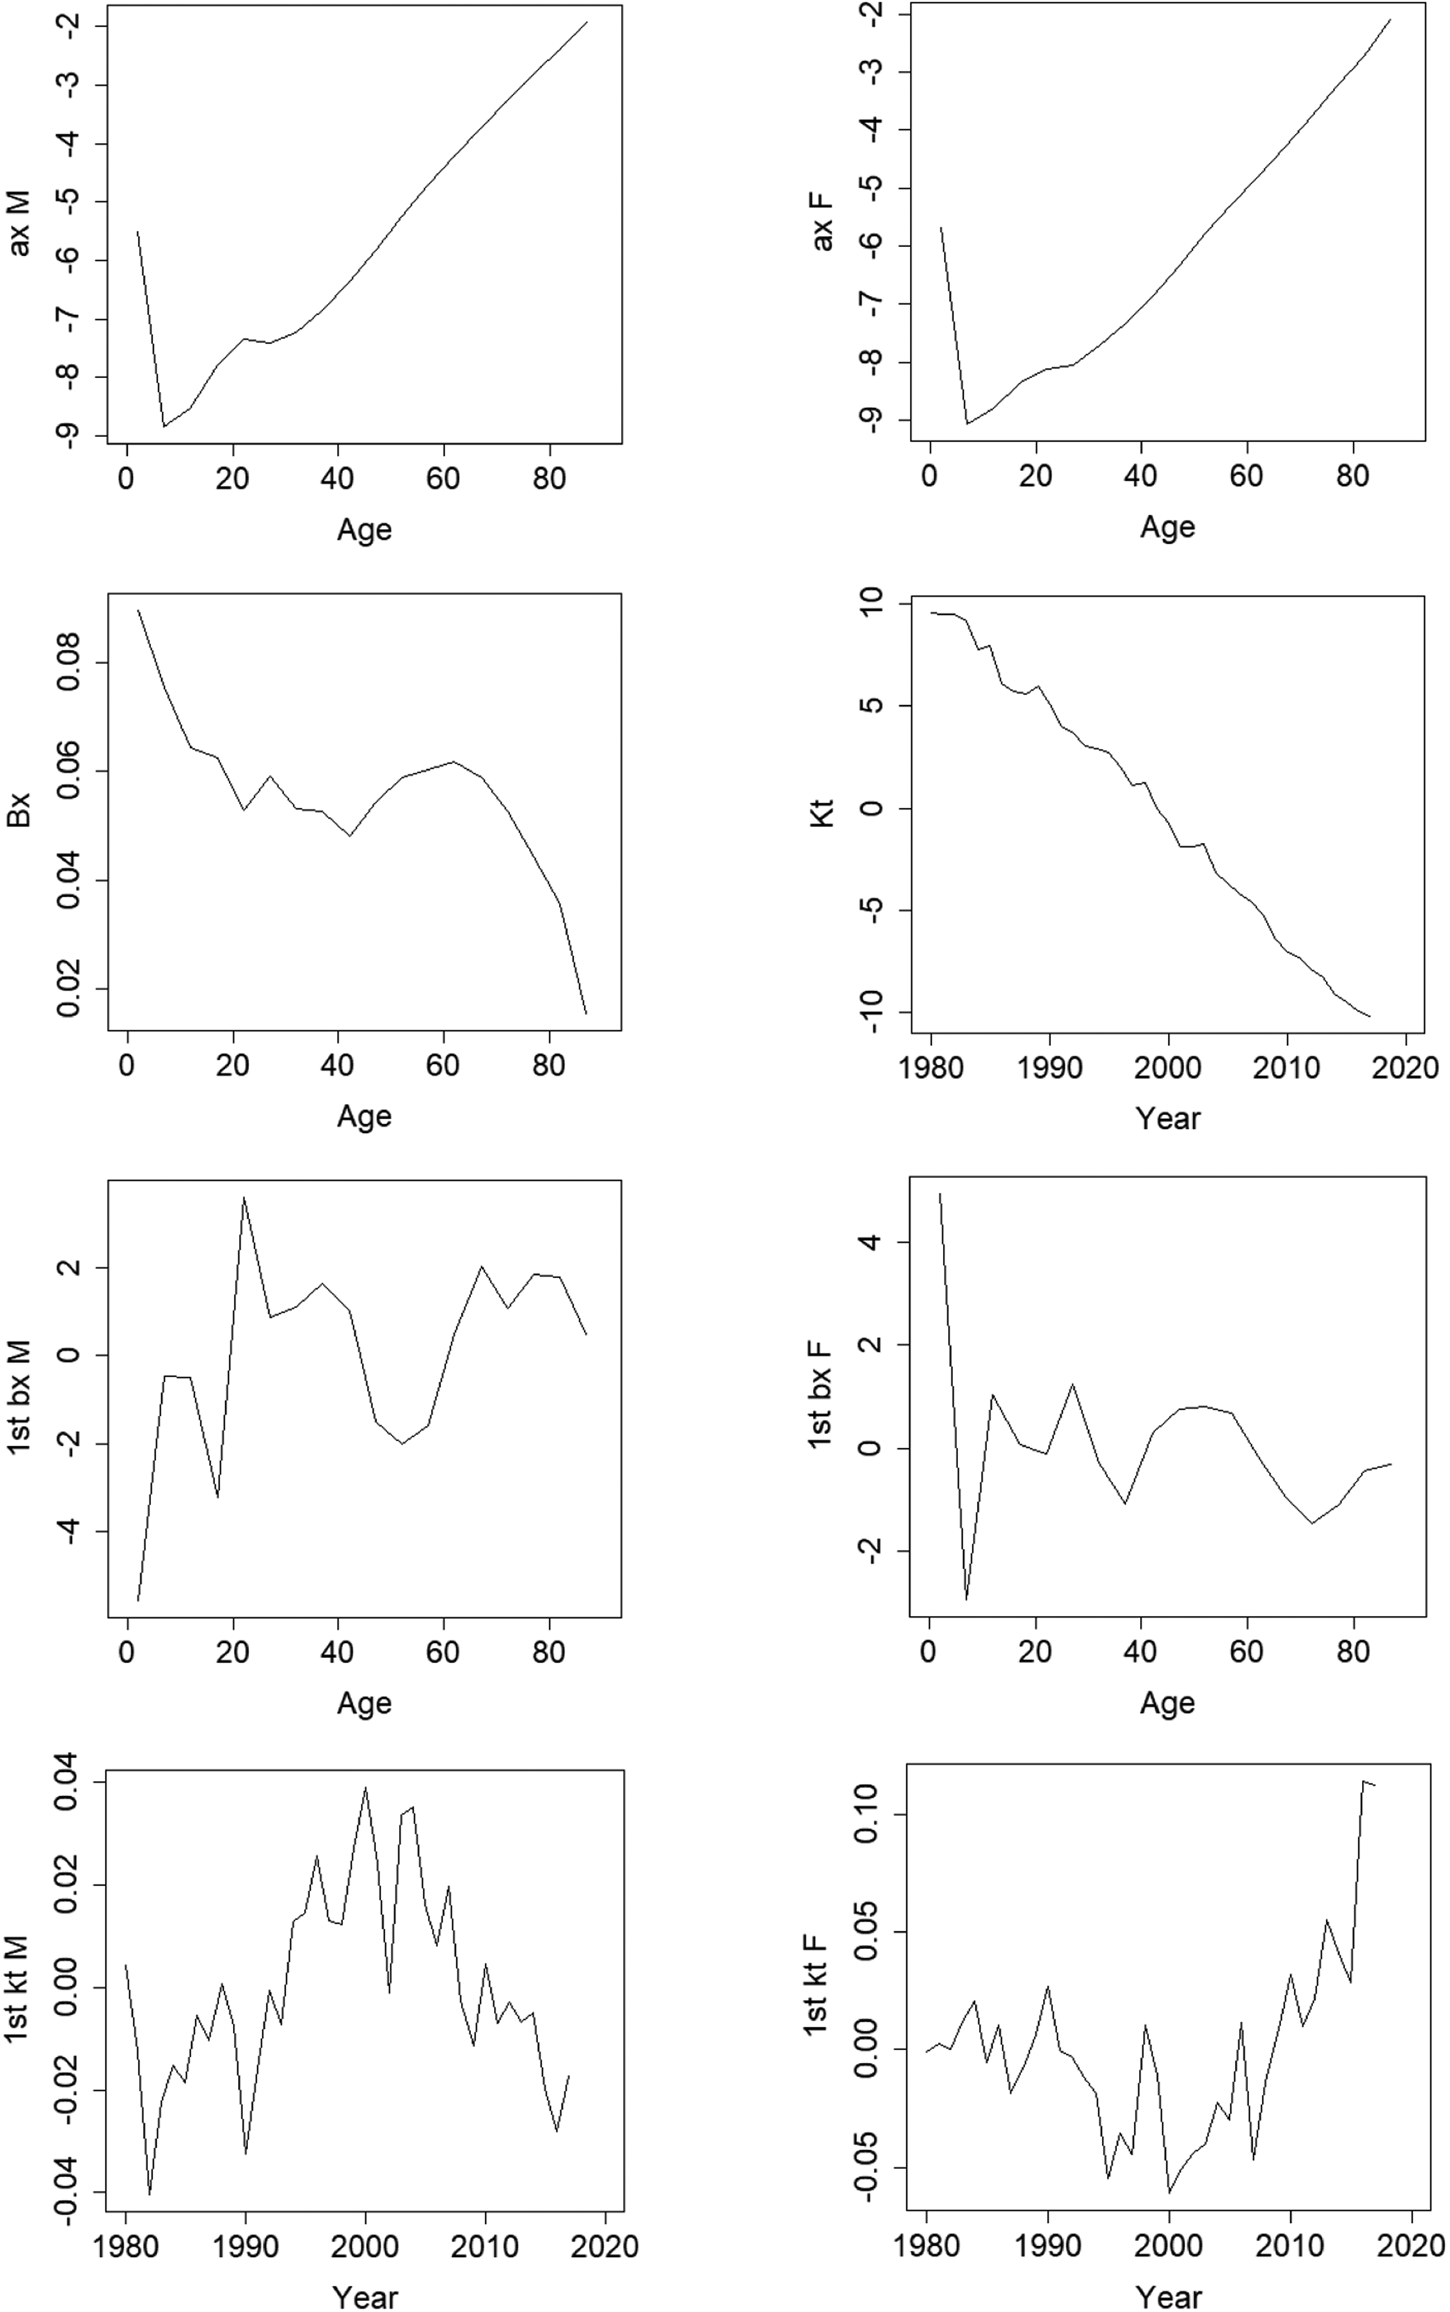
Figure 2. Parameter estimates of the augmented common factor Lee-Carter model fitted to 1980–2017 Singapore mortality data. Source: Authors' own. Notes: For age x in year t of sex i, a(x, i) is the general mortality schedule over age, K(t) is the common mortality index over time with age-sensitivity B(x), and k(t, i) is the time-varying component of the additional factor with age-sensitivity b(x, i). B(x) and K(t) are common parameters for both sexes, whereas the other parameters are specific to either sex; see text.
The linear decline in K(t) and its relatively constant variance are useful for mortality forecasting. We model K(t) by a random walk with drift in order to derive the projected common mortality index up to around 2080; see online Appendix A for further technical details. Results are shown in Figure 3 (left panel).Footnote 4 The plot illustrates the past values of K(t) for 1980–2017, along with the forecasts based on the time-series model and the associated 95% confidence interval. Not surprisingly, the variance of K(t) increases with the forecast horizon since there is greater uncertainty in predicting mortality improvements over the longer term. The fitted parameters and forecasts detailed here are subsequently employed to construct forecasts of death rates and survival probabilities required for annuity valuation. The relevant sets of cohort survival probabilities to extract for our analyses depend in part on the product design of the CPF annuities evaluated; an aspect we turn to next.

Figure 3. Projected common mortality index K t from the Li and Lee (Reference Li and Lee2005) model (left) and its modified version (right). Source: Authors' own. Notes: The dotted lines on both sides of the mean projection values are the 95% prediction intervals.
3. The CPF longevity insurance scheme
3.1 Context and overview
The CPF is a fully-funded national DC scheme based on individual accounts. Established in 1955, it is one of the world's oldest DC schemes and has about 4 million members (as of June 2020). Coverage is almost universal since participation is compulsory for the majority of working Singaporeans and permanent residents, as well as self-employed persons who meet an annual income threshold. Monthly contribution rates range from 37% of wages (17% by employers and 20% by employees) for young working adults aged 35 and below, to 12.5% of wages for those aged 65 and over. At age 55, a plan participant's CPF savings – which may sit in differently purposed accounts – are consolidated and placed into a newly-created Retirement Account. As discussed earlier, the CPF Board requires participants to set aside a specific amount of monies (e.g., S$166,000 in 2017) before any excess accumulations in the Retirement Account can be withdrawn as a lump sum at age 55. The minimum retirement sum in the Retirement Account is preserved to age 65 before drawdowns are permitted. One of the most prominent reforms in the CPF system, to date, was switching the default decumulation option for this minimum retirement sum from phased withdrawal to mandatory annuitization.
The CPF longevity insurance scheme is known as the ‘CPF LIFE’. It was introduced on a pilot basis in September 2009. During this pilot phase, annuitization was entirely voluntary and annuitants could choose from four CPF annuities; see details in Fong et al. (Reference Fong, Mitchell and Koh2011).Footnote 5 In January 2013, the annuitization scheme was rolled out on a mandatory basis and the product menu was simplified to just two CPF annuities. In 2017, which is the year pertinent to our study, it remained that only two annuities were offered, namely the Standard plan (default) and the Basic plan. Both products, however, had level payout structures. In January 2018, a third plan called the ‘Escalating 2% plan’ was introduced to broaden the choice menu. It features an escalating payout structure to help protect consumers against inflation and was mooted by the CPF Advisory Panel (CPF, 2016).Footnote 6
Overall, the Singaporean approach to longevity risk pooling in its retirement system is unusual in some aspects. The CPF annuities are provided by the government, instead of by private insurance entities. In many countries with a history of annuitization in DC schemes, occupational pension annuities are offered by commercial providers. For example, the UK compulsory purchase market was serviced by retail life insurers offering a variety of annuity types (Cannon and Tonks, Reference Cannon and Tonks2010; Reference Cannon and Tonks2016).Footnote 7 Additionally, the choice menu is rather limited and it does not include joint-and-survivor annuities. The LIFE scheme is also designed to be non-profit in nature, as explicitly stated on the CPF website: ‘Being non-profit and administered by the CPF Board, the CPF LIFE scheme does not incur distribution costs from agents’ commissions. Costs can also be better spread out with CPF LIFE's large member base… CPF LIFE provides one of the highest payouts for every dollar committed compared to other private annuities… CPF LIFE is the only life annuity backed by the Singapore Government’ (CPF, 2019).
The CPF LIFE premium amounts and monthly payouts are determined by the CPF Board with advice from independent actuarial consultants. The benchmark premium amount is essentially the minimum retirement sum, which is $166,000 in 2017. Participants also have options to invest less than this (if they have insufficient savings) or more than this (if they have excess savings). Accordingly, the amount of monthly annuity payouts primarily depends on how much the participant paid in premium upfront, gender, and plan choice. For illustration, monthly payouts are $1,271 (male) and $1,184 (female) for the Standard plan given a premium of $166,000 in 2017 based on CPF's benefit schedule. Monthly payouts for all CPF annuities are nominal. CPF LIFE payouts may be adjusted over time to account for long-term changes in interest rates or life expectancy. According to the CPF Board, however, such adjustments (if any) are expected to be small and gradual (CPF, 2019). As a statutory board under the Ministry of Manpower, the CPF Board receives subvention from the government for its day-to-day operations including the administration of the LIFE scheme. There is, however, no indication on the CPF website or in any publicly-available materials that the benefits in the LIFE scheme are financed through subventions or state subsidies.
3.2 Key features of CPF annuities
In this subsection, we focus on four design features of the CPF annuities essential to our empirical analyses. The CPF annuities are single-premium, deferred, individual-life annuities with capital protection. First, entry age of the annuity contract. Annuitization age is set at age 55, being the age that CPF members are automatically included in the LIFE scheme if they have at least S$40,000 (US$27,580) in their Retirement Accounts. The average CPF savings across all members per aggregate statistics was approximately S$87,400 in 2016 (CPF, 2017); detailed breakdowns of balances by age groups were not available. Nonetheless, this suggests that the S$40,000 eligibility threshold enables the large majority of CPF members to annuitize, thus ensuring that the national annuity pool is sufficiently large under the annuitization mandate.Footnote 8
Second, annuity premiums. These are stipulated by the CPF Board and defined by the prevailing rules governing the LIFE scheme. In 2017, the stipulated premiums (or so-called Retirement Sums) are: S$83,000 (or Basic Retirement Sum), S$166,000 (Full Retirement Sum), and S$249,000 (Enhanced Retirement Sum).Footnote 9 We define these amounts, respectively, as low, medium, and high premium in subsequent analyses. Note that the LIFE scheme technically enforces only partial (rather than full) annuitization of retirement balances. If a plan participant has excess savings above the Full Retirement Sum, he or she may freely withdraw these monies instead of choosing to invest the Enhanced Retirement Sum.
Third, the CPF annuities are deferred life annuities. Annuitants are eligible for monthly annuity payouts only starting at age 65 (known as the LIFE payout eligibility age which is CPF-determined). Thus, there is a 10-year deferral (or waiting) period between ages 55 and 65. This deferral period inherent in the CPF products means that the provider, being the government, faces risks from predicting cohort mortality over an extended duration.
Finally, all the CPF annuities are capital protected in that any unused annuity premium (if any) will be paid out as a lump sum to the nominated beneficiaries or insured's estate if the insured dies. This unused annuity premium or bequest is defined as the single premium paid plus any interest earned, less the total amount of monthly payouts already made to date. Thus, the CPF member (and his or her estate) will always recover at least the amount that he or she paid for the annuity, in the form of payouts and/or bequest, regardless what age he or she lives to. Given that the three CPF plans vary in terms of monthly payout (as determined by CPF Board), it implies that bequest amounts will also vary across products since bequest is purely a function of the premium paid and monthly payouts. We show in the next section how each of these design features are factored into the MW valuation framework.
4. The money's worth valuation framework
4.1 The MW model
The MWR is based on the calculation of the expected present discounted value (EPDV) of annuity payouts, relative to the premium or purchase price of the annuity (Mitchell et al., Reference Mitchell, Poterba, Warshawsky and Brown1999). For an immediate life annuity, the MWR is calculated according to the following formula:
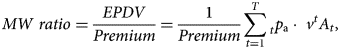
where a is the age at which the annuity is purchased (annuitization age), t is the number of months from annuitization age, ${}_t^{} p_a$ is the probability that an individual of age a survives after t months, $v_{}^t$
 is the nominal discount factor at month t based on a term structure of interest rates, A t is the annuity payout in month t, and T is the maximum age as per the survival tables. Annuitant survival tables are typically used in the context of voluntary annuity markets as those who elect to purchase a payout annuity tend to live longer than those who do not. In the context of compulsory annuity markets, population survival tables are used instead (Bütler and Ruesch, Reference Bütler and Ruesch2008; Cannon and Tonks, Reference Cannon and Tonks2010).
In their earlier study, Fong et al. (Reference Fong, Mitchell and Koh2011) modified the MW model to take into account the various design features of the CPF annuities, including the deferral period and capital protection, and showed that the MWR for these products can be represented as follows:
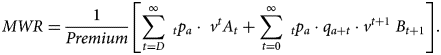
The additional terms in equation (3) are defined as follows. D is the deferred period in months (which is set at 120 months), $B_{t + 1{\rm \;}}^{}$ is the bequest/death benefit at time t + 1, and ${}_t^{} p_a\cdot q_{a + t}^{}$
 is the probability of an annuitant age a surviving to t months and then dying between month t and month t + 1. The first summation in the brackets captures the annuity benefits received over the lifetime of the insured if he or she lives to the point when payouts start, whereas the second summation reflects the lump-sum bequest paid out to the beneficiaries upon the insured's death.
Using 2009 data, Fong et al. (Reference Fong, Mitchell and Koh2011) found that the then newly-launched CPF annuities offered excellent value-for-money to the general population, with MWRs of 1.24–1.31 (1.26–1.34) for males (females) across four products. The interpretation of MWR exceeding unity is not straightforward. Even in well-functioning markets, MWR values equal or greater than unity are implausible in the long term because insurers have to factor in administrative loads, profit margins, and adverse selection (Poterba and Warshawsky, Reference Poterba, Warshawsky and Shoven2000). Consequently, in many countries, the expected present value of annuity payouts is only 80–90% of the premium cost (see, e.g., Mitchell et al., Reference Mitchell, Poterba, Warshawsky and Brown1999; Brown et al., Reference Brown, Mitchell, Poterba and Warshawsky2001; Cannon and Tonks, Reference Cannon and Tonks2004). Fong et al. (Reference Fong, Mitchell and Koh2011) thus posited that the high estimated annuity values in Singapore in 2009 were due to policy aimed at creating public buy-in for the new scheme, and it was uncertain whether the Singapore government could continue subsidizing payouts in the longer term. However, because the authors had used a deterministic projection of mortality, it is unclear what is the distribution of MW values for a given product across a range of population mortality scenarios. For instance, it could be possible that in low mortality improvement scenarios, the estimated MWRs lie below unity.
To provide a fuller picture, we adopt the Fong et al. (Reference Fong, Mitchell and Koh2011) method in valuing the CPF annuities but embed a stochastic mortality model within the MW valuation framework. This applied to 2017 data. In what follows, we describe the various data inputs required.
4.2 Annuity premiums and payouts
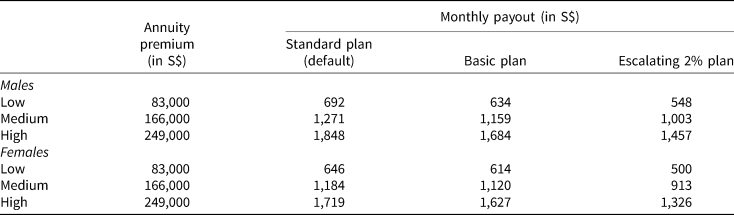
There were technically only two CPF annuity products offered in 2017, namely the Standard plan and the Basic plan. The third product, which is the Escalating 2% plan, was introduced in January 2018. Nonetheless, since data are available, we incorporate it in this present study to allow for richer analysis. The 2017 annuity payout and bequest schedules for all products are obtained from CPF (2018). Table 1 displays the monthly annuity payouts by sex, premium invested, and product type. As discussed earlier, the premium amounts for an age 55 CPF annuitant are: S$83,000 (low), $166,000 (medium), and $249,000 (high). For a $83,000 premium, for example, initial monthly annuity payouts at age 65 range from $500 to $646 for females and from $548 to $692 for males. Not unlike commercial annuities, monthly payouts for females are systematically lower because of their longer expected lifespans as compared to males.
Table 1. Monthly nominal payouts for CPF annuities by sex, premium, and product type (2017; payouts starting at age 65)
Source: Authors' own.
Notes: The three illustrative single-premium amounts correspond to the amounts stipulated in the CPF Retirement Sum scheme for an age 55 annuitant in 2017, namely S$83,000 (low), S$166,000 (medium), and S$249,000 (high). Members are assigned to the Standard plan by default if they do not make a choice. Monthly payouts are in nominal terms. Payouts for the Standard and Basic plans are level across time. Only the first-year payouts are shown for the Escalating plan, which offers 2% increase in payouts every year.
The default/Standard plan provides a higher level of monthly payout and leaves a lower bequest. The Basic plan provides a lower payout in exchange for a higher bequest. Figure 4 illustrates this trade-off in payouts and bequest across products. Solid lines depict the bequest amounts (primary vertical axis), whereas the dotted lines depict the monthly payouts (secondary vertical axis). For an illustrative S$83,000 premium, the graph shows that a male annuitant who survives to age 65 can start receiving level monthly payouts of $634 under the Basic plan or $692 under the Standard plan. Bequest amounts associated with the Standard plan are lower across all age values and diminish to zero by around age 80. In comparison, the Basic plan allows more to be left to beneficiaries and provides a positive death benefit even past age 90. The Escalating 2% plan is a back-loaded annuity: its starting payout is about 20.8% lower than that of the default/Standard plan but annuitants can look forward to a 2% fixed annual increase in payout thereafter.
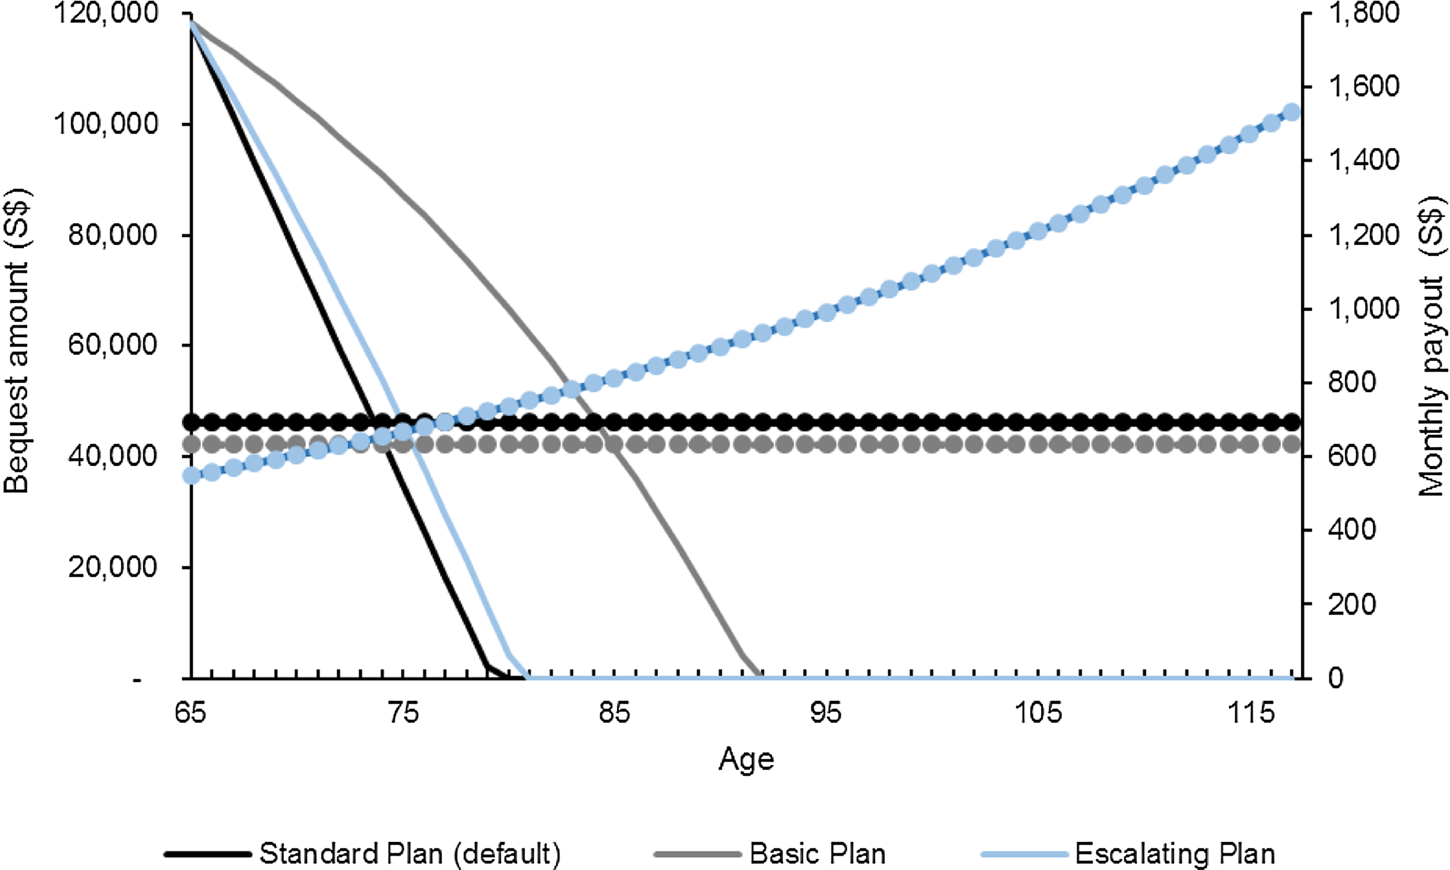
Figure 4. Bequest amounts and monthly nominal payouts by plan type (male annuitant; illustrative single-premium of S$83,000 paid at age 55 in 2017). Source: Authors' computations from CPF (2018). Notes: The payout and bequest amounts are for a male annuitant who paid a lump-sum premium of S$83,000 at age 55 in 2017. We assume that the annuitant starts his payout at the earliest eligibility age of 65. Between ages 55 and 65, the premium set aside enjoys guaranteed returns of 4–5% per annum and thus the amount of bequest available at age 65 (approximately S$120,000) is larger than the initial premium invested (S$83,000). The solid lines show the bequest amounts (on the primary vertical axis), whereas the dotted lines show the monthly annuity payouts (on the secondary vertical axis).
4.3 Term structure of interest rates
The MW calculation requires a term structure of interest rates. Following Fong et al. (Reference Fong, Mitchell and Koh2011), we use the Singaporean Treasury bond rates to construct a riskless term structure of interest rates. A riskless term structure of interest rates is deemed more suitable than a corporate term structure of interest rates in our context since the CPF annuities are supplied by the government through the CPF Board. The Singapore government has a triple-A credit rating from international credit rating agencies. Also, the CPF annuities are capital protected.
Prices and yields of Singapore Government Securities issued 2017 with varying maturities are obtained from MAS (2018), including the 1-year Treasury bill and the 2-, 5-, 7-, 10-, 15-, 20-, and 30-year Treasury bonds. These are used to compute the riskless spot rates to proxy the yields on hypothetical zero-coupon bonds. We then linearly interpolate between intervals where spot rates are unavailable, for instance, between the 7- and 10-year spot rates, to derive the full term structure of interest rates. Our spot rates range from 1.40 to 3.71% per annum. Since the maximum duration available for the Singapore Government Securities is 30 years, we extrapolate the last spot rate for longer maturities. The long-term extrapolated rate of 3.71% used in our study is broadly consistent with the 3.44% reported in Fong et al. (Reference Fong, Mitchell and Koh2011).
4.4 Stochastic cohort survival probabilities
Our base stochastic mortality model is the augmented common factor Lee-Carter model based on Li and Lee (Reference Li and Lee2005) and Li (Reference Li2013) as outlined in Section 2. Population survival tables are used since the CPF annuitization scheme functions as a compulsory annuity market. The fitted parameters and forecasts from the base model are used to construct forecasts of death rates and survival probabilities for a male who is age 55 in 2017. Similar forecasts of death rates and future survival probabilities are derived for a female age 55 in 2017. Consistent with Fong et al. (Reference Fong, Mitchell and Koh2011), the terminal age for CPF annuitants is set to age 117. The set of cohort survival probabilities extracted from these mortality forecasts is called the ‘central projection’ and characterizes the future mortality experience of a typical age-55 annuitant in 2017. We also conduct Monte Carlo simulations to generate future mortality scenarios. This yields 5,000 sets of random sex-specific cohort survival probabilities, representing the uncertainty in predicting cohort mortality for male and female Singaporean annuitants over a long duration.Footnote 10
Figure 5 shows the survival fan chart for an age 55 female CPF annuitant in 2017 based on the 5,000 stochastic survival paths. Because the whole Singapore population is used for analysis, the modeled variability reflected in the fan chart is small. The chart also usefully demonstrates that uncertainty about death rates generally increases with the duration of the annuity contract, consistent with past studies (e.g., Blake et al., Reference Blake, Dowd and Cairns2008). In the first few years after annuity purchase, the probability of death is relatively low so there is little uncertainty. In later years and as the timespan lengthens, however, this uncertainty increases, especially between ages 75 and 90. This has implications from the supply-side perspective. In particular, the back-loaded Escalating annuity product presents a riskier liability for the provider than the other two level-payout annuities since a greater proportion of its present value will be paid over the period of greater uncertainty.
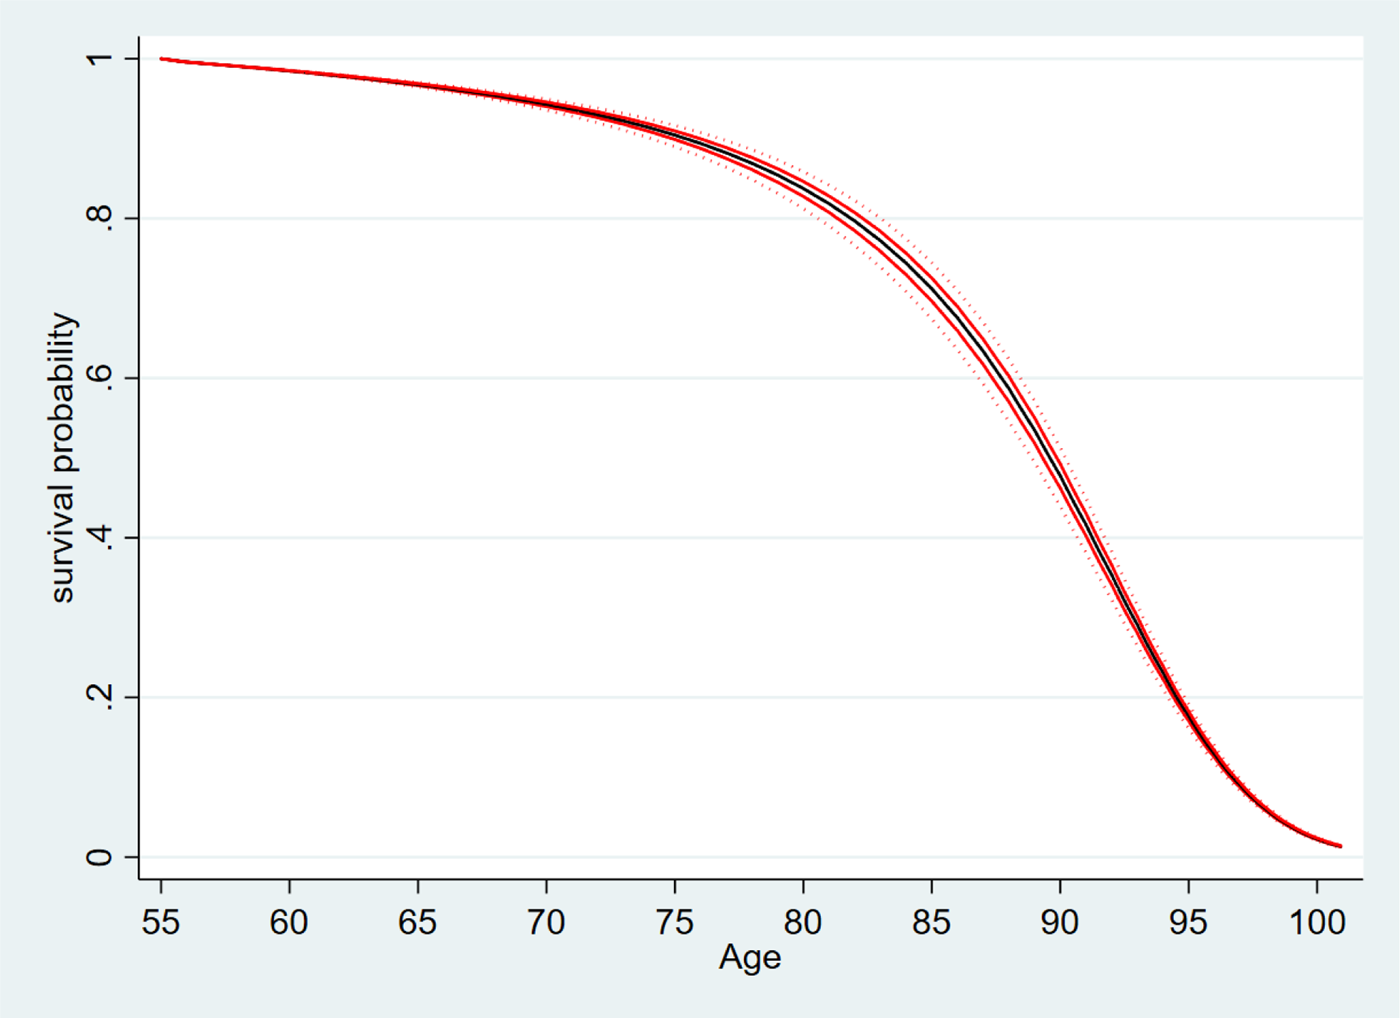
Figure 5. Fan chart of cohort survival probabilities for a female annuitant aged 55 in 2017. Source: Authors' own. Notes: This fan chart illustrates the uncertainties surrounding the projections of survival probabilities for a female CPF annuitant aged 55 in 2017. Sex-specific future cohort survival probabilities are generated from 5,000 simulated scenarios using the augmented common factor Lee-Carter model. The central heavy black line shows the median survival probabilities, whereas the two solid red lines on either side of the median show the 75th and 25th percentiles. The outer dotted lines show the 95th and 5th percentiles.
In what follows, we use the set of central mortality projections from the base mortality model to compute MW values for CPF annuitants. The 5,000 stochastic survival paths are also deployed to estimate the range of MWRs for a range of high and low population mortality improvements. Importantly, we then test the sensitivity of the MW results to the choice of mortality model. In robustness checks, we will separately implement the original Lee and Carter (Reference Lee and Carter1992) model and the product–ratio model proposed by Hyndman et al. (Reference Hyndman, Booth and Yasmeen2013) to derive alternative MW estimates and compare these against those from the base model.
5. Results and sensitivity analyses
5.1 Stochastic MW values for base model
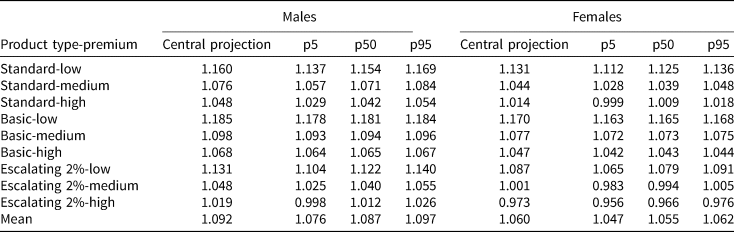
Table 2 reports the estimated MWRs for CPF annuitants by sex, premium amount, and product type using the base mortality model. Overall, the results show that the government-provided CPF annuities offer good value-for-money across all product–premium combinations. Focusing first on the ‘central projection’ columns, we see that the MW values are 1.019–1.185 for males and 0.973–1.170 for females. This indicates rates of return to annuitants that are close to, or even exceeding, the actuarially fair rate (being unity). The average MWR for males and females are similar. Per premium dollar, the typical male annuitant would anticipate receiving an average of $1.092 while the female $1.060. Annuity values are also broadly comparable across products, although the Basic plan offers slightly higher MWRs than the Standard plan, which in turn offers slightly higher values than the Escalating plan.Footnote 11 For instance, a female annuitant with a medium premium would expect an MWR of 1.077 if she opted for the Basic plan (vs. 1.044 for the Standard plan and 1.001 for the Escalating plan). This is suggestive that the provider may have priced the respective plans anticipating that individuals with longer life expectancies tend to select into back-loaded Escalating plan.Footnote 12
Table 2. Stochastic MWRs of CPF annuities in 2017
Source: Authors' own.
Notes: Sex-specific future cohort survival probabilities are estimated using the augmented common factor Lee-Carter model for an age 55 annuitant in 2017; see text. The ‘central projection’ columns report MWRs generated using the central or mean mortality projections. The ‘p5’, ‘p50’, and ‘p95’ columns report MWRs generated using, respectively, the 5th, 50th, and 95th percentiles of the survival distribution based on 5,000 simulated scenarios. The rows show the different product–premium combinations. The three illustrative single-premium amounts correspond to the amounts stipulated in the CPF Retirement Sum scheme for an age 55 annuitant in 2017, namely S$83,000 (low), S$166,000 (medium), and S$249,000 (high). Annuitants are assigned to the Standard plan by default if they did not choose a plan.
We also evaluate annuity values at the 5th, 50th, and 95th percentiles of the stochastic survival distribution for each product–premium combination. Two conclusions are worth highlighting. First, the stochastic MW distributions are compact. The 5th and 95th percentile estimates reveal approximately a 1% gap in the MW values on either side of the median; for instance, the 5th and 95th percentiles of the Standard-medium product for a male annuitant are 1.057 (1.3% from median of 1.071) and 1.084 (1.2% from median) respectively.Footnote 13 Thus, the differences in MW are relatively small between a very high population mortality improvement scenario and a very low mortality improvement scenario. At the 5th percentile of the survival distribution, where future rates of mortality improvement are very low, CPF annuities still provide an average MWR of 1.076 (1.047) to male (female) purchasers.
Second, in spite of the considerable uncertainty in terms of predicting cohort mortality over a very long duration, we find that most of the MW estimates generated from the model are high. Even in a very low mortality improvement scenario as represented by the 5th percentile of the stochastic survival distribution, CPF annuities provide an expected value exceeding 0.950. This buffers the earlier finding by Fong et al. (Reference Fong, Mitchell and Koh2011) that CPF annuities do offer excellent money-for-value for the typical annuitant, but shows that estimated MWRs may lie below unity in low mortality improvement scenarios. Consequently, whether the government-run national annuity pool is subsidized or not must be more carefully interpreted in the relation to the assumed future rates of mortality improvement.
5.2 Sensitivity tests: alternative mortality models
Two alternative mortality forecasting approaches are considered for sensitivity analysis. We separately implement the original Lee and Carter (Reference Lee and Carter1992) model, widely considered as a benchmark demographic model for mortality modeling and projections, as well as a product–ratio model proposed by Hyndman et al. (Reference Hyndman, Booth and Yasmeen2013). Similar to the augmented common factor Lee-Carter model, the latter produces coherent mortality forecasts between males and females.Footnote 14 We extract the central mortality projections from each model and re-estimate MW for all premium–product combinations, holding other inputs to the MWR valuation framework constant. Online Appendix A provides further technical details.
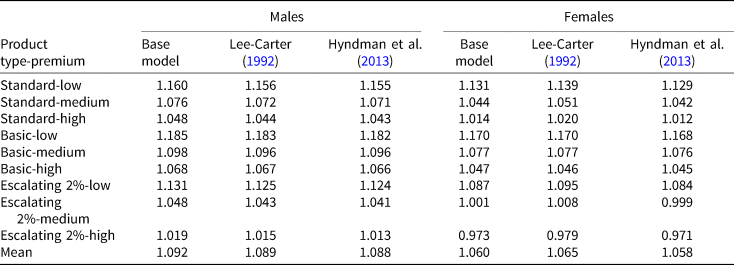
Results are reported in Table 3. We find that our results are robust to the choice of mortality models. For instance, the average MWR for male annuitants is approximately 1.089 under the Lee and Carter (Reference Lee and Carter1992) model, and 1.088 under the product–ratio model; both estimates are close to the 1.092 obtained from the base model. Similarly, the average MW values for female annuitants are relatively consistent for each premium–product combination across all the three mortality models evaluated. This robustness check strengthens our main finding that the CPF life annuities available in 2017 offer excellent value-for-money, and that the financial values of the annuities are broadly comparable across sexes and product types.
Table 3. Sensitivity analysis: MWRs of CPF annuities in 2017 using central mortality projections from different mortality models
Source: Authors' own.
Notes: Sex-specific future cohort survival probabilities are estimated using each of the three models for an age 55 annuitant in 2017; see text. We use the central mortality projection from each model. The ‘base model’ is the Li and Lee (Reference Li and Lee2005) augmented common factor Lee-Carter model and the results reported in this column are identical to those presented in Table 2. The rows show the different product–premium combinations. The three illustrative single-premium amounts correspond to the amounts stipulated in the CPF Retirement Sum scheme for an age 55 annuitant in 2017, namely S$83,000 (low), S$166,000 (medium), and S$249,000 (high). Annuitants are assigned to the Standard plan by default if they did not choose a plan.
5.3 Stress testing
The forecasted survival probabilities rely on extrapolating the past mortality trend of the Singaporean population. As noted earlier, mortality improvement has largely been steady during the 1980–2017 period. The high linearity in K(t) in the fitted model translates into rather low modeled variability in the cohort survival probabilities and MW values. Nonetheless, mortality improvements may not always progress smoothly. Major structural changes in mortality associated with healthcare and lifestyle improvements affecting all cohorts may occur over time. Li (Reference Li2013) and Li et al. (Reference Li, Li, Tan and Tickle2019), for instance, have noted structural changes in historical mortality for both the UK and Australia around the 1970s. To test the resilience of the high MW values of CPF annuities against this possible scenario, we implement a stress test using a modified version of the base model which incorporates the possibility of future structural changes in mortality.
Specifically, we modify the random walk with drift process for the common mortality index, K(t), in the Li and Lee (Reference Li and Lee2005) augmented common factor model as follows:

where the variable drift, denoted μ(t), captures structural changes in mortality and is given by:

The transition matrix and the drift changes are based on the approximate frequency and severity of past structural changes in other developed countries such as the UK and Australia. As in the base model, we then derive the projected common mortality index up to around 2080. See online Appendix A for further technical details.
Results are shown in Figure 3 (right panel) that was presented earlier. As expected, the associated 95% confidence intervals of K(t) are much wider using the modified model as compared to those from the original model. These wider prediction intervals and increased variability stem from the assumed possibility of major structural changes in mortality in the modified model. The fitted parameters and forecasts from the modified base model are used to construct a new set of forecasts of death rates and survival probabilities for males and females, and then applied to the MW valuation. We also conduct Monte Carlo simulations to obtain 5,000 sets of random sex-specific cohort survival probabilities, representing the uncertainty in predicting cohort mortality for Singaporean annuitants over a long duration given assumed future structural changes in longevity (or conversely, mortality).
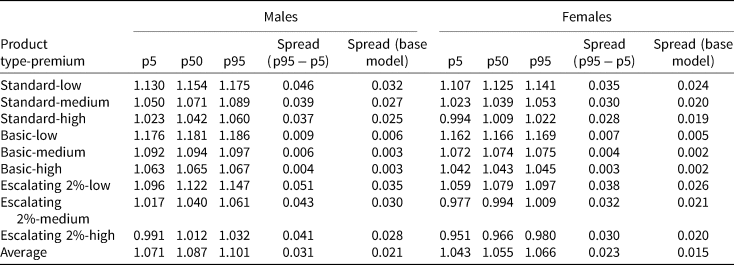
Table 4 shows the MW estimates of the CPF annuities evaluated at the 5th, 50th, or 95th percentile of the survival distribution generated from the modified model. We find that the MW values generally withstand the stress test. Estimated MWRs across all product–premium combinations remain close to unity, even at the lower bound 5th percentile of the survival distribution (representing annuitants with low future survival probabilities). As expected, the MW distributions obtained from the modified model are wider than those noted earlier in Table 2. This is because of the larger variability in survival probabilities stemming from the possibility of major structural changes in mortality. The spread between the 95th and 5th percentiles MW averages 0.031 for males and 0.023 for females (as compared to 0.021 and 0.015, respectively, under the base model). The 5th and 95th percentile estimates reveal a wider gap in the MW values on either side of the median. For instance, the 5th and 95th percentiles of the Standard-medium product for a male annuitant are 1.050 (1.9% from median of 1.071) and 1.089 (1.7% from median) respectively.Footnote 15
Table 4. Sensitivity analysis: stochastic MWRs of CPF annuities in 2017 incorporating possible structural population mortality changes
Source: Authors' own.
Notes: Sex-specific future cohort survival probabilities are estimated using the modified Li and Lee (Reference Li and Lee2005) model for an age 55 annuitant in 2017; see text. The modified model features a modified random walk with drift process for the common mortality index to incorporate possible structural mortality changes in the Singaporean population. The ‘p5’, ‘p50’, and ‘p95’ columns report MWRs generated using, respectively, the 5th, 50th, and 95th percentiles of the survival distribution based on 5,000 simulated scenarios. ‘Spread’ is the difference between the 95th and 5th percentile MWRs. For comparison purposes, we include the spreads from the base (unmodified) model, calculated using the results shown earlier in Table 2. The rows show the different product–premium combinations.
6. Discussion and conclusions
This paper presents new evidence on the MW estimates for the Singaporean compulsory annuity market. Taking into account stochastic mortality, we find that the CPF annuity policies available to an age-55 male annuitant in 2017 delivered expected payouts valued at between $1.019 and $1.185 per dollar of annuity premium. In comparison, female annuitants can expect to receive about $0.973–1.170 per premium dollar. There is little heterogeneity in annuity values across products, and our results are robust to different mortality forecasting approaches. Overall, these findings suggest that Singaporean DC plan participants in the national longevity insurance pool have access to a fairly priced (or better than fair) life annuity across a variety of population mortality improvement scenarios.
Our results are also informative about the impact of systematic longevity risk on annuity values. Although idiosyncratic mortality risks are diversified away through compulsory annuitization, the government – as the annuity provider – still faces considerable uncertainty in terms of predicting cohort mortality over a very long duration. Using the augmented common factor Lee-Carter model, our 5th and 95th percentile stochastic MW estimates reveal approximately a 1.2% gap on either side of the median. This width is relatively smaller than those found in other studies; for instance, Li et al. (Reference Li, Li, Tan and Tickle2019) report a 3–4% variability on either side of the median in annuity values based on a small UK subpopulation (with about 20,000 lives per gender). In contrast, our mortality modeling utilizes the entire Singapore resident population, so the sampling error and modeled variability are much lower. Also, the common mortality index K(t) is almost linear with limited fluctuations in 1980–2017. Consequently, the stochastic MW distributions we derived are compact and vary within a narrow range. A stress test implemented using a modified version of the base model incorporating the possibility of future major structural changes in mortality reveals a wider gap of about 1.8% on either side of the median. Nonetheless, even under the stress test, a male annuitant in a very low mortality improvement scenario who purchased the Standard-medium product can expect an MW value of 1.050.
Our findings bear on a set of issues that arise in designing longevity insurance schemes within DC systems. In most private annuity markets, buyers have to give up as much as 10–20% of wealth to obtain longevity protection. This may lead some retirees to perceive annuities as expensive. Mandating a national annuity pool can eliminate the problems of adverse selection, thereby lowering the costs of retirement income products, yet annuitants are still exposed to administrative costs, fees, commissions, and other charges. Also, pricing inefficiencies may arise from a lack of competition and a captive market. Singapore's experience with the decade-old CPF LIFE scheme suggests that the provision of non-profit annuities at (about) fair prices is key to sustaining an annuitization mandate and/or a large-scale longevity insurance pool. This, in turn, is achieved partly through product design (the capital protection guarantee embedded in the annuities), efficient scheme administration, and potentially, a small government subsidy depending on the assumed rates of future mortality improvements.
A related question, as yet unsettled, has to do with the financial viability of the LIFE scheme. Our findings that the MW values are mostly above actuarial fair level suggest that financing and sustainability of the scheme may be of concern to administrators and policymakers going forward. On a positive note, it appears that scheme administrators are aware of the issue: CPF annuities' MW values have declined from 1.24–1.34 in 2009 (Fong et al., Reference Fong, Mitchell and Koh2011) to 0.973–1.185 in 2017 (this study). Whether the pricing will continue to be revised is anyone's guess. At this point, it is also somewhat ambiguous whether the scheme will be financially sustainable and who will actually bear the systematic portion of longevity risk. Only a few birth cohorts have joined in the scheme thus far, payouts to these cohorts have not even started, and little is known about the overall mortality experience of this risk pool.Footnote 16 The CPF Board has publicly stated that monthly payouts may be adjusted to take into account ‘deviations in mortality experience’ whereby ‘if more people live longer than expected in the long term, the monthly payouts might be lower, and vice versa’, but reassures members that ‘any adjustments are expected to be small and gradual’ (CPF, 2019). Hence, technically, it appears that the systematic longevity risk will be borne jointly by the annuitants and the government. Our suggestion that the government will likely bear the bulk of the burden (if any) stems from the observation that authorities fundamentally want the scheme to succeed, and its standing commitment to the public that benefits will be stable.
Our study has a few limitations that future research can address. One limitation is that valuation exercises such as those presented here are cross-sectional in nature. Although we document a decline in MW values from about a decade ago, it is unclear what contributed to the fall in annuity values over time. As the CPF LIFE scheme continues to evolve, it will be important to monitor whether this downward trend in annuity values persists in the foreseeable future. A more detailed examination of whether the scheme is financially sustainable in the long-run is also warranted as the scheme matures. Another key limitation is that we did not account for selection into different product types. It may be possible that CPF members who opt for different plan types also exhibit differences in income, wealth, education, and socio-economic status. These differences may translate into different survival probabilities by socio-economic groups. For instance, unmarried or childless individuals may tend to opt for the default Standard plan which offers the lowest bequest, whereas those with children may prefer the Basic plan which provides the highest bequest. Finally, we do not evaluate the insurance value of annuitization in the CPF annuity scheme. Although idiosyncratic mortality risks are diversified away in a mandatory risk pool, it could be worth exploring the potential issue of redistribution across subgroups. Future research with more granular data can extend this analysis by considering group-specific survival probabilities and overall welfare gains due to mandatory annuitization in the CPF annuity system.
Supplementary material
The supplementary material for this article can be found at https://doi.org/10.1017/S147474722100010X
Financial support
The research was supported by the Singapore Ministry of Education (MOE) Academic Research Fund Tier 1 Grant at the National University of Singapore. All opinions are solely those of the authors.


 Open access