Using Diffuse Reflectance Spectroscopy as a High Throughput Method for Quantifying Soil C and N and Their Distribution in Particulate and Mineral-Associated Organic Matter Fractions
 Paulina B. Ramírez1
  Francisco J. Calderón2*
  Michelle Haddix3
  Emanuele Lugato4
  M. Francesca Cotrufo1,3
- 1Department of Soil and Crop Sciences, Colorado State University, Fort Collins, CO, United States
- 2Columbia Basin Agricultural Research Center, Oregon State University, Adams, OR, United States
- 3Natural Resource Ecology Laboratory, Colorado State University, Fort Collins, CO, United States
- 4European Commission, Joint Research Centre (JRC), Ispra, Italy
Large-scale quantification of soil organic carbon (C) and nitrogen (N) stocks and their distribution between particulate (POM) and mineral-associated (MAOM) organic matter is deemed necessary to develop land management strategies to mitigate climate change and sustain food production. To this end, diffuse reflectance mid-infrared spectroscopy (MIR) coupled with partial least square (PLS) analysis has been proposed as a promising method because of its low labor and cost, high throughput and the potential to estimate multiple soil attributes. In this paper, we applied MIR spectroscopy to predict C and N content in bulk soils, and in POM and MAOM, as well as soil properties influencing soil C storage. A heterogeneous dataset including 349 topsoil samples were collected under different soil types, land use and climate conditions across the European Union and the United Kingdom. The samples were analyzed for various soil properties to determine the feasibility of developing MIR-based predictive calibrations. We obtained accurate predictions for total soil C and N content, MAOM C and N content, pH, clay, and sand (R2> 0.7; RPD>1.8). In contrast, POM C and N content were predicted with lower accuracies due to non-linear dependencies, suggesting the need for additional calibration across similar soils. Furthermore, the information provided by MIR spectroscopy was able to differentiate spectral bands and patterns across different C pools. The strength of the correlation between C pools, minerals, and C functional groups was land use-dependent, suggesting that the use of this approach for long-term soil C monitoring programs should use land-use specific calibrations.
Introduction
Climate change and land management play a major role in the accrual or loss of global soil organic carbon (C) stocks. In this context, C distribution in soil organic matter (SOM) fractions is a crucial early indicator of soil C changes and provides an opportunity to monitor and model C sequestration and its response to agricultural practices (Chenu et al., 2019). In particular, soil C distribution in particulate (POM) and mineral-associated (MAOM) organic matter has been proposed as an effective approach to study soil C responses to global changes and land use, and inform management decisions (Wang et al., 2019). POM is constituted of coarse partially decomposed organic material which if not occluded in aggregates is unprotected, while MAOM is organic matter associated with fine mineral soil particles by chemical bonding or physical occlusion, which may confer it protection from fast decomposition (Lavallee et al., 2020). These two functionally distinct SOM physical fractions have contrasting pathways of formation (Cotrufo et al., 2015), as well as mechanisms of protection (Lützow et al., 2006), and therefore respond differently to disturbances, such as N additions, warming or elevated CO2.
Soil C and N distribution in MAOM and POM can, therefore, be used to evaluate soil C vulnerability to disturbance as well as potential to further accrual (Cambardella and Elliott, 1992; Christensen, 2001). The response of MAOM and POM to changes in agricultural practices as well as climate depend on multiple and co-occurring factors, which contribute to the overall SOM responses. For example, C sequestration in MAOM requires more N than in POM (Cotrufo et al., 2019) and it is highly controlled by soil mineralogy, while the changes in POM depend largely on vegetation cover and residue decomposition and is particularly vulnerable to management decisions and climate change (Córdova et al., 2018; Mikutta et al., 2019; Soucémarianadin et al., 2019).
Across a large geographical area, parent material and climate can lead to substantial changes in soil properties (Arrouays et al., 2014; Ballabio et al., 2019). Therefore, relatively fine spatial sampling is needed in order to capture these complex relationships between variables as well as inherent soil variability. Overall, there is a strong interest in accurately quantifying soil C and N stocks at a global scale to understand better the processes that promote C accumulation (Yigini and Panagos, 2016). However, to obtain an appropriate sampling density for geostatistical analysis, conventional laboratory analyses of SOM fractions and their elemental C and N content become inordinately expensive and time-consuming. This is especially important for models that infer spatiotemporal dynamics of soil C and N from changes in environmental predictors (i.e., climate, land use, texture), which must be calibrated and validated with measured data for accurate forecasting (Lugato et al., 2021).
Infrared spectroscopy has been proposed as an alternative method for a rapid determination of soil quality (Seybold et al., 2019) as well as to predict the distribution of SOM fractions (Baldock et al., 2018). Mid-infrared (MIR) spectroscopy combined with chemometrics is a feasible quantitative analysis method in soils (Sanderman et al., 2020). Additionally, MIR provides detailed information about fundamental vibrations of minerals (i.e., quartz -Si-O frequencies) and organic matter (Soriano-Disla et al., 2014). Unlike near-infrared spectroscopy (NIR), MIR has allowed the identification of several moieties, including aliphatic, methyl, amides III, and polysaccharide components associated with specific SOM fractions in soils (Parikh et al., 2014; Calderón et al., 2017). However, few studies have tested the use of MIR spectroscopy for the prediction of C and N content in SOM fractions with calibrations obtained from soils distributed across a broad range of climates and ecosystem types at a continental scale. Given that MIR spectroscopy provides a high spectral resolution and that MIR spectral characteristics have been associated with specific SOM functional groups and minerals, we hypothesize that MIR can be useful in predicting C and N in MAOM and POM fractions through chemometric calibrations at continental scale applications. MIR has thus not only the potential to quantify soil properties, but also to help to identify regions in which soils are most vulnerable to C losses.
The selection of an optimal chemometric calibration method is essential to estimate soil attributes using the MIR spectra. This could help overcome the difficulties of analyzing large quantities of soil samples. In recent years, various quantitative methods have been applied to MIR spectral data to predict different soil properties such as linear regression (MLR), principal component regression (PCR), and partial least square (PLS) regression (Vohland et al., 2011). PLS is a commonly used method as it typically provides satisfactory results. However, more work needs to be done in chemometric modeling of SOM fractions, specifically, when the studies encompass a broad geographical range. One important question is whether it would be feasible to develop a single, global predictive calibration to estimate a given property at a continental scale, or alternatively, separate local calibrations for soils with different climates and land uses.
Although several studies have addressed this question through a local approach, resulting in higher performance accuracy, a robust continental-scale model would be especially beneficial since it does not require site-specific data and may include a greater source of variability. This is especially important considering that a local model can become invalid if it is unable to accurately capture a variation in the variable of interest as a result of an environmental change. Accordingly, the main objectives of this study were to: 1) Identify MIR spectral changes associated with variations in SOM, MAOM and POM C and N content; 2) Determine MIR spectral regions that may improve the performance of PLS in order to estimate SOM, C and N content in MAOM and POM; 3) Explore the potential use of MIR spectroscopy coupled with PLS to develop continental-scale calibrations for C and N estimations in bulk soil and SOM fractions, as well as soil attributes controlling soil C content under a broad range of environmental conditions. To this end, we scanned 349 topsoil samples from across Europe, with widely different soil properties, climate and vegetation conditions. We also tested the ability of MIR PLS to predict the C and N content in bulk soils and SOM fractions as well as the main factors influencing C storage.
Materials and Methods
SOM Samples and Site Data
For this study, we used the total soil and SOM fractions from Lugato et al. (2021). Briefly, 400 representative soil samples from the Land Use and Coverage Area frame Survey (LUCAS; Orgiazzi et al., 2018) across the European Union and United Kingdom were selected for SOM fractionation (Supplementary Figure S1). These were all mineral (soil organic C < 120gCkg−1) topsoils (0–20cm). Size fractionation was conducted to separate POM (>53μm) from MAOM (<53μm) by wet sieving after mechanical dispersion of aggregates by shaking in sodium hexametaphosphate with beads, as described in Cotrufo et al. (2019). Briefly, for each sample 5g of 2mm sieved and oven dried soil was shaken in dilute (0.5%) sodium hexametaphosphate with beads for 18h to break the aggregates. The dispersed soil was then rinsed onto a 53µm sieve, with the fraction remaining on the sieve being collected as POM, and the fraction passing through (<53µm) collected as MAOM. This fractionation approach, while convenient for the high throughput, defines POM by size (>53μm), thus small amounts of very fine POM could be recovered in the MAOM fraction, and OM associated to coarse minerals (e.g., sand) is recovered as POM. A separation of POM by size and density, when feasible, is advisable. All bulk soils, MAOM and POM samples were pulverized, oven dried at 60°C and analyzed for C and N concentration in an elemental analyzer (LECO TruSpec CN). Inorganic C was removed by acid fumigation (Harris et al., 2001) before elemental analyses, in the few samples where it was present. Due to a variety of reasons (non-readable labels, broken sample containers during transportation and general quality checked after fractionation), 349 out of 400 were retained for MIR and statistical analysis.
For each soil sample we extracted data on particle size distribution (% clay, silt, and sand), pH, available phosphorus (p mgkg−1), extractable potassium (K mgkg−1) cation exchange capacity (CEC cmol (+) kg−1), and land use types from the LUCAS database (http://esdac.jrc.ec.europa.eu/content/lucas-2009-topsoil-data). Bulk density (BD) was indirectly estimated using a pedotransfer functions (Hollis et al., 2012). Values and basic statistics of physicochemical soil properties are summarized in Table 1.
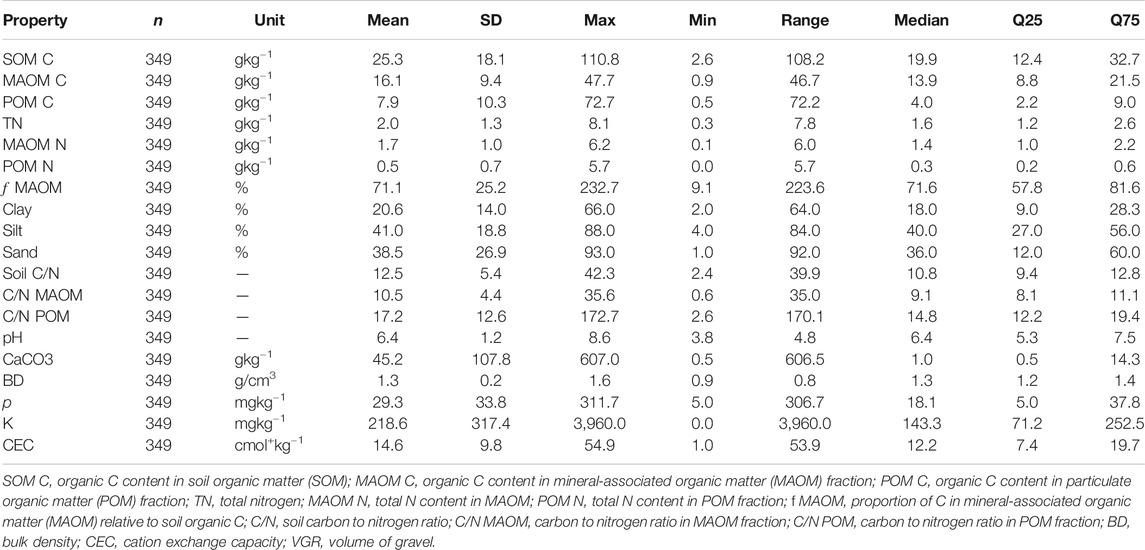
TABLE 1. Summary values and statistic for physicochemical properties of the soils (0–20cm) used in this study. Values are presented for the total number of samples (n = 349), mean, standard deviation (SD), minimum (Min) values, maximum (Max) values, data range, median, lower quartile (Q25) and upper quartile (Q75).
Climate Data
Long-term mean annual temperature (MAT, °C) and annual precipitation (p, mm) were obtained from the high-resolution WorldClim datasets (version 2), which has average monthly climate data for minimum, mean, and maximum temperature and for precipitation for 1970–2000 (http://worldclim.org) at 30s resolution. Using these data, the aridity index (AI) (UNEP, 1997) was calculated as the ratio of mean annual precipitation (MAP) to potential evapotranspiration (ET). We used the aridity index to separate our soils into different climatic zones: arid (0.03–0.2), semiarid (0.2–0.5), dry sub-humid (0.5–0.65), wet sub-humid (0.65–1) and humid (>1.0).
Mid-infrared Measurement
The 349 bulk soil samples were air-dried, ground to fine powder, and scanned undiluted (neat) in the mid-infrared spectral region (4,000–400cm−1). The spectra were obtained using a Digilab FTS 7000 spectrometer (Agilent Technologies, Walnut Creek, CA) with a KBr beam splitter, and a Peltier-cooled DTGS detector. The samples were analyzed in diffuse reflectance, and each spectrum consisted of 64 co-added scans at 4cm−1 resolution. Scans were conducted in duplicate for each sample, and subsequently, the average spectrum was calculated using GRAMS/AI software (Thermo Scientific).
Chemometric Analyses and Mathematical Pre-treatment of the Spectral Data
Partial least Square (PLS) regressions were performed to estimate C and N pools, clay, pH, C/N ratio and soil texture (clay and sand content). Several mathematical pre-treatments were tested, including the Savitzky–Golay function, the second derivative, standard normal variate (SNV), and multiplicative scatter correction (MSC) to reduce baseline variations and/or enhance spectral features. The best improvement was reached using Savitzky–Golay functions with a first derivative using three point smoothing (Savitzky and Golay, 1964). A non-linear Kernel partial least squares (PLS) regression model was used for building the predictive models. During model calibration, a priori outlier detection techniques were adopted to remove influential outliers by plotting the residual X- and Y-variances against leverages and critical thresholds as calculated from Hotelling's T 2 and Q-residuals statistics. The fraction of outliers removed from the models varied from 2 to 2.5%. The PLS calibrations were validated using a random cross-validation approach. The cross-validation was performed by randomly dividing the calibration set into multiple segments using the default setting of the software (Westad and Marini, 2015). The spectral analysis and the development of PLS models were carried out in the Unscrambler chemometric software V.10.3 (CAMO, Norway).
Statistical Analyses
The accuracies and the robustness of the PLS models were evaluated for calibration and prediction using the root mean square error (RMSE) and root mean square error of cross-validation (RMSEcv), determination coefficient (R2) and the ratio of prediction to deviation (RPD), which was calculated as the standard deviation divided by RMSE. The RMSE is a measure of the difference between the predicted value and measured value, while the R2 indicates how well the model calibration and validation fits the measured data. RPD is a dimensionless parameter that represents the ratio of the standard deviation to the RMSE.
The model performance was classified according to the following RPD intervals (Viscarra Rossel et al., 2006; Bellon-Maurel et al., 2010): RPD ≥2 to indicate the model performance was very good to excellent and reliable for quantitative predictions; 1.8 < RPD <2 to indicate satisfactory performance for quantitative predictions, but may be further improved by other approaches; RPD <1.8 to indicates fair predictions and RPD <1.4 poor or insufficient for most applications.
The database was analyzed by Principal component analysis (PCA) and subsequent redundancy analysis (RDA) to elucidate the importance of explanatory variables such as land use types, climate and soil properties on soil spectral properties. Before executing the PCA, the averaged spectra for each soil were baseline corrected and mean-centered. In the RDA, the most significant discriminating variables on spectral bands were selected based on PCA loadings, which was carried out with CANOCO version 5.01 (Microcomputer Power, United States). A correlation matrix provided in the supplementary material was calculated to determine the strength of the relationships between soil properties using the corrplot package in R. A p-value of less than 0.05 was considered statistically significant. The Pearson’s correlation (r) analysis between MIR absorbance values and C and N content in SOM, MAOM and POM were represented using contour/heatmaps. Correction for baseline offsets was applied to the spectra, and the results (r) were linearly interpolated into a grid to smooth the contour/heatmaps (Sigmaplot v.11).
Results
Effects of Spatial Heterogeneity on Spectral Features
We performed PCA using the full MIR spectral range of the sample set to determine the influence of climate and land use on the spectral response of bulk soils. The first component explained 69% of the variance, whereas the second and third components accounted for 17 and 5%, respectively. In general, the sample score distribution shows that the variation in the spectral signatures of soils was associated with differences in the aridity index (AI) and land use types (Figure 1). In the PCA analysis, samples from arid climates were separated from soils under more humid conditions (Figure 1A). For land use types, only woodland soils had a noticeably different pattern from other land uses, which tended to overlap with each other (Figure 1B). Furthermore, the sample score distribution shows that the variation in the spectral features was also associated with differences in C content. Samples were separated from soils that exhibited low and high SOM C content, however, some samples with contrasting C content also exhibited similar spectral composition (Supplementary Figure S2).
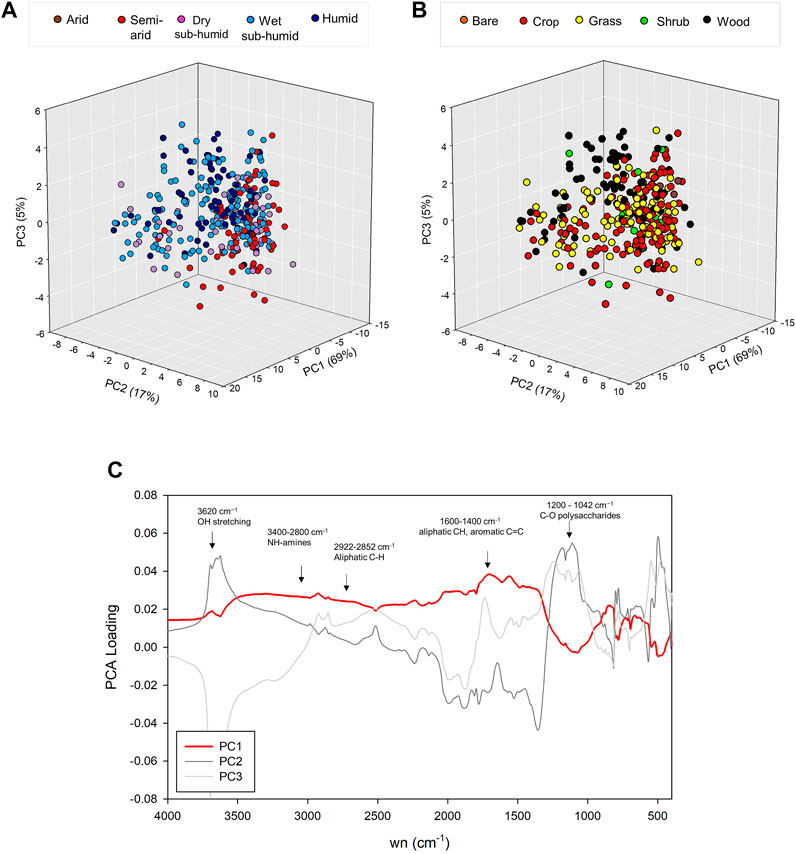
FIGURE 1. Principal component analysis (PCA) to differentiate spectral changes among all the 349 bulk soil samples according to (A) aridity index, (B) land use type and (C) loading of PCA components.
To further explore these differences, we used the PCA loadings and score distribution to reduce the dimensionality of the spectral data, as well as to identify the spectral features contributing to the maximum variance within the sampling set. The loading plot (Figure 1C) showed that various spectral bands from organic compounds had positive loadings in PC1. The spectral differences were associated with higher absorbances in the 3,000–1,500cm−1 region, attributed to the presence of C–H stretching vibrations and aromatic groups near 1,600–1,570cm−1 and in the 2,900–2,940 cm−1 region. A pronounced band characterized the second loading in the 1,200–1,042cm−1 corresponding to C-O stretching of polysaccharides. It should be noted that the band of polysaccharides may overlap with mineral compound bands at 2000–1800cm−1 and 1,030cm−1, which can also be attributed to Si-O groups of quartz and clay minerals, respectively. Furthermore, we found positive loading bands at 2520–1cm and 3,620cm−1 corresponding to carbonates and stretching vibrations of OH groups in lattice clay minerals, respectively.
Relating Soil Spectral Signatures to Environmental Variables
The relationship among soil properties, land use type and climate, along with a selected subset of spectral bands, were identified using redundancy analysis (RDA) (Figure 2). The bands in the RDA were selected in order of the highest loading per component (Figure 1A). Bare land and shrubland were excluded from this analysis due to the small number of samples within these categories. The results show that C accumulation in the MAOM fraction (ƒ MAOM) was particularly high under agricultural conditions with inherently low SOM C (Figure 2, Supplementary Table S1). Furthermore, clay was found to significantly increase the C storage in the MAOM fraction (Figure 2, Supplementary Figure S3). These soil features were associated with the absorption bands at 2,510cm−1 and 3,624cm−1 (Figure 2), corresponding to carbonate and clay minerals, respectively. In more humid conditions, woodland and grassland were positively correlated with SOM C, sand, and C and N content in the POM fraction. In addition, these conditions show a substantial increase in various functional groups attributed to aliphatic C (3,000–2,800cm−1), carboxyl C=O (1700–1800cm−1), aromatic C (1,600–1,500cm−1) and amide N-H (1,550–1,500cm−1).
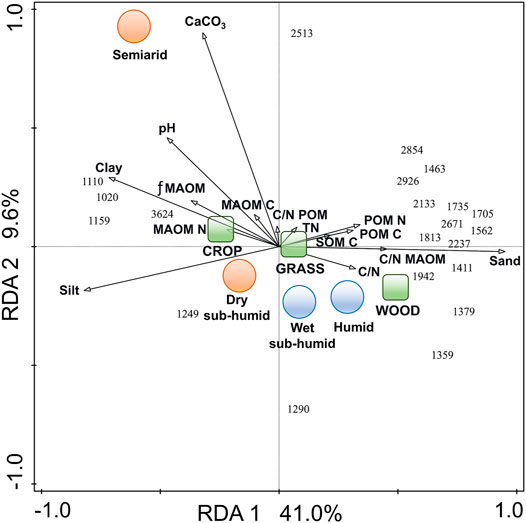
FIGURE 2. Redundancy analysis (RDA) of organic matter fractions and the response of these attributes to significant soil physicochemical, climate and land use properties. SOM C: organic C content in soil organic matter; ƒ MAOM: proportion of C in mineral-associated organic matter (MAOM) relative to soil organic C; MAOM C: organic C content in MAOM fraction (gCkg−1 soil); MAOM N: total N content in MAOM; POM C: organic C content in particulate organic matter (POM) fraction, POM N: total N content in POM fraction, C/N: soil carbon to nitrogen ratio, C/N MAOM: carbon to nitrogen ratio in MAOM fraction; C/N POM: carbon to nitrogen ratio in POM fraction. Arrows in the same direction indicate positive correlation and arrows length represents the magnitude of the correlation.
Spectral Variations of C in SOM, MAOM, and POM
In large and complex datasets, the exploration of spectral variations associated with local conditions might be used to identify uninformative MIR regions. In this way, redundancy and collinearity are reduced so as to increase the model accuracy. Smoothed heatmaps show that the Pearson’s correlation coefficient (r) between absorbances at MIR wavelengths and concentrations of C in SOM, MAOM and POM is land use-dependent (Figure 3, Supplementary Figure S4). Heatmaps illustrate that overall, the position and the magnitude of correlation between spectral bands and the C content in SOM, MAOM and POM differed among woodland, grassland and cropland (Figure 3). For example, POM fraction heatmaps showed a stronger correlation in the 2000–1,000cm−1 region for grassland and woodland (Figure 3C). In contrast, this region was almost indiscernible for cropland. In addition, for woodland, evident differences were observed in the organic matter and mineral absorbances in MAOM fraction, especially in MIR region (2000–1,000cm−1). Furthermore, correlation analysis also shows other spectral patterns that are related to soil organic or inorganic C pools (Supplementary Figure S4). We found high correlations between C in SOM, MAOM and POM, and aliphatic bands around 2,850–2,920cm−1 for grassland and woodland, but less so for cropland. In addition, woodland exhibited a low correlation with the Si−O groups in quartz near 1800cm−1 for SOM C and MAOM C (Supplementary Figure S4). For inorganic C, the band at 2,525–2,510cm−1 had a strong correlation with CaCO3 content in the grassland and cropland, but less so in the woodlands. The lattice clay absorbance bands between 3,650 and 3,595cm−1 were positively correlated to clay content as expected, but slightly negatively correlated to organic C and POM C in soils from every land use type.
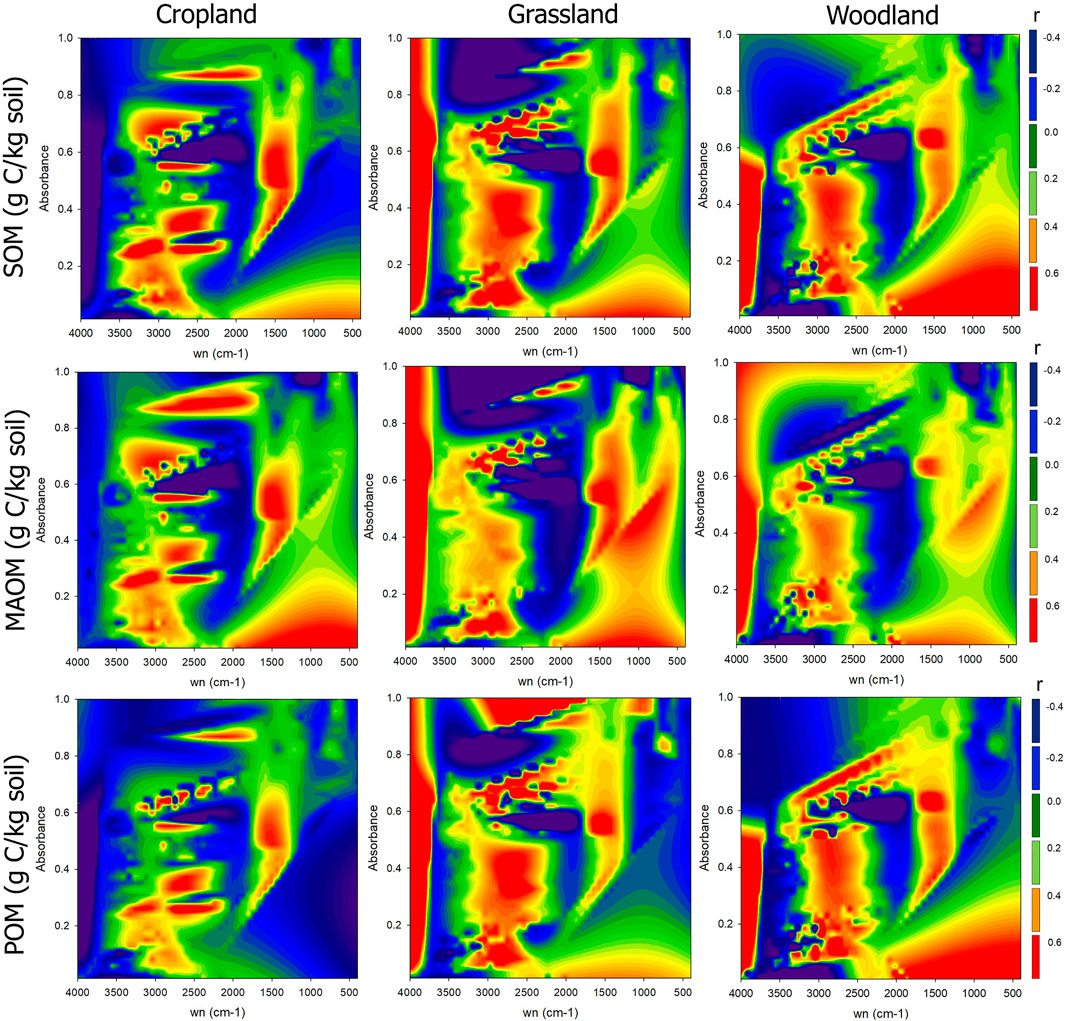
FIGURE 3. Heatmaps displaying the magnitude of the Pearson’s correlation coefficients (r) between MIR wavelength range and carbon (g Ckg−1 soil) in soil organic matter (SOM), mineral-associated organic matter (MAOM) and particulate organic matter (POM) for cropland, grassland and woodland separately. The color scale next to the maps represents the correlation coefficient r.
Prediction of C and N Content in MAOM and POM Fractions
The performance ability of calibration models is shown in Table 2. Overall, low values of RMSE and high R2 indicate better predictive performance, however, RPD is used to standardize RMSE values against the SD, as RMSE is a dependent concentration parameter. For C pools, the best PLS-MIR model was developed within the 2000–400cm−1 spectral range, which included the major absorption bands related to C pools previously identified in Figure 3. For C in total SOM and MAOM (Figure 4A; Figure 4B), good and reliable estimates were obtained using a global calibration (R2 = 0.80–0.79; RPD = 2.23–2.17, respectively). However, the cross-validation for C in SOM tended to underestimate the observed concentrations, thus a large number of data points were distributed below the 1:1 line showing a high dispersion at C content over 50gCkg−1 soil (Figure 4A). In contrast, poor prediction accuracy was obtained for POM C showing a curvilinear trend (R2 = 0.61; RPD = 1.60). The model had a clear tendency to underestimate the prediction when the measured C content was higher than 20gCkg−1 soil (Figure 4C).
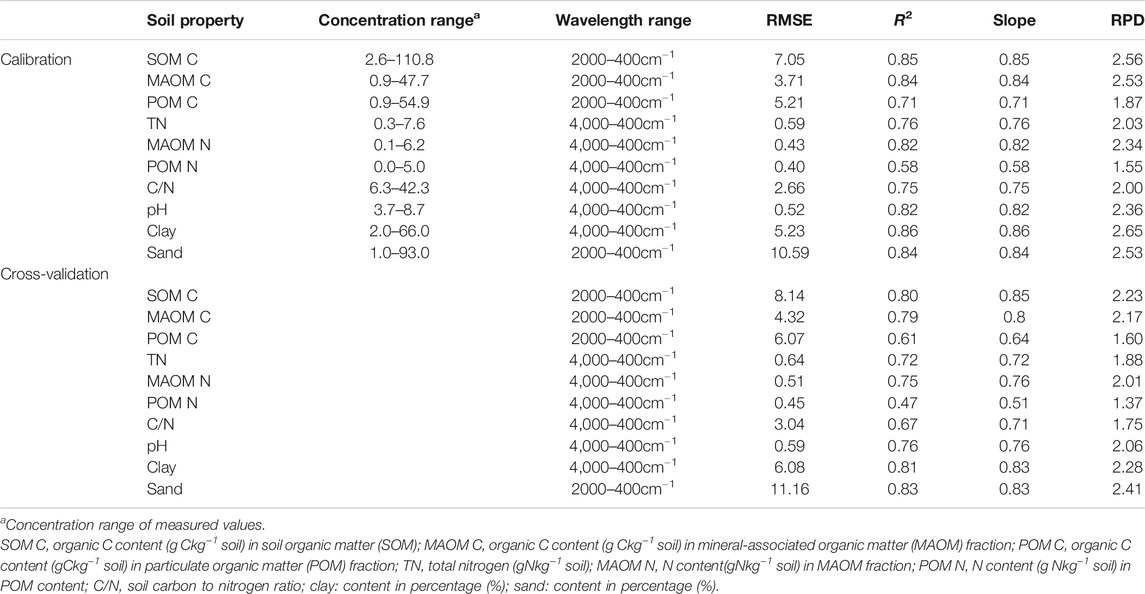
TABLE 2. Results obtained for the mid infrared spectroscopy coupled with the partial least square model regression selecting the best pre-treatment (Savitzky-Golay first derivative, 3-point smoothing, 2-polynomial). The performance of PLS models is reported in terms of root mean square error (RMSE), coefficient of determination for calibration (R2), slope of regression model and the ratio of prediction to deviation (RPD).
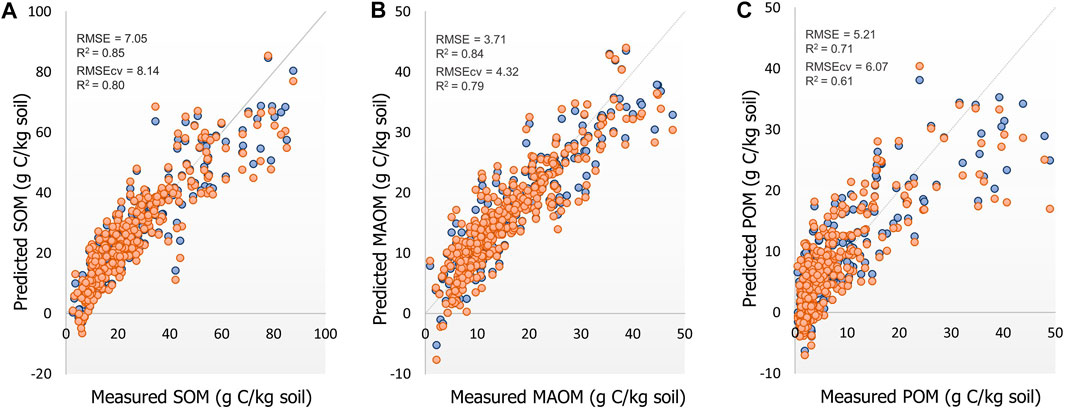
FIGURE 4. Scatter plots for predictions of (A) carbon in total soil organic matter (SOM), (B) carbon in mineral-associated organic matter (MAOM); and (C) carbon in particulate organic matter (POM) resulting from continental-scale calibrations using mid infrared spectroscopy and partial least square regression. The model calibration is denoted in blue circles and predictions on the calibration set during cross-validation is denoted in oranges circles. The 1:1 line is shown for reference in each plot.
For N pools, the use of the full MIR range demonstrated a better performance than models constructed using a wavelength selection (Table 2). Although the prediction of N in total SOM and MAOM was less satisfactory than for C, good results were also achieved for these variables (R2 = 0.64–0.51; RPD = 1.88–2.08, respectively) (Figures 5A,B). Regarding POM N (Figure 5C), a poor prediction was obtained and insufficient for most applications, showing similar behavior to POM-C (R2 = 0.47, RPD = 1.37).
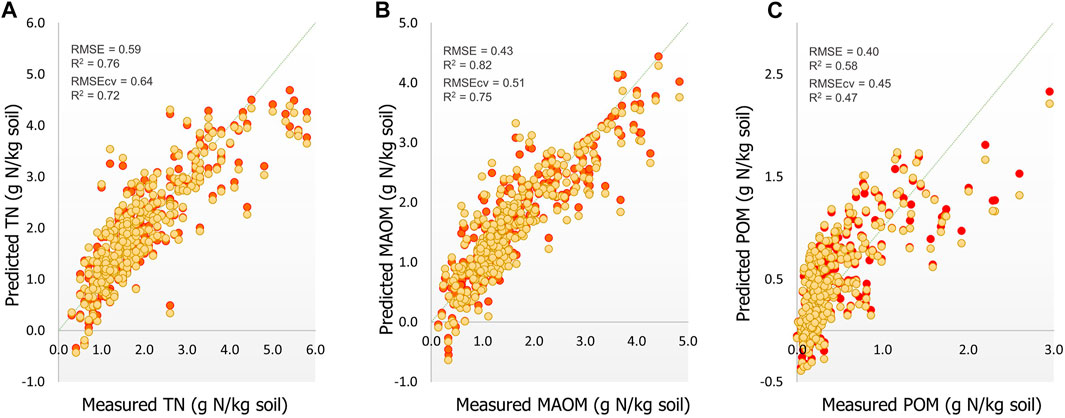
FIGURE 5. Scatter plots for predictions of (A) total soil nitrogen (TN), (B) nitrogen content in mineral-associate organic matter (MAOM N) and (C) nitrogen content in particulate organic matter (POM N) resulting from global calibrations from a large-scale dataset using mid infrared spectroscopy and partial least square regression. The model calibration is denoted in red circles and predictions on the calibration set during cross-validation is denoted in yellow circles. The 1:1 line is shown for reference in each plot.
Prediction of Clay, pH, Soil C/N Ratio and Sand
The distribution of C and N in MAOM and POM fractions is highly controlled by predictors such as C/N ratio, pH, clay and sand (Figure 2). We compared the PLS model performance for the aforementioned soil properties (Table 2; Figure 6). Predictions for soil C/N (Figure 6A) were not improved (R2 = 0.67; RPD = 1.75) when compared with the individual predictions for C and N in SOM. For pH (Figure 6B), the best PLS-MIR model was developed using the 400–4,000cm−1 spectral range, which showed a good prediction performance (R2 = 0.76; RPD = 2.06). Regarding the soil texture variables (Figures 6C,D), similar accuracies and excellent estimates were achieved for both clay (R2 = 0.81; RPD = 2.28) and sand (R2 = 0.83; RPD = 2.41).
FIGURE 6. Scatter plots for predictions of (A) soil C/N ratio, (B) pH, (C) clay and (D) sand resulting from global calibrations from a large-scale dataset using MIR spectroscopy and PLS regression. The model calibration is denoted in green circles and predictions on the calibration set during cross-validation is denoted in blue circles. The 1:1 line is shown for reference in each plot.
Discussion
Large spectral libraries demand rapid and inexpensive methods such as infrared spectroscopy to screen and determine soil C stocks and soil properties. However, the wide range of soil-forming factors that influence soil spectroscopic characteristics may decrease the predictive ability of models when they are used to estimate soil properties at a continental areas. We explored the relationship between MIR spectral features and C pools and evaluated the ability of MIR spectroscopy to predict soil C content and variables associated with its dynamic, at continental scale.
Linking MIR Spectral Information to Soil C Pool
Understanding and capturing the spatial variability of soil spectral signatures at regional to continental scales is relevant to developing a robust global calibration strategy and to subsequently improving the predictive ability of soil C models. Our results showed inherent soil spectral heterogeneity associated with climate and land use (Figure 1). Likewise, climate and land use are widely accepted as the most significant drivers of C content when we evaluate their distribution at large geographical scale (Rial et al., 2017; Ogle et al., 2019). Our data show that soils under drier conditions tend to have a relatively high soil pH (Figure 2), which is not surprising given the existence of calcareous materials characterized by the presence of carbonates at the 2,513cm−1 band, concurrent with low organic matter content (Asgari et al., 2020). In semiarid environments, the decline in primary productivity and increase in litter decomposition due to higher temperatures and intermittent precipitation has resulted in less C storage when compared to colder and more humid conditions (Guo and Gifford, 2002). In fact, we observed low POM C content in agricultural systems under semiarid conditions (Figure 2). In addition, we observed a higher proportion of C in the MAOM fraction (f MAOM) and clay content. The latter responses are consistent with the correlation observed for the clay band at 3,620cm−1, as well as the presence of organic matter absorbance around the 1,100cm−1 band of polysaccharides (Rasmussen et al., 2018).
MIR spectroscopy has been used for qualitative analysis of various soil properties because it contains extensive information on the functional moieties of organic matter (Ramírez et al., 2020; Dudek et al., 2021). Additionally, it is a useful tool to explore spectral patterns associated with soil C stocks (Stumpe et al., 2011). For example, as in many previous studies, we also found aliphatic CH spectral bands at 2,926cm−1 (Figure 2), which could be used to rapidly estimate soil C, and N concentrations of northern cold region soils (Matamala et al., 2017). Likewise, we also found distinct bands in the region between 1,510 and 1,230cm−1, which have already been reported in association with the decomposition of forest litter in soils (Haberhauer et al., 1998). It should be noted, however, that band assignments are not absolute but rather are an approximation in the sense that a band for a particular compound is assigned at a specific wavenumber.
The MIR spectral bands can be used as valuable data to monitor major chemical changes from different land use systems. It is interesting to note that although MIR is not a high-resolution tool, the information provided by MIR spectroscopy was able to elucidate spectral patterns across different C pools. For example, the spectral patterns between POM and MAOM involved variation in absorbances between the 2,800 and 1,000cm−1 region (Figure 3). This spectral region is characterized by silicates (Si-O vibrations) and different C functional groups, including aliphatic C–H, carbonyls, aromatic C and C-H stretching typically found in carbohydrates (Parikh et al., 2014). This analysis revealed that POM displays high spectral similarities to SOM C in woodland systems, while cropland and grassland did not. Furthermore, in the cropland systems, we found similar spectral patterns between SOM and MAOM, as well as a substantial decrease of organic C absorbances in the POM fraction. This is consistent with the relative distribution of C (f MAOM) between these fractions (Supplementary Table S1) with a higher amount of C in POM in woodland soils with overall higher C content and lower disturbance as compared to grassland and cropland soils (Lugato et al., 2021).
Prediction of Soil C and N Pools and Other Soil Properties
We achieved accurate global predictions using MIR coupled with PLS spectroscopy for C and N pools at a continental scale. In the absence of some of the wavelengths containing unrelated information, the wavelengths 2000–400cm−1 had a substantial influence on the PLS model for the quantification of C in SOM and MAOM. As often reported for soil C, the multiple and small bands around 830–400cm−1, as well as the fingerprint region (1,500cm−1–650cm−1) contribute to improve the predictive ability of PLS models (Cécillon et al., 2012; Knox et al., 2015). Our results showed that MIR produced accurate predictions to determine C and N in SOM and MAOM (Figure 4). Typically, the prediction accuracies reported for total soil N are similar to the accuracies of the SOM C models. This is mainly because most of the N is bound in the SOM, and thus, soil N is often tightly correlated to total soil C (Schirrmann et al., 2013). C and N in POM were less accurately predicted than other C or N pools (Figures 4C, 5C). For example, our prediction yielded a low accuracy for POM C (R2 = 0.61), indicating that the PLS calibration could not capture the variability over a wide range of 0.46–54.9gCkg−1. Although previous studies have reported satisfactory accuracies for C prediction in the POM fraction using MIR spectroscopy (R2 = 0.71–0.83), they were carried out in the 0.2–16.8gCkg−1 range of concentration (Janik et al., 2007; Baldock et al., 2018). However, recent studies using heterogeneous soil samples at a country level similarly reported that SOM C and MAOM C were better predicted than POM C (Sanderman et al., 2020). These results can be attributed to the fact that POM is more heterogeneous than MAOM when isolated by size, since it includes both a light fraction not associated with minerals, as well as heavy coarse organic matter associated with sand-size minerals (Lavallee et al., 2020). Therefore, the spectra are subject to a high degree of variability due to the various decomposition stages of plant residues, and to the range of contribution of compounds of microbial origin which adversely impact the calibration accuracy. Furthermore, the light component of POM mostly consists of partially decomposed plant material, so differences in the vegetation cover (woody plant cover vs grasses, for example) affect the chemical character of POM (Soucémarianadin et al., 2019).
We found that C estimations in SOM were more reliable than those provided by studies that used NIR spectroscopy in the same large-scale European dataset (Nocita et al., 2014; Rial et al., 2017; Ward et al., 2019). For example, the selection of sample subsets by k-Means clustering achieved less accurate predictions (R2 = 0.67; RPD = 1.74) (Ward et al., 2019). In particular, MIR spectra contain fundamental bands for several organic and mineral moieties, while soil vis-NIR ranges are largely non-specific, consisting of weak, broad and overlapping absorption bands (Reeves, 2010). Furthermore, we found that MIR was highly sensitive to soil mineral composition, and appeared well equipped to determine pH and soil texture, such as clay and sand using PLS models (Figure 6). It is important to considerer we used a size separation of POM and MAOM. Therefore, as mentioned above, the organic matter associated to sand-size particles was considered POM, and could have contributed proportionally more to this fraction in coarse-textured soils. However, despite this limitation, we suggest that the influence of sand content was probably low for the prediction of C and N in POM. MIR spectra present greater signatures in quartz and clay minerals, which provide more robust calibrations to predict clay and sand content (Viscarra Rossel et al., 2006; Reeves, 2010). Therefore, in the presence of quartz-rich sand content, we clearly would expect more accurate predictions for POM than those achieved in this study. Another limitation of our study was the negative predictions obtained for low concentration values in some variables of interest. For example, negative predicted values were obtained for measured C content below 6.5gCkg−1 soil, due to the wide range of concentrations used in the analysis (2.6–110.8gCkg−1 soil). Several authors have been able to overcome this limitation, improving their predictions by using machine learning based non-linear regression methods, covariate adjustment (i.e., sand content) and by dividing the global library into small homogeneous datasets (Nocita et al., 2014; Rial et al., 2017; Ward et al., 2019).
Conclusion
MIR spectra coupled with PLS regression is a promising and reliable tool for predicting soil organic C, total N, C and N in MAOM, as well as the critical factors controlling their accumulation. The present study is a first attempt to estimate C and N content in MAOM and POM fractions using MIR spectroscopy in a heterogeneous set of soil samples at a continental scale. A wavelength selection in the 2000 to 1,000cm−1 range substantially influences the C estimate accuracy in bulk soils and the MAOM fraction, while the estimates of C and N in POM need to be further studied. Besides the ability of MIR to predict different soil properties, MIR spectroscopy was able to differentiate spectral features associated with SOM pools in response to changes in land use and climate. This approach can enable large scale monitoring of soil C changes as a cheaper and higher throughput alternative to stock quantification methods that are more accurate but also more expensive and involve laborious sample preparation. Considering the effectiveness of MIR spectroscopy in resolving variations in organic and mineralogical composition, future work still is needed on an extensive MIR spectral database to capture the spatial variability of soil properties at different geographical scales. This is critical for the comprehension of environmental interrelationships affecting C distribution and increasing the robustness of predictions.
Data Availability Statement
The raw data supporting the conclusion of this article will be made available by the authors, without undue reservation.
Author Contributions
PBR, MFC and FJC developed the research concepts, interpreted the data and wrote the paper. PBR conducted the data and statistical analyses. MH conducted all the soil organic matter fractionation and contributed to writing of the methods. EL contributed the LUCAS dataset and provided edits and comments to the paper.
Funding
This work was supported by the JRC (purchase order #D. B720517) and the National Agency for Research and Development of Chile (ANID), Becas-Chile postdoctoral fellowship No. 74200022.
Conflict of Interest
The authors declare that the research was conducted in the absence of any commercial or financial relationships that could be construed as a potential conflict of interest.
Supplementary Material
The Supplementary Material for this article can be found online at: https://www.frontiersin.org/articles/10.3389/fenvs.2021.634472/full#supplementary-material
References
Arrouays, D., Grundy, M. G., Hartemink, A. E., Hempel, J. W., Heuvelink, G. B. M., Hong, S. Y., et al. (2014). GlobalSoilMap. Adv. Agron. 125, 93–134. doi:10.1016/B978-0-12-800137-0.00003-0
Asgari, N., Ayoubi, S., Demattê, J. A. M., and Dotto, A. C. (2020). Carbonates and Organic Matter in Soils Characterized by Reflected Energy from 350-25000 Nm Wavelength. J. Mt. Sci. 17, 1636–1651. doi:10.1007/s11629-019-5789-9
Baldock, J. A., Beare, M. H., Curtin, D., and Hawke, B. (2018). Stocks, Composition and Vulnerability to Loss of Soil Organic Carbon Predicted Using Mid-infrared Spectroscopy. Soil Res. 56, 468–480. doi:10.1071/SR17221
Ballabio, C., Lugato, E., Fernández-Ugalde, O., Orgiazzi, A., Jones, A., Borrelli, P., et al. (2019). Mapping LUCAS Topsoil Chemical Properties at European Scale Using Gaussian Process Regression. Geoderma 355, 113912. doi:10.1016/j.geoderma.2019.113912
Bellon-Maurel, V., Fernandez-Ahumada, E., Palagos, B., Roger, J.-M., and McBratney, A. (2010). Critical Review of Chemometric Indicators Commonly Used for Assessing the Quality of the Prediction of Soil Attributes by NIR Spectroscopy. Trac Trends Anal. Chem. 29, 1073–1081. doi:10.1016/j.trac.2010.05.006
Calderón, F. J., Culman, S., Six, J., Franzluebbers, A. J., Schipanski, M., Beniston, J., et al. (2017). Quantification of Soil Permanganate Oxidizable C (POXC) Using Infrared Spectroscopy. Soil Sci. Soc. America J. 81, 277–288. doi:10.2136/sssaj2016.07.0216
Cambardella, C. A., and Elliott, E. T. (1992). Particulate Soil Organic-Matter Changes across a Grassland Cultivation Sequence. Soil Sci. Soc. America J. 56, 777–783. doi:10.2136/sssaj1992.03615995005600030017x
Cécillon, L., Certini, G., Lange, H., Forte, C., and Strand, L. T. (2012). Spectral Fingerprinting of Soil Organic Matter Composition. Org. Geochem. 46, 127–136. doi:10.1016/j.orggeochem.2012.02.006
Chenu, C., Angers, D. A., Barré, P., Derrien, D., Arrouays, D., and Balesdent, J. (2019). Increasing Organic Stocks in Agricultural Soils: Knowledge Gaps and Potential Innovations. Soil Tillage Res. 188, 41–52. doi:10.1016/j.still.2018.04.011
Christensen, B. T. (2001). Physical Fractionation of Soil and Structural and Functional Complexity in Organic Matter Turnover. Eur. J. Soil Sci. 52, 345–353. doi:10.1046/j.1365-2389.2001.00417.x
Córdova, S. C., Olk, D. C., Dietzel, R. N., Mueller, K. E., Archontouilis, S. V., and Castellano, M. J. (2018). Plant Litter Quality Affects the Accumulation Rate, Composition, and Stability of Mineral-Associated Soil Organic Matter. Soil Biol. Biochem. 125, 115–124. doi:10.1016/j.soilbio.2018.07.010
Cotrufo, M. F., Ranalli, M. G., Haddix, M. L., Six, J., and Lugato, E. (2019). Soil Carbon Storage Informed by Particulate and Mineral-Associated Organic Matter. Nat. Geosci. 12, 989–994. doi:10.1038/s41561-019-0484-6
Cotrufo, M. F., Soong, J. L., Horton, A. J., Campbell, E. E., Haddix, M. L., Wall, D. H., et al. (2015). Formation of Soil Organic Matter via Biochemical and Physical Pathways of Litter Mass Loss. Nat. Geosci 8, 776–779. doi:10.1038/NGEO2520
Dudek, M., Kabała, C., Łabaz, B., Mituła, P., Bednik, M., and Medyńska-Juraszek, A. (2021). Mid-Infrared Spectroscopy Supports Identification of the Origin of Organic Matter in Soils. Land 10, 215. doi:10.3390/land10020215
Guo, L. B., and Gifford, R. M. (2002). Soil Carbon Stocks and Land Use Change: A Meta Analysis. Glob. Chang. Biol. 8, 345–360. doi:10.1046/j.1354-1013.2002.00486.x
Haberhauer, G., Rafferty, B., Strebl, F., and Gerzabek, M. H. (1998). Comparison of the Composition of Forest Soil Litter Derived from Three Different Sites at Various Decompositional Stages Using FTIR Spectroscopy. Geoderma 83, 331–342. doi:10.1016/S0016-7061(98)00008-1
Harris, D., Horwáth, W. R., and van Kessel, C. (2001). Acid Fumigation of Soils to Remove Carbonates Prior to Total Organic Carbon or CARBON-13 Isotopic Analysis. Soil Sci. Soc. Am. J. 65, 1853–1856. doi:10.2136/sssaj2001.1853
Hollis, J. M., Hannam, J., and Bellamy, P. H. (2012). Empirically-derived Pedotransfer Functions for Predicting Bulk Density in European Soils. Eur. J. Soil Sci. 63, 96–109. doi:10.1111/j.1365-2389.2011.01412.x
Janik, L. J., Skjemstad, J. O., Shepherd, K. D., and Spouncer, L. R. (2007). The Prediction of Soil Carbon Fractions Using Mid-infrared-partial Least Square Analysis. Soil Res. 45, 73–81. doi:10.1071/SR06083
Knox, N. M., Grunwald, S., McDowell, M. L., Bruland, G. L., Myers, D. B., and Harris, W. G. (2015). Modelling Soil Carbon Fractions with Visible Near-Infrared (VNIR) and Mid-infrared (MIR) Spectroscopy. Geoderma 239-240, 229–239. doi:10.1016/j.geoderma.2014.10.019
Lavallee, J. M., Soong, J. L., and Cotrufo, M. F. (2020). Conceptualizing Soil Organic Matter into Particulate and Mineral‐associated Forms to Address Global Change in the 21st Century. Glob. Change Biol. 26, 261–273. doi:10.1111/gcb.14859
Lugato, E., Lavallee, J. ., Haddix, M., Panagos, P., and Cotrufo, M. (2021). Different Climate Sensitivity of Particulate and Mineral Associated Soil Organic Matter. Nat. Geosci.. in press. doi:10.5194/gmd-2021-16-rc1
Lützow, M. v., Kögel-Knabner, I., Ekschmitt, K., Matzner, E., Guggenberger, G., Marschner, B., et al. (2006). Stabilization of Organic Matter in Temperate Soils: Mechanisms and Their Relevance under Different Soil Conditions - a Review. Eur. J. Soil Sci. 57, 426–445. doi:10.1111/j.1365-2389.2006.00809.x
Matamala, R., Calderón, F. J., Jastrow, J. D., Fan, Z., Hofmann, S. M., Michaelson, G. J., et al. (2017). Influence of Site and Soil Properties on the DRIFT Spectra of Northern Cold-Region Soils. Geoderma 305, 80–91. doi:10.1016/j.geoderma.2017.05.014
Mikutta, R., Turner, S., Schippers, A., and Reports, N. G.-S. (2019). U.Microbial and Abiotic Controls on Mineral-Associated Organic Matter in Soil Profiles along an Ecosystem Gradient. nature.com 9, 1–9. Available at: https://www.nature.com/articles/s41598-019-46501-4 (Accessed March 29, 2021). doi:10.1038/s41598-019-46501-4
Nocita, M., Stevens, A., Toth, G., Panagos, P., van Wesemael, B., and Montanarella, L. (2014). Prediction of Soil Organic Carbon Content by Diffuse Reflectance Spectroscopy Using a Local Partial Least Square Regression Approach. Soil Biol. Biochem. 68, 337–347. doi:10.1016/j.soilbio.2013.10.022
Ogle, S. M., Alsaker, C., Baldock, J., Bernoux, M., Breidt, F. J., McConkey, B., et al. (2019). Climate and Soil Characteristics Determine where No-Till Management Can Store Carbon in Soils and Mitigate Greenhouse Gas Emissions. Sci. Rep. 9, 1–8. doi:10.1038/s41598-019-47861-7
Orgiazzi, A., Ballabio, C., Panagos, P., Jones, A., and Fernández‐Ugalde, O. (2018). LUCAS Soil, the Largest Expandable Soil Dataset for Europe: a Review. Eur. J. Soil Sci. 69, 140–153. doi:10.1111/ejss.12499
Parikh, S. J., Goyne, K. W., Margenot, A. J., Mukome, F. N. D., and Calderón, F. J. (2014). Soil Chemical Insights provided through Vibrational Spectroscopy. Adv. Agron. 126, 1–148. doi:10.1016/B978-0-12-800132-5.00001-8
Ramírez, P. B., Calderón, F. J., Fonte, S. J., Santibáñez, F., and Bonilla, C. A. (2020). Spectral Responses to Labile Organic Carbon Fractions as Useful Soil Quality Indicators across a Climatic Gradient. Ecol. Indicators 111, 106042. doi:10.1016/j.ecolind.2019.106042
Rasmussen, C., Heckman, K., Wieder, W. R., Keiluweit, M., Lawrence, C. R., Berhe, A. A., et al. (2018). Beyond Clay: towards an Improved Set of Variables for Predicting Soil Organic Matter Content. Biogeochemistry 137, 297–306. doi:10.1007/s10533-018-0424-3
Reeves, J. B. (2010). Near- versus Mid-infrared Diffuse Reflectance Spectroscopy for Soil Analysis Emphasizing Carbon and Laboratory versus On-Site Analysis: Where Are We and what Needs to Be Done?. Geoderma 158, 3–14. doi:10.1016/j.geoderma.2009.04.005
Rial, M., Martínez Cortizas, A., and Rodríguez-Lado, L. (2017). Understanding the Spatial Distribution of Factors Controlling Topsoil Organic Carbon Content in European Soils. Sci. Total Environ. 609, 1411–1422. doi:10.1016/j.scitotenv.2017.08.012
Sanderman, J., Savage, K., and Dangal, S. R. S. (2020). Mid‐infrared Spectroscopy for Prediction of Soil Health Indicators in the United States. Soil Sci. Soc. Am. J. 84, 251–261. doi:10.1002/saj2.20009
Savitzky, A., and Golay, M. J. E. (1964). Smoothing and Differentiation of Data by Simplified Least Squares Procedures. Anal. Chem. 36, 1627–1639. doi:10.1021/ac60214a047
Schirrmann, M., Gebbers, R., and Kramer, E. (2013). Performance of Automated Near-Infrared Reflectance Spectrometry for Continuous In Situ Mapping of Soil Fertility at Field Scale. Vadose Zone J. 12, 20120199. doi:10.2136/vzj2012.0199
Seybold, C. A., Ferguson, R., Wysocki, D., Bailey, S., Anderson, J., Nester, B., et al. (2019). Application of Mid‐Infrared Spectroscopy in Soil Survey. Soil Sci. Soc. Am. J. 83, 1746–1759. doi:10.2136/sssaj2019.06.0205
Soriano-Disla, J. M., Janik, L. J., Viscarra Rossel, R. A., MacDonald, L. M., and McLaughlin, M. J. (2014). The Performance of Visible, Near-, and Mid-infrared Reflectance Spectroscopy for Prediction of Soil Physical, Chemical, and Biological Properties. Appl. Spectrosc. Rev. 49, 139–186. doi:10.1080/05704928.2013.811081
Soucémarianadin, L., Cécillon, L., Chenu, C., Baudin, F., Nicolas, M., Girardin, C., et al. (2019). Heterogeneity of the Chemical Composition and Thermal Stability of Particulate Organic Matter in French Forest Soils. Geoderma 342, 65–74. doi:10.1016/j.geoderma.2019.02.008
Stumpe, B., Weihermüller, L., and Marschner, B. (2011). Sample Preparation and Selection for Qualitative and Quantitative Analyses of Soil Organic Carbon with Mid-infrared Reflectance Spectroscopy. Eur. J. Soil Sci. 62, 849–862. doi:10.1111/j.1365-2389.2011.01401.x
UNEP (1997). World Atlas of Desertification 2ED. New York: United Nations Environ. ProgramAvailable at: http://hdl.handle.net/20.500.11822/30300.
Viscarra Rossel, R. A., Walvoort, D. J. J., McBratney, A. B., Janik, L. J., and Skjemstad, J. O. (2006). Visible, Near Infrared, Mid Infrared or Combined Diffuse Reflectance Spectroscopy for Simultaneous Assessment of Various Soil Properties. Geoderma 131, 59–75. doi:10.1016/j.geoderma.2005.03.007
Vohland, M., Besold, J., Hill, J., and Fründ, H.-C. (2011). Comparing Different Multivariate Calibration Methods for the Determination of Soil Organic Carbon Pools with Visible to Near Infrared Spectroscopy. Geoderma 166, 198–205. doi:10.1016/j.geoderma.2011.08.001
Wang, X., Jelinski, N. A., Toner, B., and Yoo, K. (2019). Long-term Agricultural Management and Erosion Change Soil Organic Matter Chemistry and Association with Minerals. Sci. Total Environ. 648, 1500–1510. doi:10.1016/j.scitotenv.2018.08.110
Ward, K. J., Chabrillat, S., Neumann, C., and Foerster, S. (2019). A Remote Sensing Adapted Approach for Soil Organic Carbon Prediction Based on the Spectrally Clustered LUCAS Soil Database. Geoderma 353, 297–307. doi:10.1016/j.geoderma.2019.07.010
Westad, F., and Marini, F. (2015). Validation of Chemometric Models - A Tutorial. Analytica Chim. Acta 893, 14–24. doi:10.1016/j.aca.2015.06.056
Keywords: soil carbon, infrared spectroscopy, mineral associated soil organic matter, particulate organic matter, chemometric calibrations, LUCAS soil
Citation: Ramírez PB, Calderón FJ, Haddix M, Lugato E and Cotrufo MF (2021) Using Diffuse Reflectance Spectroscopy as a High Throughput Method for Quantifying Soil C and N and Their Distribution in Particulate and Mineral-Associated Organic Matter Fractions. Front. Environ. Sci. 9:634472. doi: 10.3389/fenvs.2021.634472
Received: 27 November 2020; Accepted: 26 April 2021;
Published: 17 May 2021.
Edited by:
Hans-Peter Schmidt, Ithaka Institute, SwitzerlandReviewed by:
Carsten W. Mueller, University of Copenhagen, DenmarkGerrit Angst, Institute of Soil Biology (ASCR), Czechia
Copyright © 2021 Ramírez, Calderón, Haddix, Lugato and Cotrufo. This is an open-access article distributed under the terms of the Creative Commons Attribution License (CC BY). The use, distribution or reproduction in other forums is permitted, provided the original author(s) and the copyright owner(s) are credited and that the original publication in this journal is cited, in accordance with accepted academic practice. No use, distribution or reproduction is permitted which does not comply with these terms.
*Correspondence: Francisco J. Calderón, francisco.calderon@oregonstate.edu