


Abstract
The inward particle flux associated with the global long-lived mode (LLM) during the L–I–H transition on HL-2A tokamak has been measured. The inward particle flux arises from the phase change between density and radial velocity fluctuations, where density and velocity fluctuations are strongly correlated with magnetic fluctuations of LLM. Moreover, the radial velocity and its gradient rather than poloidal flow shear play an important role in particle transport associated with the large-scale mode. The strong nonlinear coupling between LLM and ambient turbulence has been confirmed, and this may contribute to most of the inward particle flux in the LLM during the I-phase state.
Export citation and abstract BibTeX RIS

Original content from this work may be used under the terms of the Creative Commons Attribution 4.0 licence. Any further distribution of this work must maintain attribution to the author(s) and the title of the work, journal citation and DOI.
1. Introduction
Turbulent transport often occurs in a radially outward direction and it usually exceeds classical or neoclassical estimation level by more than an order of magnitude [1]. Recent theoretical [2, 3] and experimental [4, 5] research have found that the reduction of the cross-phase term between density and potential fluctuations can also suppress turbulent transport. Theoretically, the sign change of the cross-phase term will reverse the transport direction to radially inward, and this inward particle flux has been observed on multiple magnetic configurations such as stellarators [6, 7] and tokamaks [8–10]. Inward flux can carry particle and heat from outside to the inside of the plasma, which is naturally related to the enhancements of density gradient and plasma confinement [7, 11, 12]. Most studies have confirmed that the shear flow induces the cross-phase shift is the primary factor that drives the inward flux [3, 7, 13]. Recent experiments begin to pay attention to the energy exchanging between zonal flow and turbulence, and they suggest that the total Reynolds work plays a crucial role in changing the transport direction [14, 15].
In a weak magnetic shear plasma, the high-pressure gradient near the radial position with the lowest safety factor can destabilize low- ideal modes with
  (m, n are the poloidal and toroidal mode numbers, respectively). When β increases significantly while the q-profile becomes flat, the plasma starts to become unstable and a low
  kink-ballooning mode or an internal mode can be generated [16]. Long-lived mode (LLM) is often observed in plasmas heated by neutral beam injection (NBI) on HL-2A tokamak [17] and other devices [18]. Typically, LLM originates from the pressure gradient in the core plasma (q ≃ 1 surface) with a safety factor profile having either a broad low-shear region or a weakly reversed magnetic shear [19, 20]. LLM can reduce the number of fast ions and slow down the plasma rotation, even degrade the energy confinement [18, 19]. Besides, LLM can consequently circumvent bursty sawteeth crash and fishbones in the long pulse with a quiescent state [19]. So, the steady LLM can act as a gentle course to release energy in the core plasma without leading to extremely high transient heat loads on the first wall [21]. Furthermore, long-live mode originates from the core and has a global magnetic fluctuation components. It is found that magnetic fluctuation-induced particle flux is much less than electrostatic fluctuation-induced particle transport experimentally.
The fluctuation-induced radial particle flux usually takes the following form:  [22], where
  is the radial velocity fluctuation from the
E
×
B
drift, Bϕ
is the toroidal magnetic field and
is the radial velocity fluctuation from the
E
×
B
drift, Bϕ
is the toroidal magnetic field and  denotes the ensemble average. The magnetic fluctuation-induced particle transport in the LLM is an order of magnitude less than electrostatic fluctuation-induced particle transport in this experiment. So, we ignore the effect of magnetic fluctuation here. The frequency-resolved radial particle flux can be expressed as
  [23]. Here, γnV
(f) and αnV
(f) are the coherence and cross-phase between fluctuations of electron density and radial velocity, respectively; Pn
(f) and PV
(f) are their auto-power spectra. The negative particle flux denotes its direction radially inward. Obviously, the cosine of cross-phase, i.e., cos αnV
(f), is the only term that determines the direction of fluctuation-induced particle flux.
[23]. Here, γnV
(f) and αnV
(f) are the coherence and cross-phase between fluctuations of electron density and radial velocity, respectively; Pn
(f) and PV
(f) are their auto-power spectra. The negative particle flux denotes its direction radially inward. Obviously, the cosine of cross-phase, i.e., cos αnV
(f), is the only term that determines the direction of fluctuation-induced particle flux.
To investigate the origin of inward flux, starting from the continuity equation [24, 25], we have  , where n,
  , and Se are the electron density, velocity and source term. Here, n and
  can be decomposed into their equilibrium (n0 and V0) and fluctuating (
 and
and  ) components, i.e.,
  and
and  , respectively. We focus on the radial velocity fluctuations associated with radial particle flux. After substituting the decomposed
  and
and  into continuity equation, multiplying by
  , and performing an average
  over the magnetic flux surface, we have the energy equation for electron density fluctuations:
Contributions from the higher-order nonlinear interactions and dissipation effects are not considered here. The source term Se is also not considered here, but it will discuss under the specific conditions later. For simplicity, the first term on the right-hand side of the equation represents linear advection, which can also be written as −Γr,fluc∂r n0, and this indicates the turbulent flux gets energy from the background gradient.
For tokamaks, the density radial gradient is much larger than the other two directions  , the equation can reduce to one-dimensional. Considering the incompressible flow
  , the radial particle flux can also be written as:

Here, the density and velocity fluctuations are decomposed into different wavenumber modes as  and
and  respectively, where
  . The time derivative of the square of density fluctuation is two orders of magnitude lower than other linear terms of equation (1), which can consider the plasma is in a quasi-steady state. The first term on the right-hand side is a linear term, which indicates the phase shift between density fluctuation and its gradient induced particle flux. The second term on the right-hand side results from nonlinear advection, which is a triple product of three fluctuating quantities (
 ,
,  , and
, and  ) and describes the nonlinear three-wave interaction among fluctuations with mode numbers k1, k2, and k3. Depending on the sign, the linear and nonlinear advection terms can act to drive radially inward or outward flux. It should be noted that rotation of the modes with wavenumbers k transfers their spatial structure in the plasma frame into a temporal evolution in the laboratory frame. Therefore, we investigate particle transport and mode–mode coupling in the frequency domain
  .
.
In this paper, we report the experiments of fluctuation-induced inward particle flux in the LLM during L–I–H transition on HL-2A tokamak and investigate the balance in the equation (1) experimentally to understand the origin of inward flux. Based on the direct measurements of these linear terms in the equation (2), it has been found that density fluctuation and its gradient contribute to inward particle flux partially due to non-zero pinch velocity. Besides, the radial velocity gradient shows a strong correlation with the density fluctuation gradient of LLM, which reveals the importance of the radial flow gradient in the particle flux direction. The strong nonlinear coupling between the magnetic fluctuations of LLM and broadband turbulence has been observed during the I-phase, which indicates turbulence can strongly modulate the LLM and this may be related to the inward flux contributed by the nonlinear term of equation (2).
The remainder of this paper is organized as follows. Section 2 introduces the experimental setup. The experiments of inward particle flux in the LLM during L–H transition are described in section 3. The origin of the inward particle flux is analyzed in section 4. Finally, the conclusion and some discussions are given in section 5.
2. Experimental setup
The experiments were conducted on HL-2A tokamak [26], which is a medium-sized tokamak with major radius of R = 165 cm and minor radius of a = 40 cm, the toroidal magnetic field Bϕ
= 1.3 T. The typical L–I–H transition discharge waveforms on HL-2A are shown in figure 1. Typical plasma current Ip = 140–150 kA and line-averaged electron density  , as shown in figures 1(a) and (b). Tangential co-current NBI was applied with a total power of 800 kW and from 600 ms to 1100 ms shown in figure 1(a). The radiation intensity is obtained by bolometer diagnostic, as shown in figure 1(d). The magnetic field probe array on HL-2A consists of 18 Mirnov coils, which measure the magnetic fluctuations in two directions (including the radial direction and the poloidal direction). The soft x-ray (SXR) diagnostic system has 100 channels, which are grouped and poloidally distributed in five different ports.

Figure 1. Time evolution of (a) plasma current Ip and NBI heating power, (b) line-averaged density, (c) Dα signal, (d) radiation intensity measured by bolometer, (e) the core SXR signal in the radial location at r = 16.2 cm. The red vertical dash lines denote L–I transition start moment, and the purple vertical dash lines denote I–H transition start moment.
Download figure:
Standard image High-resolution imageDensity and electric field fluctuation measurements are carried out by the radially reciprocating probe system. The fast reciprocating Langmuir probe array contains two poloidally separated probe arrays A and B at a distance of 80 mm [27]. The probe array A includes two standard four-tip probes which are radially separated by Δr = 2 mm, and a pair of Mach probe in the toroidal direction. The probe array B contains four single probes arranged in a square and a set of 3D magnetic probes inside the Boron–Nitride shell which can measure the magnetic fluctuations from three directions. From probe array A's standard four-tip probe setup, the electron temperature can be deduced from the expression  , where
  is the mean value of two poloidal floating potentials and ϕ+ is the positive bias potential of the double probe from the four-tip probe. The edge electron density ne can be obtained from the ion saturation current Is and electron temperature Te (since
  ). The poloidal electric field Eθ
can be deduced from the differential of two floating potentials ϕf measured by two poloidally separated floating potential probes. By neglecting the effect of electron temperature, the poloidal electric field can be derived as Eθ
= −(ϕf,θ2 − ϕf,θ1)/δθ
. Here, Δθ
= 7 mm represents the poloidal distance between two poloidal floating potentials from the four-tip probe. In this paper, the positive poloidal direction is set along the ion diamagnetic drift direction. The radial electric field is calculated by two closest floating potentials from two different radial positions as Er = −(ϕf,r2 − ϕf,r1)/Δr. With these electric field measurements, we can infer velocity and velocity gradient. Here, Vθ
and Vr are the equilibrium components of poloidal velocity and radial velocity. The poloidal velocity shear takes the form of
). The poloidal electric field Eθ
can be deduced from the differential of two floating potentials ϕf measured by two poloidally separated floating potential probes. By neglecting the effect of electron temperature, the poloidal electric field can be derived as Eθ
= −(ϕf,θ2 − ϕf,θ1)/δθ
. Here, Δθ
= 7 mm represents the poloidal distance between two poloidal floating potentials from the four-tip probe. In this paper, the positive poloidal direction is set along the ion diamagnetic drift direction. The radial electric field is calculated by two closest floating potentials from two different radial positions as Er = −(ϕf,r2 − ϕf,r1)/Δr. With these electric field measurements, we can infer velocity and velocity gradient. Here, Vθ
and Vr are the equilibrium components of poloidal velocity and radial velocity. The poloidal velocity shear takes the form of  , and Vθ
can be obtained by using the time delay estimation algorithm [28]. The radial velocity gradient is obtained by
, and Vθ
can be obtained by using the time delay estimation algorithm [28]. The radial velocity gradient is obtained by  , and the density radial gradient is obtained by
  . This method of measuring the electric field and turbulent transport, where the effect of electron temperature is neglected [5], has been proved to be feasible in HL-2A tokamak [10, 29] and several other devices [12, 30, 31]. Local density and electric field measurements allow us to directly determine fluctuation-induced particle flux and these linear terms in the particle balance equation (1).
3. Inward particle flux during L–I–H transition
3.1. Long-live mode in H-mode discharge
In HL-2A tokamak, H-mode is often achieved by NBI. In this discharge, the L–I–H transition is distinctly distinguished from the Dα signal representing the recycling state, as shown in figures 1(c) and 2(a). The reciprocating probe array inserts the plasma via a port located on the low field side vacuum vessel midplane and stays steady at r = 35.5 cm during the entire L–I–H transition [27]. As a typical H-mode discharge, the electron density increases, and the radial electric field becomes sharply negative at the edge when the plasma enters the H-mode state, as shown in figures 2(d) and (e). A coherent mode with an approximate peak frequency of 10 kHz is generated at 630 ms in L-mode, as shown in the core SXR and edge Mirnov coil signals, in figures 2(f) and (g), respectively. Further, density and electric field fluctuations are measured by the edge Langmuir probe, as shown in figures 2(h)–(j). This coherent mode has been identified as the LLM, a kind magnetohydrodynamic (MHD) mode, on the HL-2A tokamak [19, 32]. According to amplitude profiles of SXR fluctuation for this coherent mode, the LLM is generated at the core plasma (r = 16.2 cm) which reconfirms that this coherent mode is indeed LLM [27].

Figure 2. Discharge waveforms: (a) Dα
signal at divertor chamber, (b) core SXR signal, (c) poloidal magnetic field  measured by Mirnov coil. Fast reciprocating Langmuir probe array measured (d) electron density ne and (e) radial electric field Er. The red, green, and yellow areas represent our interest zones of L-mode, I-phase, and H-mode, respectively. The spectrograms of (f) core SXR signal, (g)
  , (h)
, (h)  , (i)
, (i)  and (j)
  . The red vertical dash lines denote the start moment of the L–I transition, and the purple vertical dash lines denote the start moment of the I–H transition. The location of last closed flux surface (LCFS) has been calculated by EFIT magnetic surface reconstruction data, which the positions of the probe relative to the LCFS are r − rLCFS = −1.5 cm (in L-mode) and r − rLCFS = −2.3 cm (in H-mode).
Download figure:
Standard image High-resolution image3.2. Particle flux associated with LLM
The fluctuation-induced radial particle flux remains radially outward (Γr,fluc > 0) during the L-mode. But it decreases sharply when the plasma enters the I-phase state, even changes its direction to radially inward (Γr,fluc < 0) and the direction is kept to H-mode [27]. However, the change in the transport direction of each component cannot be distinguished from the time evolution of radial particle flux. Therefore, to elucidate the detailed variations of fluctuation-induced particle flux Γr,fluc during the L–I–H transition, the frequency-resolved particle flux  and its fluctuating components in the frequency domain are calculated. For comparison, the values of
  during different plasma states are shown in figures 3(a) and (b).
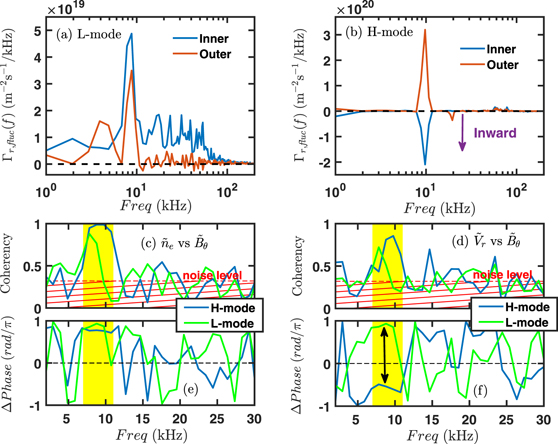
Figure 3. Frequency-resolved radial particle flux Γr,fluc(f) in (a) L-mode, (b) H-mode state. The negative value along the y-axis denotes radially inward particle flux. The blue and red lines represent the data from inner and outer positions on probe array A, respectively. The inner step probe is 2 mm deeper than the outer step probe. Cross coherency between Mirnov signal  and (c) density fluctuation
  , (d) radial velocity fluctuation
  . Cross-phase between Mirnov signal
  and (f) density fluctuation
  , (g) radial velocity fluctuation
  . The yellow area denotes the LLM frequency region. The blue line indicates the H-mode data, and the green line denotes the L-mode data. The data length for calculating the fast Fourier transform is NFFT = 1024, and the sampling frequency is 1 MHz.
Download figure:
Standard image High-resolution imageThe fluctuation-induced particle flux  is mainly induced by the coherent LLM and broadband fluctuation (30–100 kHz), and it takes the form of
  . Here, the broadband fluctuation-induced particle flux during the L-mode and I-phase is mainly due to the ambient turbulence, which can be denoted as
  (in L-mode and I-phase). The direction of turbulent transport
  from the inner radial position of probe array A is radially outward during the L-mode (Γr,fluc(fAT) > 0), as shown in figure 3(a). Besides, the particle fluxes in the LLM
  from the two different radial positions also remain in radially outward direction during the L-mode (Γr,fluc(fLLM) > 0). However, ambient turbulence is highly suppressed by the increased shear flow after the L–H transition, turbulent transport Γr,fluc(fAT) exhibits an obvious decrease. Moreover, due to the generation of the high-frequency coherent mode (HCM) at the end of the I-phase state [33], the HCM induced particle flux will dominant the broadband fluctuation-induced particle flux
  (in H-mode). The direction of Γr,fluc(fLLM) from the inner position changes to radially inward after L–H transition, but Γr,fluc(fLLM) from the outer position still remains radially outward, as shown in figure 3(b). Inward flux only happens in a certain radial position, and only the direction of particle flux associated with the global LLM becomes radially inward. It is quite different from that observed in previous experiments [7, 11], where the inward particle flux is usually caused by broadband fluctuations.
4. The origin of inward particle flux for LLM
4.1. Phase shift between fluctuating components
To explore the origin of inward particle flux in the LLM Γr,fluc(fLLM), we investigate the phase difference between different fluctuating components during the L–H transition. According to each fluctuating component in the frequency domain, it can be confirmed that the cross-phase term in the LLM becomes negative, i.e., cos αnV
(fLLM) < 0, which directly leads to the radially inward particle flux. The correlation analyses between fluctuating components ( and
and  ) for LLM and poloidal magnetic fluctuation
  are shown in figures 3(c) and (d) to figure out the primary cause of the phase shift.
There is high coherency for LLM during the entire L–H transition as expected from the global nature of LLM. The exact phase shifts of fluctuating components during L–H transition can be found by comparing the difference of the cross-phase between poloidal magnetic fluctuation  and fluctuating components (
 and
and  ) from different plasma states, as shown in figures 3(e) and (f). The cross-phase between
  and
and  during the L–H transition remains nearly unchanged
  , as shown in figure 3(e). However, the cross-phase between
  and
and  changes to nearly
  after the L–H transition, as shown in figure 3(f). Consequently, the considerable change in
  indicates that the phase of
  regards to magnetic fluctuations shifts significantly after the L–H transition and directly leads to the transport direction change. Besides, the negligible change in
  indicates that
  retains its phase during the L–H transition, which indicates density fluctuations largely come from field lines advection due to finite density gradient [34].
This result can also be confirmed by using localized electron cyclotron emission (ECE) signal as the reference signal instead of the edge Mirnov signal. The cross-phase between ECE fluctuation and  remains unchanged during the L–H transition (Δαn,ECE(fLLM) < 0.10 π, not shown in this paper), but the cross-phase between ECE fluctuation and
  shifts significantly during L–H transition (ΔαV,ECE(fLLM) ∼ 0.50 π, not shown in this paper). The correlations between SXR signal and fluctuating components also confirm this conclusion [27]. Therefore, the phase shift of radial velocity fluctuation with magnetic fluctuations for the LLM becomes a crucial factor, which leads to the change in the sign of cross-phase term as well as the generation of inward particle flux in the LLM. For a linear MHD mode, it usually retains the phase of density and velocity fluctuation. So, there must be another mechanism that leads to the phase shift of the radial velocity fluctuation.
4.2. Effect of flow on particle flux for LLM
Over recent years, the study of the fundamental mechanisms for inward particle flux has garnered considerable research interest. It has been found that the cross-phase term can change the transport direction when the shear effect reaches a certain threshold [35]. The amplitude of the inward particle flux also strongly depends on the radial electric field shear [7] or the negative total Reynolds work [15]. Numerical simulations also confirm that the cross-phase in the strong shearing regime is more sensitive than that in the weak shearing regime [36]. All these results indicate that the fundamental tendency of strong shear can change the transport direction by altering the cross-phase.
To explore the flow shear effect on particle flux, the particle flux Γr,fluc(fLLM) vs poloidal velocity shear ∂Vθ /∂r and radial velocity gradient dVr/dr is plotted in figure 4 in the time domain. During the L-mode, the radial velocity gradient dVr dr remains relatively small, and the direction of Γr,fluc(fLLM) remains in radially outward. As dVr/dr increases, Γr,fluc(fLLM) begins to decrease to zero and even changes its direction to radially inward at 637 ms, as shown in figures 4(a) and (f). However, the poloidal velocity shear ∂Vθ /∂r shows no obvious change while particle flux Γr,fluc(fLLM) varies. This becomes clear from figures 4(a) and (e), ∂Vθ /∂r begins to increase at 640 ms which is much later than the inward flux occurs. This implies the radial velocity gradient shows a strong correlation with inward particle flux in the LLM rather than the poloidal flow shear.
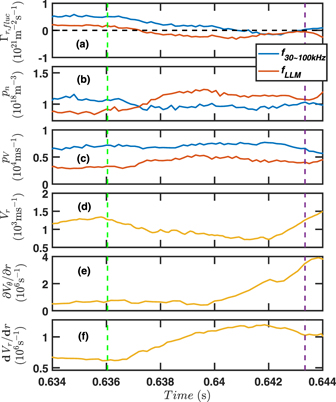
Figure 4. Time evolution of (a) fluctuation-induced radial particle flux Γr,fluc, where the negative value along the y-axis denotes radially inward particle flux, (b) electron density fluctuation  , and (c) radial velocity fluctuation
  . Here, the blue lines denote each parameter in the frequency range of 30–100 kHz, and the red lines denote each parameter in the LLM. (d) Mean radial velocity Vr, (e) radial derivative of poloidal velocity ∂Vθ
/∂r, (f) radial derivative of radial velocity dVr/dr. The green vertical dash lines denote the L–I transition start moment, and the purple vertical dash lines denote the I–H transition start moment. The data length for calculating the fast Fourier transform is NFFT = 512.
. Here, the blue lines denote each parameter in the frequency range of 30–100 kHz, and the red lines denote each parameter in the LLM. (d) Mean radial velocity Vr, (e) radial derivative of poloidal velocity ∂Vθ
/∂r, (f) radial derivative of radial velocity dVr/dr. The green vertical dash lines denote the L–I transition start moment, and the purple vertical dash lines denote the I–H transition start moment. The data length for calculating the fast Fourier transform is NFFT = 512.
Download figure:
Standard image High-resolution imageThe particle flux in the frequency range of 30–100 kHz is mainly due to the broadband turbulence ( , in L-mode and I-phase). The fluctuation amplitude of density and radial velocity in the frequency range of 30–100 kHz (
 and
and  ) do not show any obvious change during L–I–H transition, while a remarkable six-fold increase in ∂Vθ
/∂r, as shown in figures 4(b), (c) and (e). This indicates that the strong shear flow can suppress the turbulent transport by modulating the cross-phase between the fluctuations of density and radial velocity instead of amplitude reduction. The poloidal shear flow can strongly affect the small-scale turbulence, but its effect on the large-scale mode like the LLM is not evident. At the end of the I-phase state, the direction of Γr,fluc(fBF) changes to radially inward. This is mainly caused by the suppression of turbulent transport and the generation of HCM (
) do not show any obvious change during L–I–H transition, while a remarkable six-fold increase in ∂Vθ
/∂r, as shown in figures 4(b), (c) and (e). This indicates that the strong shear flow can suppress the turbulent transport by modulating the cross-phase between the fluctuations of density and radial velocity instead of amplitude reduction. The poloidal shear flow can strongly affect the small-scale turbulence, but its effect on the large-scale mode like the LLM is not evident. At the end of the I-phase state, the direction of Γr,fluc(fBF) changes to radially inward. This is mainly caused by the suppression of turbulent transport and the generation of HCM ( , in H-mode). The HCM can also drive inward particle flux, but inward particle flux for HCM starts much later than that for LLM [33], and we will discuss this phenomenon elsewhere.
4.3. Effect of radial velocity on particle flux for LLM
To explore the effects of fluctuations on particle flux, the direct measurements of fluctuation terms of equation (1) are shown in figure 5. The particle source can be estimated roughly by Dα signal since it reflects hydrogen recycling. The transport in the LLM begins to change its direction during the L–I transition (shown in figure 5(a)). However, the Dα signal shows no evident variation. When the inward flux in the LLM increases significantly at the H-mode state, but Dα signal decreases sharply which is proportional to neutral particle density. Therefore, we do not expect the particle source has obvious effect on the inward particle transport in the LLM.
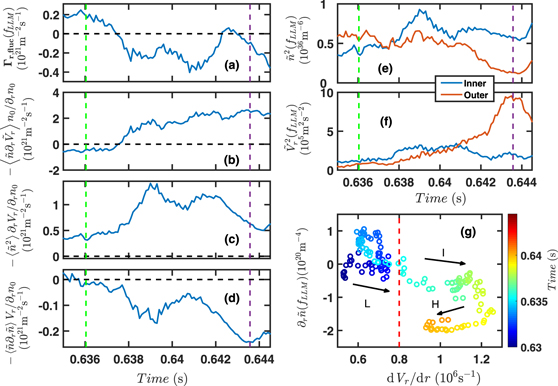
Figure 5. Time evolution of (a) radial particle flux in the LLM Γr,fluc(fLLM), (b) linear term  , (c) linear term
  , (d) linear term
  , (e) square of density fluctuation in the LLM
  , (f) square of radial velocity fluctuation in the LLM
  . The green vertical dash lines denote L–I transition start moment, and the purple vertical dash lines denote I–H transition start moment. (g) Dependence of the LLM density fluctuation gradient
  on the radial velocity gradient dVr/dr during the L–I–H transition. The colors of data points are continuously changing with time. The data length for calculating the fast Fourier transform is NFFT = 512.
Download figure:
Standard image High-resolution imageDue to the incompressibility of the flow ( ), the linear term
  and
and  can be ignored, but their radial gradient components of radial velocity are not necessarily zero, as shown in figures 5(b) and (c). During the entire L–I–H transition, the radial velocity gradient dVr/dr increases a factor of two (see figure 4(f)), accompanied by the reversal of particle flux Γr,fluc(fLLM) direction (see figure 4(a)), which implies that the radial velocity gradient may play a role in the generation of inward flux for the LLM. But the linear term induced by the radial velocity gradient
  only contributes to radially outward flux during the I–H transition, which cannot explain inward flux explicitly, as shown in figure 5(c). The measured fluctuation term
  proportional to radial velocity indeed contributes to the radially inward flux during the I–H transition. However, this term only accounts for inward flux partially during I-phase, as shown in figure 5(d). The mean radial velocity Vr remains radially outward during the L–I–H transition, as shown in figure 4(d). So, the phase shift of
  directly leads to the sign change of
  . The LLM density fluctuations at the outer position have been highly suppressed after the beginning of inward flux (at 637.5 ms) as shown in figure 5(e). This directly leads to the density fluctuation gradient
  become negative, and it will reverse the direction of
  .
.
As we mentioned before, the poloidal velocity shear shows no obvious effect on inward flux but the radial velocity gradient does. To clearly show the effect by radial velocity gradient dVr/dr, the entire L–I–H transition data (630–644.5 ms) of the LLM density fluctuation gradient  and radial velocity gradient dVr/dr is shown in figure 5(g). It is clear that
  become negative when dVr/dr increases beyond a certain threshold (red vertical dashed line in figure 5(g)). This indicates that the radial velocity gradient dVr/dr can modulate the particle flux Γr,fluc(fLLM) by modifying the LLM density fluctuation gradient. In addition, the relation between dVr/dr and
  in the different plasma state is quite different. It has been confirmed that
  increased gradually with the increase of dVr/dr during the I-phase state. When plasma enters the H-mode state,
  remains steady as dVr/dr increases. Even though the radial velocity gradient may not directly contribute to inward particle flux yet it can affect density fluctuation profile implicitly via redistribution of flow, which requires further investigation.
4.4. Nonlinear coupling between ambient turbulence and LLM in I-phase
In the I-phase state, the linear term  only contributes half of the measured particle flux Γr,fluc(fLLM) (see in figure 5), which indicates the nonlinear term of equation (2) also contributes to the inward particle flux. Otherwise, equation (1) cannot balance. However, the nonlinear term cannot be directly measured at the moment, which requires absolute phase measurements among three waves. Instead, we can evaluate the nonlinear three-wave interaction of LLM as long as the phases of three waves are aligned.
The nonlinear coupling is usually detected with bispectrum technique [37, 38]. The squared bicoherence of the three physical quantities,  ,
,  , and
, and  , are given by
  . However, the cross-bicoherence between
  ,
,  , and
, and  is not very clear due to the phases are not aligned. This leads to the nonlinear term that cannot be directly measured. However, the nonlinear interaction between LLM and broadband turbulence can be confirmed by the auto-bicoherence
  . Considering the electromagnetic characteristics of LLM, the magnetic fluctuation can also be used to verify the nonlinear interaction due to the electromagnetic characteristic of LLM. Figures 6(a) and (b) show the contour plots of squared auto-bicoherence
  , which denotes the total nonlinear interactions of the poloidal magnetic fluctuation at f1 ± f2, during the L-mode and I-phase, respectively. It clearly shows that the bicoherence values around the frequencies of f2 = ±11.7 kHz and f = f1 + f2 = 11.7 kHz (as the purple dash lines shown in figure 6(b)) are larger than those at other frequencies, but there are no such clear lines in figure 6(a). It indicates a significant level of nonlinear interaction concentrated at the LLM frequency during the I-phase, which suggests that the LLM has strong nonlinear coupling with the broadband turbulence. However, when the plasma enters the H-mode state, the ambient turbulence has been highly suppressed. Due to the disappearance of turbulence, the nonlinear interaction between turbulence and LLM has gone off, and it may directly lead to a sharp decrease of
  at 642 ms. Lastly, the inward particle flux is mainly comes from the linear term
  during the H-mode state.

Figure 6. The auto-bicoherence  during (a) L-mode, (b) I-phase. The data length for calculating the fast Fourier transform is NFFT = 256. The purple dash lines denote the bicoherence values around the frequencies of f2 = ±11.7 kHz and f = f1 + f2 = 11.7 kHz, respectively.
Download figure:
Standard image High-resolution image
5. Discussions and conclusion
It is generally acknowledged that fluctuation-induced transport is suppressed due to the establishment of transport barrier [39], and it is mainly caused by the increase of shear flow [40]. This flow shearing model is so successful that some experimental studies attempted to find the connection between inward transport and flow shearing [7]. Although the poloidal velocity shear has a very strong effect on small-scale turbulence, the direct effect of shear flow for the LLM in our experiments, it is not obvious possibly due to the global nature of LLM.
In the experiments, the inward particle flux in the LLM can happen much earlier than the significant enhancement of poloidal velocity shear, which reconfirms the shear flow in HL-2A has no obvious effect on the generation of inward particle flux associated with large-scale modes. Like plasma turbulence can enhance the radial transport by connecting different radial magnetic surfaces, and the effect of radial flow will no longer be neglected since radial flow is coupled to perpendicular flow. It is important to understand the significance of the mean radial flow and its effect on the inward particle flux associated with the large-scale mode. In our case, it has been found that the strong radial velocity gradient dVr/dr may alter the radial density fluctuation gradient of LLM  by suppressing the local LLM density fluctuation
  . As a result, the phase shift between the LLM density fluctuation
  and its gradient
  can reverse the direction of the linear term
  . However, the linear term
  is not enough to account for radial particle flux quantitatively during the I-phase state, which implies the nonlinear term will also contribute to the inward particle flux after the L–I transition. Based on the bi-coherence of magnetic fluctuations, the strong nonlinear interaction between the broadband turbulence and LLM in the magnetic fluctuations has been indeed confirmed.
The transport direction change in L–I–H transition can be described as following: during the L-mode, there is no observed nonlinear interaction between ambient turbulence and LLM. The direction of particle flux due to the LLM and turbulent transport are both radially outward. When the plasma enters the I-phase state, the nonlinear interaction between LLM and ambient turbulence increases, the particle flux in the LLM changes to radially inward and it is most likely that the nonlinear term will contribute most of the inward flux. During the H-mode, the nonlinear coupling becomes weaker due to the absence of ambient turbulence and the linear term contributes to most of the inward flux.
This study reveals the entire process involved in changing the transport direction of the LLM during L–I–H transition in the HL-2A tokamak. We confirm the phase shift of radial velocity fluctuation in the LLM  is the decisive factor that leads to the sign change of the cross-phase term
  and directly leads to the inward particle flux. Moreover, the importance of the radial flow has been firstly mentioned, due to the strong effect of radial velocity gradient on large-scale mode. The phase shift between density fluctuation and its radial gradient
  contribute to a part of radially inward flux, which manifests the radial velocity gradient has an indirect effect on the particle flux in the LLM. The nonlinear term contributes most of radially inward flux during the I-phase state, which is related to the strong nonlinear interaction between ambient turbulence and LLM. Further investigation is necessary for a deeper understanding of the inward flux dynamics for modulating the cross-correlation between fluctuations.
Acknowledgments
The authors greatly thank D. Guo and the HL-2A team for their support of these experiments. This work is supported by the Natural Science Foundation of China under Grant Nos. 11875255, 11635008, 11375188, 11975231, and the National Magnetic Confinement Fusion Science Program of China under Grant Nos. 2017YFE0301700, 2017YFE031701.