

Abstract
Farmers use irrigation to mitigate drought risk and reduce yield uncertainty. A clear understanding of the monetary value of irrigation water and how it varies across time and space can help to inform farmers and policymakers about the potential impacts of water shortages and reduce uncertainty in decision making. Here, we introduce a framework for understanding the economic value of water used to produce corn in the central High Plains region during the period 2010–2017. Our analysis uses publicly available data for corn price and for irrigated and non-irrigated yields and incorporates irrigation requirement adjustments to account for the hydrologic balance. The findings suggest that the per unit value of irrigation water is highest not during severe droughts and not in more arid areas of the study region, but rather when and where irrigation can make the largest improvements to average crop productivity. Policy changes informed by these results might help to mitigate the impacts of future droughts on agriculture, especially in areas where climate change may lead to large increases in supplemental irrigation.
Export citation and abstract BibTeX RIS

Original content from this work may be used under the terms of the Creative Commons Attribution 4.0 licence. Any further distribution of this work must maintain attribution to the author(s) and the title of the work, journal citation and DOI.
This article was updated on 1 June 2021 to include the acknowledgements.
Introduction
Droughts exacerbate agricultural producers' vulnerability and increase uncertainty in their decision making (Hayes et al 2004, Wallander et al 2017). Some practices designed to reduce production risk and adapt to varying climate (e.g., higher sowing densities) contribute to nutrient deficiency and cause a higher crop yield sensitivity to drought (Lobell et al 2014, Zipper et al 2016). Severe droughts in the United States (U.S.) cause substantial damage to crop growth and development and, as a result, can impact global food supply (e.g., the U.S. produces over 30% of global corn annually; USDA 2020) and threaten farmers' livelihoods in different regions across the country (e.g., High Plains and Midwest (2012), California (2013–2016), Southeast (2016–2017); Wallander et al 2017). Policy debates on improving drought planning effectiveness in agriculture tend to occur during or after a major drought with the primary objectives aimed at crisis control and recovery (Fu et al 2013, Fontaine et al 2014). Strategies for proactive mitigation in many areas remain weak and lack a strong institutional capacity to prepare effectively for droughts (Fu et al 2013, Fontaine et al 2014, Stakhiv et al 2016, Stults and Woodruff 2017).
Among different mitigation strategies for drought impacts on agricultural production, like soil management (Schoengold et al 2015), crop switching (Lusk et al 2018, McFadden et al 2019), reservoir storage capacity expansion (Ward and Crawford 2016), or crop insurance (Annan and Schlenker 2015), the role of irrigation remains key (Troy et al 2015, Zhang et al 2015, Zipper et al 2016, Li and Troy 2018, Kuwayama et al 2018, Zhu et al 2019). Supplemental water protects crop cultivation by alleviating stresses imposed by climate variability and extreme variations in temperature and precipitation. Such variations are expected to intensify and occur more frequently in the future (IPCC 2019). Many farmers in the U.S. rely on groundwater or surface water to irrigate crops during the growing season (IWMS 2019, Wallander et al 2017). Demand for groundwater in crop production has been growing, in part due to its reliable supply and easy access from private land (Giordano 2009). For example, in the western U.S. (e.g., California, Nebraska, Kansas, Texas), groundwater currently is a dominant source of irrigation water; nationwide, groundwater withdrawals for irrigation accounted for 48% of irrigation in 2015, which is 16% higher than in 2010 (Dieter et al 2018). Many producers currently depend on depleting sources for irrigation (e.g., the Ogallala Aquifer in the Southern High Plains; Wallander et al 2017, Sampson et al 2019). In some regions, the overall growth in water demand for irrigation has contributed to declines in water availability, raising concerns about sustainable water management across irrigators (Schaible and Aillery 2012) and other water users (Brown et al 2019).
To prevent water conflicts from occurring, changes in water governance need to be guided considering temporal and spatial water variability. Irrigation's ability to buffer against the impacts of varying weather depends on regional hydrogeologic conditions (e.g., Foster et al 2015) and institutional readiness to reallocate water in real-time (e.g., Babbitt et al 2017). The spatiotemporal variability of water availability for irrigation is intensified during droughts and is expected to increase based on future climate predictions (Butler & Huybers 2013, Hoffman et al 2020). Climate forecasts highlight the need to assess what policy changes are needed in regional water and drought management in order to avoid shortages across different water-using sectors.
Water valuation analysis can be used to inform policy considering temporal and spatial water variability. When farmers, water managers, and policymakers know the monetary value of irrigation water and how it varies across time and space, they can better understand the potential impacts of water supply variability and may reduce uncertainty in decision making (Ward and Michelsen 2002). While flashpoints of conflict may occur in regions where water has the highest marginal value during climate-driven stress, areas and seasons where the average values of water used in agriculture are high are also likely to be subject to conflict. The goal of this study is to help identify areas susceptible to potential future conflicts over water in the U.S. central High Plains region. To accomplish this, first we estimated the economic gross average value of water used in crop production and then assessed how spatiotemporal variability of irrigation value is impacted by a severe drought.
Multiple valuation methods are available to estimate the economic value of water for irrigation. One approach is to observe directly agricultural water prices in water markets (e.g., for historical transfer prices see Brewer et al 2008). However, the ability to understand water value by looking at water rights transfers is challenging, because most water rights markets in the U.S. are not fully developed (Leonard et al 2019, Rimsaite et al 2021) or informal (Young and Brozović 2019), which increases variability in prices (Libecap 2011). Additionally, market price information available to the public is usually an exception (e.g., Mojave Water Agency in California and Central Platte Natural Resources District in Nebraska; Young and Brozović 2019).
Indirect market price observations can also be used to understand the value of agricultural water. For example, hedonic analysis has been used to estimate how irrigation availability is capitalized into farmland values (e.g., California: Schlenker et al 2007, Buck et al 2014, Kansas: Sampson et al 2019, Nebraska: Brozović and Islam 2010, Shultz and Schmitz 2010, Ogallala Aquifer: Hornbeck and Keskin 2014, Oregon: Faux and Perry 1999). Hedonic methods, however, require a lot of data (e.g., data are needed on irrigated and non-irrigated lands with very similar qualities and conditions; Young and Loomis 2014) and are prone to omitted variable bias (Buck et al 2014).
When direct or indirect market price data are unavailable, experiments can be used to assess the value of agricultural water. For example, controlled field experiments analyzing crop-water production functions may be feasible (for review see Zwart and Bastiaanssen 2004). Such experiments tend to be costly (Young and Loomis 2014). Surveys can be used to understand the public's willingness to pay for more available agricultural water based on hypothetical scenarios (e.g., Knapp et al 2018, Suter et al 2019). Survey approaches may suffer from hypothetical bias and misrepresentative sample sizes limiting the drawing of clear, policy-relevant conclusions (Loomis 2011).
Simulation methods are popular in hydro-economic modeling, for example seeking to understand location-specific (e.g., aquifer, sub-basin) groundwater availability impact on irrigated land profitability (e.g., Foster et al 2015). Mathematical programming can be used to solve constrained dynamic optimization models to determine the value of water per unit (e.g., Habteyes and Ward 2020) or to understand better how water management can improve agricultural productivity (e.g., Knapp et al 2003).
In this study, we use a realized crop value approach stemming from the analysis of indirect market prices: we estimate the gross average value of water per unit, based on the market prices of crops. Unlike the methods described above, our approach allows us to analyze the value of both surface water and groundwater, to use publicly available data products, and to produce estimates across large regions that are important to agricultural producers and policymakers. Specifically, we analyze the spatiotemporal heterogeneity of the gross average value of water used in crop production in the central High Plains region during the period 2010–2017. Our results indicate that the average value of irrigation water is highest in rainfed production areas where irrigation is used only supplementally. This is in contrast to what might be expected, namely that average water values peak in areas and times with the highest absolute irrigation demand. Considering future climate predictions, our findings suggest the merit of advancing drought mitigation planning and implementing robust water management and allocation in locations where currently crop production is under rainfed conditions, and where institutions may not prioritize water sustainability.
Data and approach
To understand spatial and temporal variability in the value of water used for corn production in the High Plains, we estimate the gross average irrigation value per unit at the county level in Colorado, Nebraska, and Kansas. This represents the corn-growing region of the U.S. where both rainfed and irrigated agriculture are present. We study annual variability during the period 2010–2017. This includes the 2012 drought, allowing us to assess the impact of severe drought on irrigation. Our estimation follows:

First, we calculate the 'Yield differential' by taking the difference in county-level corn yield (Mg/ha) between irrigated and non-irrigated production, which represents the contribution of water in terms of the physical commodity produced. Then we multiply the yield differential by the Crop price, here corn price received by producers (US$/Mg), giving the annual difference in total gross revenue on a per-area basis between irrigated and non-irrigated corn production at the county level. Dividing the gross revenue value by the Irrigation requirement (cm), we obtain the average gross annual value of water per unit used in agricultural production.
Our final realized water value estimates indicate the average gross value of irrigation water per unit used in corn production (US$/m3) and do not include irrigation-specific costs such as water pumping. Although we expect that some irrigation-cost related parameters (e.g., infrastructure, depth to water) may vary significantly across the study region, the purpose of our analysis is to capture how spatiotemporal weather variability affects regional irrigation value trends. Thus, irrigation cost assessment is beyond the scope of our study. To confirm the trend trajectory, we perform a sensitivity analysis (Appendix A (available online at stacks.iop.org/ERC/3/041004/mmedia)) and conduct a robustness check analysis using a separate water valuation method based on irrigated and non-irrigated rental land values, which implicitly accounts for irrigation-specific costs.
In our analysis, we use average county-level irrigated and dryland corn yield and corn price data from the U.S. Department of Agriculture National Agricultural Statistics Service (USDA NASS ) website. Average corn prices were similar among the three states but varied considerably during the time period. Average corn price during 2010–2013, inflation-adjusted to 2017 prices (U.S. dollars), was US$241.33/Mg; during 2015–2017, it was only US$137.39/Mg. The high price period includes 2012—a year when the study region experienced a severe drought while the biofuels boom was in progress. This allows us to test whether the average value of water was higher during the severe drought. On the one hand, we expect a significantly higher total value of water represented by the yield differential multiplied by the corn price; however, the irrigation requirement is also expected to be much higher during the drought.
The irrigation requirement accounts for the heterogeneity in natural hydrologic balance during the growing season. Data for irrigation requirements were obtained from the Daymet dataset, which represents daily surface weather estimates for North America from 1980–2017, gridded at a 1km spatial resolution (Thornton et al 2014). Our methods for estimating county-level irrigation requirements consisted first of calculating the growing season reference evapotranspiration (ETr) using the standard Penman-Monteith approach (Monteith 1965; equation (2)), then adjusting the values to the growing degree days representing crop development (equation (3)), and finally subtracting precipitation.
We used a sampling and simulation approach in order to address potential sensitivity to variations in agronomic parameters when estimating county-level irrigation water requirement. To avoid overgeneralizing one planting date, crop maturity, and location within each county, we performed 30 simulations for each county. Each simulation consisted of a random location within that county, matched with weather data specific to that location. The growing season length for each random location consisted of selecting planting dates and growing degree day (GDD) requirement to crop maturity based on the values shown in table 1. Using this approach, each county in the study-region had 30 random combinations of genetic, environment, and management factors with the median value reported for the county average.
Table 1. Genetic and management parameters used to determine growing season length and crop development.
| State | Crop | Early plating date (DOY) | Average planting date (DOY) | Late Planting Date (DOY) |
|---|---|---|---|---|
| Nebraska | Corn | 109 | 127 | 141 |
| Colorado | Corn | 109 | 129 | 149 |
| Kansas | Corn | 95 | 121 | 145 |
| Crop Maturity | Crop | GDD (°C) | ||
| Low | Corn | 1167 | ||
| Medium | Corn | 1362 | ||
| High | Corn | 1612 |
Our form for the ETr estimation followed that of Irmak et al (2012):

where Rn is equal to net radiation at the reference surface (MJ/m2/day), G is soil heat flux density (MJ/m2/day) and assumed to be zero for a daily time step, γ is the psychometric constant (kPa/°C), T is mean daily temperature at 2 m, u2 is mean daily wind speed assumed here to be 3.75 m s−1 due to a lack of wind speed data and informed from Sharma et al (2016), Cn is a crop-specific constant for alfalfa (here 1,600), Cd is a crop-specific constant for alfalfa (here 0.38), es is the saturation vapor pressure of air (kPa), ea is actual vapor pressure of air (kPa). We calculated the county-level growing season crop evapotranspiration (ETc ) value by adjusting the received ETr estimates with crop coefficient that varies as a function of cumulative growing degree days (GDD), which are calculated as follows.

Where Tmax and Tmin represent the maximum and minimum daily temperatures (°C), and Tbase is the base temperature of the crop below which no crop growth is assumed.
Results
Corn irrigation requirement
Precipitation during the period 2010–2017 in the study region varied from 5 cm–86 cm. In general, moisture was higher in the eastern portion of the study region, so that conditions for rainfed agriculture are better in the east. In 2012, the precipitation was very low for the entire region. County-level crop evapotranspiration was lowest in the eastern and southeastern portion of the study-region and much higher in Colorado and western Nebraska, especially during the 2012 drought (figure 1). Spatially, there is a large variation in irrigation requirement in every year. Variation in irrigation requirement was highest across the study region in 2012.
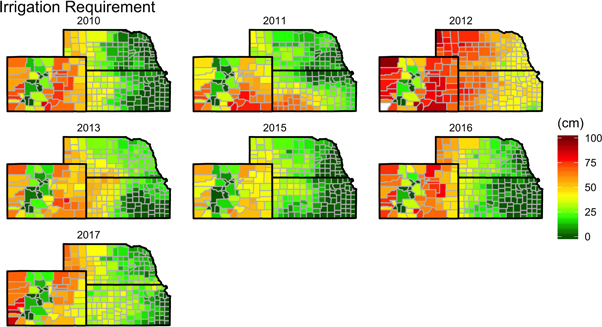
Figure 1. County-level irrigation requirement during the growing season in Colorado, Nebraska, and Kansas during the 2010–2017 period.
Download figure:
Standard image High-resolution imageYield differential and price
Temporally, the difference in corn yield across the study region was highest in 2012 (figure 2), which corresponds to the exceptionally severe drought that occurred in the U.S. Midwest and highlights the mitigating role of supplemental water used during the drought. Spatially, the yield differential was higher in northeastern Colorado and western parts of Nebraska and Kansas compared to eastern portions of Nebraska and Kansas.
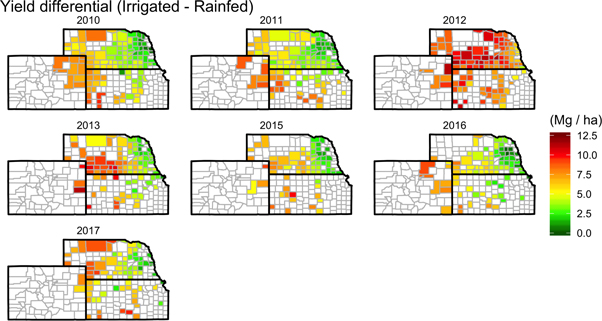
Figure 2. County-level difference between irrigated and non-irrigated corn yield in Colorado, Nebraska, and Kansas between 2010–2017.
Download figure:
Standard image High-resolution imageMultiplying yield differential by the corn price provided estimates explaining variability in corn production gross revenue between irrigated and non-irrigated fields at a county level. Results show that crop production revenue difference was higher during the high price environment (2010–2013) than during the low price period (2015–2017). The difference was especially high in 2012, highlighting the critical role of water security in buffering the economic impacts of drought in crop production. Results suggest that at a county level, irrigating fields in 2012 received US$1,483/ha-US$3,089/ha higher gross revenues than fields that did not apply supplemental water in corn production.
Realized value of water
Dividing the crop production revenue differential by the irrigation requirement yielded results for the average gross value of water. Our results show that spatially, the average gross value of water ranged from US$0.10 to US$0.85/m3 during the period 2010–2017. Counterintuitively, the highest values occurred in the central and eastern portions of the study area, where rainfed production is relatively high. In other words, while the central and eastern portions of the study region use relatively little supplemental water, that water is particularly valuable in terms of the additional crop production it enables during droughts (figure 3).
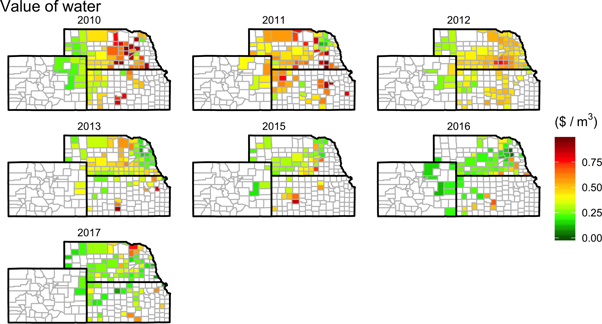
Figure 3. County-level realized value of water used in corn production in Colorado, Nebraska, and Kansas between 2010–2017.
Download figure:
Standard image High-resolution imageUnsurprisingly, the estimated values of water were generally higher during the high price period (2010–2013) than during the subsequent low price period (2015–2017), with 2011 representing the highest median value (US$0.50/m3) for the water used in corn production in the three states (figure 4). The driest year in our analysis, 2012, also corresponded with the biofuels boom and high crop prices. However, the average gross value of water per cubic meter was not highest in 2012. The large yield differential between irrigated and non-irrigated corn was largest during that year, but the irrigation requirement was also the highest, which lowered the average value of water.
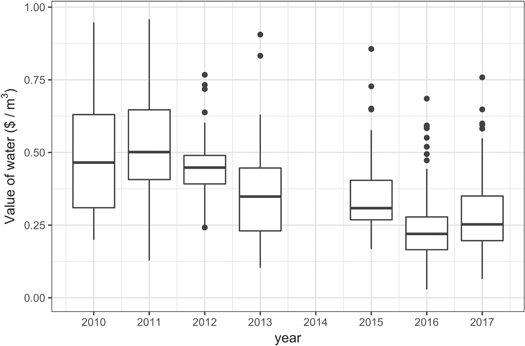
Figure 4. Annual average values of water (US$/m3) estimated using the realized value method.
Download figure:
Standard image High-resolution imageThe key intuition underlying our results can be presented graphically through the relationship between irrigation requirement and yield differential (figure 5). While the general positive correlation between irrigation requirement and yield differential has been noted for our study region (e.g. Payero et al 2009, Grassini et al 2011), the economic implications have not been considered previously. In particular, the slope of the relationship between irrigation requirement and yield differential represents the average physical benefit of irrigation in terms of increased crop yield per volume of water applied. At very high irrigation requirements, the average physical benefit of irrigation (the slope of the line in figure 5) decreases because, although irrigation makes a large difference to crop yields, a more than the corresponding amount of irrigation is needed to provide this benefit.
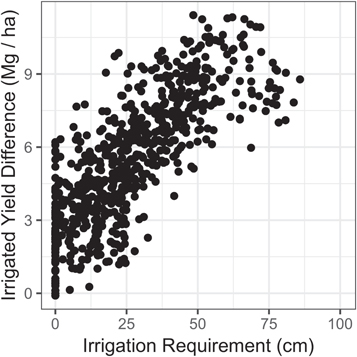
Figure 5. Relationship between corn yield differential and irrigation requirement in Colorado, Nebraska, and Kansas between 2010–2017.
Download figure:
Standard image High-resolution imageOur interannual findings are comparable to D'Odorico et al (2020), who also found that the value of water used for corn in the U.S. was higher during the 2010–2013 period than from 2015–2016. Their mean value of water for this crop in North & Central America (~US$0.28 /m3) and globally (US$0.16/m3) was generally lower than our results for the central High Plains region in the U.S. For our dataset, sensitivity analysis done by holding corn price constant across time shows that the qualitative results on spatial water value trends are robust (figure 1(A), appendix A).
Robustness check: expected value of water
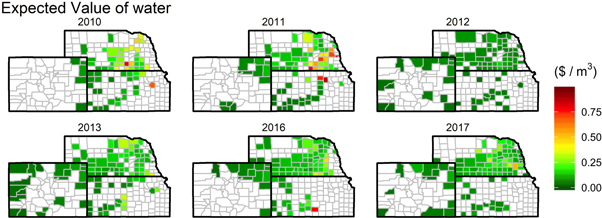
As a basic check of our results, we estimated the average value of water per unit using county-level farmland rent prices. The method entailed calculating 'Cash rent differential' by taking the difference between irrigated and non-irrigated cash rental prices (once again, from USDA NASS data) and dividing by the irrigation requirement (equation (1)) to obtain the average irrigation value per unit (US$/m3) (equation (4) below).

In general, we anticipate that values calculated using this method would be lower than those calculated with the realized value because cash rents are expected to control for local irrigation costs. Additionally, there is a delay in agricultural land rental adjustments to crop price changes due to long-term contracting, so cash rents tend to lag behind crop prices (Hornbeck and Keskin 2014). Similarly to the realized value results, the expected value of water per unit shows that the average value of water used in crop production was higher in more central and eastern portions of the study region (e.g., ~US$0.25-US$0.80/m3 in 2010–2011), and it was not significantly different during the drought in 2012 (~US$0.0-US$0.15/m3) (figure 6).
Figure 6. County-level expected value of water used in crop production in Colorado, Nebraska, and Kansas between 2010–2017.
Download figure:
Standard image High-resolution image
Discussion and conclusions
Most research on the value of water in agriculture considers regions where irrigation is essential for crop growth. Our results show that in areas where rainfall is the main source of water for crops, irrigation can still provide significant economic value to agricultural producers. For our study area in the U.S. Midwest and the period 2010–2017, average gross water values were highest not at points in time and space where the water supply was scarcest in absolute terms, but where irrigation could make the largest improvement in average crop productivity.
Our estimated water values can be used as an indicator to anticipate where new disputes over water use in agriculture may arise during future droughts. Future water conflict will be exacerbated if it occurs in areas without long-lived and well-established water governance institutions. As an illustrative example, agricultural groundwater pumping during the 2012 drought led to the temporary drying of multiple residential water wells in the Lower Platte South Natural Resources District located in eastern Nebraska (the Natural Resources Districts are political subdivisions of local government, tasked among other things with groundwater management). The situation caused conflict between different water-using groups including agricultural producers, homeowners, and municipalities. Litigation was ultimately avoided due to the quick actions taken by the Natural Resources District, such as enforced pumping allocations and the introduction of mandatory agricultural well metering. However, had a trusted governance body with strong enforcement capacity not been in place, the dispute would almost certainly have escalated.
Future climate projections suggest that growing season conditions similar to 2012 are likely to occur more frequently in the U.S. Midwest, and that climatic conditions favorable to rainfed production are likely to shift north and move away from Iowa and Illinois towards Minnesota and the Dakotas (Hoffman et al 2020). Combining our study findings with future climate projections specific to the U.S. Midwest (Butler and Huybers 2013, Jin et al 2017, Abendroth et al 2019, Hoffman et al 2020), it is likely that to compensate for the hydrologic stress from severe droughts, producers growing crops like corn and soybeans will have to begin irrigating or will start irrigating more heavily. Irrigated acreage in the Midwestern states like Illinois, Indiana, Iowa, and Missouri has already been increasing over the past two decades (FRIS 2004, 2009, 2014, IWMS 2019).
Extrapolation of our results would suggest that as climate change continues to affect the U.S. Midwest, the locus of highest average value for irrigation water will move east, into states and regions where there is currently very little irrigation, such as Illinois, Indiana, Iowa, and Missouri. Agricultural water management regulations and drought mitigation planning tend to be weak or absent in Midwestern states where the agricultural sector has historically been primarily rainfed (e.g., Illinois). Based on our analysis, these areas are likely to experience increasing water disputes if changes in water policy are not prioritized in the near future. Implementing management reform ahead of potential water shortage would be less costly than doing so while simultaneously managing a crisis. While our analysis focused on the U.S. Midwest, we anticipate that similar results will hold for other regions of the world where there is a gradient between rainfed and irrigated crop production and where climate change is making severe drought likelier over time.
Acknowledgments
Funding for the research in this manuscript was provided by the United States Department of Agriculture under contract numbers OCE 58-0111-18-011 and OCE 58-0111-19-009.
Data availability statement
The data that support the findings of this study are openly available at the following URL/DOI: https://quickstats.nass.usda.gov/ and http://doi.org/10.3334/ORNLDAAC/1219.
Author contributions
Rimsaite obtained and analyzed data, interpreted results, and wrote the manuscript; Gibson obtained, processed and analyzed data, interpreted results, and edited the manuscript; Brozović framed the analysis, interpreted results, and edited the manuscript.