

Abstract
An easy circuit for measuring the power of a solar panel in physics classroom by using the microcontroller Arduino will be introduced in this article. The measured data is transferred via Bluetooth to the smartphone app 'phyphox' where it is displayed graphically. The circuitry enables measuring the power of a solar panel in different situations of light intensity. Several model experiments for students will be described.
Export citation and abstract BibTeX RIS

Original content from this work may be used under the terms of the Creative Commons Attribution 4.0 license. Any further distribution of this work must maintain attribution to the author(s) and the title of the work, journal citation and DOI.
1. Introduction
During the past few years the societal significance of solar panels has risen. Therefore solar cells possess a great potential as a topic for physics education. They can also be used as context to introduce voltage, current and electrical power. Learners already know several applications of solar panels from their everyday lives, such as calculators or weather stations as well as outdoor-equipment or panels on rooftops. A both interesting and relevant question for the physics classroom is for example: how much energy — or rather how much power — can a solar panel provide in situations of varying light intensities? Learners can look at several different scenarios in this context, such as the influence of daytime or various kinds of cloud layers.
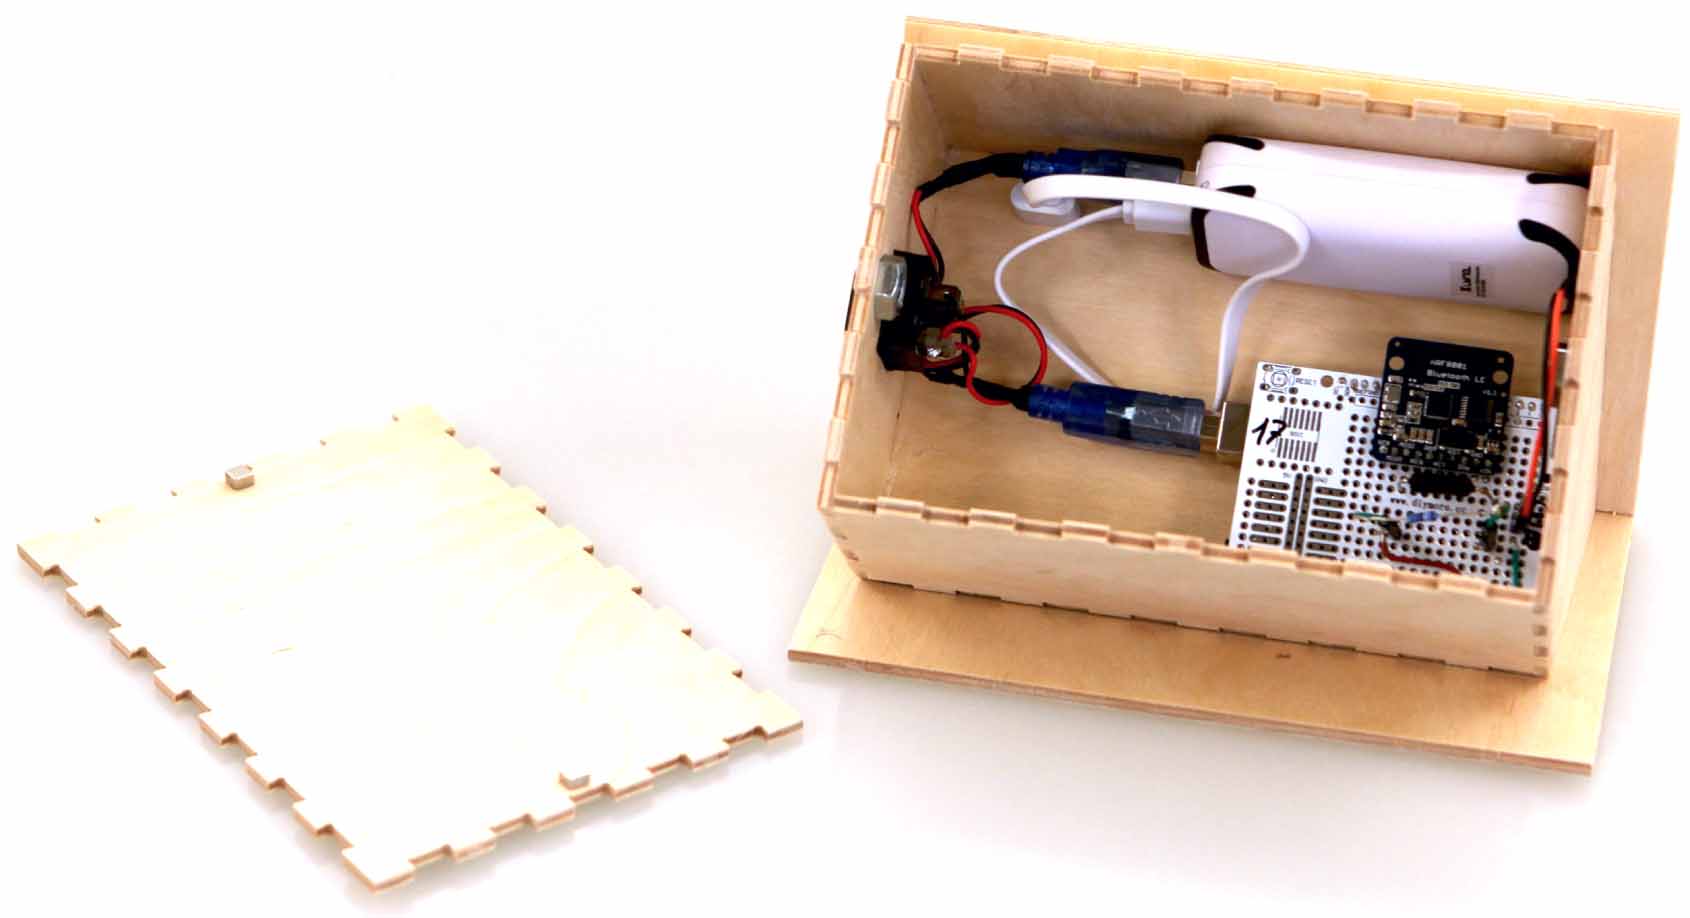
In this article, an easy circuit for measuring the power of a solar panel by using the microcontroller Arduino will be introduced, as well as the application of the app 'phyphox' for presenting the measured data. The circuitry enables measuring the power of a solar panel in different situations of light intensity and to evaluate the data by learners. This could be used to strengthen independent experimental action, experience of competence and self-concept. To illustrate this, several model experiments for students will be described. The experiments are taken from the project 'smart-for-science'. For a better handling of the equipment and the conduction of the model experiments, the circuitry is built into a model house (figure 1).

Figure 1. The model of a house with inbuilt circuitry including an Arduino. The model of the house built by using a CNC mill is meant to enable better handling of the equipment and the conduction of the model experiments.
Download figure:
Standard image High-resolution image2. Experimenting by using solar cells
A solar cell converts radiation energy to electrical energy. This is based on the photovoltaic effect (a special case of the photo effect): at the p-n-junction a space-charge region is created as some electrons travel from the n-layer to the p-layer until this process ceases due to the emerging voltage. In this scenario, incoming radiation creates charge carrier pairs at the p–n-junction of a photodiode. When electrons change to the conduction band of the n-layer and the holes to the valence band of the p-layer, a current is created which flows against the forward direction of the junction [1].
From the perspective of a teacher, solar cells are mostly a less challenging matter in experimental contexts. For example, it is possible to use computer systems (e.g. CassyLab) to measure the voltage and current at a load resistor for different light sources in relation to the angle of incoming radiation or the distance between solar cell and light source. To better judge the conditions of a certain solar cell in varying situations of incoming light, not the voltage or the current alone but their product — the power — is the critical factor ( ).
).
In order to get the most possible power from a solar cell, it has to be used in connection with a suitable load resistance. Simply put, the load resistance has to match the inner resistance of the solar cell during operation as best as possible. However, the optimal point for operation is not constant, as it changes for example with varying light intensity or operational temperature [1]. In solar plants, the load resistance is adjusted electronically. In the physics classroom, it can be empirically determined by measuring the power during changes of the load resistance (for example with a sliding resistor).
There are several kinds of solar cells that differ in type (e.g. poly- or mono-crystalline), size, casing, connectors and natural characteristics of voltage and current. The characteristics of a solar cell are mostly only described at optimal conditions like an irradiance of 1000 W m−2 sunlight (which corresponds to the solar constant of Europe). This means that in the physics classroom — by using artificial light sources like desk lamps, spot lights or even fluorescent tubes on the ceiling — only significantly lower values for the power can be obtained. Additionally, price and availability play a significant role in educational contexts as well.
The circuitry used in this article uses a solar cell of about 78 mm × 78 mm. When used in connection with a 9  load resistance (matching the cell's maximum power point (MPP)), it produces its maximum power of about 0.025 W (about 400 mV and 60 mA) when put under a 60 W light bulb.
During experiments conducted by students, current and voltage can be measured by using two millimetres consequently. The power has to be calculated from these two measurements in order to assess the data after those calculations are done.
By using a microcontroller — like an Arduino — the voltage and current as well as the power can be measured in a rather simple, cheap and simultaneous manner. By connecting the microcontroller via Bluetooth to the app phyphox, the data can additionally be visualized by using graphs. Moreover the measurement data can be shown in real-time.
3. Precision of measuring current and voltage using an Arduino
The microcontroller ATMEGA328P is built into most Arduinos (e.g. Uno or Nano) and measures analog voltages by using a 10-bit analog-to-digital-converter [2]. The command analogRead() can measure a voltage at one of the analog inputs at a resolution of 210 = 1024 values and saves the data for further processing. The precision of the ATMEGA328P is at about ±2 LSB (Least Significant Bits) [2].
Commonly, the 10 bits are used to measure voltages between 0 and 5 V. In that case, the smallest resolution is thereby about 5 V/1024  0,005 V and thus the uncertainty of the measurement is in a worst-case-scenario
  2 LSB or 2 · 0.005 V = 0.01 V. However, this resolution and precision are way too low for several experiments with the above mentioned solar cell, such as measurements of varying situations of radiance (see also figure 2).

Figure 2. Comparing measurements of the solar cell's voltage output with the AD-converter's resolution of about 0.005 V, 0.001 V and 0.001 V with smoothing through mean averaging.
Download figure:
Standard image High-resolution imageThe voltage resolved by the AD-converter can be adjusted in many microcontrollers. In the case of the ATMEGA328P, the reference voltage of the AD-converter can be set from 5 V to 1.1 V by using the command analogreference(INTERNAL) [3]. This leads to a significantly increased resolution and a diminished uncertainty of measurement by a factor of 5 down to 1.1 V/1024  0.001 V
  0.002 V. The internal reference voltage is not necessarily precisely 1.1 V (see figure 2), however the exact value is not important for the given experimental context as measurements are only compared in relation to each other (e.g. of different angles of incidence of the radiation).
There is a short-coming of the Arduino that has to be noted: it can only measure voltages and not electrical currents. Additional modules that can measure currents are unsuitable, as both the measuring range is not fitting and they are often too expensive. Luckily, the electrical current can be determined indirectly by using a known resistor (e.g. a fixed load resistance), voltage and Ohm's Law I = U/R (see for further reading [4]).
4. Fluctuations during measurements
If a solar cell is irradiated by a thermal light source (e.g. light bulb) that is operated by 50 Hz AC voltage, it is possible that a 100 Hz harmonic is measured on the voltage of the cell (figure 3). The glowing spiral of a lamp run with 50 Hz AC voltage cools down twice per period, causing the radiation emitted to oscillate in strength. There are some thermal light sources, such as an overhead projector or a strong spot light, where this effect is not that prevalent as the glowing spiral is thicker and therefore does not cool down as drastically as a light bulb.

Figure 3. Harmonic of a solar cell visualized by an oscilloscope.
Download figure:
Standard image High-resolution imageThe harmonic can lead to a subsampling of the signal, resulting in an periodically oscillating representation of the data. This 'period duration' can be up to several seconds (compare figure 2).
The effects of this harmonic of the signal of the solar cell on the measurements can be reduced by integrating a low-pass into the circuitry (e.g. 4.7 μF and 20 kΩ, see http://physikkommunizieren.de/smart-for-science for diagram). However, it is not necessary to use a low pass: Another way to reduce the effect of the harmonic is by smoothing through mean averaging, which we used in the experiments described later (ten points of data were taken during those experiments for averaging). It is important to firstly record all data points and add them up (e.g. by using a loop with average += analogRead(pin)) and convert them afterwards, as the conversion takes a lot more time than taking the measurements.
In figure 2, measurements during the same levels of radiation hitting the solar cell with resolutions of 0.005 V and 0.001 V as well as a measurement using smoothing through mean averaging at a resolution of 0.001 V are contrasted. The figure shows that without the smoothing an oscillation of the data values with a period duration of several seconds is measured. The complete, commented programming code for the measurements described here is available at http://physikkommunizieren.de/smart-for-science.
5. How is the measured data transmitted to the smartphone?
There are several possibilities for data output with an Arduino: for instance, it is possible to use a display or an SD-card [4] or even a plug-in at a computer for direct data procession via Excel [5]. One way of data transmission from a smartphone is to use a Bluetooth low-energy (BT-LE).
The application phyphox can not only visualize the data derived from inbuilt sensors [6], but is also able to send data from external sensors via BT-LE to other devices [7]. In the here proposed version, the BT-LE module with nrf8001-chips is used to send data from the Arduino to the smartphone (see figure 4).

Figure 4. Simplified version of the circuitry used for measurements. The voltage supply is not included.
Download figure:
Standard image High-resolution imageThe Arduino's program code needs several commands to transmit its data to the application phyphox on a smartphone. It is furthermore possible to utilize an Arduino bibliotheca 1 for a much easier way of data transmission.
The application phyphox loads a configuration file via a QR code. This file sets the UUIDs (universally unique identifier) of the BT-Server on the Arduino as well as all relevant variables for transmission (so called characteristics). Additionally, the configuration file sets the way that transmitted data is further processed and visualized in the phyphox app. In the case proposed here, the Arduino sends the averaged values of voltage and current four times per second.
In phyphox, a variable for time is derived and a variable for power is calculated by multiplying current and voltage.
6. Implementation of the circuitry in the physics classroom (as carried out in smart-for-science project)
There are various ways of using the circuit presented here:
- (a)one possibility is to use the circuit (e.g. in a house) as a 'black box' when it is primarily a matter of recording the measurement data and interpreting the experiments carried out. The teacher then has to explain how the measurement data have to be interpreted (calculation of performance, averaging, etc). This application is also being pursued in the smart-for-science project.
- (b)alternatively, the functionality of the circuit (especially the measurement of voltage and current strength) as well as the processing of the values themselves (adjusting the resolution and averaging) can be in the focus and discussed.
- (c)students can also recreate the circuit themselves with low-cost materials as shown in figure 4 and can adapt or write the program for measurement and calculating the average value themselves.
As the project 'smart-for-science' (see [8, 9]) aims primarily at giving varying school classes an easily operable device for usage in experiments, the circuitry proposed above was built into several wooden model houses produced by a CNC-mill (figures 1 and 5). Note, that the houses could also be built with other means such as cardboards. These can each be powered by using a powerbank. For necessary robustness, the circuitry was soldered onto circuit boards which were connected to an Arduino UNO. It is, however, also possible to build the circuitry onto a breadboard (see figures 4 and 6). The power is turned on by a switch on the outside of the wooden model house. By scanning the QR code placed on one side of the house's roof with a smartphone, the phyphox-file for the experiment is transferred onto the phone and the data transmission between the house and smartphone starts. In phyphox it is possible to visualize the measured power, voltage and current including a timeline (figure 7).

Figure 5. Circuitry integrated into a wooden house together with a powerbank for power supply.
Download figure:
Standard image High-resolution image
Figure 6. Alternative way of building the circuitry by using a breadboard.
Download figure:
Standard image High-resolution image
Figure 7. Visualization of measured data via the app phyphox.
Download figure:
Standard image High-resolution image7. Model experiments in various contexts of radiation
In the physics classroom, solar cells are usually used for measuring U–I-characteristics (e.g. for determination of the MPP). In some cases, different light sources (light bulbs, energy-saving bulbs) at varying distances are incorporated to address more complex situational impacts on the power of a solar cell. In the following sections, several simple model experiments are introduced to enable learners to explore the power of a solar cell during different cloud constellations or times of day. To achieve this, several simplifications have to be made, e.g. that the light source (desk lamp) is aligned parallel to a tabletop and at a set distance of 30 cm away from the solar cell on top of the house (figure 8). Marks on different sheets that show where to place the house simplify the experimenting. It is advisable to use a black sheet as this choice diminishes the scattering of light around the solar cell (see experiment 2). The measured data also becomes a lot more precise when darkening the room that the experiment is conducted in or stopping sunlight from directly hitting the cell (see experiment 3). A complete darkening of the room is neither necessary nor advisable from a didactical point of view. When looking at the data, it is important to consider that contrary to a measurement using sunlight, the proposed setup does not even approximately use parallel light.

Figure 8. Basic setup for the experiments. The House is at a set distance to the desk lamp that is aligned parallel to the tabletop.
Download figure:
Standard image High-resolution imageThis fact especially has to be considered for measurements that depend on the angle of incoming irradiance. Consequently, these types of measurements can only be considered as qualitative or halfway-quantitative at best.
7.1. Experiment 1: influence of clouds in front of the sun (absorption)
7.1.1. Real phenomenon.
There are two ways that clouds can influence the power output of a solar cell: on one hand (experiment 1), clouds, water droplets or dirt particles between emitter (sun) and receiver (solar cell) can diminish the irradiance through absorption (and scattering). On the other hand (experiment 2), especially bright clouds can also increase the irradiance reaching the solar cell by diffuse scattering.
7.1.2. The phenomenon as implemented in the model experiment.
To examine the influence of absorption, several thin sheets of paper are prepared next to the light source (figure 9). The sheets are subsequently added between the light source and the solar cell, diminishing the irradiance gradually.

Figure 9. Setup for experiment 1 (absorption).
Download figure:
Standard image High-resolution image7.1.3. Observations and data measurements.
By adding more and more sheets in front of the lamp, the solar cell's power output gradually decreases (table 1).
Table 1. Exemplary data set of measured powers for experiment 1 (absorption).
| Number of sheets | 0 | 1 | 2 | 3 | 4 | 5 | 6 |
| Power in mW | 9 | 8 | 7 | 5 | 4 | 3 | 2 |
7.1.4. Practical advice.
It is advisable to use thin sheets of paper with about 20 g sqm−1, for instance sandwich paper. The sheets can be stapled together at one end and fixed to the lamp by using small magnets (e.g. tiny refrigerator magnets). The lamp is not to be switched on for too long as to prevent combustion of the sheets. To decrease any risks of the paper getting heated too much, it may further be advisable to add some mounting for the paper in front of the lamp to increase the distance between the bulb and the paper.
7.2. Experiment 2: influence of clouded sky (diffuse scattering)
7.2.1. Real phenomenon.
There are cloud constellations (e.g. many cumulus clouds in the sky, but no clouds between the sun and the solar cell) where the power output of a solar cell might exceed the output of a cloudless sky. Considering real solar panels, the percentage of the measured momentary power output caused by diffuse scattering might reach 50% [1].
7.2.2. The phenomenon as implemented in the model experiment.
In this experiment, the effects of diffuse scattering by clouds can be modelled. To achieve this, a white cover is put around the house, leaving only an opening at the side facing the lamp (figure 10).

Figure 10. Setup for experiment 2 (diffuse scattering).
Download figure:
Standard image High-resolution image7.2.3. Observations and data measurements.
The light reaches the model house and the solar cell directly. In addition to that light, the white cover scatters additional light towards the solar cell, increasing the irradiance (table 2). It is even possible to put a white sheet of paper on the ground between house and lamp (e.g. modelling snow), which increases the irradiance by diffuse scattering further. Reflective tiles on neighbouring houses can have the same effect since their albedo is similar to snow.
Table 2. Exemplary data set of measured powers for experiment 2 (diffuse scattering).
| Cover | No cover | White cover | Black cover |
|---|---|---|---|
| Power in mW | 9 | 11 | 9 |
7.2.4. Practical advice.
There are two ways of building the cover: it is possible to fold it from a white DIN-A2 sheet or use a shoe box which has its inside painted white or covered by white paper. Similarly, a black cover can be used for comparisons: firstly with respect to the white cover andsecondly with respect to the room in general the experiment is conducted in.
Whether the room that the experiment is conducted in has an effect when considering the scattering of light on the walls, can be seen when comparing a measurement of the solar cell's power with and without a black cover. When conducting the experiment in a slightly dimmed room without the ceiling lights switched on, there were no notable differences in the data sets, making the influence of light scattered by walls quite small (table 2).
7.3. Experiment 3: angle of incidence
7.3.1. Real phenomenon.
The angle of incidence of the sunlight is of great importance for the power output of a solar cell. A solar panel on a house in Europe is mostly installed directly on the roof and therefore has an angle of about 30°. Furthermore, a solar cell is in most cases installed in a way that it points south. Consequently the angle of impact of the light changes during the day and almost never hits the solar cell orthogonally. In the northern hemisphere, the power output of a solar cell is generally spoken at its highest around noon. When comparing the power gained at noon during different months of the year, it can be noted that during summer (may–july), the power output is highest [1].
7.3.2. The phenomenon as implemented in the model experiment.
This experiment aims to explore the angular dependence of a solar cell's power output. As it is quite difficult to model the correct positions of the sun during the day by using the lamp, only the horizontal angle is changed in this experiment and thus the height of the sun is always the same (figure 11). By this setup, the different positions of the sun during one day are roughly modelled, though the data gained should only be interpreted qualitatively because of the simplifications mentioned and the fact that the rays of the lamp are not parallel (see above as well).

Figure 11. Setup for experiment 3 (dependence on angle of incidence).
Download figure:
Standard image High-resolution image7.3.3. Observations and data measurements.
The data shows a maximum of irradiance when the lamp shines orthogonally (horizontally spoken, see table 3) onto the solar cell. When transferring this observation to the time of day, this means that the maximum power output of a solar cell is caused by light incoming perpendicularly. When considering a house in the northern hemisphere with its solar cells pointing south, this would be around noon. When conducting this experiment, not only the absolute values of the angles are interesting, but also the development of the power output across a day. This can be measured when turning the house from −90° to 90° in a constant motion (see figure 12).

Figure 12. Power as measured when turning the solar cell continuously from −90° to 90°.
Download figure:
Standard image High-resolution image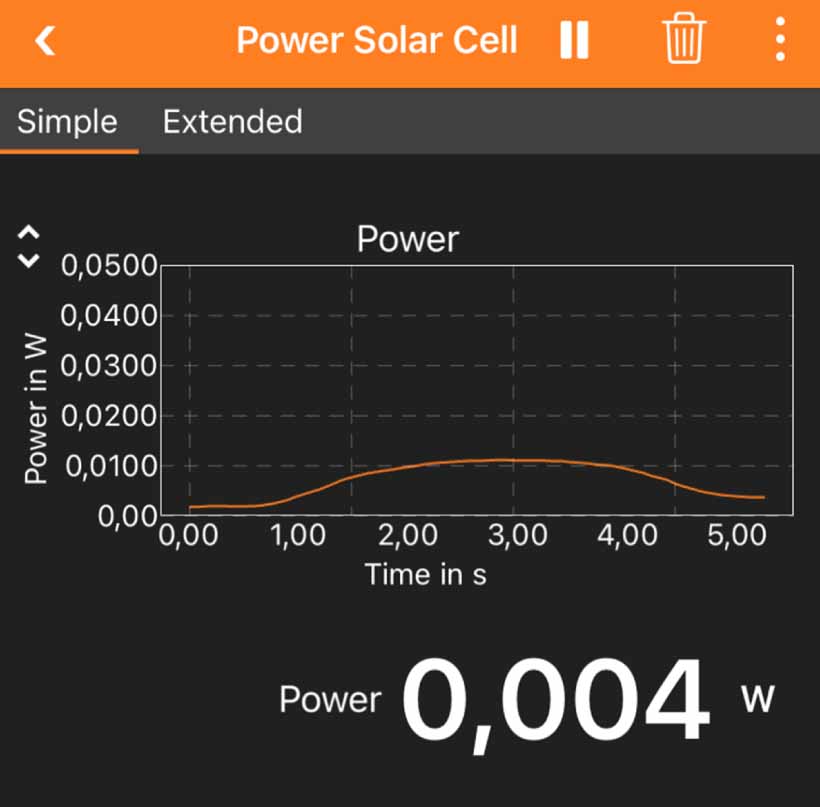
Table 3. Exemplary data set of measured powers for experiment 3 (dependence on angle of incidence).
| Horizontal angle between house and light source | −90° | −75° | −60° | −40° | −15° | 0° | 15° | 40° | 60° | 75° | 90° |
| Power in mW | 0 | 1 | 3 | 7 | 8 | 8 | 8 | 6 | 3 | 2 | 1 |
7.3.4. Practical advice.
When considering the data provided in example (table 3), a small increase in absolute irradiance when considering the positive angular values can be observed. This was likely caused by some sunlight coming through the windows during measurement: The exemplary data provided was not taken in a completely dimmed room for a more realistically conduct of the experiment as it would be in the physics classroom.
8. Outlook
The ownership and use of smartphones by young people is steadily increasing [10]. The meaningful embedding of smartphones in (science) lessons can be a good opportunity to develop necessary digital skills (e.g. digital problem solving and cooperative learning), such as in the strategy paper of the German guideline 'Bildung in der digitalen Welt' [11] or in the European competence framework 'DigCompEdu' [12]. Numerous studies have already shown that the use of digital media can improve the quality of teaching, if digital media (among other things) are used as a supplement to traditional media and also cooperatively [13].
In this article a best-practice example was presented to implement digital tools specifically in physics lessons. The added value for physics classrooms is the use and combination of the advantages of smartphones (especially graphic display of data and further processing options) and microcontrollers (inexpensive experiments (see also [14]) and digital recording of measured values) when carrying out cooperative basic experiments of electricity with a high relevance to everyday life and society. Students can use the presented circuit in different ways (see above) which can strengthen their independent experimental action, experience of competence and self-concept and develop digital skills.
Acknowledgments
The presented experimental method and the exemplary experiments have been developed in the context of the project 'smart for science' (supported by the Federal Ministry of Education and Research (BMBF 01JD1827)). The project aims to investigate the educational value of smartphones owned by students (Bring Your Own Device—BYOD) against smartphones owned by schools (Corporate Owned, Personally Embedded—COPE). Since smartphones are particularly relevant for STEM education, 'smart for science' examines conditions of successful usage as well as distractions comparing both approaches for chemistry, math and physics education. For the empirical study three workshops (one for each discipline) were developed dealing with electromobility as an increasingly urgent theme. In the physics workshop students conduct (smartphone) experiments presented in this article addressing the question: 'Can we charge an electric car with solar cells on the roof of our house?' Further materials related to this workshops are presented at http://physikkommunizieren.de/smart-for-science/.
In the frame of the project smart for science, funded by BMBF (01JD1827), we wish to acknowledge the following persons: Annette Marohn, Barbara Leibrock, Cornelia Denz, Elmar Souvignier, Fabienne Kremer, Gilbert Greefrath, Maurice Krause, Robin Janzik and Thorsten Quandt.
We would like to thank the developers at phyphox Sebastian Staacks and Dominik Dorsel from RWTH Aachen University for their cooperation and support in transferring data from the Arduino via Bluetooth to the phyphox smartphone app. Further information on the phyphox BT interface can be found on their page at https://phyphox.org/arduino
Data availability statement
All data that support the findings of this study are included within the article (and any supplementary files).
Footnotes
- 1
See https://phyphox.org/arduino/ for further information.