

Abstract
We report an experimental study of the structure of polymer-capped gold nanorods (AuNRs) binding to model phospholipid monolayers to elucidate the mechanism that drives the insertion of the AuNRs into phospholipid membranes. The experimental system consists of four different cases of AuNRs interacting with lipid monolayers: cationic and anionic polymer-capped AuNRs suspended in the pure water subphase of Langmuir monolayers of zwitterionic and anionic phospholipids, separately. Liquid surface x-ray reflectivity was used to measure in situ the structure of the lipids and AuNRs at the air-water interface with sub-nanometer resolution, yielding quantitatively the amount, orientation, as well as depth of AuNR insertion into the monolayer. In the case of a zwitterionic monolayer composed of 1-stearoyl-2-oleoyl-sn-glycero-3-phosphocholine, cationic Poly-diallyldimethylammonium chloride (PDC) capped AuNRs (PDC-AuNRs) adsorbed peripherally at the water-lipid interface whereas the anionic Poly-sodium 4-styrenesulfonate (PSS) capped AuNRs (PSS-AuNRs) penetrated deeply into the lipid monolayer. In the case of an anionic monolayer composed of 1-stearoyl-2-oleoyl-sn-glycero-3-phospho-(1'-rac-glycerol) (SOPG), PDC-AuNRs inserted into the monolayer whereas PSS-AuNRs were not even attracted to the monolayer. The results suggest that the adsorption process of AuNRs to model membranes may proceed through different mechanisms. In the presence of a charged membrane, electrostatic interactions drove the AuNRs to or away from the membrane depending on the nature of the charge of the lipid film and the AuNRs, while in the presence of a zwitterionic membrane, both electrostatic interactions and hydrophobic interactions mediated the insertion of the AuNRs into the membrane.
Export citation and abstract BibTeX RIS

Original content from this work may be used under the terms of the Creative Commons Attribution 4.0 license. Any further distribution of this work must maintain attribution to the author(s) and the title of the work, journal citation and DOI.
1. Introduction
There is a growing interest in the study of nanotechnology owning to the promising potential of applying nanoparticles to revolutionize the food, electronic and medical industries. In medicine, for example, nanoparticles are being designed to efficiently deliver drugs into organelles, for therapeutic and imaging purposes [1–4]. In particular, gold nanorods (AuNRs) are widely studied, due to their biocompatibility and optical tunability properties, especially for imaging and cancer therapies [5–9]. In biological applications, AuNRs may directly target cell membranes and may also be engulfed and transported by membrane-like structures, such as endosomes, lysosomes, and mitochondria [10]. Current studies have demonstrated that AuNPs coated with polyelectrolytes, such as poly-diallyldimethylammonium chloride (PDC) and poly-sodium 4-styrenesulfonate (PSS), increase the efficiency of internalization of the AuNRs by the cells and at the same time lower the cytotoxicity of the AuNPs [9]. It is therefore essential to better understand the mechanism by which polymer-capped AuNRs interact with cell membrane.
The questions on the nature of the driving force for the uptake of the polymer-capped AuNRs to the cell membrane, and what role electrostatic versus hydrophobic interactions play in the uptake has attracted extensive attention in the field. Coarse-grained molecular dynamics (MD) simulation has been the primary method to provide atomic-level details on the structure and dynamics of nanoparticle-cell membrane interactions. In their studies on the mechanism of alkanethiol ligated gold nano-polyhedrons (AuNPs) interacting with model cell membranes composed of zwitterionic lipid bilayers or anionic lipid bilayers, it has been reported that (a) cationic AuNPs adsorb to and penetrate into anionic bilayers while anionic AuNPs, in the absence of counterions, do not bind to the anionic bilayers, (b) both cationic and anionic AuNPs adsorbed peripherally to zwitterionic bilayers, and (c) hydrophobic charge-neutral AuNPs do not bind to either zwitterionic or anionic bilayers [11, 12]. Other simulations with similar model AuNPs and bilayers further demonstrated that charged AuNPs not only adsorb to but also penetrate into zwitterionic bilayers if the ligands possess highly hydrophobic protruding side chains [13, 14]. These studies indicated that electrostatic and hydrophobic interactions are the two main forces that drive passivated gold nanoparticles into lipid membranes.
Experimental studies providing in situ molecular details of nanoparticle-cell membrane interactions, especially of AuNRs-membrane interactions, however, are lagging behind. The main reason may be that many different factors, such as size, aspect ratio of the AuNR cores, compositions and charges of the polymer coating, are all at play and may affect the interactions between AuNRs and membranes [6, 15, 16]. In addition, in most in vitro or in vivo experiments, samples usually contain multiple components, such as proteins, ions, mixed phospholipids, and unbound ligands of the nanoparticles [17]. Therefore, the complexity of the experimental system prevents one from obtaining a clear picture of the mechanism of the AuNR uptake process to cell membranes, in particular, the process of adsorption and penetration of AuNRs into membranes. Furthermore, most of the characterizations of nanoparticle-membrane interactions are carried out using various imaging methods, such as transmission electron microscopy (TEM) [18], scanning tunneling microscopy (STM) [19] or atomic force microscopy [20]. Although these methods provide direct visual observations, detailed in situ measurements of AuNRs adsorbed and penetrating into cell membranes, with molecular resolution, are still missing.
In this work, we describe in-situ measurements of the bound structure of polymer-capped AuNRs to Langmuir monolayers of phospholipids using liquid surface x-ray reflectivity (XRR) and Langmuir monolayers. Cell membranes are composed of two layers of phospholipids and are mainly surrounded by an aqueous environment on both sides. A Langmuir monolayer representing half of a bilayer is a good model for mimicking one leaflet of the cell membrane [21–23]. Experimental studies of nanoparticle-cell membrane interactions have been reported from isotherm measurements using a Langmuir trough [24]. Isotherms provide macroscopic measurements, thereby, can only produce qualitative and indirect information on the interaction of the lipid monolayer with nanoparticles. Liquid surface XRR, on the other hand, have the advantage of providing detailed structural information on both the lipids and the AuNRs at the air–water interface with sub-nanometer resolution, yielding quantitatively the amount, the orientation, as well as the depth of AuNR penetration into the monolayer [25–27].
In order to isolate the effects of electrostatics and hydrophobic interactions, we designed four experimental samples consisting of two Langmuir monolayers of lipids with different electrostatic properties and two oppositely charged polymer-capped AuNRs suspended in the water subphase of the monolayer. The two lipids are zwitterionic 1-stearoyl-2-oleoyl-sn-glycero-3-phosphocholine (SOPC) and anionic 1-stearoyl-2-oleoyl-sn-glycero-3-phospho-(1'-rac-glycerol) (SOPG), and the two AuNR samples have one capped by cationic PDC (PDC-AuNRs) and the other by anionic PSS (PSS-AuNRs). Monolayers of SOPC and SOPG are used to model the overall neutral outer leaflet and the negatively charged inner leaflet of the bio-membranes, respectively, and the model AuNRs selected have been widely used in the studies of nanomedicine due to their low cytotoxicity in transmembrane drug delivery [6, 9]. We find that (a) cationic PDC-AuNRs adsorb to and penetrate into anionic SOPG monolayers, whereas anionic PSS-AuNRs do not bind to anionic SOPG monolayers, (b) PDC-AuNRs adsorb peripherally to SOPC monolayers, and (c) PSS-AuNRs adsorb to and penetrate into SOPC monolayers. Our results are consistent with MD simulation studies reported elsewhere [11, 12].
2. Materials and methods
2.1. Preparation and characterization of polymer-capped gold nanorods
The selection of polymer-capped AuNRs in this work, namely positively charged Poly-diallyldimethylammonium capped AuNRs (PDC-AuNRs) and negatively charged PSS capped AuNRs (PSS-AuNRs), is based on the work by Prof. Chen's group in their study of the effect of the surface chemistry and aspect ratio of the core of AuNRs on the cellular uptake and toxicity of polymer-capped AuNRs [9, 27]. They reported that a rod-shaped gold core, with an aspect ratio of four, capped with cationic chloride PDC in the outmost layer of the AuNRs yields high cellular uptake efficiency with negligible toxicity.
The aspect ratio of the gold cores used in this work is  , with a mean length of
  and a width of
  , as determined by TEM as shown in figure 1(a). The chemical structure of the polymer-capped AuNRs is shown schematically in figure 1(b). Both PSS and PDC, being polyelectrolytes, are hydrophilic [28, 29], and both PDC-AuNRs and PSS-AuNRs suspense well in water (details see supplementary A (available online at stacks.iop.org/JPMATER/4/034004/mmedia)). The zeta potentials,
  , of PDC-AuNRs and PSS-AuNRs measured using dynamic size analyzer (Malvern Zeta sizer Nano ZS) are
  and
and  , respectively [9].
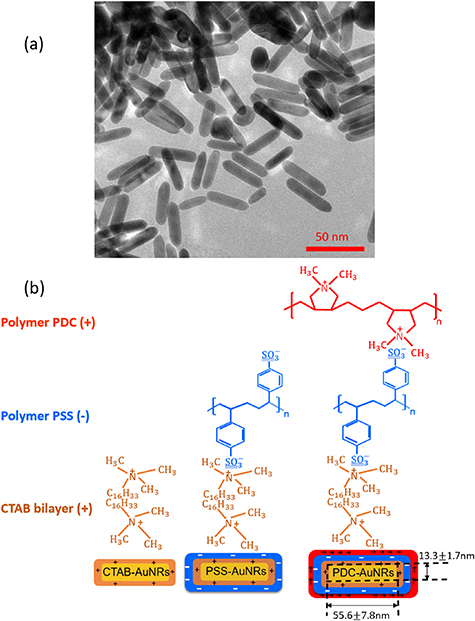
Figure 1. (a) TEM images of AuNRs with aspect ratio of  . (b) Schematics of cationic PDC-AuNRs and CTAB-AuNRs, and anionic PSS-AuNRs.
Download figure:
Standard image High-resolution imageThe preparation of PDC-AuNRs and PSS-AuNRs has been described in detail elsewhere [5, 6]. Briefly, the seed-mediated method was used to produce cetyltrimethylammonium bromide (CTAB) bilayer capped AuNRs (CTAB-AuNRs) [30, 31]. A layer of anionic PSS (average molecular weight of  ) was then coated over CTAB-AuNRs via a layer-by-layer approach to produce PSS-AuNRs. Subsequently, a layer of cationic PDC (average molecular weight of
  ) was coated over PSS-AuNRs via a similar layer-by-layer approach to produce PDC-AuNRs.
Right before being injected into the trough, each AuNR suspension was centrifuged twice at  for
for  min and
  of the suspension fluid was removed and pure water was added after each centrifugation. We use this procedure to remove most of the excess free ligands that were added to stabilize AuNRs for long-term storage [6, 10, 32]. We observed in our previous study of cellular uptake of AuNRs that centrifuged AuNR suspensions became unstable within a few days after most of the excess free ligands were removed, resulting in a lower rate of cellular uptake [32]. In this work, all the AuNR samples were used in the same day after most of the excess free ligands were removed.
2.2. Langmuir trough method for monolayer preparation
To mimic the fluid nature of the plasma membrane, we chose unsaturated PC and PG lipids [33, 34] over saturated ones such as 1,2-dipalmitoylphosphatidylcholine (DPPC) or 1,2-dipalmitoyl-sn-glycero-3-phosphoglycerol (DPPG). When fully packed at the air-water interface, the unsaturated PC and PG lipids self-assemble into disordered liquid monolayers (as shown in this work) while the saturated lipids form 2D crystalline [35].
Although 1-palmitoyl-2-oleoyl-snglycero-3-phosphatidylcholine (C16:0–18:1PC, POPC) and 1-palmitoyl-2-oleoyl-snglycero-3-phosphatidylglycerol (C16:0–18:1PG, POPG), instead of SOPC (C18:0–18:1PC) and SOPG (C18:0–18:1PG), are ubiquitous in mammalian, plant or bacterial cell membranes, their Langmuir monolayers are prone to x-ray radiation damage [36]. However, Langmuir monolayers of SOPC and SOPG, with the slightly extended saturated acyl chain, are suitable for x-ray scattering measurements, because they showed no detectable radiation damage during the time period required for the measurements in this and previous studies [25, 26].
Because the focus of this study is to understand the nature of the interactions between the lipids and AuNRs, we chose pure SOPG and SOPC monolayers to model charged and charge-neutral single leaflets of the biomembranes to isolate the interactions, even though cell membranes are composed of mixture of charge-neutral and charged phospholipids.
Chemical structure and illustration of the SOPC and SOPG lipids are shown in the inset of figure 2(a). Phospholipid SOPC and SOPG (Avanti Polar Lipids) were used without further purification. Solutions of SOPC and SOPG were prepared in chloroform (Fisher HPLC grade) at a concentration of  and
and  , respectively.
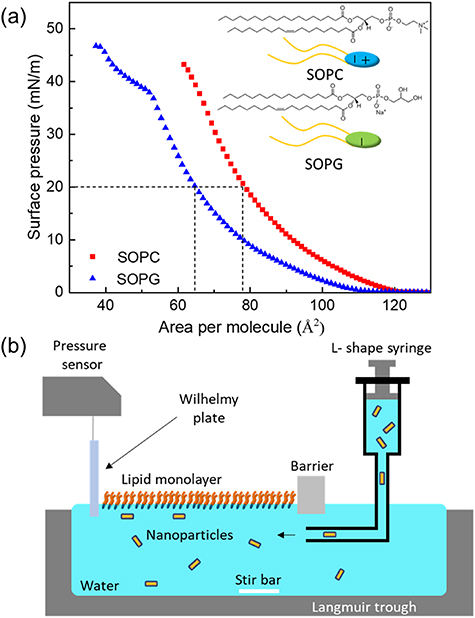
Figure 2. (a) Surface pressure–area isotherms of SOPC and SOPG monolayers on the surface of water. Chemical structures of SOPC and SOPG lipids are shown in the inset. (b) Schematic view of a Langmuir trough used in XRR experiments. A lipid monolayer is spread on the surface of water and compressed to a surface pressure of  . Then, an AuNR suspension is injected into the water subphase from the opposite side of the barrier via an L-shaped syringe.
Download figure:
Standard image High-resolution imageThe surface pressure–area isotherm monolayer measurements were conducted at room temperature ( ) using a hermetically sealed single-barrier Teflon trough, custom-designed for liquid surface x-ray measurements. The surface pressure and area of the trough are controlled by a NIMA controller (NIMA, UK). The dimension of the trough is
  . The maximal water subphase volume within the trough is approximately
  . The surface area of the monolayer, controlled with a motorized barrier, can be varied from
  down to
  , and the surface pressure,
  was measured with a Wilhelmy plate, using

where  is the surface tension of pure water (
 at
at  ) and
) and  is the surface tension of the monolayer.
Four different lipid monolayer-AuNRs samples were prepared for this study: a monolayer of zwitterionic SOPC with cationic PDC-AuNRs and anionic PSS-AuNRs suspended in the water subphase, referred to as SOPC/PDC-AuNRs and SOPC/PSS-AuNRs, respectively, and a monolayer of anionic SOPG with cationic PDC-AuNRs and anionic PSS-AuNRs suspended in the water subphase, referred to as SOPG/PDC-AuNRs and SOPG/PSS-AuNRs, respectively.
Samples were prepared as follows. Lipid solution ( SOPC in chloroform or
  SOPG in chloroform) was spread onto a clean water surface (Millipore Water System,
  resistivity) in the custom-designed x-ray trough. After waiting for
  min for the chloroform to completely evaporate, the lipid monolayer was compressed to a target surface pressure of
  at a rate of
  . The mode was then switched from compression to an automatic constant-pressure control at
  , a surface pressure at which monolayers of SOPC and SOPG are in a fluid phase that is similar to the physiological states of most biological membranes [37]. Compression isotherms of SOPC and SOPG monolayers up to collapse are shown in figure 2(a); at
  the surface area was at
  /molecule and
  /molecule for monolayers of SOPC and SOPG, respectively. For comparison, the surface area at a room temperature was measured to be
  /molecule and
  /molecule for bilayers of SOPC and SOPG, respectively [33, 34].
At the controlled target pressure ( ), the AuNR suspension was injected into the water subphase using an L-shaped needle inserted from the side of the barrier with no monolayer present so as not to disturb the compressed monolayer, as illustrated in figure 2(b). The final concentration of AuNRs in the trough for all four samples was
  . The residual amounts of unbound CTAB, and PDC in an AuNRs solution of
  are estimated to be about
  , and
, and  , respectively [27], and that of unbound PSS is about
  , similar to that of PDC.
After injecting the AuNR suspension into the trough, the subphase was stirred at  with a Teflon-capped magnetic stir bar for
  min in order to homogenize the subphase while keeping the monolayer intact. Subsequent measurements started
  min after the stirring was stopped. All the measurements were performed at
  .
.
We note that grazing incident angle x-ray diffraction was performed on both SOPC and SOPG monolayers, but no diffraction peaks were observed, indicating that both monolayers were in liquid (disordered) phase.
2.3. X-ray reflectivity (XRR) measurements
We used liquid surface XRR to determine the structure of the monolayer system normal to the interface. These x-ray measurements were performed at NSF's ChemMatCARS 15-ID beamline at the Advanced Photon Source, Argonne National Laboratory, using a liquid interface scattering instrument [38, 39]. The geometry of liquid interface x-ray scattering measurements from a lipid monolayer at the air-water interface is illustrated in figure S1, and an x-ray energy of  (corresponding to an x-ray wavelength of
  ) was used for all the measurements. Detailed information on XRR measurements and data analysis are given in the supplemental support (supplementary B).
3. Results and discussion
We first investigated the behavior of pure SOPC and SOPG monolayers as a function of time. We then examined the surface activities of free ligands, CTAB, PSS and PDC, at the pure air-water interface, followed by the study of the interactions between these free ligands and the lipid monolayers. Finally, we examined the interactions between the lipid monolayers and the AuNRs. The reasons to first study the behaviors of pure ligands are twofold: (a) the AuNRs in our study are entirely capped with multilayers of PSS or PDC, so that the interactions between the AuNRs and the lipid monolayers are dictated by the interactions between those polymers and the monolayers; (b) the sample preparation process for the AuNRs leaves ligated AuNRs coexisting with unbounded CTAB, PSS and PDC in the suspensions, so that the surface activities of the pure ligands may not be negligible.
3.1. Structure and behavior of monolayers of SOPC and SOPG at the air-water interface
The change in the surface area of monolayers of SOPC and SOPG as a function of time at a constant surface pressure of  is shown in figure 3(a). For each monolayer, the surface area decays as a function of time but at a different rate compared to the other, indicating that the lipid molecules are gradually disrobed into the subphase from the interface. Note that this time-dependent behavior is not due to the imperfection of the x-ray trough used, because the same trough was also used to control the saturated phospholipid monolayers of DPPC and DPPG at a constant pressure and the surface area remained constant for hours.
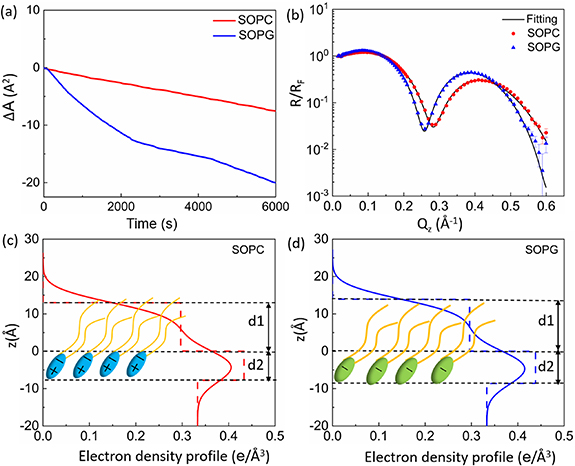
Figure 3. (a) Molecular area change (starting from when the compression was stopped) versus time for both pure SOPC and SOPG monolayers on the surface of pure water under a constant surface pressure of 20  . (b) Fresnel normalized x-ray reflectivity data for SOPC and SOPG monolayers on the surface of pure water at 20
  . (c) and (d) Electron density profiles (solid lines) obtained from fits to the reflectivity curves, shown in (b), using a box model. Dashed lines in (c) and (d) represent the electron density profiles obtained with the roughness parameter σ set to zero.
Download figure:
Standard image High-resolution imageNormalized XRR curves,  , of pure SOPC and SOPG monolayers controlled at
  are shown in figure 3(b) (note that the reflectivity of the monolayers at different times is essentially reproducible while the surface area is decreasing, as shown in figure S2 (supplementary C), indicating that the structure of the monolayer is stable under a constant pressure). The oscillations in the
  curves are the results of the x-ray interference from interfaces between layers of different electron densities: air, lipid tail group, lipid head group, and water. Essentially, the thickness of the layers determines the minima of the oscillations, and the electron densities of the layers affect the amplitudes of the oscillations, although strictly speaking these two parameters, thickness and electron density, are slightly coupled in the fitting.
Figures 3(c) and (d) show the electron density profiles derived from fitting the XRR data of the monolayers to a two-box model. The two-layer electron density profile (solid line in figures 3(c) and (d)) provides a molecular model for the lipid monolayers: the top layer represents hydrophobic tail region above the water surface with electron density of  and thickness of
  ; the bottom layer represents the hydrophilic head group region below the water surface with electron density of
  and thickness of
  ; all the interfacial roughness values were set to the same value of
  depicting the amplitude of capillary waves. The dashed lines represent the electron density profiles with a zero roughness
  and the solid lines represent the same profiles smeared by the interfacial roughness of
  for all three interfaces. The fitted mean thickness of the tail and head regions of the SOPC monolayer are
  and
and  , respectively, with an overall thickness of
  . These structural parameters of SOPC are consistent with previous measurements [25, 26, 40]. For the SOPG monolayer, the mean thickness of the tail and head regions are
  and
and  respectively, with an overall thickness of
  . The fitted parameters for several different monolayer samples are shown in tables 1 and 2. The best fit is obtained by the nonlinear least-squares method. The error bar for each parameter is determined by fixing a parameter at different values away from its optimum and readjusting all other parameters to a new fit within one standard deviation from the best fit.
Table 1. Fitted parameters for  of SOPC/ligand samples. Each of these measurements was preceded by that of a pure SOPC monolayer.
| SOPC | 0.5  CTAB in SOPC
| SOPC | 0.5  PDC in SOPC
| SOPC | 0.5  PSS in SOPC
| |
|---|---|---|---|---|---|---|
 ( ( ) ) |

|

|

|

|

|

|

|

|

|

|

|

|

|
 ( ( ) ) |

|

|

|

|

|

|

|

|

|

|

|

|

|
 ( ( ) ) |

|

|

|

|

|

|
 + +  ( ( ) ) |

|

|

|

|

|

|
Table 2. Fitted parameters for  of SOPG/ligand samples. Each of these measurements was preceded by that of a pure SOPG monolayer.
| SOPG | 0.5  CTAB in SOPG CTAB in SOPG | SOPG | 0.5  PDC in SOPG
| SOPG | 0.5  PSS in SOPG
| |
|---|---|---|---|---|---|---|
 ( ( ) ) |

|

|

|

|

|

|

|

|

|

|

|

|

|
 ( ( ) ) |

|

|

|

|

|

|

|

|

|

|

|

|

|
 ( ( ) ) |

|

|

|

|

|

|
 + +  ( ( ) ) |

|

|

|

|

|

|
3.2. Interactions between unbound ligands and lipid monolayers
We started by testing the surface activity of AuNRs solutions at the pure air-water interface. The concentration of PDC-AuNRs and PSS-AuNRs in the custom-designed x-ray trough was  and the samples were stirred for
  min before isotherms were measured. Figure S3 (supplementary D) shows that the surface pressure for both samples was about zero over the full compression of the surface area and remained at zero over the next several hours (not shown). This indicates that not only PDC-AuNRs and PSS-AuNRs, but also the unbound ligands, CTAB, PSS and PDC, are not surface active at the pristine air-water interface. XRR was not performed for these samples.
Following the test with the pure water interface, we then studied the interactions between free ligands and the lipid monolayer. Six monolayer/ligand samples were studied, which were prepared as follow: pure lipid monolayers of SOPC and SOPG were compressed to a target pressure of  and then pure ligands of CTAB, PSS and PDC were injected under the monolayers, respectively. The bulk concentration of the ligands in all six samples is
  , which is
  times higher in concentration than that of the unbound ligands in the lipid/AuNR samples studied. As mentioned in section 2.2, the estimated concentration of the unbound ligands in the lipid/AuNR samples are
  ,
,  and
and  for CTAB, PSS and PDC, respectively. Monolayer/ligand systems with these lower concentrations of ligands were also studied, but the effect of the ligands on the structure of the monolayers was found to be minimal (see figure S4, supplementary E).
The time-dependent isotherms, normalized XRR data,  , and electron density profiles of monolayer/ligand samples, compared with those of pure SOPC and SOPG monolayers are shown in figures 4(a)–(c), respectively; measurement of each monolayer/ligand sample was preceded by that of a pure lipid monolayer. The fitted parameters to the XRR data are listed in tables 1 and 2.

Figure 4. (a) Dynamic variation of the surface area with time under a constant surface pressure of 20  , measured for pure lipid (SOPC or SOPG) monolayers and for the interactions between pure ligands (CTAB, PDC or PSS) and lipid monolayers, after injecting corresponding ligands into the subphase. (b) Fresnel normalized x-ray reflectivity data for a SOPC monolayer (b-1) and a SOPG monolayer (b-4) with and without 0.5
  CTAB solution, a SOPC monolayer (b-2) and a SOPG monolayer (b-5) with and without 0.5
  PDC solution, a SOPC monolayer (b-3) and a SOPG monolayer (b-6) with and without 0.5
  PSS solution in the subphase at a surface pressure of 20
  . Solid lines are best fits to the data. (c) The corresponding electron density profiles obtained from fits to the reflectivity curves.
Download figure:
Standard image High-resolution imageDue to the instability of the lipid monolayers, it is difficult to quantify the effect of the free ligands using isotherm measurements. Qualitatively, it is reasonably clear that (a) surface area of the zwitterionic SOPC monolayer increased noticeably either in the presence of the cationic CTAB (figure 4(a-1)) and PDC (figure 4(a-2)), or anionic PSS (figure 4(a-3)); (b) surface area of the anionic SOPG monolayer expanded drastically in the presence of the CTAB (figure 4(a-1)) and PDC (figure 4(a-2)), but only slightly in the presence of the PSS (figure 4(a-3)).
Fitting of the XRR data with a two-box model shows, within the error bars, that (a) in the case of SOPC monolayer, the thickness of the tail group,  , of SOPC became smaller in the presence of the CTAB (figure 4(c-1)) and PSS (figure 4(c-3)), but changed very little in the presence of the PDC (figure 4(c-2)); (b) in the case of SOPG monolayer, both
  and the electron density of the head group region,
  , of SOPG monolayer were decreased in the presence of CTAB (figure 4(c-4)) and PDC (figure 4(c-5)), but the effect of PSS (figure 4(c-6)) on the structure of the SOPG monolayer is undetectable; (c) in the presence of PDC, the decrease in the values of both
  and
and  of SOPG monolayer (figure 4(c-5)) is larger than that of SOPC monolayer (figure 4(c-2)).
The results from these two experimental methods are consistent with each other. They indicate that (a) the effect of CTAB and PSS on the structure of SOPC monolayer is stronger than that of PDC on SOPC monolayer; (b) CTAB and PDC change the structure of SOPG monolayer while PSS does not interact with SOPG monolayer; and (c) the effect of CTAB and PDC on the structure of SOPG monolayer is stronger than on the structure of SOPC monolayer.
3.3. Interactions between AuNRs and lipid monolayers
Now we examine the interactions between the lipid monolayers and the AuNRs. Both the Langmuir trough method and XRR were applied in these measurements. The experimental procedures for the preparation of the AuNRs under the lipid monolayers are described in section 2.2. In all the measurements, the concentration of the AuNRs in the subphase was  except for one measurement in which the effect of the concentration of AuNRs in the subphase was explored. Measurement of each monolayer/AuNRs sample was preceded by that of a pure lipid monolayer.
Figure 5(a) shows the Langmuir trough measurements of the change in surface area,  , as a function of time after AuNRs were injected into the subphase of the monolayer while the surface pressure of the monolayer was held at
  . The surface area of the monolayers expanded after the injection of PSS-AuNRs (figure 5(a-2)) but kept decaying after the injection of PDC-AuNRs (figure 5(a-1)). This result appears to indicate that PSS-AuNRs particles inserted themselves into both monolayers, while PDC-AuNRs did not interact with either SOPC or SOPG monolayers. However, it will become clear, after the XRR results are presented, that the isotherm results are obscured by both the instability of the monolayers and the adsorption of the free ligands in the AuNR solution, as shown in sections 3.1 and 3.2.
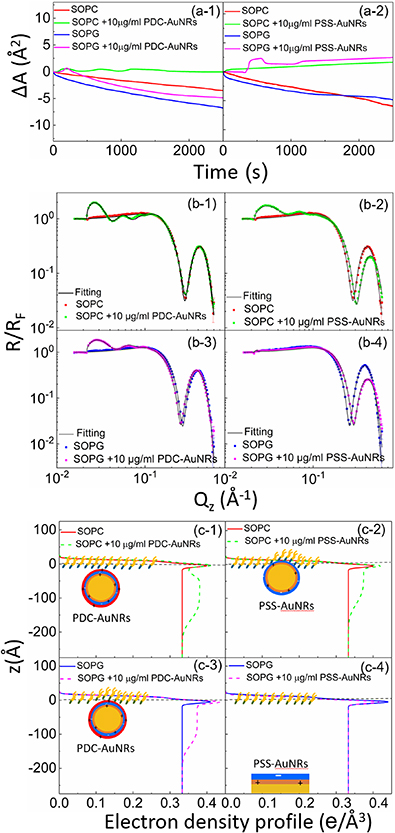
Figure 5. (a) Dynamic variation of the surface area with time under a constant surface pressure of 20  , measured for SOPC and SOPG monolayers with or without the presence of PDC-AuNRs (a-1) or PSS-AuNRs (a-2) in the subphase. (b) Fresnel normalized x-ray reflectivity data for a SOPC monolayer (b-1) and a SOPG monolayer (b-3) with and without 10
  PDC-AuNRs, a SOPC monolayer (b-2) and a SOPG monolayer (b-4) with and without 10
  PSS-AuNRs in the subphase, at a surface pressure of 20
  . Solid lines are best fits to the data. (c) The corresponding electron density profiles are obtained from fits to the reflectivity curves in (b).
Download figure:
Standard image High-resolution imageNormalized XRR curves,  , of monolayer/AuNRs samples, compared with that of the pure monolayers, are shown in figure 5(b). We note that
  min after the stirring was stopped, XRR data taken at different locations of the sample along the trough for more than
  h were reproducible for all the samples studied (see figure S5 for one set of these measurements, supplementary F), indicating that these systems were in a stable state. Because the thickness of the surface layers determines the wavelength of the oscillations in an XRR curve, the signals of the AuNRs (gold core of
  ) are distinctly different from those of pure lipids (
 long). The oscillations with a shorter period in the lower
  region,
  , are produced by the gold core of the AuNRs [41, 42] and the oscillations of a longer period in the higher
  region,
  , similar to that shown in figure 4(b), are produced by the lipid monolayer. Log-log scale is used here to emphasize the order of magnitude difference in length scales between the AuNRs and the lipid monolayer. It is very clear from the XRR curves that the anionic SOPG monolayer attracted cationic PDC-AuNRs but repelled anionic PSS-AuNRs, whereas zwitterionic SOPC monolayer attracted both the PDC-AuNRs and PSS-AuNRs to the interface.
To extract detailed binding structures of AuNRs to the lipid monolayer, we fitted the XRR data (figure 5(b)) with a Box-Model consisting of 4-boxes of different electron density and thickness (figure 5(c)). The first two boxes model the hydrophobic tail and the hydrophilic head group regions of the lipid monolayer, as done for the pure lipid monolayer discussed in section 3.1. The third box models the region between the lipid monolayer and the Au core layer (electron density of  , thickness of
  , and roughness of
  ). The fourth box models the Au-core layer (electron density of
  , thickness of
  , and roughness of
  ). All the fitted parameters are shown in tables 3 and 4. We tried to add a fifth box modeling the ligand layer between the Au-core and water, but this did not improve the quality of fitting of the data, most likely due to the large size distribution of the gold core
  manifested in the larger value of the roughness of
  (
( ).
).
Table 3. Fitted parameters for  of SOPC/AuNRs samples. Each of these measurements was preceded by that of a pure SOPC monolayer.
| SOPC | SOPC + 10  PDC-AuNRs PDC-AuNRs | SOPC | SOPC + 10  PSS-AuNRs PSS-AuNRs | |
|---|---|---|---|---|
 ( ( ) ) |

|

|

|

|
 (e (e  ) ) |

|

|

|

|
 ( ( ) ) |

|

|

|

|
 (e (e  ) ) |

|

|

|

|
 )( )( ) ) |

|

|

|

|
 ( ( ) ) | N/A |

| N/A |

|
 (e (e  ) ) | N/A |

| N/A |

|
 ( ( ) ) | N/A |

| N/A |

|
 ( ( ) ) | N/A |

| N/A |

|
 (e (e  ) ) | N/A |

| N/A |

|
 ( ( ) ) | N/A | 24.7 | N/A |

|
| Surface Coverage (%) |

|

|
Table 4. Fitted parameters for  of SOPG/AuNRs samples. Each of these measurements was preceded by that of a pure SOPG monolayer.
| SOPG | SOPG + 10  PDC-AuNRs PDC-AuNRs | SOPG | SOPG + 10 PSS-AuNRs PSS-AuNRs | |
|---|---|---|---|---|
 ( ( ) ) |

|

|

|

|
 (e (e  ) ) |

|

|

|

|
 ( ( ) ) |

|

|

|

|
 (e (e  ) ) |

|

|

|

|
 )( )( ) ) |

|

|

|

|
 ( ( ) ) |

|

|

|

|
 (e (e  ) ) |

|

|

|

|
 ( ( ) ) |

|

|

|

|
 ( ( ) ) |

|

|

|

|
 (e (e  ) ) | N/A |

| N/A |

|
 ( ( ) ) | N/A | 25.4 | N/A |

|
| Surface Coverage (%) |

| N/A |
We first examine the changes in the ordering of the lipids in the presence of the AuNRs. As will be shown below, the surface coverage of the adsorbed AuNRs is less than  , thus it is reasonable to assume that the AuNRs do not disturb the ordering of the lipids. Therefore, any changes in the ordering of the lipids may be attributed to the surface activities of the unbound ligands, CTAB, PSS and PDC, in the respective AuNR solutions. The ordering of the lipid molecules at the interface can be inferred from the top two boxes of the fitted electron density profiles shown in figure 5(c), an effect that can be identified qualitatively both from the shifting of the minima on the XRR curve and the change of the overall shape of the XRR curve at a higher
  range
range  . As shown in figures 4 and S4, the effect of the free ligands on the structure of the monolayer depends on the concentration of the free ligands in the subphase. Therefore, changes observed in the higher
  region in the XRR curves of PSS-AuNRs both in SOPC (figure 5(b-2)) and SOPG (figure 5(b-4)) monolayers may be attributed to the higher concentration of the unbounded PSS and CTAB than estimated in the PSS-AuNR suspension. Likewise, because the changes in the higher
  region in the XRR curves of monolayer/PDC-AuNRs samples (figures 5(b-1) and (b-3)) are negligible, we infer that the estimates for the unbounded ligands in these samples are reasonably close, likely due to the additional PDC layer over the PSS-AuNRs.
We now examine the structure of cationic PDC-AuNR and anionic PSS-AuNR layers under the zwitterionic SOPC lipid monolayer, compared with the structure of those AuNR layers under the anionic SOPG lipid monolayer.
In the case of cationic PDC-AuNRs suspended under zwitterionic SOPC monolayers (SOPC/PDC-AuNRs), the fitted values of the thickness and the electron density of the third box modeling the ligand layer are,  and
and  , respectively, and that of the fourth box modeling the Au-core layer are
  and
and  , respectively (figure 5(c-1)). The fitted thickness of the Au-core layer,
  , is close to the diameter of the AuNRs obtained from TEM image analysis (
 ), indicating that the long-axis of the AuNRs is aligned in the horizontal plane. This four-layer electron density profile suggests that the Au-cores of PDC-AuNRs did not penetrate into the zwitterionic SOPC monolayer. From the electron density of the Au-core, we estimate the surface coverage of adsorbed PDC-AuNRs in the SOPC to be about
  (supplementary G).
In the case of anionic PSS-AuNRs suspended under zwitterionic SOPC monolayers (SOPC/PSS-AuNRs), the fitted thickness,  , of third box is negligible, indicating that the ligand-layer of the PSS-AuNRs penetrated fully into the monolayer region. The fitted values of the thickness and the electron density of the fourth box modeling the Au-core layer are
  and
and  , respectively (figure 5(c-2)). Since the thickness of the Au-core layer here is significantly less than that of Au-core layer in SOPC/PDC-AuNRs (
 , the result suggests that, in addition to the ligand-layer, part of the Au-core region of the PSS-AuNRs, about
  thick, is also inserted into the zwitterionic SOPC monolayer. The surface coverage of adsorbed PSS-AuNRs in the SOPC is estimated to be about
  .
.
In the case of cationic PDC-AuNRs suspended under anionic SOPG monolayers (SOPG/PDC-AuNRs), the fitted thickness of the third box is also negligible, indicating again that the ligand-layer penetrated fully into the monolayer region. The fitted values of the thickness and the electron density of the fourth box modeling the Au-core layer are  and
and  , respectively (figure 5(c-3)). Since
  is close to the thickness of the Au-core layer of SOPC/PDC-AuNRs (
 , the result suggests that the Au-core layer of PDC-AuNRs is right under the SOPG monolayer. The surface coverage of adsorbed PDC-AuNRs in the SOPG is estimated to be
  .
.
In the case of anionic PSS-AuNRs suspended under anionic SOPG monolayers (SOPG/PSS-AuNRs), no oscillation was observed at the low  region of the XRR curve (figure 5(b-4)), which indicates that no PSS-AuNRs particles were adsorbed on SOPG monolayer, within the sensitivity of the XRR measurements.
We summarize the results from XRR measurements of the four cases as follows:
- (a)Under zwitterionic SOPC monolayer, both cationic PDC-AuNRs and anionic PSS-AuNRs are attracted to the monolayer. While PDC-AuNRs attach to the monolayer peripherally (figure 5(c-1)), PSS-AuNRs penetrate deeply into the monolayer (figure 5(c-2))—not only does the ligand-layer of the PSS-AuNRs fully penetrate into the monolayer, but their Au-core layer also inserts about
 deep into the monolayer as well. This is consistent with the measurements on the interactions between SOPC monolayer and pure PSS and PDC ligands, which show that the effect of PSS on the structure of the monolayer (figure 4(c-3)) is significantly stronger than that of PDC on the monolayer (figure 4(c-2)).
 - (b)Under the anionic SOPG monolayer, the cationic PDC-AuNRs adsorb to and then penetrate into the monolayer, with the ligand layer of the AuNRs fully inserted into the monolayer (figure 5(c-3)). The anionic PSS-AuNRs, on the other hand, do not bind to the anionic monolayer (figure 5(c-4)). This is also consistent with the measurements on the interactions between SOPG monolayer and pure PSS and PDC, respectively, which show that the PDC disrupted the monolayer (figure 4(c-5)) while PSS had no effect on the monolayer (figure 4(c-6)).
- (c)The cationic PDC-AuNRs bind both to zwitterionic SOPC monolayers and anionic SOPG monolayers. However, the PDC-AuNRs adsorb peripherally underneath the SOPC (figure 5(c-1)) monolayer whereas the top ligand layer of the PDC-AuNRs penetrate into SOPG monolayer (figure 5(c-3)), which again is consistent with the observations of the interactions of unbound PDC ligands with SOPC and SOPG monolayers, respectively, that PDC significantly disrupts the structure of SOPG monolayer (figure 4(c-5)) but only has a negligible effect on the structure of SOPC monolayer (figure 4(c-2)).

The detailed structural information obtained from the XRR measurements of the four lipid/AuNP samples provides insight into the mechanism by which the AuNRs are driven into the lipid monolayers.
- (a)In the case of charged AuNRs under a zwitterionic lipid monolayer, the electrostatic interaction between the charged AuNRs and the dipole moment of the zwitterionic head group of SOPC attracts both cationic PDC-AuNRs and anionic PSS-AuNRs to the surface of the lipid monolayer. We attribute the different behavior of PDC-AuNRs and PSS-AuNRs interacting with the SOPC monolayer to the different degree of hydrophobicity between PDC and PSS because of their structural difference as shown in figure 1(b). The quaternary ammonium at the carbon rings in PDC possesses high charge density that makes PDC a highly hydrophilic polymer [43, 44], whereas PSS is composed of both hydrophilic sulfonate anions and hydrophobic benzene rings (see supplementary A for details). In the case of PSS-AuNRs/SOPC, after the electrostatic attraction has brought PSS-AuNRs in contact with SOPC monolayer, the strong hydrophobic interaction between the protruded benzene rings in PSS and the hydrophobic tails of SOPC took over and drove the PSS-AuNRs deep into the lipid monolayer, as shown in several previous studies on the AuNP-membrane interactions using MD simulations [11, 12], and experimental studies on macro-molecule/particle-membrane [21, 24, 45]. On the other hand, PDC-AuNRs remained beneath the SOPC monolayers because the hydrophilic polymers cannot penetrate into lipid membranes, as shown in the work by Cheng et al [46].
- (b)In the case of charged AuNRs under a charged SOPG lipid monolayer, the electrostatic interaction drives the AuNRs (slightly) into the monolayer when the charges on the AuNRs and the monolayers are opposite, and keeps the AuNRs and the monolayer apart when their charges are alike, which agrees with MD simulation results reported previously [11, 12].
- (c)Lastly, the electrostatic interaction between cationic PDC-AuNRs and anionic SOPG monolayer is stronger than that between PDC-AuNRs and zwitterionic SOPC monolayer, which explains why PDC-AuNRs were able to insert into a SOPG monolayer, but just resided beneath a SOPC monolayer.
We further note that even though the amount of AuNRs binding to the monolayer is very low after stirring the subphase for  min, the adsorption process is far from saturation. In fact, when we increased the stirring time, the amplitude of the oscillations in the small
  region of the XRR curve became larger and larger, indicating that more and more AuNRs were adsorbed to the monolayers (see figure S6, supplementary H). Similar increase in adsorption of AuNRs was also observed when the concentration of the AuNRs in the subphase was increased (see figure S7, supplementary I). These observations suggest that the kinetics of the adsorption of AuNRs is largely dependent upon the concentration gradient near the interface, and the increase in the surface coverage of the AuNRs in the monolayers does not change the structure of the AuNR-monolayer system, that is, the orientation and depth of AuNRs binding to the lipid monolayer.
4. Conclusions
We studied the interactions between AuNRs (cationic PDC-AuNRs and anionic PSS-AuNRs) and unsaturated lipid monolayers (zwitterionic SOPC monolayer and anionic SOPG monolayer) using both Langmuir trough technique and liquid surface XRR. While Langmuir trough measurements were obscured by the instability of the lipid monolayers as well as the interactions between the unbound ligands and lipid molecules, XRR measurements yield quantitative structural information that helps elucidate the driving force for the association of AuNRs to the lipid monolayer.
Our results suggest that charged AuNRs adsorbed to the lipid monolayers through different mechanisms. In the presence of the zwitterionic SOPC monolayer, both electrostatic and hydrophobic interactions play a role in the adsorption process. In this case, the adsorption appears to take place in two steps: first, the charge-dipole moment interaction attracts the charged AuNRs to the head group region of the SOPC monolayer, and then the hydrophobic interaction between the hydrophobic benzene rings of PSS side chains and the hydrophobic tails of the lipids drives the PSS-AuNRs deep into the monolayer. In the presence of the charged SOPG monolayer, charge-charge interactions dictate the process of the association of AuNRs to the monolayers: electrostatically, the positively charged PDC-AuNRs are driven into the negatively charged SOPG monolayer whereas the negatively charge PSS-AuNRs are repelled by the SOPG monolayer. The structure of AuNRs bound to the lipid monolayer is independent of time or the concentration of AuNRs in the subphase.
Acknowledgments
PQ, WB, MM and BL acknowledge support from NSF's ChemMatCARS, Sector 15, which is supported by the Divisions of Chemistry (CHE) and Materials Research (DMR), National Science Foundation, under the Grant Nos. NSF/CHE-1834750. BL and KYCL acknowledge support from The University of Chicago Materials Research Science and Engineering Center (NSF/DMR-2011854). This work was also partially supported by the National Science Foundation through MCB-1950525 (to KYCL). LW, CC and XW acknowledge support from the National Basic Research Program of China (2016YFA0203200, and 2016YFA0201600), the Science Fund for Creative Research Groups of the National Natural Science Foundation of China (11621505), the National Natural Science Foundation of China (31971322), CAS Key Research Program for Frontier Sciences (QYZDJ-SSW-SLH022), and the Users with Excellence Project of Hefei Science Center CAS (2018HSC-UE004), and the Research and Development Project in Key Areas of Guangdong Province (2019B090917011). Use of the Advanced Photon Source, an Office of Science User Facility operated for the US Department of Energy (DOE) Office of Science by Argonne National Laboratory, was supported by the US DOE under Contract No. DE-AC02-06CH11357.
Data availability statement
The data that support the findings of this study are available upon reasonable request from the authors.