
Flow Field Effect on the Performance of Direct Formic Acid Membraneless Fuel Cells: A Numerical Study


Department of Mechanical Engineering, National Kaohsiung University of Science and Technology, Kaohsiung 80778, Taiwan
*
Author to whom correspondence should be addressed.
Processes 2021, 9(5), 746; https://doi.org/10.3390/pr9050746
Submission received: 28 March 2021
/
Revised: 19 April 2021
/
Accepted: 20 April 2021
/
Published: 23 April 2021
(This article belongs to the Section Energy Systems)
Abstract
:The performance of both air-breathing and air-feeding direct formic acid membraneless fuel cells (DFAMFCs) possessing different flow fields were numerically investigated in this study at given concentration and flow rate for both fuel and electrolyte. Single serpentine, stepwise broadening serpentine, multi-serpentine and parallel channel were tested as liquid flow field, while single serpentine, stepwise broadening serpentine, multi-serpentine and pin channel were tested as air flow field. The channel width was either 0.8 mm or 1.3 mm. The simulation results showed that the air-breathing DFAMFC having identical flow field for both fuel and electrolyte yielded highest cell output. The air-breathing DFAMFC having SBS liquid flow field yielded a maximum power density of 10.5 mW/cm2, while the air-breathing DFAMFC having S(1.3) liquid flow field produced an open circuit voltage of 1.0 V owing to few formic acid penetration into the cathode. Concerning the air-feeding DFAMFCs, the DFAMFC having SBS liquid flow field and MS(0.8) air flow field yielded highest peak power density, 12 mW/cm2, at an airflow rate of 500 sccm. Considering the power generated by the DFAMFCs together with the power consumed by the air pump, DFAMFC having SBS liquid flow field and Pin(0.8) air flow field could be the preferred design.
1. Introduction
Direct liquid fuel cells with polymer electrolyte membrane are becoming highly regarded worldwide because they are favorable to be power sources for portable electronics at room temperature. However, owing to the significant fuel crossover of the polymer electrolyte membrane while feeding liquid fuel [1,2], one of the particular types of fuel cells that generates electricity at room temperature by feeding liquid electrolyte between both electrodes instead of installing a polymer electrolyte membrane have been developed for about a decade. Numerous studies on exploring the characteristics of membraneless fuel cells have been conducted based on both experimental test and numerical simulation [3,4,5,6]. Those membraneless fuel cell usually featured a single, short and straight microchannel, and is also termed as microfluidic fuel cells.
Unlike the traditional DMFCs that possess a solid polymer membrane between two electrodes, a flowing electrolyte-direct methanol fuel cell (FE-DMFC) having a single serpentine, parallel serpentine, triple serpentine and a grid type cathode flow field were simulated by Ouellette et al. [7] to examine the cell performance. The three-dimensional fuel cell model featured an electrolyte stream flowing between two polymer electrolyte membranes, which individually assembled an electrode on one side, for eliminating the fuel crossover. Results showed that the single serpentine flow field provided the best performance due to the better reactant distribution over the cathode catalyst layer. Similar fuel cell configuration using a circulating liquid electrolyte between two MEAs of the PEMFCs to tackle both water and thermal problems was also proposed and tested with dry reactant gases [8].
Besides the fuel crossover issue of the direct liquid fuel cells, flow field design for both electrodes of direct liquid fuel cell has also been considered as another crucial factor that affects the fuel cell performance. An optimal flow field design for fuel cells causes a uniform fuel and oxidant distribution on the electrode surface and ensures the products, H2O and CO2 for example, to be easily removed from the active surface area.
Numerous studies have been conducted to investigate the effect of flow field designs on the DMFCs performance. Among those studies, single serpentine, parallel, and multiple serpentine flow fields are commonly employed as the anodic flow field [9,10,11]. In addition, a few particular anodic flow fields were also proposed. Wang et al. [12] numerically investigated the anodic flow velocity and temperature distributions of the DMFC with four different anodic flow fields, including double serpentine, parallel, helix and single serpentine, using 3-D simulation model. However, the helix anodic flow field yielded a non-uniform inner temperature distribution. Yuan et al. [13] tested an active liquid-feed DMFC with three different types of anodic flow fields, including traditional right-angle serpentine flow field, rounded-corner serpentine flow field, and stepwise broadening serpentine flow field, and investigated the effects of those flow fields on the cell performance, gas bubble behavior and pressure drop characteristics of the DMFC. The results show that the broadening serpentine flow field contributes to the CO2 emission and uniform distribution of reactants, respectively, thus yielding the highest power output. El-Zoheiry et al. [14] proposed new multi-path spiral flow field designs to improve the under-rib convection mass transport, and consequently the performance of direct methanol fuel cells. Their simulation results indicate a significant increase in fuel cell performance with the enhancement of convection mass transport.
Besides the anodic flow field design, the serpentine, multiple serpentine, and parallel, as well as grid cathode flow fields were also studied for DMFCs in order to examine the cell performance over the past few years [15,16,17,18,19]. Jung et al. [15] found that the gas is well distributed within serpentine flow field because of the favorable mass transport and pressure drop while extremely non-uniform oxygen concentration distribution is observed within parallel flow field. The results obtained by Oliveira et al. [16] show that for the lower value of fuel cell temperature and lower value of methanol concentration, the use of multiple serpentine flow field for cathode leads to a better performance, because the pressure-driven mass flow in the channels ensures a good ability for water removal. Jung et al. [17] found that serpentine flow fields exhibited the highest cell output for low stoichiometric factor operation, while serpentine flow field and grid flow field revealed comparable cell performance for medium stoichiometric factor operation.
Moreover, the performance of DMFCs having bio-inspired flow fields [20,21] was also numerically investigated, in order to achieve both a uniform reactant distribution on the electrode surface and a favorable pressure drop between the inlet and outlet of the reactant.
The flow field effect on the direct liquid fuel cells performance that explored in the aforementioned literature are the fuel cells possessing a polymer electrolyte membrane or multiple polymer electrolyte membranes [8]. In order to eliminate the fuel crossover of direct liquid fuel cells as much as possible, designing direct liquid fuel cells with an electrolyte stream flowing between two gas diffusion electrodes is considered as an effective way. However, such design causes the fuel cells to possess an additional flow field for liquid electrolyte, resulting in more complicated fuel cell design to analyze. According to the literature survey in the previous paragraph, it has been confirmed that the flow fields for both anode and cathode of the direct liquid fuel cells play important roles in the fuel cell performance. Besides, an additional flow field for liquid electrolyte imposes an additional factor on the performance of the direct liquid membraneless fuel cells that has not yet been investigated using three-dimensional numerical simulation, this study aims to numerically investigate the performance of both air-breathing and air-feeding direct formic acid membraneless fuel cells (DFAMFCs) with different flow fields.
2. Numerical Model
2.1. Computational Domain
The numerical model of the two different types of DFAMFCs in Figure 1 accounts for the coupled transport of fluid, species and charge in conjunction with the electrochemical reactions. Similar model was also employed in the studies [22,23] using commercially available CFD software. The detailed dimensions of the fuel cell geometry are summarized in Table 1. The following assumptions were made while performing the simulation.
- (1)
- The three-dimensional system is at steady state and isothermal.
- (2)
- Laminar, incompressible fluid flow and body force is negligible.
- (3)
- The physical properties of the electrodes are isotropic and homogeneous.
- (4)
- The solutions are dilute and uniformly mixed.
- (5)
- Proton transport from anode to cathode is by electromigration only.
- (6)
- Electromigration of formate ions is negligible due to the high concentration of supporting electrolyte.
- (7)
- The product of carbon dioxide is fully dissolved in the solution.
- (8)
- Oxygen transport in the porous gas diffusion electrode is by diffusion only.
2.2. Fluid Flow
The laminar, incompressible fluid flow in the fuel, liquid electrolyte and oxidant flow channels is governed by the continuity and Navier–Stokes equation as follows,
where ρ, , μ, and p are the fluid density, the velocity vector, the dynamic viscosity of fluid, and the static pressure, respectively. Within the porous media including the catalyst layer and gas diffusion layer, namely carbon paper, the fluid flow is governed by the continuity equation as Equation (1) and the Brinkman equation as follows,
where and κ denote the porosity and the permeability of the porous medium, respectively.
An identical flow rate of 2.0 mL/min is prescribed at both the fuel and electrolyte inlet boundaries, while the outlet of both the fuel and electrolyte is assumed to be at atmospheric pressure. No-slip and impermeable boundary conditions are applied to all channel walls and continuity is maintained at the interfaces between the flow channel and the porous media.
2.3. Species Transport
The species transport in both the flow channel and porous gas diffusion layer by both diffusion and advection is governed as follows,
However, since both the formic acid and oxygen are consumed within the catalyst layer, the species transport in the porous catalyst layer should be:
where Di,eff and ci denote the effective diffusion coefficient of each species within the porous medium and the local species concentration, and source term Si represents the consumption of reactant within the catalyst layer. The effective diffusion coefficient of the species within the gas diffusion layer and the catalyst layer is, respectively expressed as
where τ is the tortuosity of the carbon paper and Di is the species diffusion coefficient in a flow channel.
A constant value of the fuel concentration is set at the inlet, and a convective boundary condition is imposed at the outlet. The continuity is maintained at the interfaces between the flow channels and the porous media. All other walls are set to be zero-flux boundaries. In addition, the oxygen concentration at the cathode/air interface is prescribed as a constant value and all other walls are set as zero-flux boundary condition. Table 2 shows the velocity and concentration boundary conditions at all inlets of both types of fuel cells in the study. Besides, the physical and transport properties used in the simulation are listed in Table 3.
2.4. Electrochemical Reaction Kinetics
The following two electrochemical reactions indicating the formic acid oxidation at the anode and the oxygen reduction at the cathode are considered here.
In brief, the liquid fuel, HCOOH, is oxidized to produce electrons and protons on the anode following Equation (5a). The former travel along the external circuit of the system through the load and generate the electricity, while the latter move to the cathode through the liquid electrolyte, H2SO4 in the study. Subsequently, the protons, electrons and the oxygen molecules in the cathode react to achieve the reduction reaction indicate as Equation (5b).
The source term in Equation (3b) for anode, Sf, and cathode, So, can be expressed in terms of both the active specific area of the catalyst layer on both electrodes (av,a and av,c), and the local current density of the catalyst layer in both electrodes (iloc,a and iloc,c), respectively as follows,
where is estimated with both the limiting current density, , depending on the maximum reactant transport rate, and the current density generated on the electrode surface, , as follows,
where d is the diffusion distance, n is the number of electrons transported on the electrode, and Di,eff is the effective diffusion coefficient of the reactant within the porous medium.
The in Equation (7) is determined by the concentration-dependent Butler–Volmer eqauation for both anode and cathode, respectivley, as follows,
where and are the exchange current density on the anode and cathode, respectively, and are the local fuel and oxygen concentrations, respectively, and are the reference fuel and oxygen concentrations, respectively, β is the reaction order (β = 1), αa and αc are the charge transfer coefficients, and η is the activation overpotential, which can be estimated by
where Eeq, and are the equilibrium potential, the local electrolyte and electric potential, respectively. Note that Mcross in Equation (9b) denotes the effective fuel crossover flux at the electrolyte/cathode catalyst layer interface. The reaction kinetics used in the abovementioned equations are listed in Table 4.
2.5. Electric Current Flow
Both the local electrolyte potential and local electric potential in Equation (10) can be determined by:
where and are the conductivity of the liquid electrolyte and effective conductivity of the electrode that is determined by the following equations
where ε denotes the porosity of either the catalyst layer or the gas diffusion layer. Once the local electric potential is determined, the electric current flows through the electrolyte, , and the electrode, , is expressed as follows,
The anode side wall is set to zero potential and the cathode end face is set to the cell voltage. All other boundaries are zero-flux boundaries.
2.6. Solution Procedure
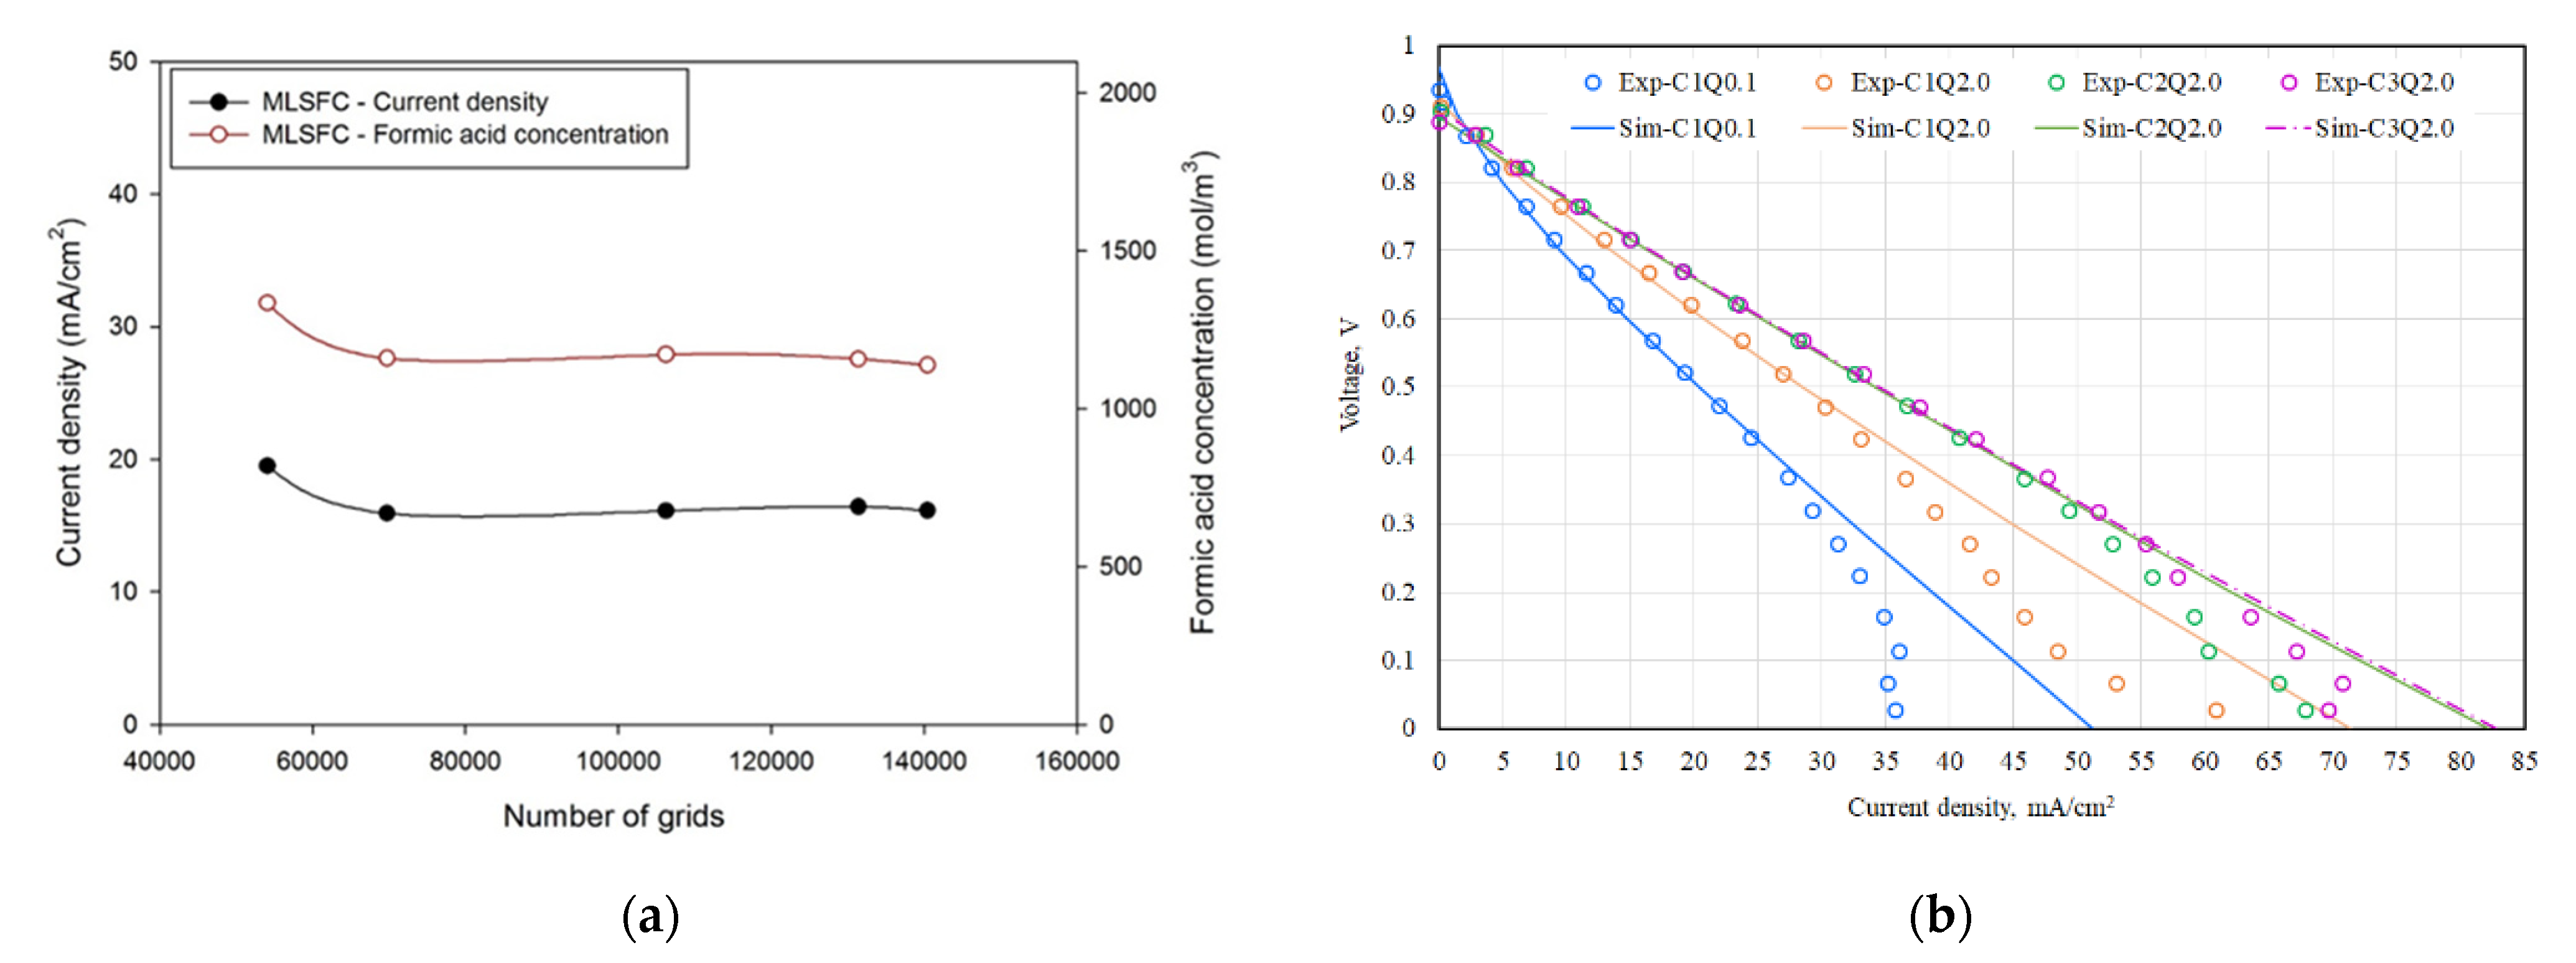
All unknowns including , p, , , and are solved by means of coupling the continuity equation, momentum equation, species transport equation and the electrochemical reactions, as well as charge transfer mentioned above using the commercial software, COMSOL Multiphysics 5.2. Structured grids were established to discretize the flow field, while unstructured grids were established to discretize the rest of the computational domain. Some of the structured grids were converted in order to join the structured grids and unstructured grids at the interface. Grid independence was ensured by testing numerous sets of meshes for the computational domain. Once the differences in both the current density and the average formic acid concentration within the catalyst layer at 0.4 V between two successive sets of meshes was less than 1%, the grid independence was considered to be achieved. According to the test result revealed in Figure 2, the final solutions were obtained with mesh elements of about 100,000 and 240,000 for air-breathing and air-feeding DFAMFCs in this study. Parametric sweep and a direct solution procedure with PARDISO and MUMPS solvers are employed to calculate the current density at different voltages with the convergence criteria for the residual of 10−4. Finally, the current density, j, of the fuel cells is calculated using the following equation,
where AR is the entire electrode surface, 20 mm × 21.8 mm, and is the component of the electric current normal to the surface of the catalyst layer.
In order to validate the simulation results, the polarization curves of the air-breathing DFAMFCs having S(0.8) as both fuel and electrolyte flow fields obtained by simulation were compared with the measured values in the experiment [26]. Note that the configuration and dimensions of the air-breathing DFAMFCs in that experiment [26] were identical to the model depicted in Figure 1a and the Nafion content in the anode catalyst layer of the DFAMFC was 3.73 mg/cm2 with catalyst loading of 2 mg-Pd/cm2 and 2 mg-Pt/cm2 on the anode and cathode, respectively. Figure 2b shows that both data are in fairly good agreement especially at both high fluid flow rate and concentration, for example, the results presented by purple dashed curve and purple hollow circles in Figure 2b with fluid flow rate of 2.0 mL/min and reactant concentration of 3.0 M, because of the minor effect of gas bubble produced on the catalyst layer on the cell performance that was not considered in the simulation model.
3. Results
Results and Discussion
Various configurations of the liquid flow fields for transporting the fuel and electrolyte and the gas flow fields for air distribution shown in Table 5 were numerically investigated here. Table 6 shows the channel width, channel depth and rib width of each flow field design. Note that the rib width between two adjacent channels, and the depth of both channel and rib are 0.8 mm and 1.0 mm, respectively, for each flow field.
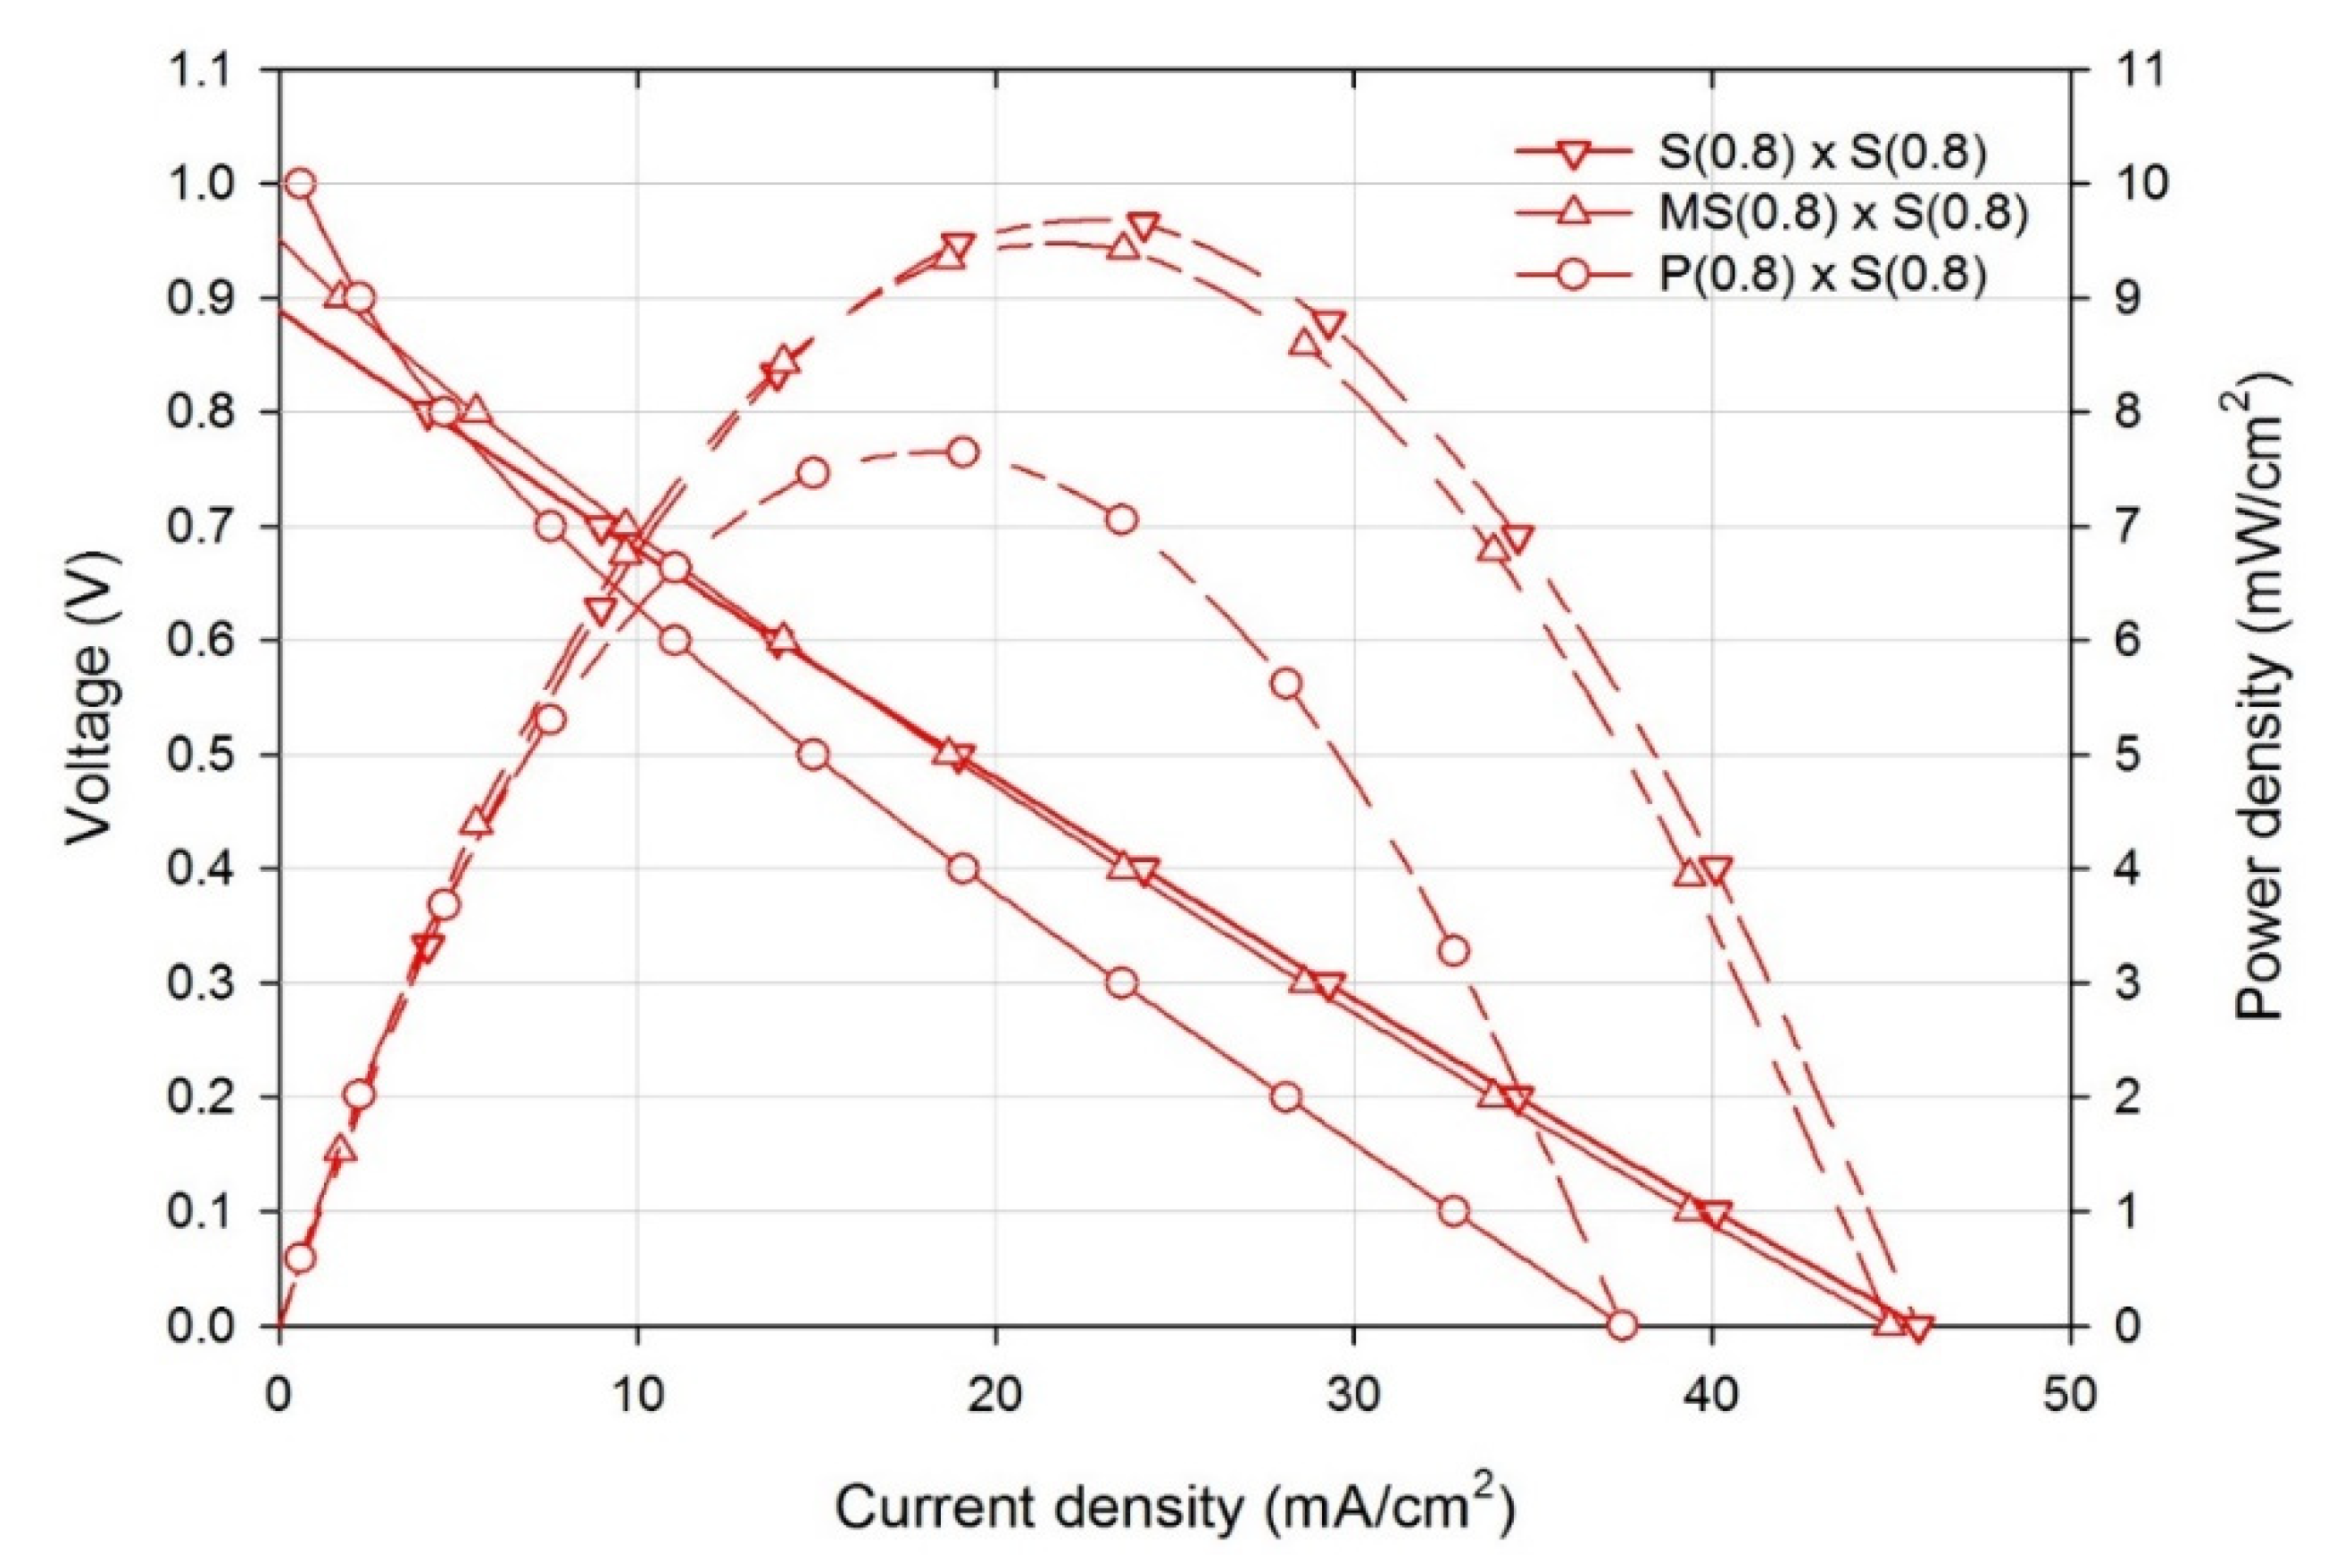
Figure 3 shows the V-I curves (solid ones) and P-I curves (dashed ones) of the air-breathing membraneless fuel cells having three different flow field configurations, including the 0.8-mm-wide serpentine flow field for both fuel and electrolyte, denoted as S(0.8) × S(0.8), the 0.8-mm-wide multiple serpentine fuel flow field and 0.8-mm-wide serpentine electrolyte flow field, denoted as MS(0.8) × S(0.8), and the 0.8-mm-wide parallel fuel flow field and 0.8-mm-wide serpentine electrolyte flow field, denoted as P(0.8) × S(0.8). It can be found in Figure 3 that the air-breathing DFAMFC having P(0.8) fuel flow field reveals the highest open circuit voltage, while the fuel cell having S(0.8) fuel flow field shows the lowest open circuit voltage. However, in spite of the highest open circuit voltage of the fuel cell having P(0.8) fuel flow field, its maximum power density was the lowest among all because of the significant ohmic loss as shown in Figure 3. In addition, it is observed in Figure 3 that the DFAMFC having identical flow field for both fuel and electrolyte has highest maximum power density.
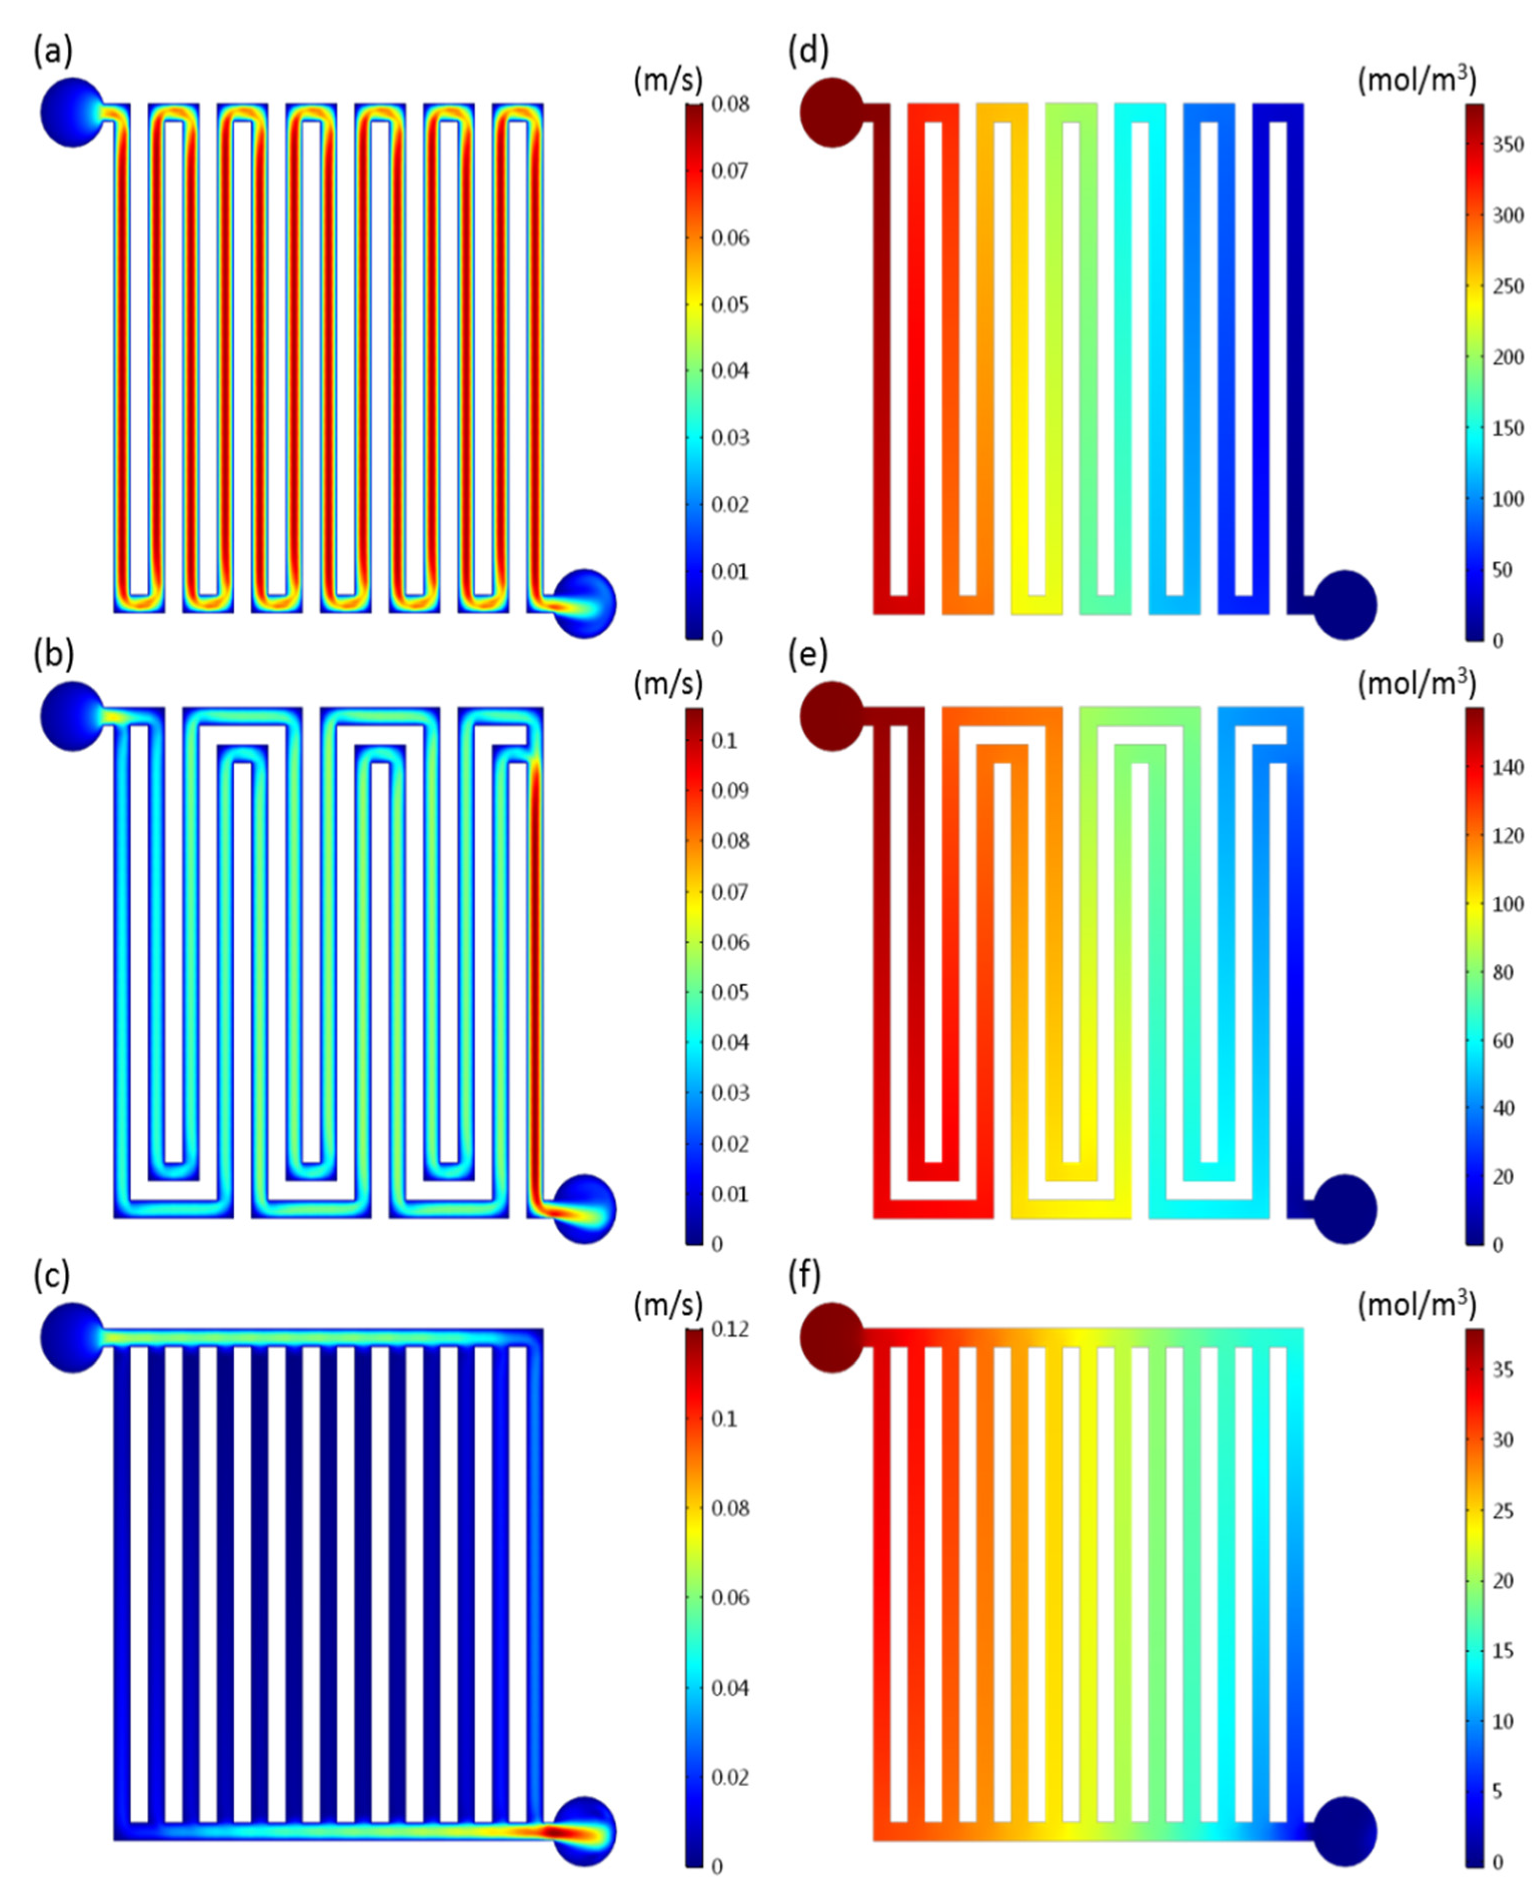
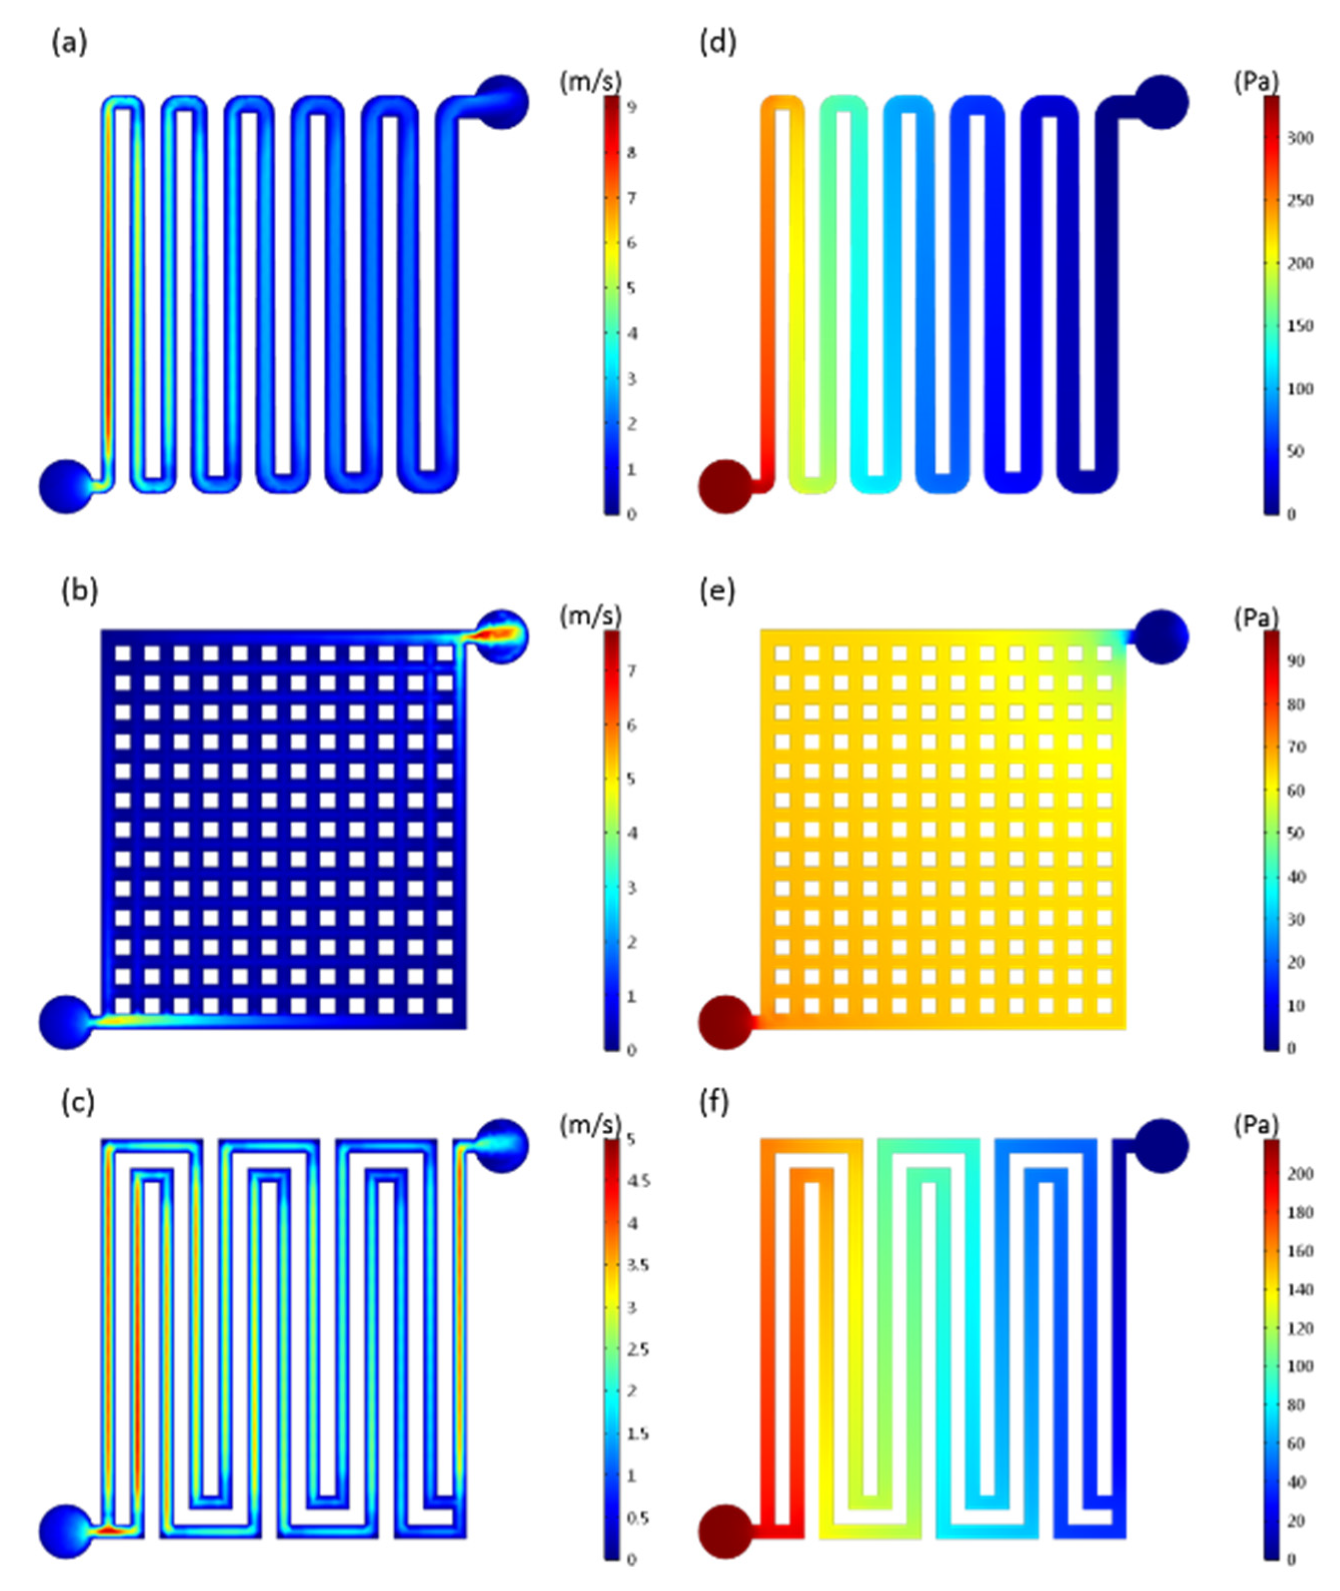
Figure 4a–c show the velocity distribution along S(0.8), MS(0.8) and P(0.8) fuel channels, respectively, while Figure 4d–f show the pressure distribution along S(0.8), MS(0.8) and P(0.8) fuel channels, respectively, in the air-breathing membraneless fuel cells. It can be found that the fuel velocity in S(0.8) flow field in Figure 4a is not only significantly higher than that in both MS(0.8) and P(0.8) flow fields, but also more uniform along the entire channel, resulting in a highest pressure drop between the inlet and the outlet of fuel as shown in Figure 4d. Besides, the fuel stream of extremely low velocity is observed in the parallel channel of P(0.8) flow field in Figure 4c.
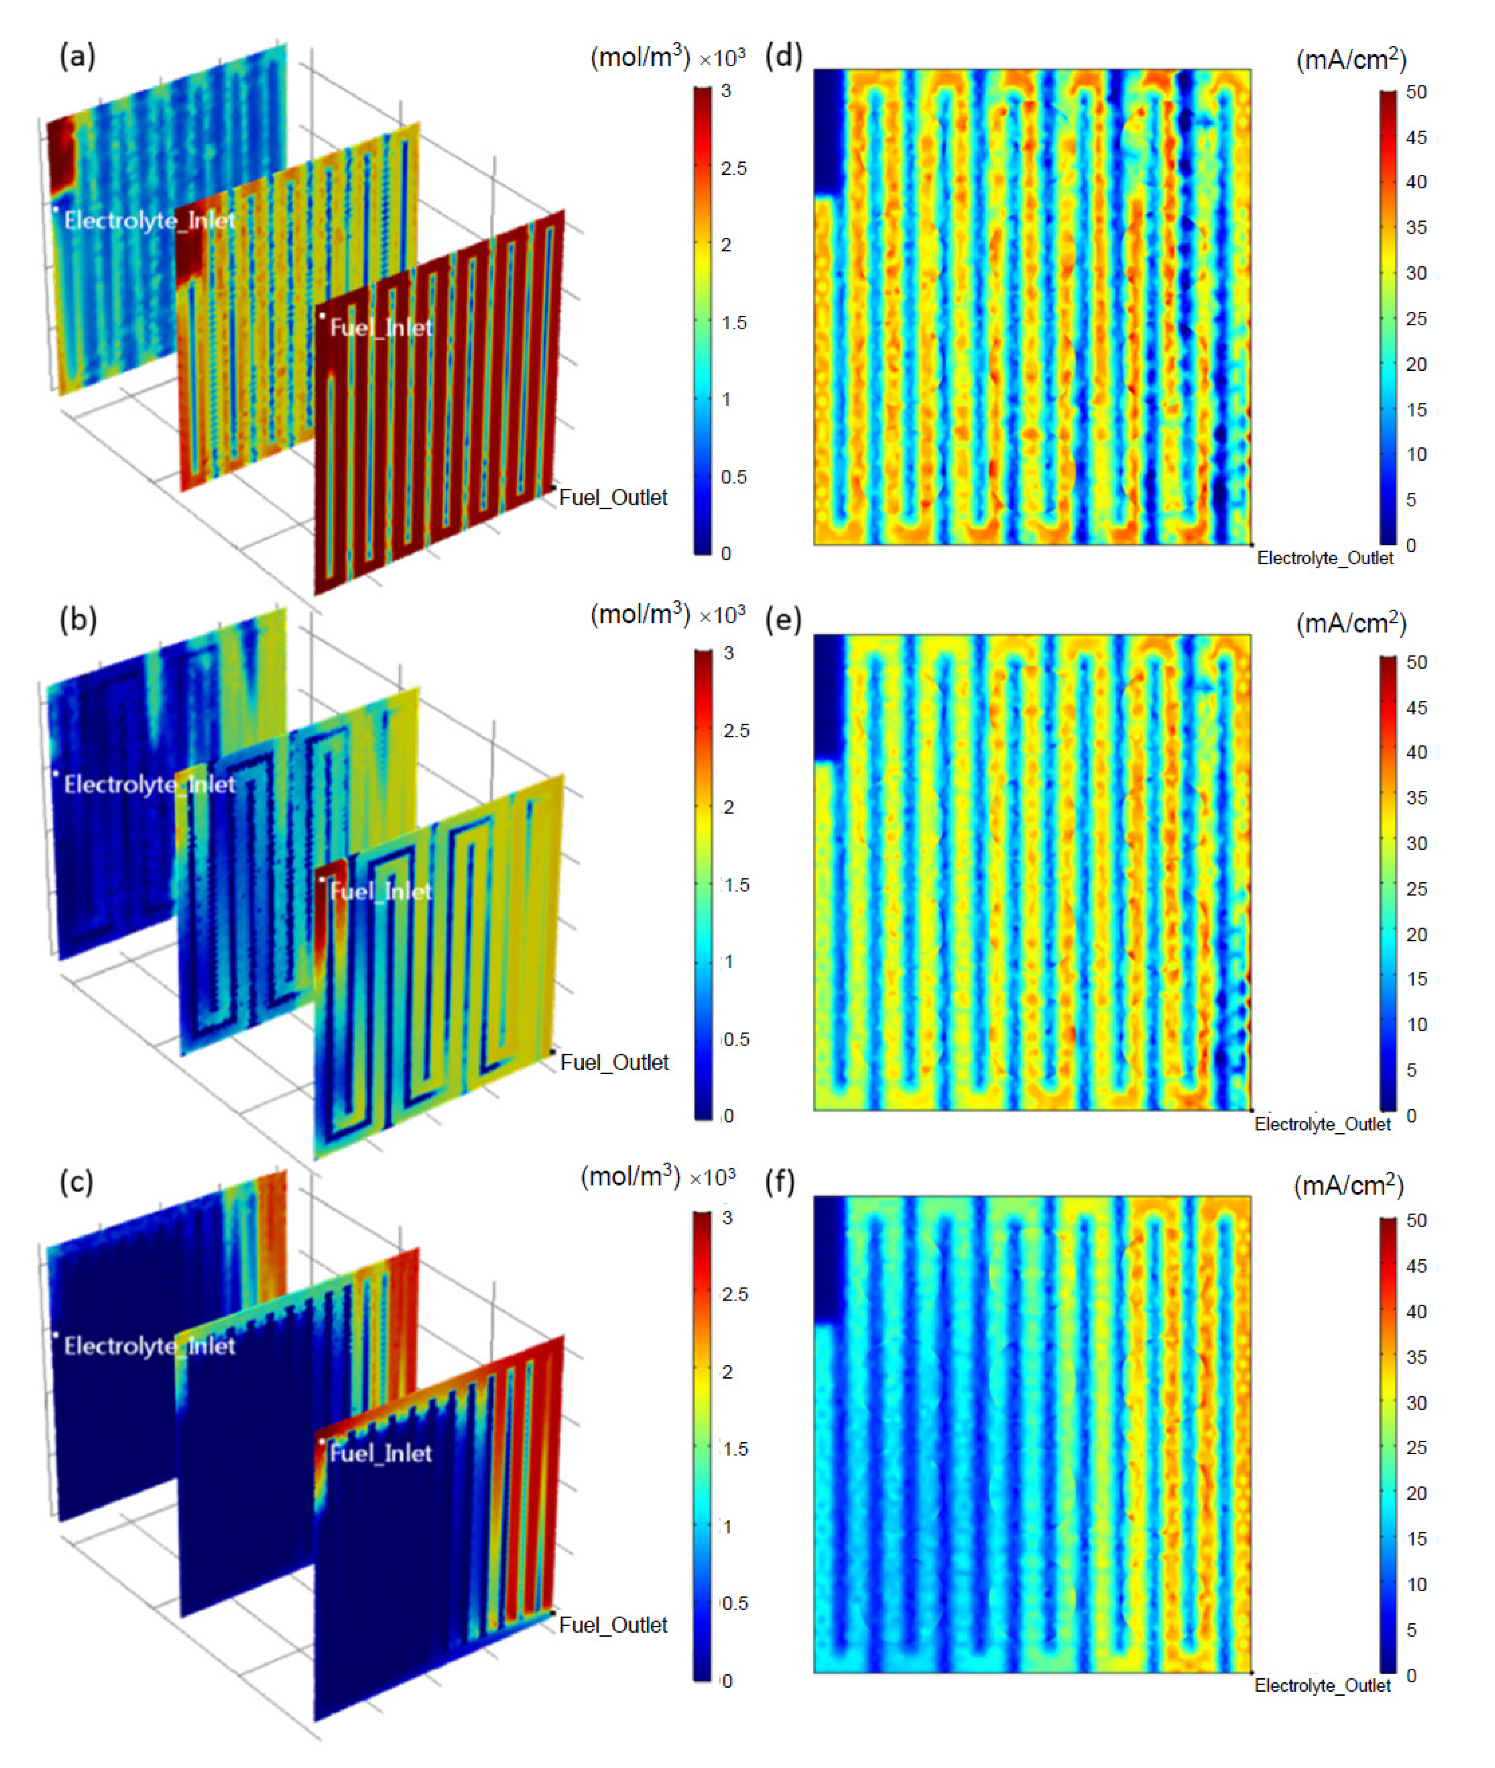
Figure 5a–c show the formic acid concentration distribution on three different sections within the anode catalyst layer, while Figure 5d–f show the local current distribution on the top surface of cathode gas diffusion layer, of the membraneless fuel cells possessing different types of fuel flow field and S(0.8) electrolyte flow field at 0.4 V. The front-most section in Figure 5 is the top surface of the anode catalyst layer which contacts the fuel flow field, while the backmost section is the bottom surface of the anode catalyst layer which attaches to the gas diffusion layer. It can be seen in Figure 5a that the uniformity of the formic acid concentration distribution on the top surface of the anode catalyst layer is the best in S(0.8) fuel flow field in Figure 5a, followed by MS(0.8) fuel flow field in Figure 5b, and is the worst in P(0.8) fuel flow field in Figure 5c.
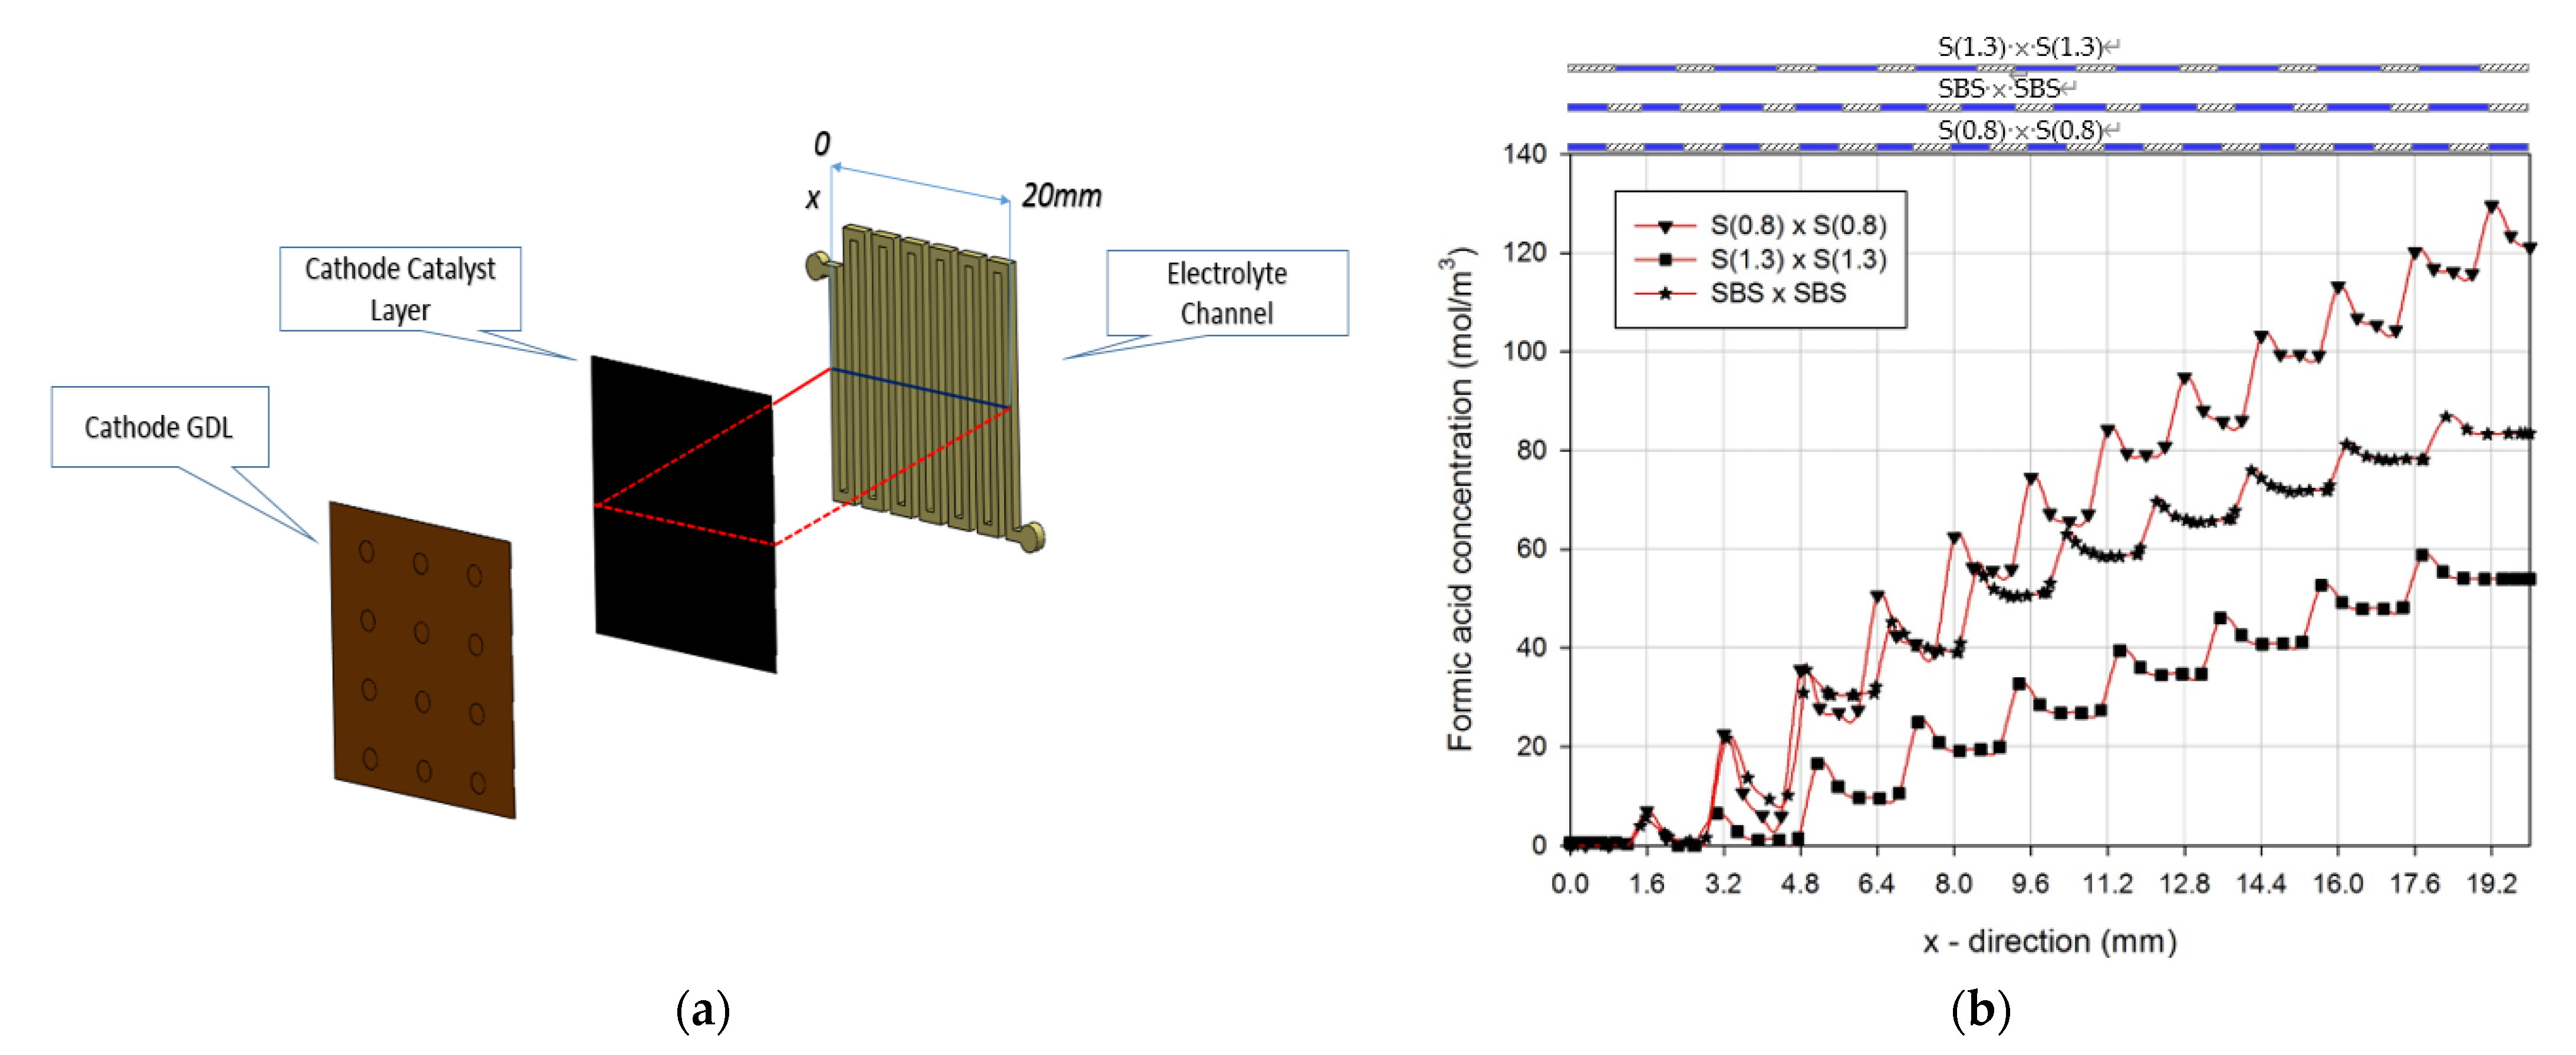
Figure 6 shows the V-I and P-I curves of the air-breathing membraneless fuel cells (DFAMFC) possessing various fuel and electrolyte flow field combinations. It shows that air-breathing DFMFC possessing S(1.3) fluid flow field yields the highest open circuit voltage among all, 1.0 V, which is approximately 0.1 V higher than that of the DFMFC possessing S(0.8) fluid flow field. In order to quantitatively indicate the measure of the fuel crossover, the formic acid concentration distribution along the centerline of the contact plane as schematically shown in Figure 7a between the cathode catalyst layer and the electrolyte flow field is plotted in Figure 7b. Due to the lack of the polymer membrane between two GDEs, the formic acid indeed invades the cathode catalyst layer, and the formic acid concentration becomes increased from the first channel to the lower reach for each fluid flow field combination as revealed in Figure 7b. Each peak of those curves in Figure 7b corresponds to the boundary of the fluid channel. Note that the illustrations above Figure 7b denote the position of the fluid channel depicted as blue region and the rib marked with slashes for the three fuel and electrolyte flow field combinations along the centerline in Figure 7a. As observed in Figure 5, as the channel width of the flow field is increased, the pressure established in the flow field reduces at a given flow rate, resulting in less driving force of the fuel crossover to the cathode catalyst layer and higher open circuit voltage. Therefore, as SBS flow field was employed, whose channel width is stepwise broadened from 0.8 mm to 1.3 mm, the formic acid concentration in Figure 7b is second highest, corresponding to second highest open circuit voltage in Figure 6.
As the upstream channel width of SBS fluid flow field is narrower than that of S(1.3) flow field, the pressure of the fuel flow in SBS is higher than that in S(1.3), causing a favorable condition for formic acid to penetrate into the anode catalyst layer. In addition to the slight fuel crossover of the DFAMFC possessing SBS fluid flow field, the air-breathing DFAMFC possessing SBS fluid flow field generates highest peak power density in Figure 6.
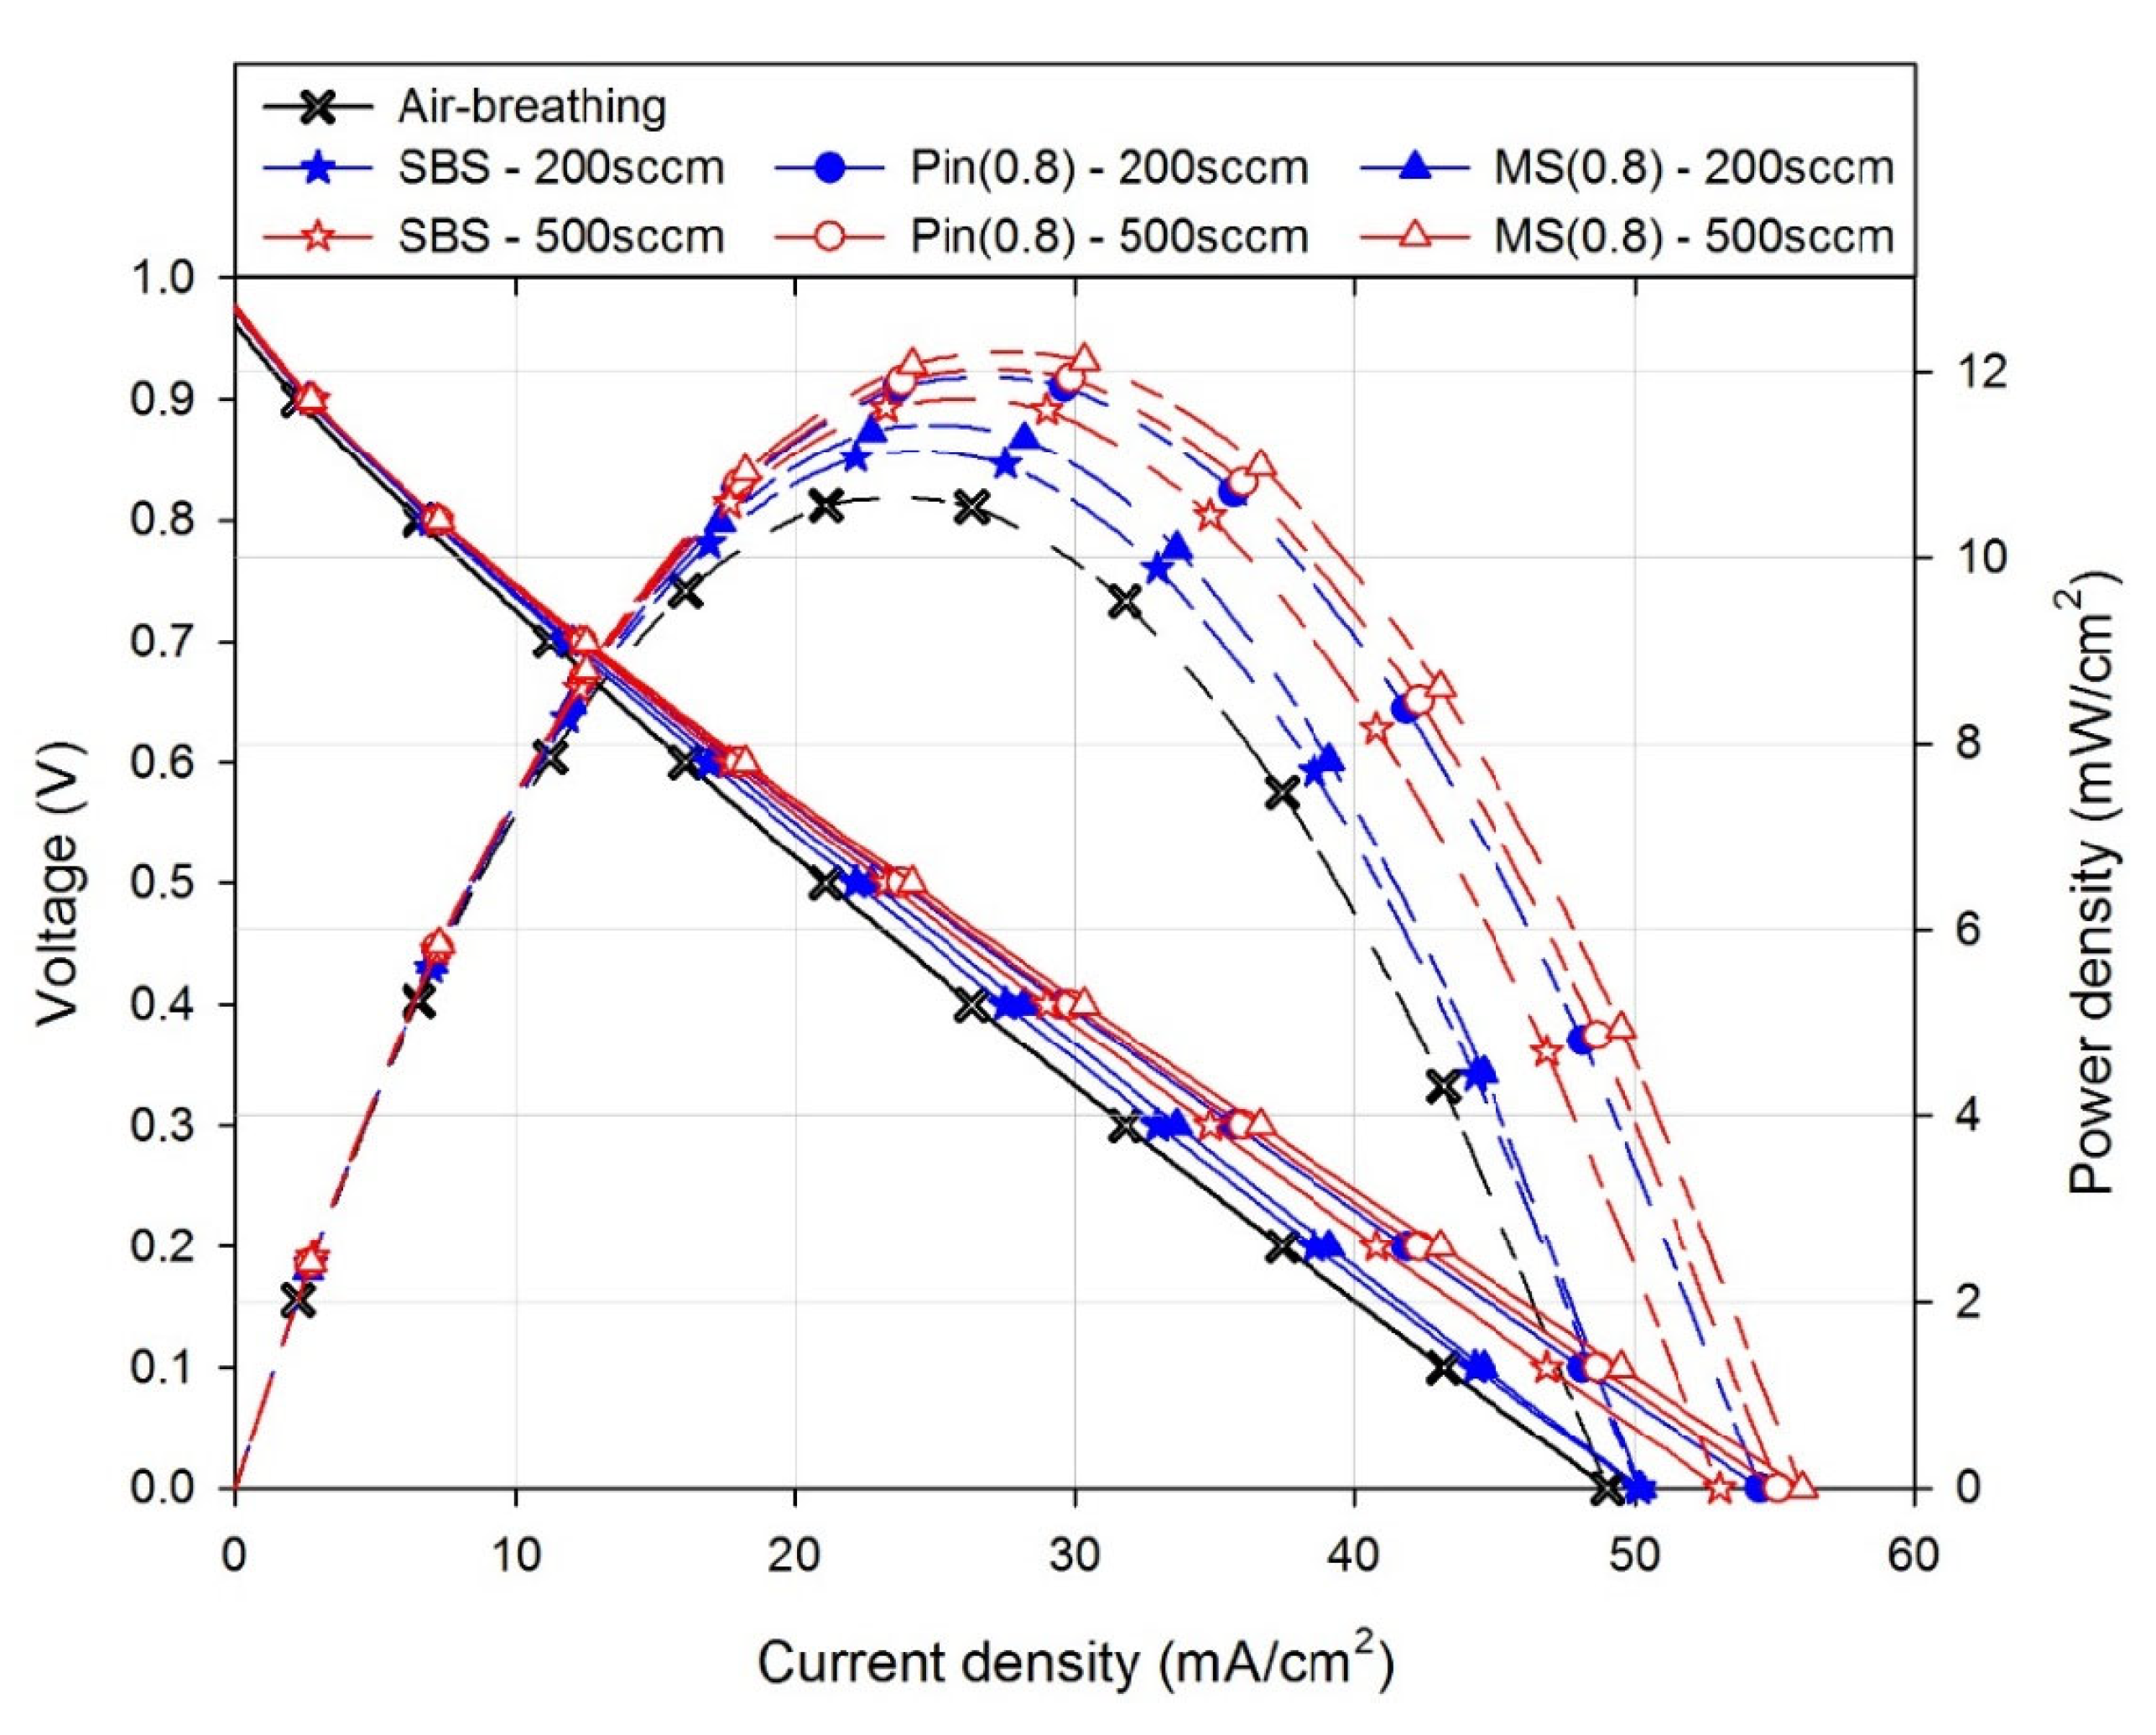
Following the optimal fluid flow field configuration presented in Figure 6, the numerical simulation was further performed for air-feeding DFAMFCs with SBS flow field for both fuel and electrolyte incorporating various air flow fields at airflow rates of 200 sccm and 500 sccm to investigate the fuel cell performance. Firstly, both V-I and P-I curves of the air-feeding DFAMFCs with various air flow fields were plotted in Figure 8 along with the V-I and P-I curves of the air-breathing DFAMFC for comparison. It can be observed in Figure 8 that, compared with the performance of the air-breathing DFAMFC, the maximum power density was enhanced whatever air flow field was employed. The fairly high pressure established in the air flow field as shown in Figure 9d–f might possibly not only resist the fuel invasion to the cathode catalyst layer, but also cause the liquid electrolyte to diffuse in a more uniform way within the GDEs because of the counterpart in pressure distribution on both sides of the electrolyte flow field. Therefore, the air-feeding DFAMFCs yielded higher open circuit voltage and lower ohmic overpotential than the air-breathing one. In addition, the effective supply of oxygen to the cathode of the DFAMFCs is responsible for the higher maximum current density. Besides, the slight effect of the airflow rate on the performance of the DFAMFCs having pin type air flow field can be observed in Figure 8. The DFAMFC having MS(0.8) air flow field fed at an airflow rate of 500 sccm yielded the highest peak power density than other cells in Figure 8, 12 mW/cm2, while the air-breathing one produced the peak power density of 10.5 mW/cm2.
In order to exhibit the air flow field effect on the performance of the air-feeding DFAMFCs, the oxygen concentration distribution within the cathode catalyst layer with air various flow fields, including SBS, Pin(0.8), and MS(0.8), at 0.4 V with airflow rates of 200 sccm and 500 sccm is plotted in Figure 10. It can be seen in Figure 10 that as the airflow rate was increased, the oxygen concentration within the catalyst layer of each DFAMFC become high. This phenomenon is especially obvious on the plane of the catalyst layer in contact with the electrolyte flow field of the DFAMFCs. However, even though the airflow rate is increased, both oxygen and electrolyte seems to maintain uniform distribution within the entire cathode catalyst layer of the DFAMFC having Pin(0.8) air flow field, which could be one of the possible reasons causing the slight increase in the peak power density of the DFAMFC having Pin(0.8) air flow field as observed in Figure 8.
Since an air pump has to be used to deliver the specific airflow rate in the air flow field for an air-feeding DFAMFC, the air pump consumes additional power. The power consumption of the air pump, Wp,air, can be estimated using the following equation,
where (Pa) is the air pressure drop between the inlet and outlet of the air flow field, Qa (m3/s) is the volumetric flow rate of the air, and AR (cm2) is the electrode surface area. In order to evaluate the performance of the DFAMFCs having different air flow field designs in terms of the net power output, the net power density output of the air-feeding DFAMFCs is shown in Figure 11. The net power density output is defined as the difference between the power density produced by the air-feeding DFAMFCs and the power consumption of the air pump as follows,
Note that the maximum net power density produced by the air-breathing DFAMFC was 10.5 mW/cm2 as shown in Figure 8. It can be seen in Figure 11 that the DFAMFC having Pin(0.8) air flow field produced highest net power density at both airflow rates because of its lowest pressure drop between inlet and outlet of the air flow field than the other two DFAMFCs having SBS and MS(0.8) air flow fields.
4. Conclusions
In this study, the performance of both air-breathing and air-feeding DFAMFCs were numerically investigated possessing various flow field designs at fixed concentration and fixed volumetric flow rate of both fuel and electrolyte. The tested liquid flow fields included single serpentine, stepwise broadening serpentine, multi-serpentine and parallel flow fields, while the tested air flow fields comprised single serpentine, stepwise broadening serpentine, multi-serpentine and pin flow fields with channel width of 0.8 mm and 1.3 mm. The results of this study are listed below.
- The air-breathing DFAMFC having identical flow field for both fuel and electrolyte yielded optimal cell output because the similar liquid flow condition on both sides of the anode GDE attributed to uniform formic acid distribution within the anode catalyst layer.
- The air-breathing DFAMFC having SBS flow field for both fuel and electrolyte produced a maximum power density of 10.5 mW/cm2, while the air-breathing DFAMFC having S(1.3) flow field for both fuel and electrolyte produced an open circuit voltage of about 1.0 V owing to few formic acid penetration into the cathode catalyst layer.
- The simulation results concerning the air-feeding DFAMFCs showed that the DFAMFC having SBS liquid flow field and MS(0.8) air flow field yielded highest peak power density of about 12 mW/cm2 at an airflow rate of 500 sccm.
- Considering the power generated by the DFAMFC together with the power consumed by the air pump, the simulation results suggested that the DFAMFC having Pin(0.8) air flow field could be the optimal design, yielding a highest maximum net power density of about 11.9 mW/cm2 and 11.5 mW/cm2 at air flow rates of 200 sccm and 500 sccm, respectively, in the study.
Author Contributions
Software, S.-H.H.; validation, S.-H.H.; formal analysis, J.-C.S. and S.-H.H.; investigation, J.-C.S.; writing—original draft preparation, J.-C.S. and S.-H.H.; writing—review and editing, J.-C.S.; supervision, J.-C.S.; project administration, J.-C.S. Both authors have read and agreed to the published version of the manuscript.
Funding
This research was funded by Ministry of Science and Technology of Taiwan, grant number MOST 108-2628-E-992-001-MY3.
Data Availability Statement
Data available on request due to restrictions.
Acknowledgments
The authors are indebted to Ministry of Science and Technology of Taiwan for the financial support to the study under contract of MOST 108-2628-E-992-001-MY3.
Conflicts of Interest
The authors declare no conflict of interest.
References
- Rejal, S.Z.; Masdar, M.S.; Kamarudin, S.K. A parametric study of the direct formic acid fuel cell (DFAFC) performance and fuel crossover. Int. J. Hydrogen Energy 2014, 39, 10267–10274. [Google Scholar] [CrossRef]
- Colpan, C.O.; Ouellette, D.; Glüsen, A.; Müller, M.; Stolten, D. Reduction of methanol crossover in a flowing electrolyte-direct methanol fuel cell. Int. J. Hydrogen Energy 2017, 42, 21530–21545. [Google Scholar] [CrossRef]
- Zhang, B.; Ye, D.D.; Sui, P.C.; Djilali, N.; Zhu, X. Computational modeling of air-breathing microfluidic fuel cells with flow through-over and flow-through anodes. J. Power Sources 2014, 259, 15–24. [Google Scholar] [CrossRef]
- Yu, X.; Manthiram, A. Catalyst-selective, scalable membraneless alkaline direct formate fuel cells. Appl. Catal. B-Environ. 2015, 165, 63–67. [Google Scholar] [CrossRef]
- Tanveer, M.; Kim, K.Y. Effects of geometric configuration of the channel and electrodes on the performance of a membraneless micro-fuel cell. Energy Convers. Manag. 2017, 136, 372–381. [Google Scholar] [CrossRef]
- Hanapi, I.H.; Kamarudin, S.K.; Zainoodin, A.M.; Hasran, U.A. Membrane-less micro fuel cell system design and performance: An overview. Int. J. Energy Res. 2019, 43, 8956–8972. [Google Scholar] [CrossRef]
- Ouellette, D.; Gencalp, U.; Colpan, C.O. Effect of cathode flow field configuration on the performance of flowing electrolyte-direct methanol fuel cell. Int. J. Hydrogen Energy 2017, 42, 2680–2690. [Google Scholar] [CrossRef]
- Shyu, J.C.; Hsueh, K.L.; Tsau, F.; Chen, F.-L. Modification of the liquid cooling channel of PEMFCs for their operation with dry reactant gases. Energy Convers. Manag. 2011, 52, 125–135. [Google Scholar] [CrossRef]
- Yang, H.; Zhao, T.S. Effect of anode flow field design on the performance of liquid feed direct methanol fuel cells. Electrochim. Acta 2005, 50, 3243–3252. [Google Scholar] [CrossRef]
- Lu, Y.; Reddy, R.G. Effect of flow fields on the performance of micro-direct methanol fuel cells. Int. J. Hydrogen Energy 2011, 36, 822–829. [Google Scholar] [CrossRef]
- El-Zoheiry, R.M.; Ookawara, S.; Ahmed, M. Efficient fuel utilization by enhancing the under-rib mass transport using new serpentine flow field designs of direct methanol fuel cells. Energy Convers. Manag. 2017, 144, 88–103. [Google Scholar] [CrossRef]
- Wang, S.J.; Huo, W.W.; Zou, Z.Q.; Qiao, Y.J.; Yang, H. Computational simulation and experimental evaluation on anodic flow field structures of micro direct methanol fuel cells. Appl. Therm. Eng. 2011, 31, 2877–2884. [Google Scholar] [CrossRef]
- Yuan, W.; Wang, A.; Ye, G.; Pan, B.; Tang, K.; Chen, H. Dynamic relationship between the CO2 gas bubble behavior and the pressure drop characteristics in the anode flow field of an active liquid-feed direct methanol fuel cell. Appl. Energy 2017, 188, 431–443. [Google Scholar] [CrossRef]
- El-Zoheiry, R.M.; Mori, S.; Ahmed, M. Using multi-path spiral flow fields to enhance under-rib mass transport in direct methanol fuel cells. Int. J. Hydrogen Energy 2019, 44, 30663–30681. [Google Scholar] [CrossRef]
- Jung, G.B.; Su, A.; Tu, C.H.; Lin, Y.T.; Weng, F.B.; Chan, S.H. Effects of cathode flow fields on direct methanol fuel cell-simulation study. J. Power Sources 2007, 171, 212–217. [Google Scholar] [CrossRef]
- Oliveira, V.B.; Rangel, C.M.; Pinto, A.M.F.R. Effect of anode and cathode flow field design on the performance of a direct methanol fuel cell. Chem. Eng. J. 2010, 157, 174–180. [Google Scholar] [CrossRef]
- Hwang, S.Y.; Joh, H.I.; Scibioh, M.A.; Lee, S.Y.; Kim, S.K.; Lee, T.G.; Ha, H.Y. Impact of cathode channel depth on performance of direct methanol fuel cells. J. Power Sources 2008, 183, 226–231. [Google Scholar] [CrossRef]
- Jung, G.B.; Tu, C.H.; Chi, P.H.; Su, A.; Weng, F.B.; Lin, Y.T.; Chiang, Y.C.; Lee, C.Y.; Yan, W.M. Investigations of flow field designs in direct methanol fuel cell. J. Solid State Electr. 2009, 13, 1455–1465. [Google Scholar] [CrossRef]
- Park, Y.C.; Chippar, P.; Kim, S.K.; Lim, S.; Jung, D.H.; Jub, H.; Peck, D.H. Effects of serpentine flow-field designs with different channel and rib widths on the performance of a direct methanol fuel cell. J. Power Sources 2012, 205, 32–47. [Google Scholar] [CrossRef]
- Ozden, A.; Ercelik, M.; Ouellette, D.; Colpan, C.O.; Ganjehsarabi, H.; Hamdullahpur, F. Designing, modeling and performance investigation of bio-inspired flow field based DMFCs. Int. J. Hydrogen Energy 2017, 42, 21546–21558. [Google Scholar] [CrossRef]
- Ouellette, D.; Ozden, A.; Ercelik, M.; Colpan, C.O.; Ganjehsarabi, H.; Li, X.; Hamdullahpur, F. Assessment of different bio-inspired flow fields for direct methanol fuel cells through 3D modeling and experimental studies. Int. J. Hydrogen Energy 2018, 43, 1152–1170. [Google Scholar] [CrossRef]
- Herlambang, Y.D.; Shyu, J.-C.; Lee, S.-C. Numerical simulation of the performance of air-breathing direct formic acid microfluidic fuel cells. Micro. Nano Lett. 2017, 12, 860–865. [Google Scholar] [CrossRef]
- Huang, T.; Wang, W.; Yuan, Y.; Huang, J.; Chen, X.; Zhang, J.; Kong, X.; Zhang, Y.; Wan, Z. Optimization of high-temperature proton exchange membrane fuel cell flow channel based on genetic algorithm. Energy Rep. 2021, 7, 1374–1384. [Google Scholar] [CrossRef]
- El-kharouf, A.; Mason, T.J.; Brett, D.J.; Pollet, B.G. Ex-situ characterisation of gas diffusion layers for proton exchange membrane fuel cells. J. Power Sources 2012, 218, 393–404. [Google Scholar] [CrossRef] [Green Version]
- Shaegh, S.A.M.N.; Nguyen, T.; Chan, S.H. An air-breathing microfluidic formic acid fuel cell with a porous planar anode: Experimental and numerical investigations. J. Micromech. Microeng. 2010, 20, 105008. [Google Scholar] [CrossRef] [Green Version]
- Huang, P.-K. A Comparative Study of Air-Breathing Membraneless Direct Liquid Fuel Cells Fed with Formic Acid and Potassium Formate. Master’s Thesis, National Kaohsiung University of Applied Sciences, Kaohsiung, Taiwan, 2018. [Google Scholar]
Figure 1.
Schematic illustrations of the computational domain of the present direct formic acid membranless fuel cells (DFAMFCs), (a) air-breathing and (b) air-feeding.
Figure 1.
Schematic illustrations of the computational domain of the present direct formic acid membranless fuel cells (DFAMFCs), (a) air-breathing and (b) air-feeding.

Figure 2.
Results of (a) grid independence test, and (b) the comparison of V-I curves between measured data and the numerical Scheme 0. As both fuel and electrolyte flow fields.
Figure 2.
Results of (a) grid independence test, and (b) the comparison of V-I curves between measured data and the numerical Scheme 0. As both fuel and electrolyte flow fields.

Figure 3.
The V-I curves (solid ones) and P-I curves (dashed ones) of the air-breathing DFAMFCs having different combinations of the liquid flow fields (fuel channel × electrolyte channel).
Figure 3.
The V-I curves (solid ones) and P-I curves (dashed ones) of the air-breathing DFAMFCs having different combinations of the liquid flow fields (fuel channel × electrolyte channel).

Figure 4.
With electrolyte flow field of S(0.8), the velocity distribution at the midplane of the fuel flow field of (a) S(0.8), (b) MS(0.8), and (c) P(0.8), and the pressure distribution at the midplane of the fuel flow field of (d) S(0.8), (e) MS(0.8), and (f) P(0.8), of the air-breathing DFAMFCs.

Figure 5.
With electrolyte flow field of S(0.8) at 0.4 V, the formic acid concentration distribution on the plane in contact with fuel flow field, midplane, and the plane in contact with GDL (from right to left) of the anode catalyst layer of the air-breathing DFAMFCs having (a) S(0.8), (b) MS(0.8) and (c) P(0.8) fuel flow field, and the distribution of the normal component of the current density with respect to the cathodic gas diffusion layer of the air-breathing DFAMFCs having (d) S(0.8), (e) MS(0.8) and (f) P(0.8) fuel flow field.

Figure 6.
The V-I curves (solid ones) and P-I curves (dashed ones) of the air-breathing DFAMFCs possessing different combinations of the fuel and electrolyte flow fields (fuel channel × electrolyte channel).
Figure 6.
The V-I curves (solid ones) and P-I curves (dashed ones) of the air-breathing DFAMFCs possessing different combinations of the fuel and electrolyte flow fields (fuel channel × electrolyte channel).

Figure 7.
(a) The schematic diagram of a centerline (blue) on the contact surface between the electrolyte flow field plate and the cathodic catalyst layer of the air-breathing DFAMFCs, and (b) the formic acid concentration variation along the blue line plotted in (a).
Figure 7.
(a) The schematic diagram of a centerline (blue) on the contact surface between the electrolyte flow field plate and the cathodic catalyst layer of the air-breathing DFAMFCs, and (b) the formic acid concentration variation along the blue line plotted in (a).

Figure 8.
Comparison of V-I curves (solid ones) and P-I curves (dashed ones) between air-breathing and air-feeding DFAMFCs possessing different air flow fields with airflow rates of 200 sccm and 500 sccm.
Figure 8.
Comparison of V-I curves (solid ones) and P-I curves (dashed ones) between air-breathing and air-feeding DFAMFCs possessing different air flow fields with airflow rates of 200 sccm and 500 sccm.

Figure 9.
The velocity distribution at the midplane of the (a) SBS, (b) Pin(0.8), and (c) MS(0.8) air flow field plate, and the pressure distribution at the midplane of the (d) SBS, (e) Pin(0.8), and (f) MS(0.8) air flow field plate of the air-feeding DFAMFCs at airflow rate of 200 sccm.
Figure 9.
The velocity distribution at the midplane of the (a) SBS, (b) Pin(0.8), and (c) MS(0.8) air flow field plate, and the pressure distribution at the midplane of the (d) SBS, (e) Pin(0.8), and (f) MS(0.8) air flow field plate of the air-feeding DFAMFCs at airflow rate of 200 sccm.

Figure 10.
With SBS as both fuel and electrolyte flow fields at 0.4 V, the oxygen concentration distribution on the plane in contact with electrolyte flow field, midplane, and the plane in contact with GDL (from right to left) of the air-feeding DFAMFCs having SBS, Pin(0.8) and MS(0.8) air flow field (top-to-bottom) at 0.4 V with airflow rate of 200 sccm (a–c) and 500 sccm (d–f).

Figure 11.
The maximum power density and the relative net power density of the air-feeding DFAMFCs having various air flow fields at air flow rates of 200 and 500 sccm.
Figure 11.
The maximum power density and the relative net power density of the air-feeding DFAMFCs having various air flow fields at air flow rates of 200 and 500 sccm.


Table 1.
Geometrical parameters of the present fuel cell model.
| Fuel Cell Type | The Exterior Dimensions of the Model | ||
|---|---|---|---|
| Air-breathing | 26.8 mm × 24 mm × 2.67 mm | ||
| Air-feeding | 26.8 mm × 24 mm × 3.67 mm | ||
| Parameters | Symbol | Value (mm) | Source |
| Electrode | |||
| Electrode width | 20 | – | |
| Electrode length | 21.8 | – | |
| Anode catalyst layer thickness | 0.1 | – | |
| Cathode catalyst layer thickness | 0.1 | – | |
| Thickness of anode carbon paper | 0.28 | [24] | |
| Thickness of cathode carbon paper | 0.19 | [24] | |
| Flow channel | |||
| Rib width | 0.8 | – | |
| Rib length | 21.8 | – | |
| Channel depth | 1 | – | |
| Inlet and outlet radius | 1.5 | – | |
| Air-breathing holes | |||
| Number | 3 × 4 | ||
| radius | 2 | – | |
| Transverse pitch | 6 | – | |
| Longitudinal pitch | 5 | – | |
Table 2.
The flow rate and concentration boundary conditions at all inlets for both types.
| Operating Conditions | Fuel Concentration at Inlet, HCOOH (M) + H2SO4 (M) | Electrolyte Concentration at Inlet, H2SO4 (M) | Fluid (Fuel/Electrolyte) Flow Rate at Inlet (mL/min) | Oxygen Concentration at Inlet and Breathing Holes (M) | Air Flow Rate at Inlet (sccm) |
|---|---|---|---|---|---|
| Air-breathing | 3 + 1.5 | 1.5 | 2.0 | 8.6 × 10⁻³ | – |
| Air-feeding | 200, 500 |
Table 3.
The physical and transport used in the simulation.
| Parameters | Symbol | Value (mm) | Source | Parameters |
|---|---|---|---|---|
| Liquid | ||||
| Density | 997.6 | kg/m3 | ||
| Dynamic viscosity | 8.52 × 10⁻⁴ | Pa·s | ||
| Diffusion coefficient of formic acid | 2.546 × 10⁻⁹ | m2/s | [25] | |
| Conductivity of the electrolyte | 59.900996 | S/m | ||
| Gas | ||||
| Density | 1.1762 | kg/m3 | ||
| Dynamic viscosity | 1.8483 × 10⁻⁵ | Pa·s | ||
| Diffusion coefficient of oxygen within catalyst layer | 2.1 × 10⁻⁹ | m2/s | [25] | |
| Diffusion coefficient of oxygen within gas diffusion layer | 2.1 × 10⁻⁵ | m2/s | [3] | |
| Catalyst layer of the anode | ||||
| Porosity | 0.28 | – | ||
| Permeability | 3.62 × 10⁻¹³ | m2 | ||
| Conductivity | 1.4 × 10⁴ | S/m | [24] | |
| Volume fraction of the electrolyte | 0.024 | – | ||
| Gas diffusion layer of the anode (GDL) | ||||
| Porosity | 0.672 | – | [24] | |
| Permeability | 4.53 × 10⁻¹² | m2 | [24] | |
| Tortuosity | 2.55 | – | [24] | |
| Conductivity | 1.4 × 10⁴ | S/m | [24] | |
| Volume fraction of the electrolyte | 0.035 | – | ||
| Catalyst layer of the cathode | ||||
| Porosity | 0.3 | – | ||
| Permeability | 3.62 × 10⁻¹³ | m2 | ||
| Conductivity | 5.2 × 10² | S/m | [24] | |
| Volume fraction of the electrolyte | 0.024 | – | ||
| Gas diffusion layer of the cathode (GDL) | ||||
| Porosity | 0.739 | – | [24] | |
| Permeability | 3.67 × 10⁻¹¹ | m2 | [24] | |
| Tortuosity | 1.4 | – | [24] | |
| Conductivity | 5.2 × 10² | S/m | [24] | |
Table 4.
The reaction kinetics in the study.
| Parameter | Symbol | Value | Units |
|---|---|---|---|
| Exchange current density of anode | 0.8 | A/m2 | |
| Exchange current density of cathode | 0.00018 | A/m2 | |
| Active specific area of the anode | 1.0618 × 10⁶ | 1/m2 | |
| Active specific area of the cathode | 2.331 × 10⁵ | 1/m2 | |
| Charge transfer coefficeint of anode | 0.5 | – | |
| Charge transfer coefficeint of cathode | 0.5 | – | |
| Reference fuel concentration | 1000 | mol/m3 | |
| Reference oxygen concentration | 8.5 | mol/m3 | |
| Faraday constant | F | 96,485 | C/mol |
| Universal gas constant | R | 8.3145 | J/mol·K |
| Ambient temperature | T | 300.15 | K |
Table 5.
The flow fields of the DFAMFCs simulated in this study with the inlet indicated with a pink circle.
Table 5.
The flow fields of the DFAMFCs simulated in this study with the inlet indicated with a pink circle.
| Liquid Flow Field | Gas Flow Field | ||
|---|---|---|---|
| Single Serpentine (S) |  | Single Serpentine (S) |  |
| Stepwise Broadening Serpentine (SBS) |  | Stepwise Broadening Serpentine (SBS) |  |
| Multi-Serpentine (MS) |  | Multi-Serpentine (MS) |  |
| Parallel (P) |  | Pin (Pin) |  |
Table 6.
The dimensions of the fuel, electrolyte and air flow fields in the study.
| Flow Field Configuration | Channel Width, mm | Rib Width, mm | Channel and Rib Depth, mm | ||
|---|---|---|---|---|---|
| Liquid | Electrolyte (H2SO4) | Single Serpentine (S) | 0.8 | 0.8 | 1 |
| 1.3 | |||||
| Stepwise Broadening Serpentine (SBS) | 0.8~1.3 | ||||
| Fuel (HCOOH + H2SO4) | Single Serpentine (S) | 0.8 | |||
| 1.3 | |||||
| Stepwise Broadening Serpentine (SBS) | 0.8~1.3 | ||||
| Multi-Serpentine (MS) | 0.8 | ||||
| Parallel (P) | 0.8 | ||||
| Gas | Air | Single Serpentine (S) | 0.8 | ||
| 1.3 | |||||
| Stepwise Broadening Serpentine (SBS) | 0.8~1.3 | ||||
| Multi-Serpentine (MS) | 0.8 | ||||
| Pin (Pin) | 0.8 | ||||
Publisher’s Note: MDPI stays neutral with regard to jurisdictional claims in published maps and institutional affiliations. |
© 2021 by the authors. Licensee MDPI, Basel, Switzerland. This article is an open access article distributed under the terms and conditions of the Creative Commons Attribution (CC BY) license (https://creativecommons.org/licenses/by/4.0/).
Share and Cite
MDPI and ACS Style
Shyu, J.-C.; Hung, S.-H. Flow Field Effect on the Performance of Direct Formic Acid Membraneless Fuel Cells: A Numerical Study. Processes 2021, 9, 746. https://doi.org/10.3390/pr9050746
AMA Style
Shyu J-C, Hung S-H. Flow Field Effect on the Performance of Direct Formic Acid Membraneless Fuel Cells: A Numerical Study. Processes. 2021; 9(5):746. https://doi.org/10.3390/pr9050746
Chicago/Turabian StyleShyu, Jin-Cherng, and Sheng-Huei Hung. 2021. "Flow Field Effect on the Performance of Direct Formic Acid Membraneless Fuel Cells: A Numerical Study" Processes 9, no. 5: 746. https://doi.org/10.3390/pr9050746
Note that from the first issue of 2016, this journal uses article numbers instead of page numbers. See further details here.