


I. INTRODUCTION
Levocetirizine dihydrochloride is an antihistamine used to treat symptoms of hay fever and hives of the skin by reducing the effects of the natural chemical histamine in the body (Xyzal, Levazyr, Levrix). Levocetirizine dihydrochloride is the levorotatory R-enantiomer of cetirizine dihydrochloride (Zyrtec). The systematic name (CAS Registry Number 130018-87-0) is 2-(2-{4-[(R)-4-chlorophenyl)(phenyl)methyl]piperazin-1-yl}ethoxy acetic acid, dihydrochloride salt. A two-dimensional molecular diagram is shown in Figure 1. Low-precision powder patterns of cetirizine dihydrochloride, dextrocetirizine dihydrochloride, and levocetirizine dihydrochloride are included in the Powder Diffraction File™(PDF®) (Gates-Rector and Blanton, Reference Gates-Rector and Blanton2019) as entries 00-058-1973, 00-058-1974, and 00-058-1975, respectively (Reddy et al., Reference Reddy, Srinivasan, Uppala, Vaddadi and Joga2004a). Reddy et al. (Reference Reddy, Srinivasan, Uppala, Vaddadi and Joga2004a) is equivalent to US Patent Application 2004/0186112 A1 (Reddy et al., Reference Reddy, Srinivasan, Uppala, Vaddadi and Joga2004b), which claims both crystalline and amorphous forms of levocetirizine dihydrochloride. Acetic acid solvates (with different powder patterns) are claimed in US Patent 8,049,011 B1 (Tihi et al., Reference Tihi, Zupet, Pecavar, Kolenc and Pavlin2011). A pattern from a Le Bail extraction of the synchrotron data set from the present study is included in the PDF as entry 00-066-1627 (with an incomplete structure), and a star-quality pattern from laboratory data is included as entry 00-068-0812 (no crystal structure) (Henao, Reference Henao2016).

Figure 1. The molecular structure of levocetirizine dihydrochloride.
This work was carried out as part of a project (Kaduk et al., Reference Kaduk, Crowder, Zhong, Fawcett and Suchomel2014) to determine the crystal structures of large-volume commercial pharmaceuticals and include high-quality powder diffraction data for them in the PDF (Gates-Rector and Blanton, Reference Gates-Rector and Blanton2019).
II. EXPERIMENTAL
Levocetirizine dihydrochloride was a commercial reference standard, purchased from the U.S. Pharmacopeia (Lot #F02180), and was used as-received. The white powder was packed into a 1.5 mm diameter Kapton capillary and rotated during the measurement at ~50 Hz. The powder pattern was measured at 295 K at beamline 11-BM (Antao et al., Reference Antao, Hassan, Wang, Lee and Toby2008; Lee et al., Reference Lee, Shu, Ramanathan, Preissner, Wang, Beno, Von Dreele, Ribaud, Kurtz, Antao, Jiao and Toby2008; Wang et al., Reference Wang, Toby, Lee, Ribaud, Antao, Kurtz, Ramanathan, Von Dreele and Beno2008) of the Advanced Photon Source at Argonne National Laboratory using a wavelength of 0.414157 Å from 0.5 to 50 2θ with a step size of 0.001° and a counting time of 0.1 s step−1. The high-resolution powder diffraction data were collected using 12 silicon crystal analyzers that allow for high-angular resolution, high precision, and accurate peak positions. A silicon (NIST SRM 640c) and alumina (SRM 676a) standard (ratio Al2O3:Si = 2:1 by weight) were used to calibrate the instrument and refine the monochromatic wavelength used in the experiment. It is worth noting that the levocetirizine dihydrochloride peaks are much broader than the instrumental line widths and that the intensities die out fairly rapidly with increasing angle, limiting the amount of useful data. The pattern was indexed on a primitive monoclinic unit cell having a = 13.536, b = 7.080, c = 24.070 Å, β = 97.9, V = 2284.9 Å3, and Z = 4 using Jade (MDI, 2014) and N-TREOR in EXPO2014 (Altomare et al., Reference Altomare, Cuocci, Giacovazzo, Moliterni, Rizzi, Corriero and Falcicchio2013). Both of these programs, as well as FOX (Favre-Nicolin and Černý, Reference Favre-Nicolin and Černý2002), suggested that the space group was P21/n, which is unexpected for a chiral molecule. A reduced cell search in the Cambridge Structural Database (Groom et al., Reference Groom, Bruno, Lightfoot and Ward2016) combined with the chemistry “C H Cl N O only” yielded 7 hits, but no crystal structure for levocetirizine dihydrochloride.
A connectivity search in the CSD yielded the dipicrate salt WADPIC (Jasinski et al., Reference Jasinski, Butcher, Siddegowda, Yathirajan and Ramesha2010). The cation was extracted from the structure using Materials Studio 8.0 (Dassault, 2014), saved as a mol2 file, and converted to a Fenske-Hall Z-matrix file using OpenBabel (O'Boyle et al., Reference O'Boyle, Banck, James, Morley, Vandermeersch and Hutchison2011). The structure was solved in P21/n with FOX (Favre-Nicolin and Černý, Reference Favre-Nicolin and Černý2002) and DASH (David et al., Reference David, Shankland, van de Streek, Pidcock, Motherwell and Cole2006) using the cation and two Cl as fragments.
Although a reasonable refinement could be obtained, the refinement was of a nominally chiral molecule in a centrosymmetric space group. A second-harmonic generation (SHG) test revealed a weak (though definite; Figure 2) signal, demonstrating that the sample was indeed non-centrosymmetric. A close examination of the powder pattern revealed that peaks indexed as 100 and 20-1 (which violate the n-glide) were present, though very weak and broader than the strong peaks (Figure 3; the peak at 1.54° is from the Kapton capillary). The 102 peak is also present but is narrower than the other two violating peaks. The true symmetry may thus be P21.
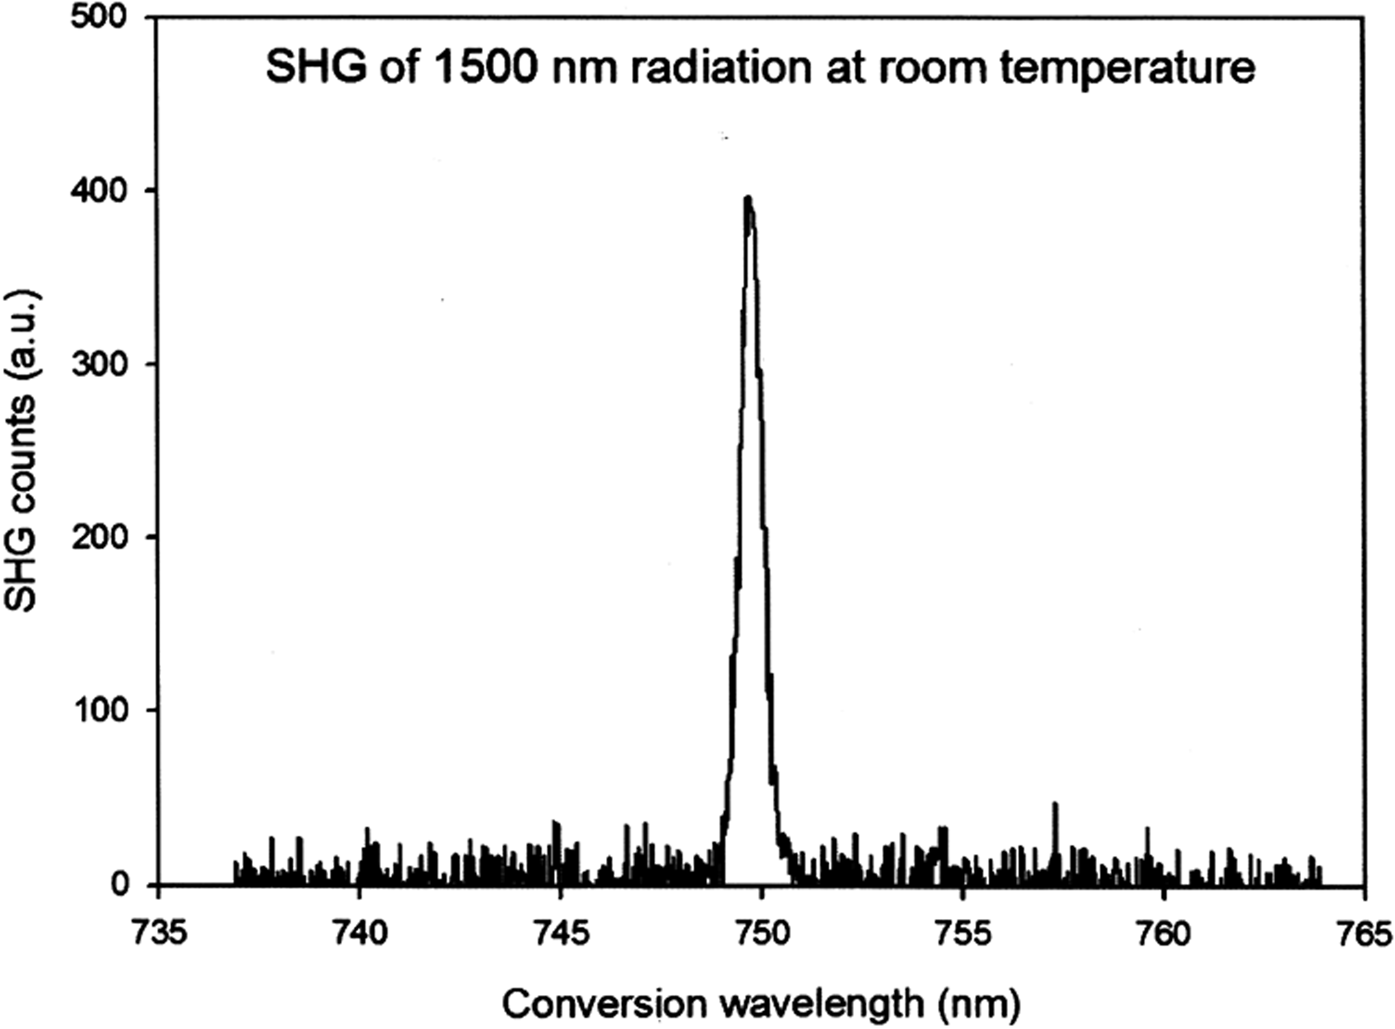
Figure 2. The second-harmonic generation (SHG) signal from levocetirizine dihydrochloride.

Figure 3. An expanded view of the low-angle portion of the synchrotron powder pattern of levocetirizine dihydrochloride, showing the symmetry-forbidden peaks in P21/n.
The chirality occurs at the central carbon atom of the molecule and is determined by on which side of the carbon the hydrogen atom lies. Difficulty in establishing the chirality using X-ray powder diffraction data might then be expected. The P21/n structure was converted to P1 using Materials Studio (Dassault, 2014). The chirality of the S-enantiomer molecules was inverted manually, and the symmetry transformed to P21. The lower symmetry means that the asymmetric unit is larger: two levocetirizine dications and four Cl ions.
Density functional geometry optimizations (fixed experimental unit cell) were carried out for both the P21/n and P21 models using CRYSTAL14 (Dovesi et al., Reference Dovesi, Orlando, Erba, Zicovich-Wilson, Civalleri, Casassa, Maschio, Ferrabone, De Le Pierre, D'Arco, Noel, Causa, Rerat and Kirtman2014). The basis sets for the H, C, N, and O atoms were those of Gatti et al. (Reference Gatti, Saunders and Roetti1994), and the basis set for Cl was that of Peintinger et al. (Reference Peintinger, Vilela Oliveira and Bredow2013). The calculations were run on 8 2.1 GHz Xeon cores (each with 6 GB RAM) of a 304-core Dell Linux cluster at IIT, used 8 k-points and the B3LYP functional. Density functional geometry optimizations (fixed experimental unit cell) were also carried out using VASP (Kresse and Furthmüller, Reference Kresse and Furthmüller1996) through the MedeA graphical interface (Materials Design, 2016). The calculations were carried out on 16 2.4 GHz processors (each with 4 GB RAM) of a 64-processor HP Proliant DL580 Generation 7 Linux cluster at North Central College. The calculations used the GGA-PBE functional, a plane wave cutoff energy of 400.0 eV, and a k-point spacing of 0.5 Å−1 leading to a 2 × 2 × 1 mesh for P21/n and a 1 × 2 × 1 mesh for P21. Both CRYSTAL14 and VASP suggested that the P21/n structure was lower in energy, by 1.1 and 5.6 kcal mol−1, respectively.
A Rietveld refinement was carried out for the P21 model. Despite the larger number of variables (156), it yielded higher residuals (R wp ~16%) and unreasonable geometry. The chirality of one of the central carbon atoms inverted from R to S, and the phenyl-carbon distances to this carbon atom refined to very long values, even though restrained. The refinement also yielded several too-short (overlapping) chloride-cation distances. Either this model is wrong or the limited diffraction data do not support refinement of this more-complex model.
The Rietveld refinement of the P21/n model was carried out using GSAS-II (Toby and Von Dreele, Reference Toby and Von Dreele2013). Only the 1.7–25.0° portion of the pattern was included in the refinement (d min = 0.957 Å). The phenyl rings were refined as vector rigid bodies. To permit occupation of site of both chirality by only R molecules, the central carbon atom C22 was modeled as two disordered half-occupancy atoms (along with the bond H atoms). All (non-rigid body) non-H bond distances and angles were subjected to restraints, based on a Mercury/Mogul Geometry Check (Bruno et al., Reference Bruno, Cole, Kessler, Luo, Motherwell, Purkis, Smith, Taylor, Cooper, Harris and Orpen2004; Sykes et al., Reference Sykes, McCabe, Allen, Battle, Bruno and Wood2011) of the molecule. The Mogul average and standard deviation for each quantity were used as the restraint parameters. The restraints contributed 49.9% to the final χ 2; most of this contribution involved the bonds and angles around the disordered central carbon atom. The hydrogen atoms were included in calculated positions, which were recalculated during the refinement using Materials Studio (Dassault, 2014). The U iso were grouped by chemical similarity; the U iso for the chloride anions were constrained to be the same. The Cl1 on the phenyl ring was refined anisotropically, even though the refinement yielded a strange ellipsoid. The background was modeled using a 3-term shifted Chebyshev polynomial, along with a 4-term Debye function to model the scattering from the Kapton capillary and the amorphous component of the sample. The peak profiles were described using the generalized microstrain model, and a spherical harmonic preferred orientation model was included.
The final refinement of 105 variables using 23 302 observations and 49 restraints yielded the residuals R wp = 0.1106 and GOF = 3.15. The largest peak (0.18 Å from Cl55) and hole (1.60 Å from C19) in the difference Fourier map were 0.68 and −0.40(10) eÅ−3, respectively. The magnitudes of the peaks and holes are less than a hydrogen atom, and their locations do not suggest any chemical interpretation. The largest errors in the fit (Figure 4) are in the intensities and shapes of the strong peaks and indicate the approximate nature of this model.

Figure 4. The Rietveld plot for the refinement of levocetirizine dihydrochloride. The blue crosses represent the observed data points, and the green line is the calculated pattern. The cyan curve is the normalized error plot. The vertical scale has been multiplied by a factor of 10× for 2θ > 9.6°.
III. RESULTS AND DISCUSSION
This synchrotron powder pattern is similar enough to that reported for Form I (Figure 5) to conclude that the current sample is the same as that made by Dr. Reddy's Laboratories. Several weak broad peaks indicate the presence of at least one poorly crystalline impurity. The background is higher than several other samples measured at the same time, suggesting that an amorphous phase is also present.

Figure 5. Comparison of the synchrotron pattern from this study of levocetirizine dihydrochloride to the pattern of form I reported by Reddy et al. (Reference Reddy, Srinivasan, Uppala, Vaddadi and Joga2004b). The published pattern was digitized using UN-SCAN-IT (Silk Scientific, 2013) and scaled to the synchrotron wavelength of 0.414157 Å using MDI JADE Pro (MDI, 2019).
The refined atom coordinates of (P21/n) levocetirizine dihydrochloride and the coordinates from the density functional theory (DFT) optimizations (P21/n and P21; both CRYSTAL14 and VASP) are reported in the CIFs which have been deposited with ICDD. The asymmetric unit (with atom numbering) is illustrated in Figure 6, and the crystal structure is presented in Figure 7.

Figure 6. The asymmetric unit of levocetirizine dihydrochloride, with the atom numbering. The atoms are represented by 50% probability spheroids. The methyne groups C22/H23 and C57/H58 are half-occupied.

Figure 7. The crystal structure of levocetirizine hydrochloride, viewed down the b-axis.
The root-mean-square (rms) Cartesian displacement of the non-hydrogen atoms in the Rietveld-refined and CRYSTAL14-optimized structures of the cations is 0.325 Å (Figure 8). The agreement is at the top end of the normal range expected for correct structures (van de Streek and Neumann, Reference van de Streek and Neumann2014). The mis-fits are spread throughout the cations. The rms displacement between the CRYSTAL14- and VASP-optimized structures is only 0.027 Å, showing that the two programs yielded equivalent structures. The rest of the discussion will emphasize the experimental and CRYSTAL14 structures.

Figure 8. Comparison of the Rietveld-refined (red), CRYSTAL14-optimized (blue), and VASP-optimized (green) structures of levocetirizine dihydrochloride.
The Mercury/Mogul Geometry check (Macrae et al., Reference Macrae, Sovago, Cottrell, Galek, McCabe, Pidcock, Platings, Shields, Stevens, Towler and Wood2020) utility was used to analyze the refined and optimized structures (Table I). Most of the bond distances, angles, and torsion angles in the refined structure fall within the normal ranges, but a few were flagged as unusual. All of the bonds, angles, and torsions in the DFT-optimized structure fell within the normal ranges. The bonds between the phenyl rings and the central carbon atom C22 are exceptionally long (Figure 9), even though they were strongly restrained at the Mogul average value. Several of the angles involving this area of the molecule are also unusual (an example in Figure 10), as well as the C26–C27–Cl1 angle. A number of the torsion angles lie on the tails of distributions of similar torsion angles, but those involving rotation of the C54–C51 bond are truly unusual (Figure 11). The conformation of the carboxylic acid end of the molecule is unusual. The refinement was started from the DFT-optimized structure, so the data drove the structure this way. This anisotropic displacement ellipsoid of Cl1 is chemically unreasonable, even though including it led to a better fit. Perhaps the unusual shape is an indication of photolysis of the C27–Cl1 bond in the X-ray beam.

Figure 9. Histogram showing how the unusual refined C24–H22 distance of 1.622 Å compares to the distribution of similar distances in Mogul.

Figure 10. Histogram showing how the unusual refined C34-C22-C24 angle of 133.8° compares to the population of similar angles in Mogul.

Figure 11. Histogram showing how the unusual refined O3–C54–C51–O2 torsion angle of 91.5° compares to the population of similar torsions in Mogul.
Table I. Unusual geometrical features (Mogul) in levocetirizine dihydrochloride.

Similar Mogul analysis of the DFT-optimized P21 structure yielded no unusual geometrical features, even though starting a refinement from this model yielded a strange geometry (Figure 12).

Figure 12. Comparison of the Rietveld-refined (red) and DFT-optimized (blue) structures of levocetirizine dihydrochloride in space group P21.
Quantum chemical geometry optimization of the levocetirizine cation (DFT/B3LYP/6-31G*/water) using Spartan ’18 (Wavefunction, 2020) indicated that the observed solid-state conformation is 5.9 kcal mol−1 higher in energy than the local minimum (Figure 13). The differences lie mainly in the orientations of the phenyl rings and the end of the carboxylic acid side chain. The global minimum-energy conformation (Figure 14; which is equivalent in energy to the local minimum) has a different orientation of the carboxylic acid. These differences show that solid-state interactions, particularly the hydrogen bonding to the chloride anions, influence the observed conformation.

Figure 13. Comparison of the DFT-optimized (blue) and local-minimum (orange) conformations of the cation in levocetirizine dihydrochloride.

Figure 14. Comparison of the DFT-optimized (blue), local-minimum (orange), and global minimum (purple) conformations of the cation in levocetirizine dihydrochloride.
The crystal structure (Figure 7) consists of interleaved double columns of cations and anions along the short b-axis. The hydrogen bonds link the cations and anions along this axis. The saturated C4N2 rings lie approximately parallel to the ac-plane. Most of the intermolecular interactions appear to be van der Waals. Phenyl–phenyl stacking is prominent, but there is no evidence from the population analysis for π⋯π overlaps.
Analysis of the contributions to the total crystal energy using the Forcite module of Materials Studio (Dassault, 2014) suggests that bond and angle distortion terms dominate the intramolecular deformation energy. The intermolecular energy is dominated by electrostatic attractions, which in this force-field-based analysis include cation coordination and hydrogen bonds. The hydrogen bonds are better analyzed using the results of the DFT calculation.
As expected, hydrogen bonds (Table II) are important in the crystal structure. Each protonated nitrogen atom forms a strong N–H⋯Cl hydrogen bond to one of the chloride anions. The carboxylic acid group also forms an H-bond to Cl56, resulting in a ring with a graph set (Etter, Reference Etter1990; Bernstein et al., Reference Bernstein, Davis, Shimoni and Chang1995; Shields et al., Reference Shields, Raithby, Allen and Motherwell2000) R1,2(10). The carboxylic acid H5 also forms an intramolecular O–H⋯O bond to the ether oxygen O2. The energy of the O–H⋯O hydrogen bond was calculated using the correlation of Rammohan and Kaduk (Reference Rammohan and Kaduk2018). These hydrogen bonds almost certainly influence the solid-state conformation of the levocetirizine cation. Several C–H⋯Cl/O hydrogen bonds contribute to the crystal energy, and there are weak interactions between the methylene groups adjacent to the ether oxygen O2.
Table II. Hydrogen bonds (CRYSTAL14) in the P21/n structure of levocetirizine dihydrochloride.

* = intramolecular.
In the DFT-optimized P21 structure, only three of the four protonated nitrogen atoms form N–H⋯Cl hydrogen bonds to the chloride anions (Table III). (For the atom numbering of the P21 structure, consult the deposited files cetirizine_4_DFT.cif and cetirizine_4_VASP.cif.) There are three apparent strong C–H⋯Cl hydrogen bonds, as well as the usual O–H⋯O, C–H⋯O, and C–H⋯Cl hydrogen bonds. This hydrogen bond pattern is not chemically reasonable and provides a reason to discount this structure as unreasonable.
Table III. Hydrogen bonds (CRYSTAL14) in the P21 structure of levocetirizine dihydrochloride.

* = intramolecular.
The volume enclosed by the Hirshfeld surface (Figure 15; Hirshfeld, Reference Hirshfeld1977; Turner et al., Reference Turner, McKinnon, Wolff, Grimwood, Spackman, Jayatilaka and Spackman2017) is 562.82 Å3, 98.50% of 1/4 the unit cell volume. The packing density is, thus, fairly typical. All of the significant-close contacts (red in Figure 15) involve the hydrogen bonds. The volume/non-hydrogen atom is 19.7 Å3, reflecting the larger size of Cl compared with C, N, and O.

Figure 15. The Hirshfeld surface of levocetirizine dihydrochloride. Intermolecular contacts longer than the sums of the van der Waals radii are colored blue, and contacts shorter than the sums of the radii are colored red. Contacts equal to the sums of radii are white.
The Bravais–Friedel–Donnay–Harker (Bravais, Reference Bravais1866; Friedel, Reference Friedel1907; Donnay and Harker, Reference Donnay and Harker1937) morphology suggests that we might expect an elongated morphology for levocetirizine dihydrochloride, with [010] as the long axis. A 4th-order spherical harmonic model for preferred orientation was incorporated into the refinement. The texture index was 1.043(2), indicating that the preferred orientation was slight in this rotated capillary specimen. The powder pattern of levocetirizine dihydrochloride from a Le Bail extraction of this synchrotron data set is included in the Powder Diffraction File™ as entry 00-066-1627.
IV. CONCLUSIONS
The centrosymmetric P21/n model for the crystal structure of levocetirizine dihydrochloride is better than the non-centrosymmetric P21 model, even though levocetirizine is a chiral molecule, the sample exhibits weak SHG, and three weak peaks which violate the glide plane are observed. The centrosymmetric model is better by statistical, graphical, and energetic measures, as well is by chemical reasonableness. To accommodate the chiral molecule in a centrosymmetric space group, the chiral central carbon atom was disordered over two half-occupied positions, so that each cation site could be occupied by a cation of the correct chirality. It is, of course, possible that the weak SHG arose from an impurity, and that the sample is truly a racemate.
V. DEPOSITED DATA
The Crystallographic Information Framework (CIF) files containing the results of the Rietveld refinement (including the raw data) and the DFT geometry optimization were deposited with the ICDD. The data can be requested at info@icdd.com.
ACKNOWLEDGEMENTS
The use of the Advanced Photon Source at Argonne National Laboratory was supported by the U.S. Department of Energy, Office of Science, Office of Basic Energy Sciences, under Contract No. DE-AC02-06CH11357. This work was partially supported by the International Centre for Diffraction Data. We thank Lynn Ribaud and Saul Lapidus for their assistance in the data collection, and Andrey Rogachev for the use of computing resources at IIT. We thank Christos Malliakis at Northwestern University for the measurement of the second-harmonic generation, and Carol Brock of the University of Kentucky for helpful discussions.
CONFLICTS OF INTEREST
The authors have no conflicts of interest to declare.


