
Abstract
In the coupled electric interaction of rock fractures and gas invasion, that is, when gases interact with newly created crack surfaces, the unpaired electrons within the rock crystal defects are thermally stimulated, released into the crack due to the temperature rise at the crack tip via plastic work, and attached to ambient gas molecules to electrify them in a negative state. Using a working hypothesis that this mechanism is the source mechanism of seismo-electromagnetic phenomena, we conducted laboratory experiments in which rocks were fractured with pressurized N2, CO2, CH4, and hot water vapour. Fractures were induced by a flat-ended indenter equipped with a flow channel, which was loaded against blocks of quartz diorite, gabbro, basalt, and granite. Fracture-induced negatively electrified gas currents at ~ 25 °C and ~ 160 °C were successfully measured for ~ ≥ 100 μs after full development of the crack. The peak electric currents were as high as 0.05–3 μA, depending on the rock species and interaction area of fractured rock and gas and to a lesser extent on the gas species and temperature. The peak current from fracturing granite, which showed higher γ-ray activity, was at least 10 times higher than that from fracturing gabbro, quartz diorite, and basalt. The results supported the validity of the present working hypothesis, that coupled interaction of fracturing rock with deep Earth gases during quasi-static rupture of rocks in the focal zone of a fault might play an important role in the generation of pre- and co-seismic electromagnetic phenomena.
Introduction
Geophysical evidence suggests that mantle-derived deep Earth fluids/gases along fault planes have an important role in generating earthquakes, and this is significant for modelling earthquake occurrence (Yoshida et al. 2002; Sano et al. 2014, 2016). According to the deep Earth gas hypothesis, when water-bearing porous sediment extends to a great depth, the different pressure gradients in water and rock form a stepwise pressure distribution that builds up in the underground rock–water system. Then, a pore-collapsed domain develops at a critical depth and forms an impermeable barrier to deep Earth fluids (Gold 1987; Sibson 1990). An impermeable layer that crosses a high-angle reverse fault is called a “fault valve” (Sibson 1990), and deep Earth fluids can be stored in the lower portions of a fault valve during interseismic periods. Water has been found in deep scientific boreholes to depths up to 10 km, and it is likely that water extends as deep as ~ 20 km in stable crust (Smithson et al. 2000). Meanwhile, the seismogenic zone of on-shore earthquakes commonly also extends to depths of 10–20 km (Sibson 1990).
When both the tectonic shear stress and the pressure of the reservoir fluids reach a critical level, micro-cracks grow in the fault-valve zone and link with each other. Then, when the linked cracks breach the fluid reservoir barrier, low-viscosity gases, such as hydrocarbons and 3He contained in the deep Earth fluids, and then expanding gases degassed from deep fluids percolate into the linked cracks, widen them, and weaken the fault zone, which results in acceleration of unstable ruptures, leading to major earthquakes. In fact, recent observation of helium/argon isotope changes after the 2016 Kumamoto earthquake, which was a high-angle reverse-type event, suggested that the helium/argon anomaly probably resulted from deep-seated fluids being squeezed through the fault plane by the tectonic stress that caused the earthquake (Sano et al. 2016). The beginning of a quasi-static rupture of the seismogenic fault-valve zone when the linked cracks breach the fluid reservoir, leading to the unstable acceleration of rupture of the whole seismogenic zone, might correspond to an imminent precursor period of earthquakes.
The fault-valve model is also assumed to apply at subduction zones, where an asperity on the subducting plate is tightly connected to the pore-collapse domain in the accretion wedge. In fact, Kumagai et al. (2012) showed that a strongly localized asperity, possibly a subducting seamount, may have been the origin of the mega-asperity of the 2011 Tohoku-Oki earthquake. Therefore, when a seamount on an oceanic plate encounters a rigid impermeable barrier layer in a continental plate, it might create the conditions for fault-valve behaviour to store deep Earth fluids during an interseismic period. This model might also be supported by recent physicochemical analyses of deep-sea waters performed after the 2011 Mw9 Tohoku-Oki earthquake, which showed that 13C-enriched methane and 3He-bearing fluids were released from deep sub-seafloor reservoirs after the mainshock passed through the plate interface in the subduction zone (Kawagucci et al. 2012; Sano et al. 2014).
When deep gases interact with the newly created crack surfaces generated in the fault, the unpaired electrons contained in the rock crystal defects are thermally stimulated (Fukuchi et al. 1986) and released into the open crack due to the rise in temperature (~ > 300 °C) at the crack tip, where heat is generated by plastic work dissipation (Li et al. 1996). These electrons then become attached to the gas molecules, electrifying them to a negative state (Scudiero et al. 1998; Enomoto 2012; Enomoto et al. 2017). We believe that this process is the elementary mechanism of the electromagnetic phenomena that accompanies an earthquake. Note that the geomagnetic variation caused by the 1965–1967 Matsushiro earthquake swarm could be explained quantitatively by this model (Enomoto et al. 2017).
The present report is an extension of previous laboratory experiments (Enomoto et al. 2017) performed to understand the electromagnetic phenomena underlying the quasi-static fracturing stage of the fault. To this end, we conducted a wide range of experiments using various combinations of gas species and rock species, not only at the room temperature of ~ 25 °C, but also at an elevated temperature of ~ 160 °C, a temperature comparable to that of the seismogenic zone (Sano et al. 2014). At this temperature, the rock still exhibits brittle properties (Kawamoto and Shimamoto 1997), but unpaired electrons are stably trapped in the crystal lattice defects in the rock (Fukuchi et al. 1986).
Methods
Fracture tests
As illustrated in the schematic view of the experimental setup in Fig. 1a, a flat-ended V-shaped plate-type indenter made of hardened carbon steel was attached to a universal testing machine and pressed against a rock sample. The tested rocks were as-received quartz diorite (from Kanagawa/Tanzawa, Japan), gabbro (from Zimbabwe), basalt (from Hyogo, Japan), and fine-grained granite (from Fujian, China). The water content of these rocks was in the range of 0.03–0.15 wt%. The basic configuration of the equipment is the same as that previously reported (Enomoto et al. 2017), but some improvements were made to conduct the experiment at elevated temperature (~ 160 °C) and under a variety of conditions.

a Schematic view of the experimental setup: universal tester for the measurement of electrified gas current interacting with fractured rock at temperatures of ~ 25 °C and ~ 160 °C, with the three methods of gas supply shown on the right side; b flat-ended indenter gas outlet (slit) covered with PTFE seal, as seen from below; c bottom view of Pt-coated mesh electrode attached to the underside of the rock; d setup in fourth series of experiments with an electrode (stainless-steel rod with or without resin coating) buried in acrylic container filled with granite grains and soil; e close-up of container in d; f three-dimensional model of flat-ended indenter on a rock; g meshing for model shown in f, with contact configuration, mesh refinement near stress concentration, line A–B, and parameters; h colour coding of equivalent strain; and i–k and l–n two-dimensional strain distribution along a line A–B at loads of 600, 800, and 1200 kg without and with a small flaw on the rock surface, respectively
A square rock sample was loosely clamped to prevent the edge of the rock from lifting during loading or jumping sideways upon rupture. Two sheets of polytetrafluoroethylene (PTFE) 0.4 mm thick were greased for lubrication and placed between the rock and the clamp stop surface to control the slippage during fracture so that the initial crack width at the time of fracture was about 1 mm (see Fig. 1b). At the same, a pressurized gas stored in a flow channel inside the indenter, which had an open slit 20 mm long by 1.8 mm wide, was sealed with a PTFE sheet 0.4 mm thick for experiments at room temperature of ~ 25 °C (see Fig. 1b) and lead alloy sheet 0.4 mm thick for ~ 160 °C (not shown). As shown on the right side of Fig. 1a, heated CO2, CH4, and N2 gases at a pressure 0.4–0.5 MPa were supplied to the gas flow channel inside the indenter from the gas cylinders and passed through a temperature-controlled heat exchanger. On the other hand, hot water vapour was supplied to the flow channel from a pressured vessel having a saturated vapor pressure at 160 °C. The indenter pressed the rock during loading at a crosshead speed of 0.5 mm/min, and immediately after the rock was subjected to a guillotine fracture at the critical fracture load, the gas flowed into the crack gap and interacted with the newly created fracture surface, resulting in electrification of gas molecules. Then, the gas current was measured by an electrode made of #20 copper mesh sputter-coated with platinum to prevent oxidation degradation (see Fig. 1c) and recorded by a datalogger with a sampling time of 10 μs. The signal of the vibrometer attached to the indenter holder (see Fig. 1d) was used as a trigger to record the current signals to the datalogger. The vibration signal is also used to determine the final rupture point of the rock when the gas starts to flow into the crack gap.
In earlier experiments, it often happened that the fracture occurred irregularly outside the area directly below the gas outlet slit, and thus the current signal was also irregular. Therefore, a small flaw was introduced just under the slit with a diamond blade, and this produced the expected guillotine-type fracture with relatively good reproducibility. Its effectiveness was confirmed by finite element analysis of stress and strain under contact load, as described in the next section.
Several series of experiments were conducted to understand how the various factors affect the generation of electrified gas currents associated with rock fracture. These factors included gas species, rock species, rock/gas interaction area, and voltage bias on the electrode. The rock/gas interaction area S was defined as S = (rock thickness Lt) × (electrode width Lw).
In the first series of experiments to understand the characteristic feature of the electric signals from the reference electrode and electrode for gas current were evaluated during the loading period up to the final fracture. The signal from the reference electrode, which was attached on the rock surface near the indenter (see insert in Fig. 2a) was measured to investigate the effect of charge fluctuation during loading. The effect of bias voltages of 0 V, that is, an electrically floating state (no bias), and ± 77 V on the electrode was also evaluated.

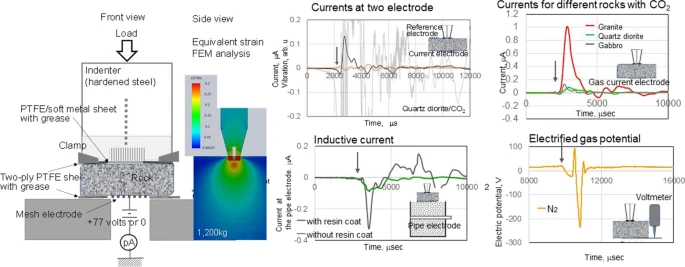
a Current signals for combination of quartz diorite/CO2 at ~ 25 °C with electrode bias of + 77 V and S = 1.6 × 10⁻⁴ m2, where black curve is the signal at the gas current electrodes, orange curve is the signal at the reference electrode, and light grey curve is the vibration signal; b electric currents for combination of quartz diorite/CO2 at ~ 25 °C with electrode bias of ± 77 V (left) and electric currents for combination of gabbro/CO2 at ~ 160 °C with electrode bias of ± 77 V and without bias (0 V) (right) (in all tests, S = 1.2 × 10⁻⁴ m2), where blue curves are at electrode bias of − 77 V, orange ones are at + 77 V and grey one is at 0 V; c electric currents for combination of gabbro/CH4 at ~ 160 °C without electrode bias at S = 1.2 × 10⁻⁴ m2 and S = 2.4 × 10⁻⁴ m2; d electric currents for combination of gabbro/CO2 at ~ 25 °C and ~ 160 °C (two signals for each temperature overlap because two tests were performed at each temperature to check the reproducibility) and e electric signals for combination of gabbro/CO2, water vapour, N2, and CH4 at ~ 160 °C and combination of basalt/N2 at ~ 160 °C. Arrows in a–e show the final rupture point when the gas started to flow in the crack gap. f Relationship between the peak current Ip and rock/gas interaction area S for the various test conditions listed in the plot legend. The data for quartz diorite/CO2 for + 77 V and ~ 25 °C were taken from one author’s previous work (Enomoto et al. 2017). The dotted line in f is an approximated relation: Ip (μA) = 1069 × S (m2), where the coefficient of determination is R2 = 0.83
In the second series, the effects of rock/gas interaction area S and various combinations of rock/gas species at gas temperatures of ~ 25 °C and ~ 160 °C on electric currents without the electrode bias were studied for quartz diorite, gabbro, and basalt.
In the third series, the electrical potential was measured using a contact-type ultra-high-impedance voltmeter attached to the electrically floating mesh electrode. The measuring range was ± 0–2000 V and the sampling time was 500 μs. This experiment was performed with the combination of gabbro/N2 at ~ 160 °C. The electrostatic energy of the gas was then evaluated.
To investigate the electrostatic induction effect near the ground surface, away from the deep earthquake focal zone where coupled electrical interaction occurs, we conducted a fourth series of experiments with the setup shown in Fig. 1d and e. We filled an acrylic container with small granite grains and soil with water content of 0.9 wt%, and buried an electrode of stainless-steel rod 5 mm in diameter, with and without a non-conductive acrylic resin coating, at a depth 40 mm below the back surface of the fine-grained granite.
Finite element analysis of elastic deformation during loading
Before adopting the flat-ended indenter described above, an indenter with a round tip shape was used in preliminary experiments. However, the PTFE seat, which seals the pressurized gas, broke during loading due to high line contact stress, and the gas often leaked before the final fracture. Therefore, the flat-ended indenter was adopted to improve the sealing property.
However, there were often cases where the rock did not fracture directly under the gas slit of the indenter. Therefore, as mentioned above, a flaw smaller than the slit width was introduced into the rock surface in the middle of the projection surface of the slit. We then conducted a finite element analysis to examine its effectiveness. To this end, we used SOLIDWORKS 2015® with the three-dimensional contact configuration shown in Fig. 1f. The mesh size in the area where stress is concentrated, to a depth of 25 mm and with a width of 50 mm, was 0.3 mm, and the area outside the concentration had a mesh size of 4 mm (see Fig. 1g). The flaw on the rock surface was 0.5 mm wide and 2 mm deep. The material parameters of the hardened carbon steel indenter and rock (granite) are noted in Fig. 1g.
Figure 1h is a colour chart showing the equivalent strain (ESTRN) level in Fig. 1i–n, where Fig. 1i–k and l–n shows the two-dimensional strain distribution along lateral line A–B (see Fig. 1f) at loads of 600, 800, and 1200 kg without and with small flaws on the rock surface, respectively. The results show that when a flaw is introduced on the rock surface, the strain is well concentrated beneath the flaw at a load of 800 kg or more, which suggested that such flaws are likely to create a crack directly under the gas slit.
Results and discussion
Characteristic feature of the signals during rock loading/fracture
In the first series of experiments using quartz diorite rock 20 mm thick and an electrode biased at + 77 V with flowing CO2 gas (hereafter we simply note this as combination of quartz diorite/CO2), the typical result (Fig. 2a) showed that the electrified gas current (see the black signal) was successfully measured for approximately 100 μs after the full development of the crack when a big vibration occurred (see the light-grey signal in Fig. 2a). To determine how the electric charges possibly generated by stress-activated and/or electrokinetic effects during loading affect the current signal, the signal of the reference electrode attached to the rock sample near the indenter (inset of Fig. 2a), was monitored. The result indicated that the charge effect was much lower, as shown by the orange signal in Fig. 2a. Note that laboratory experiments of the electric currents due to stress-stimulated electric effects in granite (Hadjicontis and Mavromatou 1996) and in gabbro (Freund 2002; Dahlgren et al. 2014) or due to water-induced electrokinetic effects in sandstone (Wang et al. 2015) have been reported, where the current levels were on the order of several to several tens of nanoamperes. In comparison to these reported results, the present gas currents were higher by an order of magnitude or more.
Figure 2b shows typical electric current signals measured at an electrode bias of ± 77 V for the combination of quartz diorite/CO2 at ~ 25 °C and ± 77 V and no bias for the combination of gabbro/CO2 at ~ 160 °C, respectively. These results show that the current was less related to the polarity of the electrode bias voltage under the present conditions. Because all signals were recorded on the positive side even without bias, the current should be negatively charged. Thus, the results suggest that the charged gas current has negative potential higher than − 77 V, which was confirmed by the experiments described in detail below.
Effect of rock/gas interaction area, rock and gas species, and gas temperature
In the second series of experiments, a bias-free electrode was used to investigate the effect of rock/gas interaction area S and the gas species at ~ 25 °C and ~ 160 °C for gabbro and basalt. Figure 2c shows the current signals of S = 1.2 × 10⁻⁴ m2 (i.e. Lt = 15 mm and Lw = 8 mm) and 2.4 × 10⁻⁴ m2 (i.e. Lt = 20 mm and Lw = 12 mm) for the combination of gabbro/CH4 at ~ 160 °C, and it can be seen that the peak current increased as the interaction area S increased.
Figure 2d shows the current measurements conducted twice each for the combination of gabbro/CO2 at ~ 25 °C and ~ 160 °C. The peak currents were all in the range 0.08–0.15 μA and independent of the temperature. The variations in the peak values were within a reasonable limit.
Figure 2e shows a comparison of the currents for gabbro combined with various gas species—water vapour, CO2, N2, and CH4 at ~ 160 °C—and also the current for basalt combined with N2 at ~ 160 °C. The interaction area S was 1.2 × 10⁻⁴ m2 in these experiments. The results show that the gas current characteristics did not change regardless of the rock and gas species combination employed in the second series of experiments.
Figure 2f summarizes the relationship between the peak current Ip of various gases at ~ 25 °C and ~ 160 °C for quartz diorite and gabbro in the second series of experiments, as well as the peak current Ip of quartz diorite/CO2 at ~ 25 °C with electrode bias of + 77 V, as reported elsewhere (Enomoto et al. 2017), and the interaction area S. As S increased, the scatter in the peak current Ip became notable because the increasing thickness of the rock Lt or width of the electrodes Lw often caused unstable or irregular rock fractures. Nevertheless, the relationship of Ip versus S could be expressed by a linear approximation: Ip (in microamperes) = 1069 × S (in square metres) with the coefficient of determination of R2 = 0.83, which indicated the maximum current density per 1 m2 of fracture area is 1.1 mA/m2, regardless of the rock or gas species, gas temperature, or bias of the electrode in the range tested in the second series of experiments.
Electrostatic energy
To estimate the electrostatic energy of the electrified gas flow in the present fracture experiments, in the third series of experiments, we independently measured the current flowing through the electrode and the potential generated on the electrically floating electrode for the combinations of gabbro/N2 and gabbro/CH4. Figure 3a and b shows the typical current results for the combinations of gabbro/N2 and CH4 at ~ 160 °C, which are enlarged the signals in the middle of Fig. 2e, and electric potential for the combination of gabbro/N2 at ~ 160 °C, respectively. From Fig. 3a, the total negative charge Q generated during the total time from the first increase of the current signal to its peak in combination of gabbro/N2 is estimated as –5.3 × 10⁻¹² C, and from Fig. 3b, the minimum potential V is -230 V. The electrostatic energy E is thus estimated as

a and b Typical results for third series of experiments. a Currents for combination of gabbro/CH4 or N2 at ~ 160 °C, which are enlarged the signals in the middle of Fig. 2e; b electric potential for gabbro/N2 at ~ 160 °C. c and d Typical results for fourth series of experiments. c Current and vibration for combination of granite/CO2 at ~ 25 °C and d induced current signals at the pipe electrode with and without non-conductive resin coating buried in a container filled with granite grains and soil. Arrows show in a–d the final rupture point when the gas started to flow in the crack gap. e Gamma-ray equivalent dose rate for granite, gabbro, and quartz diorite in 30-min measurements. f Comparison number Nγ>0.04 of events for the γ-ray equivalent dose rate greater than 0.04 μSv/h and average peak currents for several test runs of quartz diorite, gabbro, basalt, and granite with CO2 at S = 1.2 × 10⁻⁴ m2 and ~ 25 °C; Nγ>0.04 for the background in open air is also included. Arrows pointing to the left and right indicate the vertical axis showing the units of the blue and orange bar graphs
In some of the gabbro fracturing experiments using CH4, the rock fracturing test section was shielded from external light with a blackout curtain, and a high-sensitivity camera with ISO 25,600 was used to take a photograph and determine whether the electrostatic ignition of flammable CH4 occurred during the final rock fracture, but ignition could not be confirmed. Because the minimum energy for electrostatic ignition of CH4 is at least 0.3 × 10⁻³ J (Pratt 2000), an experiment as large as 0.3 × 10⁻³/1.3 × 10–9 = 2.3 × 10⁵ times the present scale might be required for electrostatic ignition of CH4. Because the fracture area interacting with CH4 in the present experiment was 1.2 × 10⁻⁴ m2, there is a high probability that CH4 would be electrostatically ignited by a fracture of (1.2 × 10⁻⁴ m2) × (2.3 × 105) = 27.6 m2 or more, which corresponds to a fracture size of about 5.3 m. This suggests that, because fractures of this scale can easily occur at the fault zone due to tectonic stress during an earthquake, deep Earth CH4 gas is likely to ignite electrostatically. The mechanism of electrostatic ignition due to electrical interaction of fracturing rock with methane may be related to the natural plasmoids (fireballs) recently photographed at the Baikal rift zone in Russia (Tatarinov and Yalovik 2013).
Electrostatic induction
From the fourth series of experiments, Fig. 3c shows typical gas currents at a temperature of ~ 25 °C with S = 1.2 × 10⁻⁴ m2 for the combination of granite/CO2 as well as that of gabbro and quartz diorite/CO2 for comparison. Figure 3d shows the induced current collected by the electrode rods with and without resin coating buried in the container (see Fig. 1e). First, we discuss the results in Fig. 3c, where it is noted that the peak current Ip of the granite is about 10 times larger than those of quartz diorite and gabbro. The average peak current of four tests for granite was 1.76 ± 0.36 μA. One possible reason for this difference is that granite contains more exoelectron emission sources, that is, unpaired electron sites at lattice defects, than the other rocks. To confirm this, we performed electron spin resonance (ESR) analyses to detect trapped electrons at the lattice defects, such as the E’ centre in granite and quartz diorite. However, a normal ESR spectrum could not be obtained, possibly because iron ions or some other metal ions in the rocks interfered with normal ESR acquisition. Because the exoelectrons captured at the lattice defects are caused by radioactive elements within the rock (Lewis 1966), we measured the γ-ray equivalent dose rate from the present rock samples using an environmental radiation monitoring device (measuring range of 150–1250 keV and 0.001–9.999 mSv/h, sampling period of 0.167 min). Figure 3e shows the typical dose equivalent rate of quartz diorite, gabbro, and granite for the measurement period of 30 min in open air. The number of events, defined as the peak dose equivalent rate Nγ>0.04 exceeding 0.04 μSv/h for 30 min, were counted. The results of [Nγ>0.04(rock)]–[Nγ>0.04(background) = 1] were 4 for quartz diorite, 3 for gabbro, 7 for basalt, and 46 for fine-grained granite, where Nγ>0.04 for granite is the highest among the rock samples. The peak currents and the Nγ>0.04 number for the rocks are compared in Fig. 3f. The fact that the correlation between the Ip and Nγ>0.04 of each rock is high suggests the validity of the present working hypotheses: the origin of the gas current after coupled interaction of fracturing rock can be attributed to the mechanism of exoelectron release from the newly created crack surface plus the electrification of gas molecules due to electron attachment reactions.
Next, we discuss the results of Fig. 3d, where electrostatic induction signals were successfully detected by an electrode made of a stainless-steel rod buried in a container filled with rock grains/soil. Note that the signal of Fig. 3c is a negatively charged gas current, while that of Fig. 3d is the opposite, which means that a positive charge is electrostatically induced on an electrode, even with an insulation coating. The present experiment does not necessarily simulate the geometrical scale between the focal zone of an earthquake and the ground surface, but it does suggest that the negative charges generated during the quasi-static fracture process of the focal zone can induce positive charges in an electrode buried near the ground surface.
Note that anomalous changes in the telluric potential/current at the ground level have been often observed in the precursor stage of major earthquakes (e.g., Miyakoshi 1986; Varotsos and Lazaridou 1991; Varotsos et al. 1993; Nagao et al. 1996; Enomoto et al. 2006), and in electromagnetic phenomena related to the telluric potential/current, such as VLF/ULF electromagnetic waves (e.g., Asada et al. 2001; Fujinawa and Takahashi 1990; Hayakawa et al. 2015) and geomagnetic signals (e.g., Enomoto et al. 2020). The generation of such electromagnetic precursors requires the generation of a large electric current before a major earthquake (e.g., Utada 1993; Park et al. 1996; Enomoto 2012). Because tectonic stress does not accumulate rapidly before a major earthquake, and thus any stress-activated electromagnetic processes are hardly able to generate large currents rapidly before an earthquake, the present model of the fracturing rock/gas interaction process provides a plausible explanation for rapid generation of a large current before a major earthquake.
For example, if the resistivity of the crust is assumed as 103·Ωm, Utada (1993) estimated the source current intensity as 105 A for the seismic electric signal of 10–5 V/m associated with an M = 5 earthquake observed by the VAN method (Varotsos et al. 1993) at a station with an epicentral distance of about 105 m. Given the empirical relationship between the fault rupture area SF and the magnitude M as SF = 10(M−4.0) km2 (Kanamori and Anderson 1975), the fault rupture area SF for M = 5 is 107 m2. Our experiment found the maximum gas current for granite to be about 10 times that for gabbro and quartz diorite. We can then estimate the total maximum current Imax generated after interaction of rupture area SF with gases as Imax = 11 × 10–3 A/m2 × 107 m2 = 1.1 × 10⁵ A. Although further study is needed, the present model is responsive to Utada’s point.
Conclusion
The present experiments demonstrated that deep gases, which invade cracks extending through the fault-valve zone and flow upward, interact with quasi-static fractures in the earthquake focal zone to form a negatively charged current after electrical interaction with the newly created crack surfaces. The current magnitude is larger for rocks that contain lattice defects that capture unpaired electrons produced through geological time by natural radiation arising from the decay of radioactive elements (e.g., in granite). The fracture-induced gas current was much higher than the stress-induced current and the electrokinetic streaming current previously reported. It was also experimentally confirmed that the flow of negatively charged gas generated at the focal zone deep underground can induce positive charges at the ground level. The present results thus suggest a mechanism for the previously reported anomalous telluric current signals, and the related electromagnetic phenomena that are often observed at the ground level in association with earthquakes. Also, as a result of this laboratory experiment, it might be possible to detect the electric signal accompanying an earthquake by observing the telluric potential/current induced in a conductor, such as a steel water pipe buried underground. Such an approach is now undergoing model field tests.
Availability of data and materials
The datasets used and/or analysed during the current study are available from the corresponding author on reasonable request.
Change history
13 October 2021
A Correction to this paper has been published: https://doi.org/10.1186/s40623-021-01520-2
23 July 2021
A Correction to this paper has been published: https://doi.org/10.1186/s40623-021-01476-3
References
Asada T, Baba H, Kawazoe M, Sugiura M (2001) An attempt to delineate very low frequency electromagnetic signals associated with earthquakes. Earth Planets Space 53:55–62. https://doi.org/10.1186/BF03352362
Dahlgren RP, Johnston MJS, Vanderbilt VC, Nakaba RN (2014) Comparison of the stress simulated current of dry and fluid-saturated gabbro samples. Bull Seismol Soc Ameri 104:2662–2672. https://doi.org/10.1785/0120140144
Enomoto Y (2012) Coupled interaction of earthquake nucleation with deep Earth gases: a possible mechanism for seisomo-electromagnetic phenomena. Geophys J Inter 191:1210–1214. https://doi.org/10.1111/j.1365-246X.2012.05702.x
Enomoto Y, Hashimoto H, Shirai N, Murakami Y, Mogi T, Takada M, Kasahara M (2006) Anomalous geoelectric signals possibly related to the 2000 Mt. Usu eruption and 2003 Tohoku-Oki earthquakes. Phys Chem Earth 31:319–324. https://doi.org/10.1016/j.pce.2006.02.013
Enomoto Y, Yamabe T, Okumura N (2017) Causal mechanisms of seismo-EM phenomena during the 1965–1967 Matsushiro earthquake swarm. Sci Rep 7:44774. https://doi.org/10.1038/srep44774
Enomoto Y, Heki K, Yamabe T, Sugiura S, Kondo H (2020) A possible causal mechanism of geomagnetic variations as observed immediately before and after the 2011 Tohoku-Oki earthquake. Open J Earthq Res 9:33–49. https://doi.org/10.4236/ojer.2020.92003
Freund FT (2002) Charge generation and propagation in igneous rocks. J Geodyn 33:543–570. https://doi.org/10.1016/S0264-3707(02)00015-7
Fujinawa Y, Takahashi K (1990) Emission of electromagnetic radiation preceding the Ito seismic swarm of 1989. Nature 347:376–378. https://doi.org/10.1038/3473a0
Fukuchi T, Imai N, Shimokawa K (1986) ESR dating of fault movement using various defect centers in quartz; the case in the western South Fossa Magna, Japan. Earth Planet Sci Lett 78:121–128. https://doi.org/10.1016/0012-821X(86)90178-0
Gold T (1987) Outgassing in solid rock. Power from the Earth. JM Dent & Sons Ltd., London, pp 78–91
Hadjicontis V, Mavromatou C (1996) Laboratory investigation of the electric signals preceding earthquakes. In: Lighthill J (ed) A critical review of VAN. World Scientific, Singapore, pp 105–117 https://doi.org/10.1142/9789812815491_0006
Hayakawa M, Schekorov A, Potirakis S, Eftaxias K (2015) Criticality features in ULF magnetic fields prior to the 2011 Tohoku earthquake. Proc Japan Academy, Ser B 91:25–30. https://doi.org/10.2183/pjab.91.25
Kanamori H, Anderson DL (1975) Theoretical basis of some empirical relations in seismology. Bull Seismol Soc Ameri. 65:1073–1095
Kawagucci S, Yoshida YT, Noguchi T, Honda MC, Uchida H, Ishibashi H, Nakagawa F, Tsunogai U, Okamura K, Takaki Y, Nunoura T, Miyazaki J, Hirai M, Lin W, Takai K (2012) Disturbance of deep-sea environments induced by the M9.0 Tohoku earthquake. Sci Rep. 2:270. https://doi.org/10.1038/srep00270
Kawamoto E, Shimamoto T (1997) Mechanical behavior of halite and calcite shear zones from brittle to fully-plastic deformation and a revised fault model. Structural Geology and Geomechanics, Proc 30th Inter Geological Congress 14:89–105.https://doi.org/10.1201/9780203738061
Kumagai H, Pulido N, Furuyama E, Aoi S (2012) Strong localized asperity of the 2011 Tohoku-Oki earthquake, Japan. Earth Planets Space 64:649–654. https://doi.org/10.5047/eps.2012.01.004
Lewis DR (1966) Exoelectron-emission phenomena and geological application. Geologic Soc America Bull 77:761–770. https://doi.org/10.1130/0016-7606(1966)77[761:EPAGA]2.0.CO;2
Li W, Deng X, Rosakis A (1996) Determination of temperature field around a rapidly moving crack-tip in an elastic-plastic solid. Inter J Heat Mass Transfer 39:677–690. https://doi.org/10.1016/0017-9310(95)00175-1
Nagao T, Uyeda S, Asai Y (1996) Kono Y (1996) Anomalous changes in geoelectric potential preceding four earthquakes in Japan. In: Lighthill J (ed) A critical review of VAN. World Scientific, Singapore, pp 292–300. https://doi.org/10.1142/9789812815491_0006
Park SK, Strauss DJ (1996) Aceves RL (1996) Some observations about the statistical significance and physical mechanisms of the VAN method of earthquake prediction, Greece. In: Lighthill J (ed) A critical review of VAN, earthquake prediction from seismic electrical signals. World Scientific, Singapore, pp 267–285; https://doi.org/10.1142/3006
Pratt TH (2000) Electrostatic ignitions of fires and explosions. CCPS Ameri Inst Chem Eng, New York, Chap 4:p182
Sano Y, Hara T, Takahata N, Kawagucchi S, Honda MC, Nishino Y, Tanikawa W, Hasegawa A, Hattori K (2014) Helium anomalies suggest a fluid pathway from mantle to trench during the 2011 Tohoku-Oki earthquake. Nat Commun 5:3084. https://doi.org/10.1038/ncomms4084
Sano Y, Takahata N, Kagoshima T, Shibata T, Onoue T, Zhao D (2016) Groundwater helium anomaly reflects strain change during the 2016 Kumamoto earthquake in Southwest Japan. Sci Rep 6:37939. https://doi.org/10.1038/srep37939
Sibson R (1990) Conditions for fault-valve behaviour. Geol Soc London Spec Pub 54:15–28. https://doi.org/10.1144/GSL.SP.1990.054.01.02
Smithson SB, Wenzel F, Granchin YV, Morozon IB (2000) Seismic results at Kola and KYB deep scientific boreholes: velocities, reflections, fluids, and crustal composition. Techtonophy 329:301–317. https://doi.org/10.1016/S0040-1951(00)00200-6
Scudiero L, Dikinson T, Enomoto Y (1998) The electrification of flowing gases by mechanical abrasion. Phys Chem Minerals 25:566–573. https://doi.org/10.1007/s002690050149
Tatarinov AV, Yalovik LI (2013) Plasmoid phenomenon of “cold” Earth degassing (the Baikal rift zone as illustration). Inter J Sci Res 5:981–997
Utada H (1993) On the physical background of the VAN earthquake prediction method. Tectonophys 224:153–160. https://doi.org/10.1016/0040-1951(93)90067-T
Varotsos P, Lazaridou M (1991) Latest aspects of earthquake prediction in Greece based on seismic electric signals. Tectonophys 188:321–347. https://doi.org/10.1016/0040-1951(91)90462-2
Varotsos P, Alesopoulos K, Lazaridou M (1993) Latest aspects of earthquake prediction in Greece based on seismic electric signals II. Tectonophys 224:1–37. https://doi.org/10.1016/0040-1951(91)90462-2
Wang J, Hu H, Guan W, Li H (2015) Electrokinetic experimental study on saturated rock samples: zeta potential and surface conductance. Geophys J Inter 201:869–877. https://doi.org/10.1093/gji/ggv013
Yoshida N, Okuzawa T, Tsukahara H (2002) Origin of deep Matsushiro earthquake fluid inferred from isotope ratios. Jishin 55:207–216. https://doi.org/10.4294/zisin1948.55.2_207(inJapanese)
Acknowledgements
We gratefully thank the editor and two anonymous reviewers for their constructive and helpful comments. We also thank Genesis Research Institute, Inc., for the collaborative support on the present work.
Funding
This project was supported by Genesis Research Institute, Inc.
Author information
Authors and Affiliations
Contributions
YE planned the research and prepared the manuscript. TY and YE performed fracture experiments. SS and HK contributed to project administration. All authors read and approved the final manuscript.
Corresponding author
Ethics declarations
Competing interests
The authors declare no competing interests.
Additional information
Publisher's Note
Springer Nature remains neutral with regard to jurisdictional claims in published maps and institutional affiliations.
The original online version of this article was revised: Figure 3e has been updated.
The original version of this article was revised: “The equation of SF = 10(M−4.0) on page 8 has been updated.
Rights and permissions
Open Access This article is licensed under a Creative Commons Attribution 4.0 International License, which permits use, sharing, adaptation, distribution and reproduction in any medium or format, as long as you give appropriate credit to the original author(s) and the source, provide a link to the Creative Commons licence, and indicate if changes were made. The images or other third party material in this article are included in the article's Creative Commons licence, unless indicated otherwise in a credit line to the material. If material is not included in the article's Creative Commons licence and your intended use is not permitted by statutory regulation or exceeds the permitted use, you will need to obtain permission directly from the copyright holder. To view a copy of this licence, visit http://creativecommons.org/licenses/by/4.0/.
About this article

Cite this article
Enomoto, Y., Yamabe, T., Sugiura, S. et al. Laboratory investigation of coupled electrical interaction of fracturing rock with gases. Earth Planets Space 73, 90 (2021). https://doi.org/10.1186/s40623-021-01416-1
Received:
Accepted:
Published:
DOI: https://doi.org/10.1186/s40623-021-01416-1