
Abstract
Simulink is an example of a successful application of the paradigm of model-based development into industrial practice. Numerous companies create and maintain Simulink projects for modeling software-intensive embedded systems, aiming at early validation and automated code generation. However, Simulink projects are not as easily available as code-based ones, which profit from large publicly accessible open-source repositories, thus curbing empirical research. In this paper, we investigate a set of 1734 freely available Simulink models from 194 projects and analyze their suitability for empirical research. We analyze the projects considering (1) their development context, (2) their complexity in terms of size and organization within projects, and (3) their evolution over time. Our results show that there are both limitations and potentials for empirical research. On the one hand, some application domains dominate the development context, and there is a large number of models that can be considered toy examples of limited practical relevance. These often stem from an academic context, consist of only a few Simulink blocks, and are no longer (or have never been) under active development or maintenance. On the other hand, we found that a subset of the analyzed models is of considerable size and complexity. There are models comprising several thousands of blocks, some of them highly modularized by hierarchically organized Simulink subsystems. Likewise, some of the models expose an active maintenance span of several years, which indicates that they are used as primary development artifacts throughout a project’s lifecycle. According to a discussion of our results with a domain expert, many models can be considered mature enough for quality analysis purposes, and they expose characteristics that can be considered representative for industry-scale models. Thus, we are confident that a subset of the models is suitable for empirical research. More generally, using a publicly available model corpus or a dedicated subset enables researchers to replicate findings, publish subsequent studies, and use them for validation purposes. We publish our dataset for the sake of replicating our results and fostering future empirical research.
1 Introduction
Domain-specific models are the primary artifacts of model-based development of software-intensive systems [10, 66]. They serve as a central means for abstraction, facilitate analysis and simulation in the early stages of development, and provide a starting point for automated software production. Over the last two decades, Matlab/SimulinkFootnote 1 (in the sequel referred to as Simulink, for short) has emerged in various domains (e.g., automotive, avionics, industrial automation, medicine) as a de facto standard for the industrial model-based development of embedded systems [40].
However, Simulink projects and models created and maintained in an industrial context are usually not publicly available due to confidentiality agreements or license restrictions [2, 21, 51, 63]. Access to these models, in general, is limited, making research results hard if not impossible to replicate [7]. Publicly available projects do not reflect “real-world” models [6, 12, 13, 31, 33], which severely limits empirical research. Additionally, there are no commonly established benchmarks for assessing and comparing the effectiveness of new techniques and tools, and little is known about the usage of these models in practice. As a consequence, scientific insights into model-based development with Simulink are not nearly as deep and substantial as for classical code-based development, which highly profits from large publicly available open-source software repositories [22, 23, 25, 27, 35].
As a step to overcome this situation, we investigate a set of 1,734 freely available Simulink models from 194 projects, originally collected by Chowdhury et al. [15] and updated in terms of our study. The set comprises projects from Matlab CentralFootnote 2, SourceForgeFootnote 3, GitHubFootnote 4, and other web pages, as well as two smaller sets [9, 34]. We first analyze these projects and models concerning their basic characteristics, including (i) their development context, (ii) their complexity in terms of size and model organization within projects, and (iii) their evolution over time. Thereupon, we discuss the corpus’ potentials and limitations for empirical research.
We found that the projects and models comprised by the corpus are very heterogeneous concerning these characteristics. For (i), the projects stem from different origins and application domains. Most projects come from academia, and the distribution over application domains is skewed toward the energy sector. For (ii) and (iii), most of the projects are relatively small, exposing a short lifetime and hardly any collaborative development effort. Many of them are toy examples with limited practical relevance. However, some large-scale projects provide sophisticated Simulink models in a mature project structure, and the most long-living projects have a lifetime of several years of active development. Besides these limitations, our results show that there are also potentials for empirical research in the Simulink area. According to our results’ validation with a domain expert, many models expose several characteristics that can be considered representative of industry models, and are suitable for empirical research, the circumstances of which are discussed in this paper. The validity of this study may be threatened internally by a subjective classification of a project’s context and externally by the limited size of our data set.
We publish the updated corpusFootnote 5 for the sake of replicating our results and fostering future empirical research, which is the major impact we aim for with this paper.
2 Model-based development with Simulink
Simulink is a Matlab-based graphical programming environment for modeling, simulating, and analyzing multi-domain dynamical systems. Its primary interface is a graphical block diagramming tool and a customizable set of block libraries. Different kinds of blocks can be connected via ports to transmit outputs and receive inputs, thus yielding a dataflow-oriented model. Subsystems are special blocks that contain another Simulink diagram, thus enabling hierarchical modeling.
Figure 1 shows an example of a Simulink diagram (taken from [42]). The model shows a dual-clutch control of an automatic transmission system of a vehicle with two separate clutches. Blocks of various types are connected via signal lines. The four smaller blocks on the left side are inport blocks, which transport input values from the model’s context. One of them is the car’s current speed (VehSpd), which is further processed to compute the next gear shift. Also, there are three outport blocks (the same symbol as inports but with incoming signal lines), which transport output values of the model to its context. The four rectangular blocks shaded in gray are subsystems. The subsystems are part of the model, and the contained behavior can be displayed on request. The other shapes represent basic blocks (i.e., non-composite blocks). The pentagon at the top (\({trq\_dem}\)) is a goto block that transports its signal to some other part of the model (to a point deeper in one of the subsystems). The triangle (Tmax) is a gain block, which multiplies a signal with a constant. The black bar is a multiplexer block, which combines inputs with the same data type and complexity into a vector output. The rectangle with the label “[0,1]” is a saturation block, which produces an output signal that is the input signal’s value bounded to some upper and lower values.
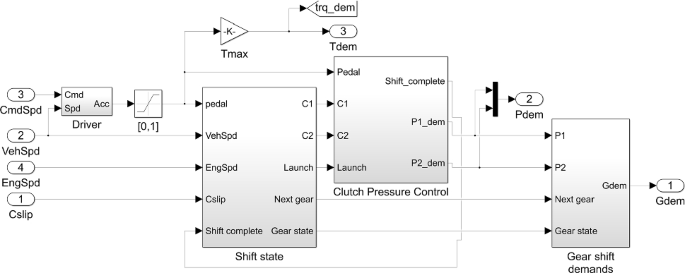
Example of a Simulink block diagram modeling the dual-clutch control of an automatic transmission system of a vehicle with two separate clutches [42]
The process of computing the states of a Simulink model at successive time steps is known as solving the model. This way, models can be simulated for the sake of validation or verification. Simulink comes with two classes of solvers: (1) Fixed-step solvers, as the name suggests, solve the model using the same step size from the beginning to the end of the simulation; (2) variable-step solvers vary the step size during the simulation. Within one simulation step, each block of the model updates its state and output values according to the specified behavior and this step’s input values.
Several add-on tools allow to model state-based systems (Stateflow), generate code from Simulink models (e.g., TargetLink, Embedded Coder), or to do formal verification and test case generation (e.g., Design Verifier).
3 Related work
3.1 Empirical studies on model characteristics
Several authors have investigated existing UML models regarding their characteristics and perception. Hebig et al. [28] released the currently largest set of open-source UML models mined from GitHub repositories (the Lindholmen dataset). They described content- and process-related characteristics of the UML models and the corresponding projects. In a follow-up study [30], they triangulated their results with qualitative surveys. They found that collaboration seems to be the most important motivation for using UML, and teams use UML during communication and planning of joint implementation efforts. Störrle analyzed the impact of UML diagram size on the understanding of the diagrams [60]. He found a strong negative correlation between diagram size and modeler performance. He used in his experiments class diagrams, state charts, and sequence diagrams with a mean diagram size of 25 to 30 elements, which were smaller than the models found in the Lindholmen dataset [28].
Regarding works describing characteristics of Simulink models, Dajsuren et al. [18, 19] reported coupling and cohesion metrics they found in ten industrial Simulink models. They measured the inter-relation of subsystems as well as the inter-relation of blocks within subsystems. Stephan et al. [57] developed a taxonomy to describe Simulink model mutations. The mutations are organized by categories based on the types of model clones (Type 1, 2 or 3) they inject, and further broken down into mutation classes that resemble typical edit operations on Simulink models. In order to evaluate the representativeness of the edit operations, the taxonomy has been applied to three Simulink projects, two of them being publicly available. Although the work’s main aim was to establish a framework for evaluating model clone detectors, the taxonomy can be considered general enough to describe aspects of Simulink model evolution from a qualitative perspective. Kehrer et al. [37] defined Simulink model editing operations which have been used to study the evolution of a cruise control model. Balasubramaniam et al. [3] conducted an empirical study investigating the types and quantity of software changes in the context of embedded control systems. Insights are gained from two widely adopted open-source control software suites, namely ArduPilot and Paparazzi UAV. These are used to develop a code mutation framework mimicking typical evolution in control software. Later on, they apply this framework to explore the impact of software evolution on the behavior of three controllers designed with Simulink, focusing on the mismatches that arise between control models and the corresponding control software. Chowdhury et al. [15] reported on a large set of freely available Simulink models that they crawled from various sources on the Internet. They analyzed these models in terms of content and reported basic measures such as the number of blocks and connections. Their set is used in this paper as the basis for further analysis. Moreover, we update their corpus by collecting the latest project and model snapshots, and we extract additional meta-data from those projects hosted on GitHub to assess their evolutionary characteristics.
3.2 Relevance of open source models for empirical research
Conducting extensive empirical studies in modeling and model-based development can be challenging due to the lack of repositories with large numbers of freely accessible models. Badreddin et al. studied 20 free open-source software (FOSS) projects with high numbers of commits without finding UML and concluded that it is barely used in FOSS [2]. Similarly, Ding et al. found only 19 projects with UML when manually studying 2,000 FOSS projects from popular FOSS repositories [21].
Most empirical studies on modeling in practice are case studies analyzing limited sets of models in specific contexts (e.g., [11, 26, 32, 43, 64]) or qualitative studies including interviews and surveys (e.g., [1, 44, 49]). Some studies approach the use of models in FOSS from a quantitative perspective, studying a large number and variety of projects. For example, to study the use of sketches, Chung et al. collected insights from 230 persons contributing to 40 FOSS projects [16]. Langer et al. studied the lifespan of 121 enterprise architect models in FOSS projects [39]. Collections of models used for experimental evaluations of model-based development tools can be found, e.g., in [29, 47] .
Some authors created datasets of Simulink models as benchmarks. For example, Bourbouh et al. [8] compiled a set of 77 Stateflow models to demonstrate the effectiveness of their tool. Similarly, Sanchez et al. [52] downloaded 70 Simulink models larger than 1MB from GitHub. Another benchmark of Simulink models was created as part of the Applied Verification for Continuous and Hybrid Systems (ARCH) workshop [24]. This benchmark offers six models in four projects used as study objects in a competition to solve a range of general problems (e.g., falsification or model checking).
Due to the lack of publicly available models, most experimental evaluations of tools rely on models that have been synthetically created using a dedicated model generator [45, 46, 53,54,55, 61]. Specifically, there is a line of research on the generation of realistic models conducted by Yazdi et al. [69,70,71,72]. The basic idea is to analyze model histories to learn statistical properties of model editing sequences, which are then used to configure a model generator that aims to generate realistic models by simulating such editing sequences.
Stol and Ali Babar performed a systematic literature review on empirical studies in FOSS [58]. Based on their observation of the analyzed studies’ low methodological quality, they proposed a guideline for conducting empirical studies in FOSS projects. In the guideline, they emphasized the importance of reporting the characteristics of the analyzed sample: “Such details can include: the size of the FOSS software (expressed as lines of code), size of community (expressed as the number of active and inactive participants), and the domain of the FOSS software (e.g., operating systems, desktop software, infrastructural such as web servers).” In our paper, we augment the meta-data of models with information about content, project context, and process context. This information allows researchers to derive and justify suitable samples for their research.
In code-based development, a large research community focuses on analyzing [22, 23, 25, 27, 35], and building [62] FOSS repositories, especially in the context of platforms with social features (e.g., GitHub) [17, 36]. However, models known from model-based development, including UML, Simulink and other domain-specific kinds of models, have not yet made it into typical research on mining software repositories.
4 Study design
4.1 Research objective
Our research aims at understanding the characteristics of publicly available Simulink models to assess their potential for empirical research. We characterize these models according to three perspectives: context, size, and evolution. We selected these perspectives because we found indications in the literature that those perspectives should be considered when conducting empirical studies. For example, the ACM SIGSOFT Empirical Standards [50] lists “describes the context of the case in rich detail” as an essential part of any case study or action research study. Baltes and Ralph [4] argue that representativeness of corpora can be improved by “(1) Including artifacts from diverse domains (e.g., aerospace, finance, personal computing, robotics). [...] (3) Making the corpus large enough to support heterogeneity sampling and bootstrapping. (4) Attempting to match the parameters we can discern [...]”. Moreover, we considered existing studies on model characteristics (see Sect. 3.1) and found that these consistently report the context of the analyzed models, size and complexity [19, 60], and evolution [28].
Therefore, we analyzed the mentioned three perspectives as formulated by the following research questions.
RQ1: In which context are Simulink projects created?
Information regarding the project context is a necessary prerequisite to assess the external validity of any future empirical research based on our Simulink project corpus. For example, the validity of research results might be limited to dedicated application domains.
RQ2: What is the size of the Simulink models and how are they organized within their defining projects?
The primary motivation for assessing the size of models is that future benchmarks or experiments being based on our corpus might require models that exceed a certain degree of complexity and are not just toy models. In particular, we are interested in whether our corpus comprises industry-scale models useful for further research.
RQ3: How do Simulink projects and their models evolve over time?
The motivation to understand how Simulink projects and models evolve is to assess their suitability for learning from their development history. Thus, we are particularly interested in whether there are any projects under active development or maintenance for a long time.
The research objective is summarized using a Goal Question Metric [5] model, illustrated in Fig. 2. Metrics and respective extraction methods will be presented in detail in the remainder of this section.

Goal Question Metric model of the research objective
4.2 Study subjects
This study can be classified as a quantitative and qualitative non-probability sample study [59]. Our sample is based on the largest [14] set of publicly available Simulink models,Footnote 6 collected by Chowdhury et al. [15]. The set by Chowdhury et al. comprises a smaller Simulink model collection [34], a Stateflow model collection by the CoCo-Sim-Team [9], and many other projects from Matlab Central, SourceForge, GitHub, and other sources such as web sites of university projects. Although critical open-source repository sites could have been missed, the set by Chowdhury et al. covers a wide range of sources. Instead of using the provided dataset as it is, we re-collected a current snapshot in August 2020Footnote 7 consisting of all constituent Simulink models based on the information provided in the meta-data of the corpus of Chowdhury et al. The main motivation for this new snapshot arises from several inconsistencies we found between the actual corpus and the results presented in [15]. According to personal correspondence with the authors, these inconsistencies may originate from only a subset of the entire corpus models being used in their study. For many projects, the newer snapshot also provided updated models and a richer model evolution history for answering RQ3.
We collected the Simulink projects and models of our updated corpus using the project URLs provided in the original corpus’ meta-data. Out of the 205 projects listed in the meta-data, 204 mention a URL. We visited these 204 web pages and found 193 to be still online. Out of the remaining 11 projects, we were able to find one additional project in the original dataset. In sum, we could thus analyze 194 projects comprising a total of 1,736 Simulink models. Two of these models are invalid and cannot be opened by Matlab Simulink, which reduces the number of actually analyzable models to 1,734.
Our corpus comprising all the projects and models used in this study, including the respective meta-data, is available in our replication package.
4.3 Data analysis
4.3.1 RQ1: Project context
To get a basic understanding of the context in which a Simulink project has been created, we classify each project with respect to the following dimensions:
Origin: We use the categories academia, industry, and Mathworks to classify the origin of a project. The categorization is determined based on the affiliations of the developers associated with the projects. Although Mathworks’ modeling projects might also be classified as industry projects, we assume that Mathworks developers do not represent typical “end-users” of Simulink from industry, which is why we differentiate among the two.
Application domain: We use the domains energy, electronics, automotive, avionics, robotics, domain independent, and other to classify the projects with respect to their application domain. Domain-independent projects commonly encompass tools (e.g., Simulink analyzers, diagram layout managers or general toolboxes). These projects are assumed to be applicable in any domain.
Both classifications were performed manually by four researchers based on multiple sources of information. Besides the project data itself and the project’s web site, a web search was performed to gather additional information like developer affiliation or associated scientific publications. Concerning the list of possible application domains, we first used the classification scheme of [65], which comprises eight application domains. We revised this initial classification scheme during our analysis, as some of the analyzed projects did not fit into that scheme and some domains were not represented by a single project. We ended up reusing their domains automotive, avionics, and “unclear”. Newly created domains were decided upon together and were added if a project would not fit into another domain: energy, electronics, domain-independent, robotics, military, biology, wearable. The domains railway and automation were adjusted to transport and home automation. The domains finance, health care, public, and telecommunication were not used in our classification. To mitigate classification errors, a consensus needed to be reached among the four researchers, which was achieved through iterative discussions. Without a consensus, no useful project description available, or when a project domain remains unclear, we used the categories unclear and not enough information for domain and origin, respectively.
Traceability to a scientific publication: Moreover, particularly for those projects originating from an academic context, we are interested in whether there is a scientific publication associated with the project. Such publications may be useful for additional research as they provide a more detailed context of a project and its models. It also gives an insight into the scientific diligence of the academic work.
Solver mode: The usage of a fixed-step solver might indicate that a model is used for code generation; otherwise, the model may only be used for simulation or other abstract purposes. If the model state is changed in fixed time steps, code generation for hardware on embedded systems as a deployment target is possible. The solver mode can be automatically extracted using the Simulink API.
Code generation using a standard code generator: In addition to the extraction of the solver mode, we searched for TargetLink, and Embedded Coder traces in the models, as these are the two most commonly used code generators in model-driven development with Simulink.
4.3.2 RQ2: size and organization of Simulink models
To characterize the size and complexity of the Simulink models and their organization within projects, we use a collection of standard Simulink model and complexity metrics from Olszewska et al. [48]. We collect and report measurements on a model level and on a project level by aggregating the measurements from a project’s models. Our Matlab and Python scripts used for computation of all the metrics are published on Figshare.Footnote 8
The number of models per projects helps to judge the projects’ overall size. The number of blocks further helps in assessing the size of the models as well as, in an aggregated manner, the magnitude of the projects (i.e., if projects consist of multiple small models or fewer large ones). We include masked subsystems in the calculation of the number of blocks. The number of different block types used in a model represents the modeling diversity. When aggregated, this metric serves to judge and compare the modeling diversity on a project level. Further, the comparison of model and project block diversity yields insights into how the different models within projects are modularized, i.e., if the models of a project contain similar blocks or not. The number of signal lines represents the connectivity within the models, demonstrating the complexity of interaction between different functional blocks. This metric is also analyzed regarding the number of blocks to examine if there is a correlation. The number of subsystems characterizes a model from an architectural point of view and gives a hint on its modularization.
To assess the complexity of the models in our corpus, we use several complexity metrics that have been proposed by Olszewska et al. [48]. In their work, the authors have adapted several well-known code complexity metrics to Simulink. Cyclomatic Complexity was first introduced by McCabe [41] and assesses a program’s complexity by counting the independent paths of program flow. Olszewska et al. adapt this for Simulink by mapping conditional statements of C to corresponding blocks in Simulink.
The Halstead metrics are another set of complexity metrics. For our study, we measure the Halstead difficulty, which is calculated by the following formula:
where \(n_1\) is the number of distinct Simulink block types, \(n_2\) is the number of distinct input signals, and \(N_2\) is the total number of input and output signals [48].
The Henry–Kafura Information Flow defines a subsystem’s complexity based on the fan-in and fan-out of information flow for that subsystem. It is calculated as:
where size is the number of contained blocks (including subsystem blocks), fanIn and fanOut represent the number of afferent and efferent blocks of a subsystem. [48].
As last complexity metric, we calculate Card and Glass’s System Complexity. System Complexity adds up two sub-metrics: structural complexity and data complexity (\(SC = {StructC} + {DataC}\)). Structural complexity is defined as the mean of squared values of fan-out for all subsystems (n):
Data complexity is defined as a function that is directly dependent on the number of input and output signals (\(S_i\)) and inversely dependent on the number of fan-outs in the module:
In addition to size and complexity, we assess the file format of the model. This information originates from the default file format of Simulink models changing from .mdl to .slx-extensions with the second annual release of Simulink in 2012. The file format may be necessary for tool and organization compatibility across versions. Finally, we establish any peculiarities to be observed between the manually identified domains of projects (e.g., if industry projects differ from academic ones). Additionally, the identified industries themselves are analyzed concerning project and model structure.
4.3.3 RQ3: project and model evolution
We use meta-data extracted from a version control system to get an overview of how Simulink projects and models evolve, as it is customary in the field of software repository mining [22, 23]. We use a subset of our corpus’ projects hosted on GitHub. We analyze only this subset as we can easily access the commit history of these Git projectsFootnote 9. On the contrary, the commit history is not provided for the other projects, thus excluded here. The GitHub subset comprises 35 projects containing 579 models, accounting for 18 % of all projects and 33 % of all models of the entire corpus.
On the project level, the total number of commits assesses the project’s general development activity. In contrast, the ratio of merge commits to total commits and the number of authors serve as indicators of how the development is performed collaboratively. By extracting the project lifetime, we determine whether there are any long-living projects. We are particularly interested in whether any projects are actively maintained over time or whether they are just stored in the repository. Therefore, the lifetime comprises the time between the first and the last commit. Further, the commits per day provide a first indicator of how frequently the projects are updated. Since the total commits extracted from GitHub refer to all the project files, we are additionally interested in the proportion of model commits that change at least one Simulink model in the project. Similarly, regarding the total number of project authors, we are also interested in the authors’ proportion that changed at least one model file (model authors) during a project’s lifetime.
On the model level, the number of updates reports the number of commits on the model file. The number of authors per model reports the number of different committers that have modified this model at least once. The lifetime in days encompasses the time between the first and the last commit that changed the model. In contrast, the lifetime in % denotes the model’s relative lifetime concerning the overall lifetime of the project that comprises the model. We compute all models’ lifetime according to the model files’ inherent meta-data in addition to these metrics extracted from GitHub meta-data. This information provides a date for the first creation date and the last modification used to calculate the lifetime in days of all models.
Finally, we are interested in how the development workload, particularly the number of model modifications, is distributed over the lifetime of projects and models. Therefore, we calculate the distribution of project commits, the distribution of model commits, and the ratio of models that are under active development over the lifetime of a project. We assume a model to be under active development between the first and last commit of a model.
5 Study results
In this section, we report the results of the analyses detailed in Sect. 4.3, structured by our research questions RQ1–RQ3.
5.1 RQ1: Project context
Origin and traceability to a scientific publication: As illustrated in Fig. 3, of 194 projects, 113 (58 %) originate from an academic context, 34 (17 %) are provided by Mathworks, and 25 (13 %) projects are from industry. We could not classify the origin of the remaining 22 (12 %) projects due to missing information. We measured the agreement of the manual classification by computing Krippendorff’s alpha [38] to be 0.85, which is reliable (Alpha values \(\ge 0.80\) are considered reliable). Further, we found links to scientific publications for 26 (13 %) projects. Of these projects, 18 (9 %) originate from an academic context, while the remaining eight (4 %) projects are not classified concerning their context.

Origin of the projects comprised by our corpus
Application domains: Figure 4 shows the results of our domain classification. Most projects represent applications in the energy sector: 52 (27 %). The second-largest domain is electronics, with 47 (24 %) projects. These two domains make up more than half of all projects. 36 (19 %) of the models are classified as “domain-independent”—e.g., used to demonstrate a Simulink tool. The avionics, robotics, and automotive domain together make up another 21 %.
The remaining categories are summarized as “other” in Fig. 4. The “other” categories comprise 18 projects (9 %): six of which we could not classify at all and are thus “unclear”, five telecommunication projects, and two audio projects. The remaining domains only contribute a single project to the corpus: biology, home automation, wearable, transportation, and military.
A Krippendorff’s alpha of 0.86 was computed for the researchers’ inter-rater agreement for domain classification, which, analogously to the original classification, can be considered reliable.

Application domains in which the projects have been developed
Solver mode and code generation: In our corpus, 576 models (33 %) use a fixed-step solver mode, while the remaining 1,158 (67 %) models apply a variable-step solver mode. Therefore, with two-thirds of the models, the majority of models use variable-step solvers. When aggregating this to the project-level, there are 119 projects (61 %) that exclusively contain models applying a variable-step solver and 28 projects (14 %) use fixed-step solvers only. Another 47 projects (24 %) exhibit a mixture of both. Surprisingly, none of the models uses one of the two most widely established code generators, TargetLink,Footnote 10 and Embedded Coder.Footnote 11

5.2 RQ2: model sizes and project organization
Overall project comparison: Table 1 shows the different metrics on the project and model level. On the project level, all metrics are aggregated for all models in each project. The model-level metrics are calculated without relation to the projects.
The standard deviation is much larger for all metrics than the mean values (except for the number of different block types), which shows the diverse range of projects and models. Further, for these metrics, the median is significantly smaller than the mean value. Therefore, the metric values are rather small for most models and projects, while some exceptions are much larger than the median accounts. Some of the models are even empty, in the sense that they do not contain a single line or block. Models without any signal lines are usually library models, which are merely a collection of different types of blocks. In contrast, empty models might indicate “orphan models” or models that are not yet under active development.
The number of models per project varies substantially. Ninety-eight projects (50.5 %) contain only one model. The five largest projects contain 42 % of all models. Overall, no predominant trend is evident concerning the number of blocks, neither per model nor per project.

The 25 most common block types according to the number of models they are used in
The number of signal lines also varies substantially between projects and models. Sixty-eight library models contain only blocks but no signal lines. Additionally, some model files contain just a single high-level subsystem, which is a reference to another model in the project. On the other hand, 450 models show high connectivity with equally as many or more signal lines than blocks. Apart from these two extremes, there is no common scheme in the correlation of signal lines and blocks. This phenomenon is also apparent when analyzing the average signal lines per block over all models, which amounts to \(0.82\,\pm \,1.52\). One may expect models to contain more signal lines than blocks, in general. However, many models are library models, one signal line can connect more than two blocks, and models can contain descriptions or comment blocks that are not connected to other blocks.
As with the previously presented metrics, the number of subsystems per project and per model does not show any particular pattern. Again, some very large projects are causing the high maximum value and the high standard deviation.
Similarly, with all of the reported complexity metrics, the mean, median, and standard deviation distribution show the diversity of models and projects regarding their complexity. The large maximum values of the Cyclomatic Complexity originate from extensive library models from a drive-train simulation. In contrast to these extreme examples, 1088 models exhibit a minimal Cyclomatic Complexity of 1. The Halstead difficulty values are not as divergent and do not show prominent outliers. However, in addition to the median, the 957 models showing a complexity of 0 signify a large number of low complexity models. The Henry–Kafura Information Flow exhibits one radical outlier with the noted maximum value. The next lowest value amounts to just 13.000. This outlier originates from a demo model contained in a Mathworks tool collection. In contrast to this, there are 1366 models in the dataset with a Henry–Kafura Information Flow of 0. This divergence explains the reported values in the table. Regarding System Complexity, the shown maximum value is an exception in the dataset, with the next highest value amounting to just 178.
Diving deeper into the models’ contents, we can see that some block types are commonly used in most models. Figure 5 shows the 25 most commonly occurring block types with the number of models they are used. The most used type of block, being the subsystem, highlights the importance of modularization in Simulink projects. Unsurprisingly, in-, and outports, which provide the basic functionality to receive and send signals, are used in most models. The few projects not incorporating these blocks are not used to process data but mainly for simulations using generated signals as inputs and only producing some visualization in scope instead of outputting a signal.
In addition to the models’ contents, we analyze the file types of the models within the projects, with the majority of 107 projects (55 %) exclusively containing models with the older file type .mdl, 72 projects (37 %) only containing .slx-files and 15 (8 %) containing both. 40 % of the models with the newer .slx format has been created before 2012 when this file format was first introduced. While appearing counterintuitive, this finding indicates that these models were created in the previous .mdl format but were later transferred into the newer .slx format. This hypothesis is further supported by the fact that of these 40 % of .slx model files being created before 2012, 95 % were still under active development after introducing the new file format.
Comparison by origin This comparison analyzes how model size and organization differ between models from different origins, which we determined in Sect. 5.1. To that end, we group our measurements by the categories Academic, Mathworks, Industry, and No Information, comprising 460, 619, 309, and 346 models, respectively. We use boxplots [67] to illustrate these aggregated values; the orange line within a box represents the median, the size of the box is determined by the first and third quartile, and the whiskers represent the fifth and ninety-fifth percentile. Outliers are displayed as circles.
For most industry category projects, the number of models per project is much lower than in the other categories, as shown in Fig. 6a. Only the projects with no origin information are even smaller. The largest projects in terms of the number of models can be found in the Mathworks category.

Comparison of the different project origins w.r.t a the number of models per project, b the number of blocks per model, c the number of subsystems per model, and d the Cyclomatic Complexity per model
When comparing the model metrics based on the project’s origin, three metrics stand out and show a difference between origins. Figure 6b shows the comparison of origins regarding the number of blocks per model. For reasons of clarity, we cleaned the plot of outliers, i.e., models with more than 10,500 blocks. Therefore, there are eight models in the Mathworks category and three models in the industry and academic categories that are not displayed in the plot. These outliers consist of libraries and large simulation models. Models from the Mathworks category show the largest median, with 123 blocks per model, while the industry models show the largest distribution. While the academic category shows the most narrow distribution of the number of blocks per model, the category also exhibits the most outliers.
Figure 6c shows the subsystems per model for all origin categories. This plot is cleaned of outliers with more than 175 subsystems, accounting for one model each in the academic and industry categories. When considering the modularization of models in terms of the contained subsystems, models from the Mathworks category show the most usage of subsystems due to the high median, larger third quartile, and high density of outliers above the 95 percentile. However, there are more models with a larger number of subsystems in the industry category, while the majority of industry models use fewer subsystems than the Mathworks models. Models from academia are least modularized, with just 11 subsystems per model on average.
Lastly, Fig. 6d shows the Cyclomatic Complexity of models for the different categories. There are four industry models and one from academia not shown in the plot, with values larger than 210. Interestingly, all categories exhibit a median of 1, as in the overall comparison before. Still, the industry category contains the most complex models, with an average Cyclomatic Complexity of 30. The much larger ninety-fifth percentile also signifies this.
Comparison by application domain: We compare the models concerning their identified application domain from Sect. 5.1. The largest domain in terms of the number of models is the energy domain, with 354 models. The other domains split up as follows: 339 are domain-independent, 280 from electronics, 257 from avionics, 232 from robotics, 151 from several ’other’ domains, and 121 in the automotive domain.

Comparison of the different project domains w.r.t. a the number of models per project, b the number of blocks per model, c the number of subsystems per model, d the number of different block types per model, and e the Cyclomatic Complexity per model
Figure 7a shows the models’ distribution over the projects of the domains. Projects from avionics and robotics domains are the largest in terms of the number of models per project, with 17.1 and 16.6 models per project on average. The smallest projects originate from the electronics and energy domain, with 6.1 and 6.7 models per project on average. The extreme outlier in the energy domain is an extensive model of a wind turbine. Apart from the outliers and the ninety-fifth percentiles, the projects in all domains are rather small, with each of the third quartiles being under 15 models per project.
As in the preceding section, Fig. 7b shows the blocks per model for the different domains of the projects. This plot is again cleaned off the outliers above 10,500 blocks per model. Therefore not shown are five domain-independent projects, three from the robotics and automotive domains, two from energy, and one from avionics. Figure 7b shows that most automotive domain models are significantly larger than in the other domains.
Figure 7c shows the number of subsystems per model for the identified domains, excluding one outlier each from the automotive and energy domain. With the automotive domain models being the largest ones, they also show the highest amount of subsystems per model. Therefore, the models in the automotive domain show the highest degree of modularization. The energy domain exhibits the second largest number of subsystems in the models. Generally, the distribution of subsystems over the domains follows a similar trend as the number of blocks.
The number of different block types per model is shown in Fig. 7d. The automotive domain shows the most diversity in terms of the block types used in the models, with 29 unique block types per model on average. However, many highly diverse models belong to the energy domain, as signified by the ninety-fifth percentile and the outliers. The remaining domains are rather similar in their unique block types per model, exhibiting only minor differences.
Lastly, Fig. 7e shows the Cyclomatic Complexity of models for the domains. The plot is cleaned of values above 210, which relates to three models from the automotive and two from the energy domain. The previously identified trend holds in this respect as well, as the automotive domain is the most prominent featuring the most complex models. While all other domains exhibit a median of just 1, the automotive domain exhibits a value of 10. Further, all third quartiles are below 5; just the automotive domain exhibits a value of 66 for the third quartile.

5.3 RQ3: project and model evolution
As described in Sect. 4.3.3, we analyze the subset of projects hosted on GitHub to evaluate evolutionary aspects. In order to evaluate if this subset represents the characteristics of the whole corpus, we analyzed all metrics reported in Sect. 5.2 on this subset as well. While the GitHub subset is missing some of the most extensive projects, identified as outliers in Sect. 5.2, the overall metrics are comparable to those of the whole corpus. The lack of some of the largest projects especially reflects in the metrics for subsystems, Cyclomatic Complexity and System Complexity, where the GitHub subset shows smaller values on average. However, the most extensive projects are outliers of the entire corpus and therefore deviate from most corpus projects. Arguably, their lack in the GitHub subset does not harm its representativity.
Evolutionary data from the projects mentioned above can be seen in Table 2, while the models’ evolution characteristics are summarized in Table 3. Similar to the results of the static properties of RQ2 (see Sect. 5.2), these projects and models are highly diverse concerning their evolutionary characteristics, as the standard deviation is bigger than the mean for most metrics. For some metrics, the standard deviation is more than twice the mean value. Further, all metrics’ median values are lower than the respective mean values, which indicates that only a few projects are substantially more long-living, more frequently maintained, and have more authors.
Projects: Most projects show a rather small number of commits, as the median only amounts to 8 commits (see Table 2). The ratio of merges to all commits in the GitHub projects is even smaller; the median lies at 0 %, with 1.4 merge commits per project on average. Similarly, the number of people actively working on the projects is small, comprising only 2.7 authors on average. The project lifetimes vary greatly between zero days (1 commit only) and more than six years. About half of the projects show an active maintenance span which is less than 50 days. 44.2 % of the commits modify Simulink models, indicating that the models can indeed be considered as primary development artifacts of the projects. The model–author ratio further supports this: In most cases, all authors of a project also edit the model files, with the mean value being at 82.2 %.
Models: Table 3 shows that on average, a model is updated about two times after its initial creation. For most of the models, these modifications are performed by a single developer since, on average, 1.3 developers contribute to a model over its entire lifetime. The mean time span in which a model is under active development is about 204 days. On the contrary, most models have an active lifetime of only one day—indicated by the median. The relative time a model is actively developed presents a median and mean value of 1 % and 23.9 % of the entire project’s lifetime.
Additionally, we evaluated all models’ absolute lifetime by analyzing the Simulink model files, which expose their initial creation and last modification dates. The penultimate line of Table 3 summarizes lifetime characteristics obtained from Simulink files of 1,686 models in our corpus. For 48 of the models, the format of the dates was corrupted and not retrievable. In particular, it can be seen that the mean and median values differ significantly in comparison with the lifetime calculated for GitHub projects. Further, the most long-living model was under development for almost 20 years. This information might indicate that some models have been developed offline and were later committed and pushed to the central repository for the sake of distribution and archiving. Furthermore, others represented file hosting services like Mathworks and SourceForge started hosting files earlier than GitHub.

a Distribution of commits over a project’s lifetime. b the distribution of commits, that modify Simulink models over a project’s lifetime. c The distribution of committed Simulink modifications over a project’s lifetime. d The ratios of models under development over a project’s lifetime. Note that a model will be counted in every bin from its first commit till its last in (d)
Distribution of development workload over project lifetime Figure 8a shows the distribution of project commits over a project’s lifetime, averaged over all projects. As the median project lifetime is about 50 days, each bin represents five or more days for most projects. Apart from bursts of development activity at the beginning and the end of a project, a rather even distribution of project commits is observed. The burst in the first tenth of a project’s lifetime is dominating with 36 % of all commits falling into this initial period. A similar pattern can be seen in Fig. 8b, which depicts commits’ distribution, that modify a Simulink model, again, averaged over all projects.
From comparing Fig. 8a, b, we can conclude that the overall workload on models and the rest of the project are similarly distributed. A minor difference can be observed concerning the bursts at the beginning and the end of a project, where the first burst of development activity is even more distinct for model commits than for project commits.
Figure 8c shows a nearly identical graph to Fig. 8b, as it plots the distribution of committed Simulink model modifications over a project’s lifetime. The difference is that Fig. 8b counts a commit with at least one created or updated model, and Fig. 8b counts each created or updated model, individually. As the graphs are extremely similar, it follows that the average commit on one or more models over a project’s lifetime modifies the same amount of models.
Figure 8d shows the ratio of models under active development during a project’s lifetime, averaged over all projects. A model is counted in each bin that falls between its first commit and last commit: Suppose a model is created at the very start of the project and last modified just before the project’s half time, then it will be counted in the first four bins separately. It can be seen that 52 % of the models of the GitHub subset are created in the first 10 % of the project lifetime. At least half of these models were never modified again, as the second bin only holds 23 % of models that are under active development. Some models are created only in the last 10 % of a project’s lifetime. On average, more than 22 % of the models are under active development during the entire duration of a project. Again, this can be interpreted as an indicator that the models within a Simulink project can be considered primary development artifacts since there are no project phases in which the models are not edited.

6 Threats to validity
We discuss potential threats to our study results’ validity, using the scheme established by Wohlin et al. [68].
6.1 Internal validity
Threats to internal validity are related to our methodology’s potential systematic errors, most notably concerning the collected and analyzed data.
Some of the classifications for RQ1 (origin and application domain) have been done manually, which may be biased by the subjective assessment of individual researchers or by simply overlooking relevant information. To mitigate this bias, we formed a team of four researchers to rate any manual classification task results. Their inter-rater agreement was good, as reported in Sect. 5.1. If two or more researchers were unsure how to assess a project, we abstained from making a final yet potentially misleading decision and classified the project as unclear.
The reported quantitative measures are calculated using scripts that we developed as part of this study. We took several countermeasures to rule out potential errors in these calculations. For those metrics already reported in the study of Chowdhury et al. [15], which are based on a model corpus that overlaps with ours, we have checked the plausibility and were able to reproduce their results. Further, we used the Matlab/API to parse the Simulink models, which prevents errors introduced by other custom-built Simulink parsers. We checked the results of our scripts on sample models of the corpus to assure correctness. Since our automated check on TargetLink and Embedded Coder usage did not result in any findings, we used example models for code generation provided by Matlab Simulink also. Our scripts successfully detected indications of code generation in these models. For the evolutionary metrics extracted from GitHub, we used an established tool, namely PyDriller [56], to extract meta-data from the commit history.
Additionally, in our analysis, we focused only on the information that is provided directly in the Simulink models, as it is also done in other studies [14, 15, 19, 48]). However, Simulink models can also reference Matlab code and functions. Arguably, these are a part of the model, and most repositories do not contain just Simulink models. The analysis of Matlab code was out of the scope of our study and scripts. Our results may be affected by this threat if, for example, most of the complexity resides in the outsourced Matlab code instead of the Simulink model.
The information presented in this study is limited to the data available in the project repositories. To not miss anything, we performed manual inspection of the models in a open coding fashion [20] (cf. Sect. 4.3.1). However, if relevant information about the project is not reflected in the repositories or their meta-information, we may have missed it.
6.2 Construct validity
The construct validity concerns whether the study answers the posed research questions.
We investigated the projects and models curated in our corpus from three perspectives (context, size/organization, and evolution). However, the project and model characteristics explored for each of these perspectives are not meant to be comprehensive. Though we selected these characteristics based on existing guidelines for empirical research and related work, future empirical studies may aim for different characteristics that are not yet considered by our analysis.
Moreover, our classification scheme for RQ1 may be incomplete. However, the main reason that projects could not be assigned to a dedicated origin or application domain was missing information. No additional category arose during the discussion of the researchers who did the manual classification.
Regarding the evolution of projects, we rely on the commit history of GitHub. However, as with any repository, we do not have further information regarding subordinate processing of the models between commits or before the first commit. Thus, we cannot assess whether there is an underlying modeling process apart from the explicit repository commits. In particular, mainstream version control systems such as GitHub are file-based and work on a textual or binary representation of the managed artifacts, which is still considered an obstacle for the versioning of models. Thus, version control systems are not as integrated into the development process as it is the case for code-centric development.
6.3 External validity
The external validity pertains to the question to which extent our results are generalizable. Raw data used in our study are taken from a limited set of data sources, namely a publicly available corpus of Simulink models and according to meta-data extracted from the subset of GitHub projects for answering RQ3. We did not do any systematic mining of open-source platforms (e.g., GitHub, SourceForge, BitBucket) beyond the projects included in the corpus. More specifically, we cannot claim that the analyzed corpus is statistically representative for the population of all existing Simulink projects (not even for the publicly available ones). The reader should have in mind that access to a comprehensive population list regarding all publicly available open-source Simulink projects and models is impossible; thus, we cannot infer that any accessible population is “representative”. However, the selected corpus provides the currently largest [14] and publicly available set of open source Simulink models from hosts like Mathworks, SourceForge, GitHub, and other web pages, and it even includes two other compiled corpora [9, 34]. This makes us confident that our results generalize to other open-source Simulink projects.
6.4 Conclusion validity
Conclusion validity pertains to the degree to which we can be sure that our conclusions are reasonable.
Due to the lack of reliable indicators, our study does not capture the intent behind creating a model, yielding a spectrum that heavily influences a model’s characteristics. On the one hand of this spectrum, there are simple example models that are deliberately kept as tiny as possible, e.g., for the sake of teaching. On the other hand of the spectrum, some models are created to model a real-world system or phenomenon, thus growing in size and complexity. Not distinguishing the models by their intent of creation may lead to the fact that a few outliers dominate many of the aggregated metrics presented in Table 1 at both ends of this spectrum. A classification of the intent could help eliminate such outliers and get a better picture of the models within each intent category. However, the aggregated values are not meant to characterize a specific class of models, but are calculated for characterizing our entire corpus.
Instead of the intent behind creating a model, we classified our projects and models according to their origin and application domain (see Fig. 4.3.1), which we use to get an overview of the characteristics in each of these categories (see Fig. 6 and Fig. 7). The results may be biased by intents not equally distributed over the models’ origins and application domains. For example, by chance, it might be the case that most of the models in one application domain are toy examples created for the sake of teaching, while the models in another domain are representing abstractions of real-world systems. Again, a classification by intent could help to rule out such undesired effects.
7 Discussion: suitability for empirical research
In this section, we discuss our findings together with the opinion of a Simulink expert. The expert, a partner in the context of a research project, has more than six years of experience in developing a quality assurance and optimization tools for Simulink models. In his work, he is confronted with many Simulink models and projects in various stages of development and from different application domains, including the automotive, automation, and lift domains. Please note that this consultation of an expert is not meant to be part of our research methodology as the expressiveness of just one expert’s opinion is somewhat limited. However, we included the expert to help us form our interpretation less subjectively and become more informed from a practitioner’s point of view. The talk with the expert started with presenting our results, followed by an open discussion on the project and model characteristics. The goal was to get an expert opinion on the general suitability of our corpus.
7.1 Suitability from the perspective of context
Although our corpus comprises Simulink projects of various origins, most of them have an academic background (58 %), while only 13 % originate from the industry. However, Fig. 6a–c shows that models from academic and industrial projects are not that different. Moreover, several different application domains are represented within our corpus, although the distribution is skewed toward the energy and electronics domains while others are missing (e.g., defense and automation).
According to the interviewed Simulink expert, the automotive domain seems to be underrepresented within our corpus. The expert was also surprised that we did not find any indication of code generation in our models. According to the practitioner experience, industrial models are usually used for generating code, which is eventually deployed on some hardware. The expert expected more models employing Embedded Coder. He assumes that TargetLink is not used in the corpus’ models because it is too expensive for open-source Simulink development.
In conclusion, our corpus does show some variation in terms of the project context. However, the corpus should not be used to compare characteristics between different domains since not all domains are covered, and the distribution is imbalanced. Additionally, the corpus is not suitable for studies on code generation since we found no evidence of code generation capabilities in the projects.
7.2 Suitability from the perspective of model size and organization
The Simulink expert reveals that most models in our corpus are considerably smaller (median of 70 blocks per model) than the average models from the industry (his estimation is a median of about 1,000 blocks per model). Typical industry models he analyzes consist of 200–2,000 blocks, only a few exceed 20,000 blocks. Thus, the largest models in our corpus are comparable to large models in the industry. The expert also confirmed that the distribution of block types in our corpus is similar to industrial models. He was surprised by the ratio of blocks to the subsystem. In his opinion, this relation indicates rather mature models in terms of modularization.
As presented in Sect. 5.2, the corpus’s diversity may be useful for testing and validating tools or automated approaches. The variety of models can cover a vast spectrum of test cases. Further, for studies with more specific requirements toward certain model characteristics, the corpus can be leveraged to produce a subset under the application needs (e.g., only large models, only models with many subsystems, exclusion of library models).
In terms of model size and organization, the corpus is well suited for testing and evaluating tools. The enclosed models exhibit a wide range of characteristics. The largest ones are comparable to industry models in terms of size, which is especially suitable for scalability and performance tests. On the other hand, large models still are a minority. Therefore, the corpus may not be suitable for applications with especially high prerequisites concerning the amount of data, e.g., machine-learning approaches.
7.3 Suitability from the perspective of project and model evolution
Our corpus provides limited opportunities to research projects and model evolution. Only 35 of the 194 projects are hosted on GitHub and offer the full project commit history. The results presented in Sect. 5.3 show that most projects are rather short-lived (<50 days) and are maintained by only one developer. A low number of merge commits also indicates little collaborative work available for analysis. However, a few projects in our corpus provide opportunities to study their evolution (e.g., in a case study research). For example, a NASA projectFootnote 12 is active for 2,273 days, a Mathworks Simulink tools projectFootnote 13 has 589 commits, and a driving chair simulatorFootnote 14 has 16 developers. Moreover, with, on average, 44 % of commits affecting models, the development of most projects indeed focuses on Simulink models.
Despite the cases mentioned above, we conclude that most projects are not suitable for empirical studies from an evolutionary perspective, confirmed by the Simulink expert. According to him, the evolution characteristics extracted from GitHub do not mirror the evolution of industrial Simulink projects. Typically, more developers are involved in a project, and the number of commits steadily increases towards the end of the project or a release.
8 Conclusions
In this paper, we collect and investigate a set of 1,734 freely available Simulink models from 194 projects and analyze their basic characteristics and suitability for empirical research. Our analyses regarding project context, size and organization, and evolution have shown that the projects and models are highly diverse in all aspects.
In principle, the models in our corpus are suitable for empirical research. Depending on the research goals, the subsets of the corpus might have to be selected. According to the Simulink expert, many corpus models can be considered mature enough for quality analysis purposes. Another use case might be unit testing, as many test cases can be covered with a diverse set of models. Generally, the usage of a publicly available model corpus or a subset enables researchers to replicate findings, publish subsequent studies, and use them for validation purposes.
For other kinds of empirical research, however, our corpus might be of limited value. Most industry models use code generation at some development stage, which is not represented in the corpus at all. Domain-wise, the corpus is skewed toward the energy sector. Run-time analysis with big models (e.g., 100k blocks or more) is possible with only a few models. Many projects are no longer under active development or maintenance, which may be necessary for testing up-to-date Simulink versions and newer features or consulting the developers involved in a Simulink project.
In the future, we want to investigate the models’ contents and their evolution. To understand their basic characteristics, most of our current metrics refer to the models’ size and basic organization within projects, which could be complemented by structural complexity metrics or even qualitative analyses in the future. The evolutionary characterization might be worth examining content-related characteristics such as structural differences between versions, complementing our high-level analyses of the development history. Acquiring a bigger set of Simulink projects from GitHub akin to the method used in [52] promises to gain more generalizable statements about RQ3.
Notes
References
Amorim, T., Vogelsang, A., Pudlitz, F., Gersing, P., Philipps, J.: Strategies and best practices for model-based systems engineering adoption in embedded systems industry. In: 41st International Conference on Software Engineering: Software Engineering in Practice (ICSE-SEIP), pp. 203–212 (2019)
Badreddin, O., Lethbridge, T.C., Elassar, M.: Modeling practices in open source software. In: E. Petrinja, G. Succi, N. El Ioini, A. Sillitti (eds.) Open Source Software: Quality Verification (OSS), pp. 127–139 (2013)
Balasubramaniam, B., Bagheri, H., Elbaum, S., Bradley, J.: Investigating controller evolution and divergence through mining and mutation. In: 2020 ACM/IEEE 11th International Conference on Cyber-Physical Systems (ICCPS), pp. 151–161. IEEE (2020)
Baltes, S., Ralph, P.: Sampling in software engineering research: A critical review and guidelines. arXiv preprint arXiv:2002.07764 (2020)
Basili, V.R., Caldiera, G., Rombach, D.H.: The Goal Question Metric Approach, vol. I. John Wiley & Sons, London (1994)
Bertram, V., Maoz, S., Ringert, J.O., Rumpe, B., von Wenckstern, M.: Component and connector views in practice: An experience report. In: ACM/IEEE 20th International Conference on Model Driven Engineering Languages and Systems (MODELS), pp. 167–177 (2017)
Boll, A., Kehrer, T.: On the replicability of experimental tool evaluations in model-based development. In: Babur, Ö., Denil, J., Vogel-Heuser, B. (eds.) Systems Modelling and Management, pp. 111–130. Springer International Publishing, Cham (2020)
Bourbouh, H., Garoche, P.L., Garion, C., Gurfinkel, A., Kahsai, T., Thirioux, X.: Automated analysis of stateflow models. In: 21st International Conference on Logic for Programming, Artificial Intelligence and Reasoning (LPAR 2017), pp. 144–161 (2017)
Bourbouh, H., Garoche, P.L., Loquen, T., Noulard, É., Pagetti, C.: CoCoSim, a code generation framework for control/command applications an overview of CoCoSim for multi-periodic discrete Simulink models. In: 10th European Congress on Embedded Real Time Software and Systems (ERTS 2020) (2020)
Brambilla, M., Cabot, J., Wimmer, M.: Model-driven software engineering in practice. Morgan & Claypool Publishers (2017)
Burden, H., Heldal, R., Whittle, J.: Comparing and contrasting model-driven engineering at three large companies. In: ACM/IEEE International Symposium on Empirical Software Engineering and Measurement (ESEM), pp. 1–10 (2014)
Chowdhury, S.A.: Understanding and improving cyber-physical system models and development tools. In: IEEE/ACM 40th International Conference on Software Engineering: Companion (ICSE-Companion), pp. 452–453 (2018)
Chowdhury, S.A., Mohian, S., Mehra, S., Gawsane, S., Johnson, T.T., Csallner, C.: Automatically finding bugs in a commercial cyber-physical system development tool chain with slforge. In: IEEE/ACM 40th International Conference on Software Engineering (ICSE), pp. 981–992 (2018)
Chowdhury, S.A., Shrestha, S.L., Johnson, T.T., Csallner, C.: SLEMI: Finding Simulink compiler bugs through equivalence modulo input (EMI). In: Proceedings of the ACM/IEEE 42nd International Conference on Software Engineering: Companion Proceedings, ICSE ’20, p. 1–4. Association for Computing Machinery, New York, NY, USA (2020)
Chowdhury, S.A., Varghese, L.S., Mohian, S., Johnson, T.T., Csallner, C.: A curated corpus of Simulink models for model-based empirical studies. In: IEEE/ACM 4th International Workshop on Software Engineering for Smart Cyber-Physical Systems (SEsCPS), pp. 45–48 (2018)
Chung, E., Jensen, C., Yatani, K., Kuechler, V., Truong, K.N.: Sketching and drawing in the design of open source software. In: IEEE Symposium on Visual Languages and Human-Centric Computing (VLHCC), pp. 195–202 (2010)
Cosentino, V., Cánovas Izquierdo, J.L., Cabot, J.: A systematic mapping study of software development with GitHub. IEEE Access 5, 7173–7192 (2017)
Dajsuren, Y.: On the design of an architecture framework and quality evaluation for automotive software systems. Ph.D. thesis, Department of Mathematics and Computer Science, Technische Universiteit Eindhoven (2015)
Dajsuren, Y., van den Brand, M.G., Serebrenik, A., Roubtsov, S.: Simulink models are also software: Modularity assessment. In: 9th International ACM Sigsoft Conference on Quality of Software Architectures (QoSA), pp. 99–106 (2013)
DeCuir-Gunby, J., Marshall, P., Mcculloch, A.: Developing and using a codebook for the analysis of interview data: An example from a professional development research project. Field Methods J. 23, 136–155 (2011)
Ding, W., Liang, P., Tang, A., v. Vliet, H., Shahin, M.: How do open source communities document software architecture: An exploratory survey. In: 19th International Conference on Engineering of Complex Computer Systems (ICECCS), pp. 136–145 (2014)
Dyer, R., Nguyen, H.A., Rajan, H., Nguyen, T.N.: Boa: Ultra-large-scale software repository and source-code mining. ACM Trans. Softw. Eng. Methodol. 25(1), 1–34 (2015)
D’Ambros, M., Gall, H., Lanza, M., Pinzger, M.: Analysing software repositories to understand software evolution. In: Software evolution, pp. 37–67. Springer (2008)
Ernst, G., Arcaini, P., Donze, A., Fainekos, G., Mathesen, L., Pedrielli, G., Yaghoubi, S., Yamagata, Y., Zhang, Z.: Arch-comp 2019 category report: Falsification. In: ARCH@ CPSIoTWeek, pp. 129–140 (2019)
de F. Farias, M.A., Novais, R., Júnior, M.C., da Silva Carvalho, L.P., Mendonça, M., Spínola, R.O.: A systematic mapping study on mining software repositories. In: 31st Annual ACM Symposium on Applied Computing, pp. 1472–1479 (2016)
Getir, S., Grunske, L., van Hoorn, A., Kehrer, T., Noller, Y., Tichy, M.: Supporting semi-automatic co-evolution of architecture and fault tree models. J. Syst. Softw. 142, 115–135 (2018)
Hassan, A.E.: The road ahead for mining software repositories. In: Frontiers of Software Maintenance, pp. 48–57. IEEE (2008)
Hebig, R., Ho-Quang, T., Chaudron, M.R.V., Robles, G., Fernández, M.A.: The quest for open source projects that use UML: mining GitHub. In: B. Baudry, B. Combemale (eds.) The ACM/IEEE 19th International Conference on Model Driven Engineering Languages and Systems (MODELS), pp. 173–183 (2016)
Herrmannsdoerfer, M., Ratiu, D., Wachsmuth, G.: Language evolution in practice: The history of GMF. In: International Conference on Software Language Engineering (SLE), pp. 3–22. Springer (2009)
Ho-Quang, T., Hebig, R., Robles, G., Chaudron, M.R., Fernandez, M.A.: Practices and perceptions of UML use in open source projects. In: IEEE/ACM 39th International Conference on Software Engineering: Software Engineering in Practice Track (ICSE-SEIP), pp. 203–212. IEEE (2017)
Hussain, A., Sher, H.A., Murtaza, A.F., Al-Haddad, K.: Improved restricted control set model predictive control (ircs-mpc) based maximum power point tracking of photovoltaic module. IEEE Access 7, 149,422–149,432 (2019)
Hutchinson, J., Whittle, J., Rouncefield, M., Kristoffersen, S.: Empirical assessment of MDE in industry. In: 33rd International Conference on Software Engineering (ICSE), pp. 471–480 (2011)
Jiang, Z., Wu, X., Dong, Z., Mu, M.: Optimal test case generation for Simulink models using slicing. In: IEEE International Conference on Software Quality, Reliability and Security Companion (QRS-C), pp. 363–369 (2017)
Jin, X., Deshmukh, J.V., Kapinski, J., Ueda, K., Butts, K.: Benchmarks for model transformations and conformance checking. In: 1st International Workshop on Applied Verification for Continuous and Hybrid Systems (ARCH) (2014)
Kagdi, H., Collard, M.L., Maletic, J.I.: A survey and taxonomy of approaches for mining software repositories in the context of software evolution. J. Softw. Maint. Evol. Res. Pract. 19(2), 77–131 (2007)
Kalliamvakou, E., Gousios, G., Blincoe, K., Singer, L., German, D.M., Damian, D.: The promises and perils of mining github. In: 11th Working Conference on Mining Software Repositories (MSR), pp. 92–101 (2014)
Kehrer, T., Kelter, U., Taentzer, G.: A rule-based approach to the semantic lifting of model differences in the context of model versioning. In: 26th IEEE/ACM International Conference on Automated Software Engineering, pp. 163–172. IEEE (2011)
Krippendorff, K.: Computing krippendorff’s alpha-reliability. University of Pennsylvania, Tech. rep (2011)
Langer, P., Mayerhofer, T., Wimmer, M., Kappel, G.: On the usage of UML: Initial results of analyzing open UML models. In: H.G. Fill, D. Karagiannis, U. Reimer (eds.) Modellierung, pp. 289–304 (2014)
Liggesmeyer, P., Trapp, M.: Trends in embedded software engineering. IEEE Softw. 26(3), 19–25 (2009)
McCabe, T.J.: A complexity measure. IEEE Transactions on software Engineering SE-2(4), 308–320 (1976)
Minh, V.T., Moustafa, A., Tamre, M.: Design and simulations of dual clutch transmission for hybrid electric vehicles. Int. J. Electr. Hybrid Veh. 9(4), 302–321 (2017)
Mohagheghi, P., Gilani, W., Stefanescu, A., Fernandez, M.A.: An empirical study of the state of the practice and acceptance of model-driven engineering in four industrial cases. Empir. Softw. Eng. 18(1), 89–116 (2012)
Mussbacher, G., Amyot, D., Breu, R., Bruel, J.M., Cheng, B.H.C., Collet, P., Combemale, B., France, R.B., Heldal, R., Hill, J., Kienzle, J., Schöttle, M., Steimann, F., Stikkolorum, D., Whittle, J.: The relevance of model-driven engineering thirty years from now. In: J. Dingel, W. Schulte, I. Ramos, S. Abrahão, E. Insfran (eds.) Model-Driven Engineering Languages and Systems (MODELS), pp. 183–200 (2014)
Nassar, N., Kosiol, J., Kehrer, T., Taentzer, G.: Generating large EMF models efficiently - A rule-based, configurable approach. In: Fundamental Approaches to Software Engineering, Lecture Notes in Computer Science, vol. 12076, pp. 224–244. Springer (2020)
Nguyen, H.L., Nassar, N., Kehrer, T., Grunske, L.: Mofuzz: A fuzzer suite for testing model-driven software engineering tools. In: 35th IEEE/ACM International Conference on Automated Software Engineering (ASE), pp. 1103–1115. IEEE (2020)
Ohrndorf, M., Pietsch, C., Kelter, U., Grunske, L., Kehrer, T.: History-based model repair recommendations. ACM Trans. Softw. Eng. Methodol. 30(2) (2021)
Olszewska, M., Dajsuren, Y., Altinger, H., Serebrenik, A., Waldén, M., van den Brand, M.G.: Tailoring complexity metrics for Simulink models. In: Proccedings of the 10th European Conference on Software Architecture Workshops, pp. 1–7. Association for Computing Machinery, New York, NY, United States (2016)
Petre, M.: UML in practice. In: International Conference on Software Engineering (ICSE), pp. 722–731 (2013)
Ralph, P., Baltes, S., Bianculli, D., Dittrich, Y., Felderer, M., et al.: ACM SIGSOFT empirical standards (2020)
Rao, A.C., Raouf, A., Dhadyalla, G., Pasupuleti, V.: Mutation testing based evaluation of formal verification tools. In: International Conference on Dependable Systems and Their Applications (DSA), pp. 1–7 (2017)
Sanchez, B., Zolotas, A., Rodriguez, H.H., Kolovos, D., Paige, R.: On-the-fly translation and execution of ocl-like queries on Simulink models. In: ACM/IEEE 22nd International Conference on Model Driven Engineering Languages and Systems (MODELS), pp. 205–215 (2019)
Schultheiß, A., Bittner, P.M., Kehrer, T., Thüm, T.: On the use of product-line variants as experimental subjects for clone-and-own research: a case study. In: Proceedings of the 24th ACM Conference on Systems and Software Product Line: Volume A, pp. 1–6 (2020)
Semeráth, O., Nagy, A.S., Varró, D.: A graph solver for the automated generation of consistent domain-specific models. In: 40th International Conference on Software Engineering (ICSE), pp. 969–980 (2018)
Sen, S., Baudry, B., Mottu, J.M.: Automatic model generation strategies for model transformation testing. In: International Conference on Theory and Practice of Model Transformations, pp. 148–164. Springer (2009)
Spadini, D., Aniche, M., Bacchelli, A.: Pydriller: Python framework for mining software repositories. In: 26th ACM Joint Meeting on European Software Engineering Conference and Symposium on the Foundations of Software Engineering (ESEC/FSE), pp. 908–911 (2018)
Stephan, M., Alalfi, M.H., Cordy, J.R.: Towards a taxonomy for simulink model mutations. In: 2014 IEEE Seventh International Conference on Software Testing, Verification and Validation Workshops, pp. 206–215 (2014)
Stol, K.J., Ali Babar, M.: Reporting empirical research in open source software: The state of practice. In: C. Boldyreff, K. Crowston, B. Lundell, A.I. Wasserman (eds.) Open Source Ecosystems: Diverse Communities Interacting, pp. 156–169 (2009)
Stol, K.J., Fitzgerald, B.: The abc of software engineering research. ACM Trans. Softw. Eng. Methodol. 27(3) (2018)
Störrle, H.: On the impact of size to the understanding of UML diagrams. Software and Systems Modeling (SoSyM 17(1), 115–134 (2018)
Svendsen, A., Haugen, Ø., Møller-Pedersen, B.: Synthesizing software models: generating train station models automatically. In: International SDL Forum, pp. 38–53. Springer (2011)
Tempero, E., Anslow, C., Dietrich, J., Han, T., Li, J., Lumpe, M., Melton, H., Noble, J.: The qualitas corpus: A curated collection of java code for empirical studies. In: 2010 Asia Pacific Software Engineering Conference, pp. 336–345 (2010). 10.1109/APSEC.2010.46
Tomita, T., Ishii, D., Murakami, T., Takeuchi, S., Aoki, T.: A scalable monte-carlo test-case generation tool for large and complex Simulink models. In: IEEE/ACM 11th International Workshop on Modelling in Software Engineering (MiSE), pp. 39–46 (2019)
Vogelsang, A.: Feature dependencies in automotive software systems: extent, awareness, and refactoring. J. Syst. Softw. 160, 1–15 (2020)
Vogelsang, A., Eckhardt, J., Mendez, D., Berger, M.: Views on quality requirements in academia and practice: commonalities, differences, and context-dependent grey areas. Inf. Softw. Technol. 121, 106–253 (2020)
Völter, M., Stahl, T., Bettin, J., Haase, A., Helsen, S.: Model-Driven Software Development: Technology, Engineering, Management. John Wiley & Sons, London (2013)
Williamson, D.F., Parker, R.A., Kendrick, J.S.: The box plot: a simple visual method to interpret data. Ann. Intern. Med. 110(11), 916–921 (1989)
Wohlin, C., Runeson, P., Höst, M., Ohlsson, M.C., Regnell, B., Wesslén, A.: Experimentation in software engineering. Springer Science & Business Media (2012)
Yazdi, H.S., Angelis, L., Kehrer, T., Kelter, U.: A framework for capturing, statistically modeling and analyzing the evolution of software models. J. Syst. Softw. 118, 176–207 (2016)
Yazdi, H.S., Mirbolouki, M., Pietsch, P., Kehrer, T., Kelter, U.: Analysis and prediction of design model evolution using time series. In: International Conference on Advanced Information Systems Engineering, pp. 1–15. Springer (2014)
Yazdi, H.S., Pietsch, P., Kehrer, T., Kelter, U.: Statistical analysis of changes for synthesizing realistic test models. Software Engineering 2013, (2013)
Yazdi, H.S., Pietsch, P., Kehrer, T., Kelter, U.: Synthesizing realistic test models. Comput. Sci. Res. Dev. 30(3–4), 231–253 (2015)
Acknowledgements
This work has been supported by the German Ministry of Research and Education (BMBF) within project SimuComp (Simulink Architecture Comprehension and Analysis) under grant 01IS18091. Special thanks to Ferry Bachmann for helping us with his expert knowledge. We also would like to thank the anonymous reviewers for their critical reading and detailed feedback, which greatly helped to improve and clarify this manuscript.
Funding
Open Access funding enabled and organized by Projekt DEAL.
Author information
Authors and Affiliations
Corresponding author
Additional information
Communicated by Jeff Gray.
Publisher's Note
Springer Nature remains neutral with regard to jurisdictional claims in published maps and institutional affiliations.
Rights and permissions
Open Access This article is licensed under a Creative Commons Attribution 4.0 International License, which permits use, sharing, adaptation, distribution and reproduction in any medium or format, as long as you give appropriate credit to the original author(s) and the source, provide a link to the Creative Commons licence, and indicate if changes were made. The images or other third party material in this article are included in the article’s Creative Commons licence, unless indicated otherwise in a credit line to the material. If material is not included in the article’s Creative Commons licence and your intended use is not permitted by statutory regulation or exceeds the permitted use, you will need to obtain permission directly from the copyright holder. To view a copy of this licence, visit http://creativecommons.org/licenses/by/4.0/.
About this article

Cite this article
Boll, A., Brokhausen, F., Amorim, T. et al. Characteristics, potentials, and limitations of open-source Simulink projects for empirical research. Softw Syst Model 20, 2111–2130 (2021). https://doi.org/10.1007/s10270-021-00883-0
Received:
Revised:
Accepted:
Published:
Issue Date:
DOI: https://doi.org/10.1007/s10270-021-00883-0