
Abstract
This paper proposes a semantic framework for Business Model evaluation and its application to a real case study in the context of smart energy and sustainable mobility. It presents an ontology based representation of an original business model and examples of inferential rules for knowledge extraction and automatic population of the ontology. The real case study belongs to the GreenCharge European Project, that in these last years is proposing some original business models to promote sustainable e-mobility plans. An original OWL Ontology contains all relevant Business Model concepts referring to GreenCharge’s domain, including a semantic description of TestCards, survey results and inferential rules.
1 Introduction
A business model defines how value gets created and delivered by a company for customers. It is an organized way of laying out assumptions about key resources, partners and activities, value proposition, customer relationships, channels, customer segments, cost structures, and revenue streams. The business model concept was originally used to communicate complex business ideas to potential investors within a short time frame (Zott et al. 2011).
In the context of the Greencharge European project,Footnote 1 business models innovation and evaluation aim at maximizing value for all stakeholders, supporting cities and municipalities to accelerate the transition to zero emission/sustainable mobility. In fact an electric base mobility strategy is still an open issue in many regions (Dijk et al. 2013). The transition to sustainable and green mobility forces partners in the value network to take on new roles or to cooperate with new partners in the network (e.g., distribution system operators).
In this paper, we present a semantic framework for representation and automated evaluation of business models, with a real application to the research results of the Greencharge project. In particular, the innovative business models are inspired by ideas from the sharing economy, meaning they will show how to use and share private renewable energy sources (RES), public and private charging facilities and the batteries of parked EVs in ways that benefit all involved, financially and otherwise. Semantic technology allows for describing GreenCharge Business Models and the GreenCharge domain knowledge in a machine understandable format. The original contributions of our work include an ontology (Di Martino et al. 2020), which has been designed to represent innovative business models, namely exponential business models, and their evaluation methodology. Moreover, we demonstrate how an expert system can be used to automate the evaluation activity. In particular, processing a set of inferential rules, the result of knowledge extraction from the ontology can be used to enrich the ontology itself. The next section introduces background concepts and related work. Section 4 presents the exponential business models and a new evaluation methodology. We focus on the ontology description in Sect. 6. The automated evaluation process and the technology stack are addressed in Sect. 7. Finally, a demonstration of reasoning by simple inferential rules is discussed.
2 Related work
The use of semantic and knowledge based techniques has dramatically grown in recent years. As a result, many research works have been carried out towards the definition of models and instruments for building knowledge bases and to perform knowledge extraction and inferences on them. A widespread solution for developing a knowledge base in many academic works is represented by an OWL ontology. In particular, in Tang et al. (2018) authors propose a novel method, based OWL ontologies and SWRL rules, to address the problem of exchanging knowledge about the diagnosis of complex engineering systems.
Another relevant work is (El Ghosh et al. 2017), which defines an integrated strategy for modelling legal norms in the criminal domain to support the legal reasoning. An OWL-DL criminal domain ontology is realized from legal texts and some SWRL rules are used to build a rule-based decision support system for the Lebanese criminal domain.
In Di Martino et al. (2019) a semantic approach is used to develop in Prolog an Expert System, which is able to draw up the Data Protection Impact Assessment (DPIA) to evaluate the compliance of Business Models of public administration with the GDPR regulations. Recently, the technologies of the Semantic have been introduced also to foster innovation in context if Industry 4.0. In Fenza et al. (2020) semantic techniques have a promising role to represent manufacturing knowledge in a machine-interpretable way. It aims at enabling communications among heterogeneous industrial assets and at instantiating scenarios for monitoring overall equipment effectiveness (OEE).
Miranda et al. (2017) proposes an ontology-based model to support a wide range of scenarios where it is fundamental to model, organize and represent professional competences, to enable interoperability and co-operation among different and heterogeneous tools and, lastly, to execute queries and inference operations over these competences.
3 Background
3.1 Business model’s state of art
A Business Model can be defined as a unit of analysis to describe how the business of a firm works (Gassmann et al. 2013). The St. Gallen Business Model concept has been used. It is a simplification of Alexander Osterwalder’s concept described in Osterwalder (2004). This conceptualization consists of four dimensions: the Who, the What, the How, and the Value. A visualization of the St. Gallen business model concept can be seen in Fig. 1.

St. Gallen Business Model concept
The four dimensions which are combined to make up a business model are described below:
-
Who: every business model serves a certain customer group. This dimension is used as a central dimension in designing a new business model. The Who can be find by answering the question: "Who is the customer?”.
-
What: this dimension describes what is offered to the targeted customer (Who), or what the customer values. In the St. Gallen business model this dimension is referred to as the Value Proposition. It can be defined as a holistic view of a company’s assortment of products and services that are of value to the customer.
-
How: to build and distribute the value proposition, a firm has to master several processes and activities. These processes and activities, along with the involved resources and capabilities, plus their orchestration in the internal value chain form the third dimension in the St. Gallen business model.
-
Value: the fourth dimension is focused on the revenue of the business and explains why the business model is financially viable. It unifies aspects such as, for example, the cost structure and the applied revenue mechanisms. In this way it points to the elementary question of any firm: how make money in the business?
By identifying the target customer, the value proposition towards the customer, the value chain behind the creation of this value, and the revenue model that captures the value, the business model of a company becomes tangible and a common ground for re-thinking is achieved. The semantic approach to Business Models has the aim to create a reference model shared by all through the use of Ontologies. The most relevant semantic approach to BM in literature is the Business Model Ontology (BMO) (Osterwalder 2004). The BMO has the aim of "specifying” which concepts belong to a Business Model, and how they relate to each other without going into detail on how the business processes are performed or implemented.
3.2 OWL overview
The W3C has supported the development of OWL (Web Ontology Language) as language for defining Web-based ontologies. So, the W3C has defined it as "language for defining and instantiating Web ontologies, which adds semantics to documents available on the net”. In Fig. 2 the OWL elements are shown. In OWL we identify concepts with some classes, then we identify their individual and define properties that characterize them (McGuinness et al. 2004).

OWL elements
3.3 SWRL overview
The Semantic Web Rule Language (O’Connor 2009), acronym of SWRL, is a proposed language for the Semantic Web that can be used to express rules as well as logic, combining OWL DL or OWL Lite with a subset of the Rule Markup Language. The specification was submitted in May 2004 to the W3C by the National Research Council of Canada, Network Inference (since acquired by webMethods), and Stanford University in association with the Joint US/EU ad hoc Agent Markup Language Committee. The specification was based on an earlier proposal for an OWL rules language. In the latest versions of Protegé a SWRLTab has been introduced to write SWRL rules and apply them directly to the ontology. It provides a set of libraries that can be used in rules, including libraries to interoperate with XML documents, and spreadsheets, and libraries with mathematical, string, RDFS, and temporal operators. The SWRLTab has several software components, like, SWRL Editor which supports editing and saving of SWRL rules in an OWL ontology, SWRL Built-in Libraries which includes the core SWRL builtins defined in the SWRL Submission and built-ins for querying OWL ontology (Mohan and Arumugam 2011). Protegé users can write SWRL rules in a Human-Readable format, but the SWRLtab saves them in a more machine readable format.
Writing a SWRL rule is very simple: at the end of each rule there is the implication, which is preceded by all the properties that must be verified for the implication to be true. All terms that have a question mark in front of them are variables, for example with clause "Person(?p)” is possible to indicate any instance of the Person class. With the symbol "\(\bigwedge\)” is possible to define a new rule as a conjunction of two clauses (AND). Since SWRL rules are Horn clauses, isn’t possible to use NOT and OR clauses, just like in Prolog.
4 Exponential business models and its evaluation
An exponential business model looks at the same key areas as a traditional business model—but it has radically different goals. Most business models are linear, designed to increase profits or decrease costs by 10%. With an exponential business model, we think in terms of changes that are 10 times greater or lesser than today’s value (the common shorthand for this goal is simply “10X”). Taking your business model from 10% to 10X is not simply about scaling. Often, it requires a completely new way of looking at your business and the market it serves. Exponential business models require exponential imagination. Further, to 10X your business model, you must create value by leveraging technology in at least one key building block, such as the value proposition, channels, or key resources. Amazon, Facebook, Airbnb, Snap, Alibaba and Slack are just a handful of the companies that have successfully done so. Airbnb, for example, built a software platform to connect those in need of lodging to those who had it. By combining existing tech with an alternative value proposition, they liberated a huge, underused resource and created 10X value without owning a single room.
4.1 Design principles
There are five design principles that refer to the most important elements of a business model concerning what? (value proposition), for who? (customer segments), how? (key activities and network effects) and at what costs and revenues?
-
A.
Customer segments: solve a problem for the masses Technology is enabling organisations to reach entirely new markets in massive and viral ways. As the world’s population approaches 7.5 billion, companies and organizations with exponential business models can help close the gap between our growing population and the resources they need. Many companies start with one core offering to customers to serve one need—like Uber and personal transportation—then expand their services to meet other needs, like UberEATS or UberHEALTH.
-
B.
Value proposition: information-based digital services As companies digitise their products and services, they are not just creating new versions of their traditional offerings, they are creating entirely new marketplaces. Airbnb’s platform re-imagines short-term accommodations; Slack digitises collaboration and knowledge sharing; the consumer genetics firm 23andMe offers affordable DNA sequencing to anyone. Every business, regardless of industry, should be exploring how and what to digitise in their existing value proposition to not only serve existing customers better, but to potentially open up foundationally new exchanges of value.
-
C.
Key activities: ultra scalable processes, asset light technologies and algorithms Google is one of the best examples of a company built on an algorithm (to rank websites), that is then augmented by machine learning. StichFix, one of the fastest-growing on-demand retail companies, has a team of over 65 data scientists and uses algorithms to drive nearly every part of its business. It even has a well-respected public blog on data science. Amazon Web Services (AWS)—rented access to computing infrastructure—was launched in 2006. Ten years on, it contributed 56% of Amazon’s growth and is on target to be a $100 billion business in less than 5 years.
-
D.
Revenues and costs: capture of value in money terms A business model describes how a company delivers and captures value from customers. Without revenues no income for the company. Value can on the other hand also be created in non-monetary terms. In that case we speak of an organisation or non-profit model, instead of a business model.
-
E.
Marketplace: network effects Traditional business models are pipelines. Every link in the value chain adds value in a linear way. They do not scale very fast, because they are often asset heavy and must make a lot of marketing costs. They do not stimulate collaboration between all stakeholders, because the increased margin for one link in the chain goes at the cost of another. A pipeline business model does not maximise value for all stakeholders.
New collaborative business models of GreenCharge are multi-sided marketplaces, which create an ecosystem of stakeholders connected by an orchestrator. The eco-system can grow in an exponential way, because all stakeholders collaborate, make use of network effects, and maximize value. More customers will attract more producers of energy and the other way around. As a result, marketplace businesses can grow exponentially.
4.2 Business Models canvas
In Scholten and Bosma (2020) GreenCharge has defined an original business model canvas custom-made to design marketplace business models.

Business Model canvas
It is shown in Fig. 3. The different stakeholders are located in the corners of the canvas and the marketplace orchestrator in the middle. It shows the crucial elements of a business model: (1) customers segments (who?), (2) value propositions (what?), (3) key activities and assets (how?), (4) Cost and revenues (how much?) and (5) producer segments (who?). Marketplace business models create cross-side network effects by connecting customers to producers of energy and/or mobility solutions. At a marketplace more customers of, for example, shared electric cars, will attract more electric car sharing producers providers and vice versa. The orchestrator connects all stakeholders in the eco-system and creates friction exchanges of information and/or energy. As a result all stakeholders maximize the captured value. On top of that we created a separate business model for every single demonstrator.
4.3 Exponential Business Models’ evaluation
The business model evaluation process proposed here is an iterative process that contains 5 steps, as it is shown in Fig. 4.
-
1.
Vision, KPIs A first step involves the preparation of list of the Key Performance Indicators (KPIs), which are used to quantitatively assess the impact of business model operation with respect to the objectives of the specific case study.
-
2.
Business model version N A second step is about the design of the initial business model with the aid of workshops and relevant stakeholders.
-
3.
Designing test cards The third step consists in the preparation of test cards based on the StrategyzerFootnote 2 Test Cards.
Fig. 4 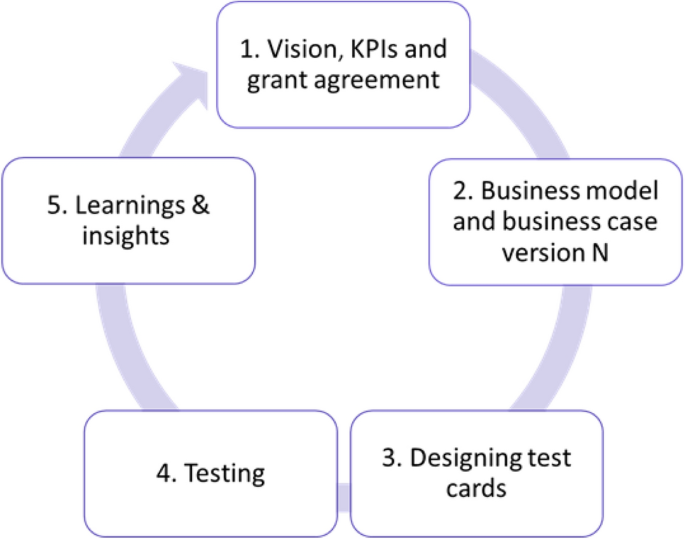
Business Model evaluation process
Fig. 5 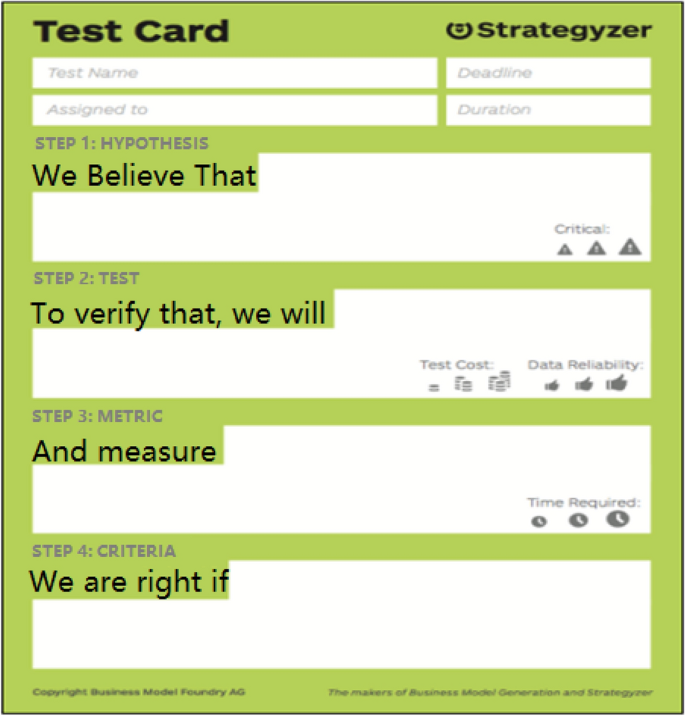
TestCard view


An example of TestCard is displayed in Fig. 5.
-
We believe That: What needs to be true for the business model to work? (hypothesis). Customers here can express their concerns, such as electric vehicle owners fear the anxiety of charge. To avoid this, the residents need a guaranteed SoC, while visitors are in need of booking options.
-
To verify That, we will: How are we going to test if that hypothesis is true or false? As example to verify the previous point, the Customers declare that they provide to carry out the tests, such as analyzing the data of the recharge and reservation systems, or the results of the surveys. What are we going to measure in order to validaThe TestCard are developed in cooperation with the partners involved in the demonstrators. By using these test cards, the demonstrators are forced to make their goals explicit. The following content is represented on the test cards: te the hypothesis?
-
We are right if: When is the test successful? What is the threshold for a positive result? From the results that you have the measurements, the Customers say they will be right if certain assumptions are true, for example, if 55% of all charging sessions of visitors booked.
4. Testing The business models will be tested according to the test cards as designed in the previous phase of the evaluation process.
5. Learnings and insights The learnings and insights from the first testing phase will be stored. The initial business models are analysed and evaluated based on the five principles for design of exponential business models. Based on this analysis results, revised business models are will be designed for each of the demonstrators. The most important elements of the revised business models are evaluated with the aid of test cards mentioned in second phase.
In order to evaluate an Exponential Business Model, data is collected automatically from the orchestrator every month. These data are calculated to determine the performance of the business model per indicator. These key performance indicators are based on the following five design principles of exponential business models. (1) Performance of Customer Segment is based on Numbers of Customers and Producers, (2) performance of Value proposition is based on ratio between Capital Investment Cost and Average Operating Revenue, (3) performance of Key Activities is based on ratio between Average Operating Revenue and Costs, (4) performance of Revenues and Costs is based on Average Earnings and Net Present Value for the orchestrator and Performance of Network Effects is based on Savings for Customer Segments and Producer Segments. An overview of link between exponential business model design principles and KPIs can be found in Table 1.
The KPIs to evaluate exponential business models refer to these five design principles. An exponential business model solves a problem for the masses, which can be measured by the number of customers and producers, that are served. An exponential business model delivers information-based digital services, which can be measured by the Ratio of Capital investment costs and Average operating revenue. For traditional pipeline business models this ratio is high (around 30%), because they often own the assets of (energy) production. For exponential business models this ratio is low (around 10%), because they do not own the (energy) assets. They only connect (energy) customers with (energy) producers with information-based services. An exponential business model has ultra-scalable processes and algorithms, which is measured by the Ratio of Average operating revenues and costs. The more a business model produces, the higher its gross margin, because the use of algorithms mainly leads to fixed costs and not to variable costs. An exponential business model captures its value creation for customers by revenues and costs, which is measured by earnings. Earnings is the resulting cash flow from the business model. An exponential business model generates network effects, which can be measured by savings per customer (and per producer) as a result of joining an exponential business model instead of a pipeline business model. These network effects create lower costs for customers (using energy) from an exponential business model in comparison to a pipeline business model, because they do not pay for the marketing. In an exponential business model marketing is done by customers themselves, because they recommend the use of the business model to other customers. The exponential business model gives an incentive to customers to attract other customers, which in turn attract more producers. The more producers and customers, the lower the costs of the service per customer and the higher the revenue of the service per producer.
5 GreenCharge’s project overview
The main objective of GreenCharge project is to encourage green mobility. The overall objective of GreenCharge is to demonstrate how technological solutions and associated business models can be integrated and deployed to overcome barriers to wide-scale adoption of EVs (Venticinque et al. 2019). So GreenCharge has defined the business models, technologies, and innovative guidelines for the development and efficient operation, in terms of cost and successful infrastructure of charging electric vehicles (EV) (Aversa et al. 2018).
GreenCharge’s consortium consists of sixteen partners sited in six European countries. They are listed in Fig. 6.
The project is coordinated by SINTEF and joins four universities and research institutes, one advice, eight partners in the sector, two entities public, and a global network of sustainable city authorities.

GreenCharge partners
GreenCharge has already defined the sustainable mobility plans (SUMP), and it is testing them in three pilot cities, which are Barcelona, Bremen and Oslo, evaluating the impact of the measures in these cities with the assessment methods promoted by CIVITAS. Together, these tests cover a wide range of factors: type of vehicle (scooters, cars, bicycles), ownership model (private, individual use shared), charging places (private homes, workplaces, public spaces, transportation hubs), energy management (using solar energy, load balancing at a charging station or inside a neighborhood, replacing the battery) and the charging options (booking, priority charging).
The “lesson learned” in these three cities will be documented in an easily understandable format, providing useful insights for the development of the SUMP in other cities. In fact, the project has been connected with a group of "uptake cities”, that will learn from the three pilot cities through site visits and an advanced webinar program. They are: San Sebastian, Burgas, Budapest, Krakow, Ploiesti, Porto, Stockholm, Thessaloniki, Edinburgh, Brno and Zagreb. The availability of an ontology provides not only a knowledge representation, but also allows for an automated evaluation by artificial intelligence-rule based-techniques.
A useful vocabulary of recurrent terms is listed in Table 2.
GreenCharge uses and extends the CIVITAS evaluation framework, including its KPIs. The GreenCharge consortium participates itself to the CIVITAS project, which aims to make transport within cities eco-friendly and more efficient. The subset of new KPIs introduced by the GreenCharge framework especially concerns the evaluation of both the economic and the environmental impact of e-mobility (Riedel et al. 2013).
Specific energy related KPIs are:
Charge flexibility is an example of KPIs that measures an EV driver’s attitude to an echo-friendly beahvior. The GreenCharge project supports a reservation-based model for charging electric vehicles. For each booking, the user must therefore define the time he plans to arrive at charge point, the time he plans to leave, the guessed status of charge at arrival time and the desired status of charge at departure time. Based on these input data the user may allow for a flexible charge of its vehicle by the smart energy management system of the charging station. In fact, if a time t is needed to charge an EV at the desired status of charge and the user declares that he has only the strictly necessary time available for recharging, optimizations to improve environmental impact would not be possible. On the contrary, if the user plan to leave after a time interval \(t + \varDelta T\), there would be room for optimizing the EV charge. Different strategies can be used for charge optimization, such as load shifting or power modulation in order to use as much self-produced energy as possible or the minimization of the power peak. Logically, the higher the \(\varDelta T\), the higher the charging Flexibility. Furthermore, if the user has enabled V2G, the vehicle, previously loaded with self-produced energy, could be used as a producer for another consumer appliance, further improving self-consumption and decreasing the environmental impact. The Charging Flexibility KPI is an index in [0, 1[ that is the higher the more the time interval in which the user declares he wants to load his EV is wider.
Self-consumption is another relevant KPIs that measures the percentage of energy produced by decentralized renewable energy sources that is consumed on side. It is defined as the ratio between the share of self-produced energy that is locally consumed and the total self-produced energy. It can be used to evaluate how effective is the energy management system or the echo friendly behavior of any user who owns a renewable energy sources, such as photo-voltaic panel.
For what concerns the activties of GreenCharge, and the evaluation illustrated in this paper, a person Green Behaviour is a behaviour which optimizes the KPIs illustrated above.
These KPIs will be semantically represented in Sect. 6.3, and utilized, for automated reasoning and evaluation, in the inferential rules presented in Sect. 7.2.
6 Business Model Ontology and its extension
The Business Model Ontology defines state of art of business model knowledge, which is extended to represent an exponential business model, while the GreenCharge ontology defines concepts related to the smart energy applications and instances in the business model domain to allow for reasoning on a specific case study.
6.1 Osterwalder’s Business Model Ontology
The semantic approach to Business Models has the aim to create a reference model shared by all through the use of Ontologies. The most relevant semantic approach to BM in literature is the Osterwalder’s Business Model Ontology. This ontology defines 9 main building block that are shown in Fig. 7. Building blocks include:

Osterwalder’s Business Model Ontology
-
Value_Proposition: defines an overall view of a company’s bundle of products and services that are of value to the customer.
-
Revenue_Stream: describes the way a company makes money through a variety of revenue flows (e.g., payment revenues or results that in a second step can bring in money).
-
Cost_Structure: describes a representation in money of all the means employed in the business model. These costs can be fixed or variable.
-
Key_Resource: describes the arrangement of resources that are necessary to create value for the customer.
-
Key_Activity: describes the arrangement of activity that are necessary to create value for the customer.
-
Key_Partner: describes a voluntarily initiated cooperative agreement between two or more companies in order to create value for the customer.
-
Channel: describes all means of getting in touch with the customer (e.g., website or social network).
-
Customers_Segment: describes the segment of customers a company wants to offer value to.
-
Customers_Relationship: describes the kind of link a company establishes between itself and the customer (e.g., communities, events, or newsletters).
6.2 Extension of Osterwalder’s Business Model Ontology
The Osterwalder’s BM Ontology has been extended to represent Exponential business models. The main view of Extension of Osterwalder’s BM Ontology is shown in Fig. 8, in which are circled in red all extended or new concepts.

Extension of Osterwalder’s Business Model Ontology
The class called BuildingBlock has been extended with all additional concepts used to describe the exponential business model, which are reported below:
-
Orchestrator: connects all stakeholders in the eco-system (in particular he can be linked to all producers and all customers of marketplace). A specific business can be evaluated exponential for an Orchestrator.
-
ProducersSegment: defines the segment of green energy producers.
-
Prosumer: defines an individual (consumer or producer) that owns some devices that deliver/consume energy.
The BusinessModel class defines a complete framework for describing a business model. In particular for this paper several frameworks have been used: the Osterwalder BMO, the Exponential Business Model EBM, the ValueChainBM, the MarketplaceBM and PipelineBM.
In order to report the state of the art of BM in this ontology, other important concepts have been defined, such as the BusinessModelCanvas, which is a strategic management and lean start-up model for developing new business models or documenting existing ones.
In the extension of Osterwalder’s BM Ontology we included a semantic description of TestCard and Survey, which are some tools used in the business model evaluation’s process (see Sect. 4.3). All fields of TestCard (Criteria, Requirements, test, etc.) become Data Property of the ontology as shown in Fig. 9.

TestCard property
Finally, the main object properties, which have been used to link concepts concerning business models, are showed in Fig. 10 and are described below:

Extended Business Model ontology ontology relationship
-
connects: specifies that an orchestrator can be connected to a specific customer or producer.
-
hasResident: defines that a specific city must have a specific customer as resident.
-
hasAssociationIn: specifies that a specific kind of money is associated to a specific location.
-
hasBuildingBlocks: specifies that a specific kind of business model is represented thought some specific building blocks.
-
hasLocation: specifies that a specific consumer or producer have a specific location, or that a specific KPI has been calculated with reference to that location.
-
hasWorkedIn: specifies that a specific consumer or producer has worked in a determinate time interval.
-
isExponentialFor: specifies that a specific business model is exponential for a specific orchestrator.
-
saveMoneyInPeriod: specifies that a specific consumer or producer saved money in a specific time interval.
6.3 Greencharge Ontology
The structure of the GreenCharge ontology is shown in Fig. 11.

GreenCharge Ontology implementation

GreenCharge individuals entities
The main concepts of the Ontology are the seven KPIs, defined in Sect. 3. These classes shown in Fig. 11 are related, by relationships, to other concepts of the Ontology, which we are going to describe in the following subsections.
We are now illustrating the main Entities of the GreenCharge application domain - besides the KPIs: Individual and Derived Entities, Device Models, and Recording Logs.
6.3.1 Individual entities
In Fig. 12, Individual_entity represents all real objects, both concrete and abstract ones, belonging to the GreenCharge application domain. Each entity is described by data properties and relationships. For example, data properties specify who is the owner of the individual EV (Electric Vehicle) or the amount of Kms traveled by a single instance of vehicle.
Some examples of entities are Charge_Point, Energy_Meter, Location, Price_List, Sensor and Tariff.
In general, instances of this class will contain all parameters and relationships that depend only on the individual, but the ontology defines also an abstract model for a device.
As sub-classes of individual_entity, some devices are also described through a reference to its associated Device_Model.
6.3.2 Device models
Device models are an abstraction of the real devices that have been installed at GreenCharge pilots and are used during trials. In Fig. 13 the Device_Model class, and its sub-classes, provide information about the models of the various devices handled in the GreenCharge project.
.

GreenCharge device models
6.3.3 Recording logs
Charging, production or energy consumption sessions are instead represented in the Recording_Log class. As it is shown in Fig. 14, individuals of its sub-class correspond to each energy exchange session. Sub-class are distinguished production, consumption and production/consumption concepts. A battery can both charge and supply energy.

GreenCharge recordings and logs
The reservation_booking instance is linked to the EV_user through the isPerformedBy relationship.
6.3.4 Derived entities
In Fig. 15, Derived_Entity is the last class of interest. The entities belonging to it are indirectly derived from the composition of other entities and represent the factors that have the greatest impact on the change of a business KPI. They are divided into costs, revenues and investments as well as other classes that relate to the recharging sessions and to the energy consumed or produced by a pool of producer/consumers.

GreenCharge derived entities implementation
6.3.5 Key performance indicators
In this section we will semantically describe the KPIs have been used to define the inferential rules presented in Sect. 7.
In particular, the relationships that have the Self Consumption KPI as their subject, are shown in detail in Fig. 16.
As it can be seen from Fig. 16, the KPI entity (placed in the center of the image) is linked to all its child classes by the has subclass relationship. Continuing to analyze the graph, in particular paying attention to the Self_Consumption node, we note that it has two entering arcs has_SelfConsumption from two classes, which are one the specialization of the other (Solar_Plant_Session is a specialization of Energy_Production). Continuing to walk the graph, Solar_Plant_Session is connected to other entities, the main ones are: Solar_Plant through the object property hasindividual and the TimeSeries entity through the relationship hasEnergyTimeSeries.
The TimeSeries entity, continuing, has an object property connection with the Time_Interval entity through the hasTimeInterval relationship which defines the start time of a single production session. Returning to the Solar_Plant, it is connected to the owner entity through the relationship: hasOwner which defines its owner. This series of relations will be used to infer a Data Property to an instance of the owner object which identifies its green behavior.

GreenCharge KPI self-consumption relationships
Regarding the Charging Flexibility KPI, however, the diagram in Fig. 17 is provided. Each KPi instance is connected to an instance EV_Charging Discharging_Session via the defined has_Charging_session object property. The instance of EV_Charging Discharging_Session is connected to an instance of Reservation_Booking via the is_referred_by relationship.

GreenCharge KPI charging flexibility relationships
The semantic definition of business related KPI:
-
Average_Operating_Costs
-
Average_Operating_Revenue
-
Total_Capital_Investment_Costs
-
Total_Operating_Costs
-
Total_Operating_Revenue
is now addressed.
Thy are linked to the location and to the time interval to which they refer through the relationships: has_Location and has_Time_Interval. Moreover, they are related to the individual costs/earnings of the various components of the GreenCharge ecosystem that have the same relationship to the same location and Time_Interval instance as it is shown in Fig. 18.

GreenCharge Business KPIs relationships
Finally, the GreenCharge ontology utilizes the following general concepts defined in Fig. 19.

General concepts
-
Money: defines all the knowledge concerning the economic factor to evaluate business model.
-
NumberOfActors: specifies stakeholders, including providers and customers involved in the business model.
-
Numeric: allows for defining all numeric parameters of the business model evaluation, including thresholds, ratios and any other values.
-
Owner: includes all kind of green owner, as an example cities, neighborhoods, energy producers or person using electric vehicles.
-
TimeInterval: defines all the knowledge concerning the temporal durations.
6.4 Ontology instances population by pervasive IoT monitoring
The data collected from the demonstrators of the GreenCharge project represent the information source for the population of the ontology with the individuals and related property values.
An advanced metering infrastructure (AMI) is used to collect data and enforce smart control to improve KPIs, optimizing the charge schedule and energy management. The same data are used to compute the parameters that are necessary to populate the ontology with those individuals, which represent specific numeric values, KPIs instances, recording logs, and human behaviour of each demonstrator. For example the measured energy consumption of user’s appliances and charging EVs, together with the measured energy production of photo-voltaic panel will populate the ontology as individuals of the TimeSeries class. In particular, each one as a specialized individual of the corresponding sub-class and Solar_Plant_Session.
We have developed a prototype of AMI for a smart microgrid by the CoSSmic project (Jiang et al. 2016). At a technical level the CoSSMic project has provided a low threshold technology, facilitating the emergence of CoSSMic neighbourhoods in a bottom-up manner while requiring minimal central support and resources. Furthermore, the open source softwareFootnote 3 has been designed to run on low cost hardware and the necessary communication with the devices and between households is based on existing communications infrastructure commonly available in buildings nowadays, such as wifi and Internet, complemented with a variety of lower level protocols for the integration of sensors and devices. Additional details are provided in Scialdone et al. (2017) and in Amato et al. (2016). A layered view of a neighbourhood is presented in Fig. 20.

Advanced metering infrastructure for data collection
The connection to the public grid is through a meter that measures the amount of energy consumed and produced by the households. Households are usually also connected to the Internet through gateways, enabling the communication between services and smart device (e.g., smart meters) implementing the IoT paradigm.
The gateway not only provides a communication channel to the Internet, but it also runs the software that allows for monitoring and smart controlling devices. In particular, in the GreenCharge project it represents a distributed data source. Finally, it also performs anonymisation and elaboration at the edge, computing derived measures that become themselves individuals of the ontology, such as the Self_Consumption and others (Venticinque and Nacchia 2019).
Example of collected data, which are used to populate the ontology with the individuals of the class Ev_Charging_Discharging_Session are listed in the Table 3.
Any reasoning on the ontology will extract knowledge from these kind of data modeled as elements of the ontology.
7 Automated reasoning for evaluating business models and green behaviour
In this section we demonstrate how it is possible to automatically evaluate—by means of an Inferential Engine performing automated reasoning over the defined Ontologies—the GreenCharge related business models described in Sect. 4 and to evaluate the smart and green behaviour of Prosumers participating in the business model or, more in general, operating in a smart energy neighborhood.
In Fig. 21 the workflow of the Inferential Engine is shown.

Inferential engine
The inferential engine takes in input the OWL ontology obtained merging the GreenCharge ontology and the Business Model Extended Ontology. Then, inferencing rules have been defined and expressed in Semantic Web Rule Language—SWRL (see Sect. 3).
The new inferred knowledge finally populates and enrich the BM and GC Ontologies with a set of OWL assertions inferred by the inferential engine.
In the following subsections we are describing two (top level) inference rules, performing: (a) evaluation of a Business Model as Exponential for an Orchestrator and (b) evaluation of green Prosumers’ behaviour.
7.1 Evaluating an exponential business model
This section will show an inference rule capable of inferring the exponential property of a business model for a specific orchestrator. Since the rule consists of many sub-rules, a top-down approach is used for its presentation. The structure of the rules can be graphically represented (Mei and Boley 2006), so a SWRL call graph is shown in Fig. 22. To easen understanding of call graph, all entities concerning business model are circled in blue, while all entities concerning GreenCharge are circled in green.

SWRL business rule call graph
In these rules are used three KPI business model oriented (see entities circled in green in Fig. 22).
To easen understanding of the inference rules and to relate its components with the elements of the Ontology, different colors are used to identify entities, instances and relationships within the inference rule. The color legend is reported below:
-
Blue: entities concerning Business Model ontology.
-
Cyan: properties concerning Business Model ontology.
-
Teal: individuals of business model ontology.
-
Green: entities concerning GreenCharge ontology.
-
Lime: properties concerning GreenCharge ontology.
-
Olive: individuals of GreenCharge ontology.
-
Black: generic individuals and concepts.
The natural language version of the top level rule is reported below:

The SWRL code that implements the previous rule using the concepts of the ontology has been defined as follows.

Much more complex is the sub-rule "isexponentialFor” that is reported below in natural language version:

The SWRL code that implements the previous rule using the concepts of the ontology has been defined below:

Figure 23 shows the inferential rule result directly observable by Protegé.

Inference produced by the final rule
This rule was an aggregation of several sub-rules. The first illustrated sub-rule is "hasNumberOfCustomersGreaterThan”, that is very similar to the rule "hasNumberOfProducersGreaterThan”. Its SWRL code has been defined as follows:

The explanation of the rule follows: if "bm” is an instance of the class BusinessModel and "numbCustomers” is an instance of the class NumberOfCustomers, the numeric value of this instances is extracted through the data property "hasNumericValue” and is inserted in a variable called "var”; so it is possible to compare the content of variable var with every numeric value, and if this value is greater than of 10000, is inferred that "bm” has a data property hasNumberOfCustomersGreaterThan(?bm, 10000)
The second illustrated sub-rule is "%RevenuesIncreaseWithAddCustomers”, that is very similar to rule "%RevenuesIncreaseWithAddProducers”. The related SWRL code follows:

The explanation of the rule is: if "bm” is an instance of the class BusinessModel, "numbCust” is an instance of the class NumberOfCustomers and "rev” is an instance of the class AverageOperatingRevenue, so is verified if rev has a proportional dependency with the numbCust; if all these condition are true, then is inferred that "bm” has a data property %RevenuesIncreaseWithAddCustomers(?bm, true).
The third sub-rule is "%CostRevDecreaseWithAddCustomers”, that is very similar to the rule "%CostRevDecreaseWithAddProducers”. The corresponding SWRL code follows:

The explanation of the rule is: if "bm” is an instance of the class BusinessModel, "numbCust” is an instance of the class NumberOfCustomers, "rat” is an instance of the class Ratio, "cost” is an instance of the class AverageOperatingCosts and "rev” is an instance of the class AverageOperatingRevenue, so is verified if rat has "cost” as numerator and "rev” as denominator, and if rat has an inversal dependency with the numbCust; if all these condition are true, then is inferred that "bm” has a data property %CostRevDecreaseWithAddConsumers(?bm, true).
The fourth illustrated sub-rule is "OpAvCostsLessThan OpAvRevenuesIn%”. Its SWRL code follows:

The explanation of the rule is: if "bm” is an instance of the class BusinessModel, "ts” is an instance of the class Threshold, "cost” is an instance of the class AverageOperatingCosts, "rev” is an instance of the class AverageOperatingRevenue, "location” is an instance of the class Locations and "time” is an instance of the class TimeIntervall, so is verified if "rev” and "cost” has the same location and the same time. The numeric values of instances "rev”, "cost”, and "ts” are extracted through the data property "hasNumericValue” and are inserted in some variable called "v1”, "v2” and "valTS”; so it is possible to calculate the "valTS” % of rev value, and if this value is less than cost value, is inferred that "bm” has a object property OpAvCostsLessThanOpAvRevenuesIn%(?bm, ?ts).
The fifth illustrated sub-rule is "connectsConsumersAndProducers”. Its SWRL code follows:

The explanation of the rule is: if "orchest” is an instance of the class Orchestrator, "customer” is an instance of the class Customer and "producer” is an instance of the class Customer, and is true that orchest connects all instance of customers and producers, so is inferred that "orchest” has a data property connectsConsumersAndProducers(?orchest, true). The Fig. 24 shows the inferential rule result directly observable by Protegé.

Inference produced by the rule connectsConsumersAndProducers
The illustrated sixth sub-rule is "saveMoney”, that is reported below in natural language version:

Its SWRL code follows:

Fig. 25 shows result of the inferential rule directly observable by Protegé.

Inference produced by the rule saveMoney
Finally the last illustrated sub-rule is "hasRevenuesGreaterThanCostsInPercentageIn%”. Its SWRL code follows:

The explanation of the rule is: if "cust” is an instance of the class Customer, "location” is an instance of the class Locations, "time” is an instance of the class TimeIntervall, "rev” is an instance of the class AverageOperatingRevenue, "cost” is an instance of the class TotalCapitalInvestmentCosts and "ts” is an instance of the class Threshold, so is verified if "rev” and "cost” has the same location and the same time, and if "cust” has worked in this same time and in this same location. The numeric values of instances "rev”, "cost”, and "ts” are extracted through the data property "hasNumericValue” and are inserted in some variable called "v1”, "v2” and "valTS”; so it is possible to calculate the "valTS” % of cost value, and if this value is greater than rev value, is inferred that "cust” has a object property hasRevenuesGreaterThanCostsIn%(?cust, ?ts).
7.2 Inferring green attitude of people’s behaviors
This section will show inference rules capable of inferring an echo-friendly behavior of a set of consumers and producers belonging to an energy smart neighborhood. By "Green” consumer or producer we mean a subset of users who apply a series of behaviors aimed at reducing environmental impact and CO2 emissions.
As you can see in Fig. 26, three distinct rules have been studied to define respectively the behavior of consumers, producers and neighborhoods. Let’s start with the rule that concerns consumers. The natural language version of this rule is provided:

SWRL green behaviour rule call graph

This rule refers to the charging_Flexibility KPI previously described in Sect. 5, The SWRL code that implements the previous rule using the ontology has been defined as follows:

The Fig. 27 shows the inferential rule result directly observable by Protegé.

Inference produced by the rule behavesGreen (user)
The second inference rule concerns the evaluation of echo-friendly behaviours of energy producers (owners of photovoltaic panels or other energy production devices). The natural language rule is given here:

In this case, all the energy providers who use renewable energy sources and who are able to exploit a certain percentage of self-production.
This rule refers to the Self_Consumption KPI previously described in Sect. 5, If the self-Consumption value is greater than a threshold then it is inferred that the producer has a green behavior.
The second rule is translated into SWRL code as follows:

The Fig. 28 shows the inferential rule result directly observable by Protegé.

Inference produced by the rule behavesGreen (producer)
The last rule of this example is about the evaluation of the eco friendly behaviour of a neighborhood. The goal is, combining the previous rules, to understand if a neighborhood has a sufficient number of green consumers and producers which allow to evaluate the entire neighborhood as a Green behaviour.
The rule in natural language is as follows:

The correspondent translation in SWRL can be expressed as:

The Fig. 29 shows the inferential rule result directly observable by Protegé.

Inference produced by the rule behavesGreen(neighborhood)
8 Conclusion
This paper describes an ontology based semantic framework for the representation and evaluation of business models, and its application in the smart-energy domain. We transposed the state of art business model knowledge from Alexander Osterwalder and Reinhard Scholten into a semantic business model ontology. Examples of inferential rules and their implementation using the SWRL languages have been developed to demonstrate how automatic reasoning can be used for evaluation. In particular, knowledge extraction allows for populating the ontology with new individuals and properties.
The population of the ontology with data collected in different cities can allow for evaluation of the defined business model with respect to those case studies.
However, the general approach can be applied to the definition and evaluation of new business models. New rules can be defined to extend the reasoning capability.
Notes
A consulting company of Alexander Osterwalder and others.
References
Amato A, Martino B, Scialdone M, Venticinque S (2016) Distributed architecture for agents-based energy negotiation in solar powered micro-grids. Concurr Comput 28(4):1275–1290. https://doi.org/10.1002/cpe.3757
Aversa R, Di Martino B, Venticinque S (2018) Integrating e-mobility in smart energy neighborhoods. In: Proceedings of 32nd EnviroInfo-2018 conference, environmental informatics techniques and trends, pp 277–280
Di Martino B, Mastroianni M, Campaiola M, Morelli G, Sparaco E (2019) Semantic techniques for validation of GDPR compliance of business processes. In: Conference on complex, intelligent, and software intensive systems. Springer, pp 847–855
Di Martino B, Cante LC, Venticinque S (2020) An ontology framework for evaluating e-mobility innovation. In: Conference on complex, intelligent, and software intensive systems. Springer, pp 520–529
Dijk M, Orsato R, Kemp R (2013) The emergence of an electric mobility trajectory. Energy Policy 52:135–145. https://doi.org/10.1016/j.enpol.2012.04.024
Dziekan K, Riedel V, Müller S, Abraham M, Kettner S, Daubitz S (2013) Evaluation matters. A practitioners’ guide to sound evaluation for urban mobility measures, p 178. https://www.https://www.waxmann.com/waxmann-buecher/?tx_p2waxmann_pi2%5Bbuch%5D=BUC123277&tx_p2waxmann_pi2%5Baction%5D=show&tx_p2waxmann_pi2%5Bcontroller%5D=Buch&cHash=be5d689e809a26824a4083e597ac9059
El Ghosh M, Naja H, Abdulrab H, Khalil M (2017) Towards a legal rule-based system grounded on the integration of criminal domain ontology and rules. Procedia Comput Sci 112:632–642
Fenza G, Gallo M, Loia V, Marino D, Orciuoli F, Volpe A (2020) Semantic CPPS in Industry 4.0. In: International conference on advanced information networking and applications. Springer, pp 1057–1068
Gassmann O, Frankenberger K, Csik M (2013) The St. Gallen Business Model Navigator. Working paper, Institute of Technology Management of the University St. Gallen (ITEM-HSG), St. Gallen, Switzerland. https://www.alexandria.unisg.ch/224941/
Jiang S, Venticinque S, Horn G, Hallsteinsen S, Noebels M (2016) A distributed agent-based system for coordinating smart solar-powered microgrids. In: Proceedings of 2016 SAI computing conference, SAI 2016. Institute of Electrical and Electronics Engineers Inc., pp 71–79. https://doi.org/10.1109/SAI.2016.7555964
McGuinness DL, Van Harmelen F et al (2004) Owl web ontology language overview. W3C Recomm 10(10):2004
Mei J, Boley H (2006) Interpreting SWRL rules in RDF graphs. Electron Notes Theor Comput Sci 151(2):53–69
Miranda S, Orciuoli F, Loia V, Sampson D (2017) An ontology-based model for competence management. Data Knowl Eng 107:51–66
Mohan A, Arumugam G (2011) Constructing railway ontology using web ontology language and semantic web rule language. Int J Comput Technol Appl 2(2):314–321
O’Connor M (2009) The semantic web rule language. In: Protégé conference
Osterwalder A (2004) The business model ontology a proposition in a design science approach. Ph.D. thesis, Université de Lausanne, Faculté des hautes études commerciales
Scholten R, Bosma B (2020) D3.3—revised business model. Technical report, Greencharge Research Project
Scialdone M, Tasquier L, Aversa R, Venticinque S (2017) Communication overlay for communities of collaborative agents in smart grid domains. Int J Bio-Inspir Comput 10(2):79–88. https://doi.org/10.1504/IJBIC.2017.085893
Tang X, Xiao M, Hu B, Pan D (2018) Exchanging knowledge for test-based diagnosis using owl ontologies and SWRL rules. Procedia Comput Sci 131:847–854
Venticinque S, Nacchia S (2019) Learning and prediction of e-car charging requirements for flexible loads shifting. In: Lecture Notes in Computer Science (including subseries Lecture Notes in Artificial Intelligence and Lecture Notes in Bioinformatics) 11874 LNCS, pp 284–293. https://doi.org/10.1007/978-3-030-34914-1_27
Venticinque S, Aversa R, Di Martino B, Natvig M, Jiang S, Sard RE (2019) Evaluating technology innovation for e-mobility. In: 2019 IEEE 28th international conference on enabling technologies: infrastructure for collaborative enterprises (WETICE). IEEE, pp 76–81
Zott C, Amit R, Massa L (2011) The business model: recent developments and future research. J Manag 37(4):1019–1042
Acknowledgements
The work described in this paper has been funded by the European Union under the Framework Horizon 2020 (European Project GreenCharge, Grant agreement no. 769016. Authors of this paper, on behalf of GreenCharge consortium, acknowledge the European Union and the Horizon 2020 Research and Innovation Framework Programme for funding the project (European Commission, Grant agreement no. 769016). The authors would like to thank all project partners and project management.
Funding
Open access funding provided by Università degli Studi della Campania Luigi Vanvitelli within the CRUI-CARE Agreement.
Author information
Authors and Affiliations
Corresponding author
Additional information
Publisher's Note
Springer Nature remains neutral with regard to jurisdictional claims in published maps and institutional affiliations.
Rights and permissions
Open Access This article is licensed under a Creative Commons Attribution 4.0 International License, which permits use, sharing, adaptation, distribution and reproduction in any medium or format, as long as you give appropriate credit to the original author(s) and the source, provide a link to the Creative Commons licence, and indicate if changes were made. The images or other third party material in this article are included in the article's Creative Commons licence, unless indicated otherwise in a credit line to the material. If material is not included in the article's Creative Commons licence and your intended use is not permitted by statutory regulation or exceeds the permitted use, you will need to obtain permission directly from the copyright holder. To view a copy of this licence, visit http://creativecommons.org/licenses/by/4.0/.
About this article

Cite this article
Di Martino, B., Branco, D., Colucci Cante, L. et al. Semantic and knowledge based support to business model evaluation to stimulate green behaviour of electric vehicles’ drivers and energy prosumers. J Ambient Intell Human Comput 13, 5715–5737 (2022). https://doi.org/10.1007/s12652-021-03243-4
Received:
Accepted:
Published:
Issue Date:
DOI: https://doi.org/10.1007/s12652-021-03243-4