Rhizosphere Effects of Maize and Wheat Increase Soil Organic and Inorganic Carbon Release in Carbonate-Rich Soils: A Three-Source 13C Partitioning Study
 Zhaoan Sun
 Biao Zhu
 Fang Wang2
  Fanqiao Meng
- 1Key Laboratory of Biochemistry and Molecular Biology in University of Shandong, College of Biological and Agricultural Engineering, Weifang University, Weifang, China
- 2Beijing Key Laboratory of Farmland Soil Pollution Prevention and Remediation, College of Resources and Environmental Sciences, China Agricultural University, Beijing, China
- 3Institute of Ecology, College of Urban and Environmental Sciences, and Key Laboratory for Earth Surface Processes of the Ministry of Education, Peking University, Beijing, China
In carbonate-rich soils with plants, CO2 emissions from the rhizosphere may come from as many as three sources, that is, root-derived respiration, decomposition of soil organic carbon (SOC), and dissolution of soil inorganic carbon (SIC), so partitioning of CO2 emissions by source is important to accurately quantify the rhizosphere effect (RE). Because of limited methods for three-source partitioning of soil CO2, how living roots affect SOC and SIC release (RE) has not yet been clarified, and this urgently needs to be evaluated. In this study, the RE of summer maize and winter wheat on SOC decomposition and SIC dissolution was investigated at three phenological stages in pot experiments with the aid of 13CO2 pulse labeling combined with 13C natural abundance techniques. We found that the contribution of SIC dissolution to CO2 emissions from unplanted soils ranged from 25 to 44%. As crop growth progressed, the maize rhizosphere effect on SOC- and SIC-derived CO2 emissions increased from 14 and 74% at the elongation stage to 84 and 268% at the grain filling stage compared to that in unplanted soils, respectively, while the wheat rhizosphere effect on SOC- and SIC-derived CO2 emissions increased from 51 and 34% at the elongation stage to 77 and 76% at the grain filling stage. We concluded that the rhizosphere effects increased SOC and SIC release over the entire growing season of maize (by 54% for SOC and 159% for SIC) and wheat (by 64 and 49%) compared to those in unplanted soils, indicating that ignoring SIC dissolution in carbonate-rich soils with plants will result in overestimation of SOC decomposition.
Introduction
The soil carbon (C) pool comprises two components: soil organic C (SOC) and soil inorganic C (SIC). Globally, the SIC pool is estimated to be approximately two-thirds of the SOC pool to a depth of 1 m (Lal, 2004). The SIC pool includes HCO3− in soil solution, CO2 in soil air, and calcium carbonate (CaCO3) deposited in soil, with CaCO3 being dominant in terms of quantity (Pan, 1999). SIC is an important constituent in the carbonate-rich soils of arid and semiarid regions (Wang et al., 2014; Dong et al., 2019). It is generally believed that SIC is relatively stable. In the past, most of the studies on soil C emissions focused on SOC decomposition, but little attention was given to the role of SIC. Recent studies found that SIC can be considered a C source (carbonate dissolution and release; Zamanian et al., 2018; Liu et al., 2020) or C sink (secondary carbonate formation; Wang et al., 2014; Dong et al., 2019). Therefore, the stability of the SIC pool directly affects atmospheric CO2 concentrations and the soil C balance.
Short-term changes in the SOC or SIC pools are very small compared with the background contents. Therefore, it is difficult to determine soil C release by directly measuring changes in the soil C content. Alternatively, it is possible to quantify this by indirectly measuring soil-derived CO2 emissions (Cardinael et al., 2019; Fang et al., 2020a). In carbonate-rich soils, recent studies have found that soil-derived CO2 emissions come not only from SOC decomposition but also from SIC dissolution. The contribution of SIC dissolution to soil C (SIC + SOC) release ranged from 3 to 95% in carbonate-rich soils without plants (Lardner et al., 2015; Schindlbacher et al., 2015; Wang et al., 2020). Therefore, SIC dissolution is more important to stabilize the global C pool and regulate atmospheric CO2 concentrations than previously thought (Zamanian and Kuzyakov, 2019; Raza et al., 2020). In carbonate-rich soils with plants, CO2 emissions from the rhizosphere may come from as many as three sources, that is, root-derived respiration (respiration by roots and microbes utilizing root-derived C substrates), SOC decomposition, and SIC dissolution (Figure 1). Distinguishing the sources of soil CO2 emissions is necessary to quantify the rhizosphere effect (RE) on SOC- and SIC-derived CO2 emissions. Because of limited methods for three-source CO2 partitioning (Tamir et al., 2011; Fang et al., 2020a), how living roots affect SOC- and SIC-derived CO2 emissions has not yet been clarified, and this urgently needs to be evaluated (Ahmad et al., 2013; Ahmad et al., 2020).
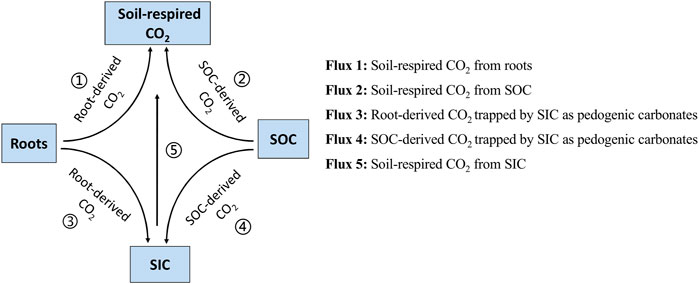
FIGURE 1. Model for the different sources of CO2 fluxes from carbonate-rich soils with plants.
Rhizosphere processes play crucial roles in regulating SOC decomposition by the release of rhizodeposits (Kuzyakov, 2002; Yin et al., 2020) and SIC dissolution through proton release from roots (Mubarak and Nortcliff, 2010; Ahmad et al., 2013; Ahmad et al., 2020). Recent studies have shown that root-derived CO2 and rhizosphere-stimulated soil-derived CO2 increase the concentration of soil CO2 (Zhu et al., 2014; Yin et al., 2020), which may result in promoting the rate of CaCO3 dissolution (Figure 1; Chevallier et al., 2016; Zamanian et al., 2018). The RE on SOC decomposition is relatively well-known (Kuzyakov, 2010; Kumar et al., 2016; Huo et al., 2017). However, to date, the RE of SIC dissolution has been poorly studied. These uncertainties are partly method related, that is, in many recent investigations on RE, only two sources of CO2 emissions could be identified, and few studies have separated the three sources of soil CO2 emissions (Kuzyakov, 2010; Weng et al., 2020).
The separation of the three C sources of CO2 efflux by the single-tracer method (e.g., artificial 14C/13C labeling or natural 13C abundance) is difficult compared to the double-tracer method (Blagodatskaya et al., 2011; Cui et al., 2017; Shahbaz et al., 2018). Hence, in many recent investigations on the RE on soil C release, only two sources of CO2 emissions could be identified (Kumar et al., 2016; Yin et al., 2020), and few studies have separated the three sources of soil CO2 emissions. Previous studies have developed a series of approaches to separate the three C sources by the C tracer method in a number of ways, for example, stable isotope analysis software (Plestenjak et al., 2012), 13C and 18O natural abundance (Lin et al., 1999), 14C labeling and 13C natural abundance (Tian et al., 2016), double labeling of 14C and 13C (Shahbaz et al., 2018), 13C labeling and natural abundance (Whitman and Lehmann, 2015; Kerré et al., 2016), and the combination of C3 and C4 sources in different treatments (Kuzyakov and Bol, 2005). Among the previous approaches to partitioning the three sources of CO2 emissions, dual 13C/14C isotopic labeling may currently be the best solution (Shahbaz et al., 2018). However, 14C labeling poses radioactivity hazards. In this study, we used a combination of 13C pulse labeling and 13C natural abundance to partition the three sources of CO2 emissions from rhizosphere soil (Whitman and Lehmann, 2015; Kerré et al., 2016): root-derived CO2 was estimated with 13C pulse labeling, and the remaining two components (SOC- and SIC-derived CO2) were distinguished by 13C natural abundance based on a three-source mixing model.
The reserves of the SIC pool (60 Pg C) are 1.2 times those of the SOC pool (50 Pg C) in China and are mainly distributed in carbonate-rich soils in the region of North and Northwest China (Pan, 1999; Wu et al., 2009). Here, we conducted pot experiments using carbonate-rich soils from North China farmland to grow summer maize (Zea mays L.) and winter wheat (Triticum aestivum L.) to investigate the RE on SOC- and SIC-derived CO2 emissions. We partitioned the cumulative emissions of total soil CO2 into root-, SOC-, and SIC-derived CO2 using the three-source 13C partitioning method described above and calculated the RE as the difference in SOC decomposition and SIC dissolution between the planted and unplanted treatments. We hypothesized that root-derived CO2 and RE-induced additional SOC decomposition would increase soil CO2 concentration, which may increase SIC dissolution and subsequent CO2 emissions in the presence of plants compared with those without plants.
Materials and Methods
Experimental Setup
Experiment 1: Summer Maize
The soils for growing summer maize were taken from an arable plot at the Quzhou Experimental Station of China Agricultural University in Hebei Province, Northern China (36°52′ N; 115°01′ E). The soils were collected from the plow horizon (0–20 cm depth) and were rich in carbonate (SIC = 7.8 g kg−1). The soil is classified as a Cambisol consisting of 62% sand, 29% silt, and 10% clay. The physical and chemical properties of the soil samples are given in Supplementary Table S1. The soils had been under winter wheat (Triticum aestivum L.)–summer maize (Zea mays L.) double-cropping management since the 1990s. The soils were air-dried, homogenized, and sieved (5-mm screen) before the summer maize was planted.
Each pot (35 × 20 cm i.d.) was closed at the bottom with a rubber stopper and had an air inlet and air outlet. Two maize seeds (cultivar Jiyuan 1) were sown directly into pots containing 9.5 kg air-dried soil premixed with fertilizer at a rate of 0.55 g N, 0.19 g P, and 0.31 g K kg−1 soil (equivalent to field application rates to the plow layer). Pot-grown summer maize was placed on the ground in a greenhouse and cultivated between May and September to provide similar light and temperature conditions to those in the field. The soil water content of each container was controlled gravimetrically to simulate local summer maize-growing conditions at each of the growth stages and was adjusted daily to 60% (emergence), 70–75% (elongation), 75–80% (heading), and 70–75% (grain filling) of the field capacity. After emergence of the third leaf, the weaker leaf was removed. The maize was grown for 99 days, and four different growth stages were recognized and described in days after emergence (DAE): 1) emergence (0–24 DAE), 2) elongation (25–53 DAE), 3) heading (44–66 DAE), and 4) grain filling (67–99 DAE). To compare total CO2 emissions with and without summer maize, soil without plants was also incubated in the same pots under the same conditions.
A chamber (1.05 m long × 1.05 m wide × 2.15 m high) was used for 13CO2 pulse labeling. The maize plants were labeled with 13CO2 pulses at the beginning of the elongation, heading, and grain filling stages (i.e., 29, 57, and 72 DAE, respectively). In total, we used 18 pots of maize and 9 pots of unplanted soil with three replicates for each growth stage: three maize plants were randomly selected for 13C pulse labeling on each occasion, and additional three maize plants were selected as unlabeled controls, which were kept separately from the labeled plants. Before labeling, the surface of the soil was covered with a PVC board and sealed with silicon, including around the maize stems. A beaker containing Ba13CO3 (98 atom% 13C; 8.5, 8.0, and 8.0 g were added for each of the three labeling occasions according to the photosynthetic rate of maize) was placed into the chamber. The chamber was then closed, and 13CO2 was released into the chamber by injecting an aliquot of 1 M hydrochloric acid (HCl) solution into the beaker containing Ba13CO3. To homogenize the distribution of 13CO2, an electric fan was used inside the chamber. The progression of the CO2 concentration within the chamber supplied with Ba12CO3 was monitored by an infrared gas analyzer (GXH305, Beijing Analytical Equipment Co., China). This unlabeled chamber was used because 13CO2 could not be directly monitored using the infrared detector because of the infrared range set for 12CO2 and the differing wavelengths for maximum absorption of 13CO2 and 12CO2 (Yu et al., 2017; Sun et al., 2019). If the CO2 concentration inside the unlabeled chamber declined considerably (below 200 ml L−1), 1 M HCl solution was injected until the CO2 concentration increased to approximately 360 ml L−1. The same volume of HCl solution was also injected into the chamber supplied with Ba13CO3. The summer maize plants were labeled for 7 h before the labeling chamber was opened.
The 13C-labeled and unlabeled maize plants and soils were destructively sampled 27 days after each labeling. During the 27-day allocation period, we measured the cumulative soil-respired CO2 from each pot with and without maize plants using a closed-circulation CO2 trapping system with a high trapping efficiency (>99.9%) (Cheng et al., 2003). During the whole allocation period, the CO2 respired from wheat roots and soil microorganisms in each sealed pot was pumped into sodium hydroxide (NaOH) solution by periodic air circulation for 30 min at a 6-h interval after labeling. Additionally, 25 ml of 3.5 M NaOH solution was changed every 3 days after labeling (DAL) until the end of the allocation period. To verify that 13C was completely distributed throughout the maize–soil system, the NaOH trap solution was divided into two groups between the samplings for the periods of 0–24 and 25–27 DAL. The NaOH trap solution between the samplings from 0 to 24 DAL was mixed to obtain a composite NaOH sample. CO2 was trapped in the NaOH solution by titrating an aliquot of the NaOH solution against 0.1 M HCl. To determine the amount of root-derived C partitioned to soil CO2 emissions, excess BaCl2 was added to an additional aliquot of NaOH solution to produce BaCO3 precipitate for 13C measurement (Harris et al., 1997). Blanks were included to correct for contamination from carbonate in the NaOH stock solution and from handling errors (Cheng et al., 2003).
Experiment 2: Winter Wheat
The soils for growing winter wheat was collected from the 0- to 20-cm depth from the Huantai Experimental Station of China Agricultural University in Shandong Province, Northern China (36°57′ N; 117°59′ E). The soil of the experimental field was derived from Yellow River alluvial sediments and was classified as a Fluvic Cambisol (a calcareous, fluvo-aquic sandy loam). The soil was also high in carbonate (SIC = 5.4 g kg−1). Soil characteristics are presented in Supplementary Table S1. After sampling, the soil was air-dried, homogenized, and sieved using a 5-mm screen prior to use.
Ten pre-germinated (soaked in water for 24–48 h) winter wheat seeds were sown directly in pots (30 × 20 cm i.d.) containing 8.7 kg air-dried soil, and the soil was rewetted to 70% of the water-holding capacity. One week after germination, six vigorous seedlings were retained in each pot (equivalent to a field planting density of 1.5 million plants ha−1). In accordance with local farming practices, the soils were premixed with urea and potassium phosphate at rates of 0.05 g N, 0.02 g P, and 0.02 g K kg−1 soil as a basal fertilizer, respectively. Urea was top-dressed at the elongation stage (mid-March of the following year) at a rate of 0.05 g N kg−1 soil. The pots with and without winter wheat plants were placed in hole dugs in cropland (30 cm depth; 24 cm diameter) to simulate local winter wheat-growing conditions. The pots were surrounded by a bag made of rope and pulled out of the holes with the aid of the bag each time the soil moisture was adjusted, which was done by weighing. The total growth period of winter wheat was 230 days, with six developmental stages recognized: 1) seeding [0–17 days after sowing (DAS)], 2) tillering (18–150 DAS), 3) elongation (151–179 DAS), 4) anthesis (180–193 DAS), 5) grain filling (194–214 DAS), and 6) grain ripening (215–230 DAS). The soil water content of each pot was controlled gravimetrically to simulate local winter wheat production and was adjusted daily to 65% (seedling), 70% (tillering), 80% (elongation), 80% (anthesis), and 70–75% (grain filling) of the field capacity, in accordance with the amount of rainfall and evaporation.
The labeling system consisted of a labeling chamber (0.6 m long × 0.6 m wide × 1.2 m high) containing pot-grown wheat plants. 13CO2 pulse labeling was performed at the elongation, anthesis, and grain filling stages of wheat (i.e., 168, 188, and 202 DAS, respectively). On each occasion, four pots were randomly selected for 13C labeling, and additional four wheat plants were selected as unlabeled controls. Hence, we used 36 pots in the experiment, with four replicates for destructive sampling at 28 DAL during each of the developmental stages: 12 pots were labeled with 13CO2, 12 pots were selected as unlabeled controls, and an additional 12 pots were selected for the unplanted treatments. On the previous day of labeling, the soil surface was covered with a PVC board and sealed with silicon, including around the culms. A beaker containing Na213CO3 (98 atom% 13C; 8.0, 8.0, and 8.0 g were added for each of the three labeling events) was placed inside the chamber. Similar to experiment 1, to determine CO2 concentrations within the chamber using an infrared gas analyzer, an unlabeled control treatment was set up in a different chamber under the same conditions, except that Na212CO3 was used to produce unlabeled CO2. If the CO2 concentration declined considerably (below 200 ml L−1) in the chamber containing the unlabeled control treatment, 1 M sulfuric acid (H2SO4) solution was injected until the CO2 concentration increased to approximately 360 ml L−1. The same volume of H2SO4 solution was injected into the chamber housing winter wheat plants labeled with 13C. After 7 h of labeling, winter wheat plants were removed from the chamber.
Unlabeled and 13C-labeled winter wheat and soils were destructively sampled 28 DAL at each growth stage. During the allocation period of 28 days, we measured the total soil respiration from each pot with and without plants using a closed-circulation CO2 trapping system adapted from Cheng et al. (2003). CO2 was absorbed in 50 ml of 1 M NaOH solution between the samplings for periods of 2–4 days during the allocation period of 28 days. To verify that the distribution of assimilated 13C was complete in the wheat–soil system, the NaOH trap solution was divided into two groups between the 0–26 and 27–28 DAL sampling periods. The NaOH trap solution between the 0 and 26 DAL samplings was combined into a homogenized sample. To determine the total soil CO2 emissions, an aliquot of each NaOH trap solution was titrated with 0.1 M HCl. For an additional aliquot of NaOH solution, excess SrCl2 was added to the NaOH solution containing trapped CO2 to produce SrCO3 precipitate for 13C measurement (Harris et al., 1997). Blanks were used to correct for contamination from carbonate in the process of the experiment (Cheng et al., 2003).
Shoot, Root, and Soil Sampling
Unlabeled and 13C-labeled maize and wheat plants and soils were destructively sampled after the allocation period at each growth stage. The shoots were cut at the soil surface, and visible roots were separated from the soil by careful handpicking using a 0.2-mm sieve to remove finer roots. All root materials were soaked in 2.5 L deionized water, gently shaken for 20 min, and washed with 400 ml deionized water through a 0.1-mm sieve to remove soil particles adhering to roots. All of the water used to wash the roots was saved and added to the remaining pot to completely recover dissolved organic carbon and other rhizodeposits. The soil was spread on the plastic film overnight to reduce the water content. Then, the soil was thoroughly mixed and repeatedly half-sampled by gridding to achieve a fully representative 50 g subsample. The shoots, roots, and soil samples were oven-dried at 65°C to a constant weight.
The plant and soil samples were ground (<500 µm) using a ball mill (Restol MM 2000, Retsch, Haan, Germany) before measurements of δ13C values and total organic C concentrations. To determine the δ13C values of SOC, carbonates were removed from soil samples by fumigation with 3 M HCl solution for 6 h (Meng et al., 2013). The soil samples were washed using deionized water and centrifuged three or four times to remove HCl. The total organic C and the acidified soil and plant samples were determined using an elemental analyzer (Flash EA1112, ThermoFinnigan, Milan, Italy). The δ13C values of acidified soil and plant samples were determined using isotope-ratio mass spectrometry (DELTAplus XP, ThermoFinnigan, Bremen, Germany) in the Stable Isotope Facility at the University of California, Davis, United States. The CO2 for δ13C measurements of soil solid carbonate was collected from a vacuum system in which soil samples reacted with 100% H3PO4 at 70°C for 3 h (Bughio et al., 2017). The collected CO2 was then analyzed for δ13C values using a DELTA V Advantage mass spectrometer (Thermo Fisher Scientific, United States) located at the Third Institute of Oceanography in Xiamen, China. The abundance of 13C was expressed as parts per thousand (‰) relative to the international standard (Pee Dee Belemnite, PDB; 0‰) expressed as delta units (δ) (Craig, 1953).
Calculations
The potential influence of carbonate on soil-respired 13CO2 was determined by subtracting the δ13C values of the soil CO2 emissions from the unlabeled maize and wheat treatments, assuming that the CO2 emissions from SOC decomposition, inorganic C release/absorption, and root-derived CO2 were not affected by 13C pulse labeling (Meng et al., 2013; Sun et al., 2019). This assumption is reasonable because the 13C pulse labeling should not affect plant growth; therefore, there were no differences in the contributions of the three C sources to the soil-respired CO2 between the 13C pulse-labeled plants and the unlabeled control plants. We applied the method described by Meng et al. (2013) and Sun et al. (2019) as follows:
With the net 13C labeled in soil respiration summarized as follows Eqs. 1, 2:
The 13C assimilated (mg 13C pot−1) in plant biomass, SOC, and soil-respired CO2 was calculated as the difference between the 13C contents of the labeled and unlabeled samples (Hafner et al., 2012; Sun et al., 2019):
where L and NL indicate labeled and unlabeled samples, respectively, and TC is the total C content.
The amount of net photosynthate-C (g C pot−1) allocated to the different pools of the crop–soil system over time was estimated by using the method below (Remus and Augustin, 2016):
where Csample is the amount of C in the investigated belowground pool (g C pot−1), dCshoot/dt is the crop shoot growth rate over time (mg C d−1 pot−1), 13Csample is the 13C content transferred to the individual belowground pool over time (mg 13C pot−1), and 13Cshoot is the 13C content in the shoots over time (mg 13C pot−1).
i) Two-source partitioning of CO2 emissions from rhizosphere soil by 13C pulse labeling
First, root-derived CO2 (CRoot) was quantified by Eq. 5 and then total soil CO2 (CT) was divided into soil-derived CO2 (CSoil) and root-derived CO2 (Hafner et al., 2012):
where FRoot and FSoil represent the ratios of root-derived and soil-derived CO2 to total CO2 emissions from the rhizosphere soil, respectively.
ii) Three-source partitioning of CO2 emissions from rhizosphere soil with the aid of 13CO2 pulse labeling combined with natural 13C abundance techniques
The proportion of root-derived CO2 in the planted soil was estimated by 13C pulse labeling based on step 1. The proportion of SOC-derived CO2 in the total CO2 emissions from the planted soil was calculated using the following three-pool 13C isotopic mixing model (Whitman and Lehmann, 2015; Kerré et al., 2016):
where FSOC and FSIC are the ratios of SOC decomposition and SIC dissolution contributions to CO2 emissions from rhizosphere soil, respectively. δCO₂, δRoot, δSOC, and δSIC are the δ13C values of CO2 emissions from rhizosphere soil, roots, SOC, and SIC, respectively.
The proportion of SIC-derived CO2 in the planted soil was calculated by subtracting the proportion of SOC-derived CO2 and root-derived CO2 from 1:
Statistical Analysis
Wheat and maize growth stages were the experimental factors in this study. The experiment was carried out with four replicates for wheat and three replicates for maize and was arranged in a completely randomized design. The data were subjected to analysis of variance (ANOVA) to determine the statistical significance of the effects of the plant growth stage using SPSS (Version 11.0, 2002, SPSS Inc., Chicago, IL, United States). Fisher’s least significant difference (HSD; p < 0.05) was used to test differences in the measured variables among the different labeling events.
Results
Summer Maize and Winter Wheat Growth
As the maize grew, the biomass of shoots and whole plants increased and peaked at the heading stage, after which it remained stable; the biomass of maize roots did not differ significantly from the elongation to the grain filling stages (Figure 2A). The biomass of the shoots and whole plants significantly increased from the elongation stage to the grain filling stage in winter wheat. The root biomass of wheat reached a peak at the anthesis stage and then remained stable (Figure 2B). The ratio of root/total maize significantly decreased from elongation until the grain filling stage (Figure 2C), while that of wheat showed no significant difference between elongation and anthesis and then began to significantly decrease (Figure 2D).
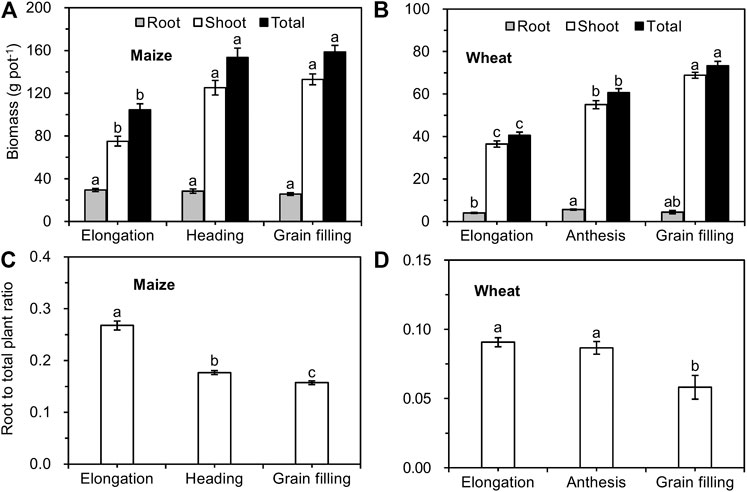
FIGURE 2. Biomass (A, B) and root/total plant weight (C, D) of maize and wheat at different growth stages (mean ± SE, n = 3 for maize and n = 4 for wheat). Note: Different lowercase letters indicate significant differences between growth stages at the p < 0.05 level.
Distribution of Net Assimilated 13C in the Plant–Soil System
In maize and wheat, the majority of net recovered 13C (>53% in maize vs. >70% in wheat) was recovered in shoots at all growth stages and increased as the growth stages advanced (Figures 3A,B). The allocation of net recovered 13C belowground (root, soil, and rhizosphere respiration) gradually decreased from the elongation to the grain filling stages in both maize and wheat plants (Figures 3A,B). In maize, the proportion of 13C that was allocated to roots and soil decreased as the growth stages advanced, while the proportion of 13C allocated to rhizosphere respiration was not significantly different among different growth stages (Figure 3C). In comparison, the proportion of 13C translocated belowground by wheat and used for root growth, respiration, and exudation decreased during plant development (Figure 3D). In maize and wheat, the recovery of 13C from roots, soil, and rhizosphere respiration at all growth stages was in the order of rhizosphere respiration > roots > soil (with the exception of the elongation stage in maize; Figure 3).
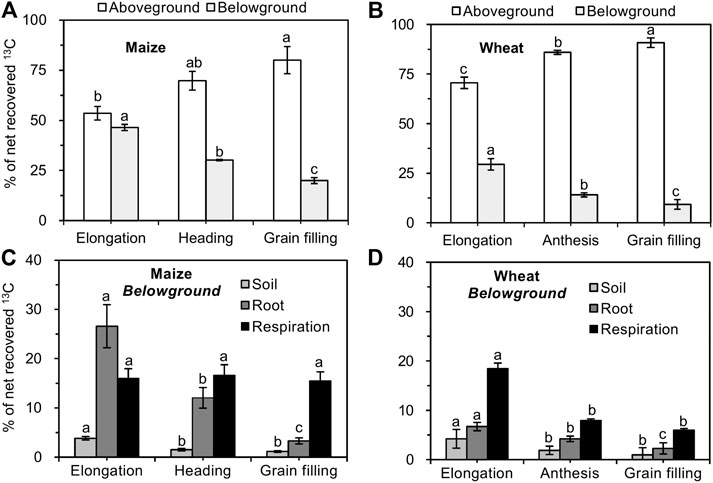
FIGURE 3. Proportion of net photosynthesized 13C in each component of the crop–soil system (mean ± SE, n = 3 for maize and n = 4 for wheat). Note: Different lowercase letters indicate significant differences between growth stages at the p < 0.05 level.
Partitioning of Soil CO2 Emissions
In the maize– and wheat–soil systems, 15.5–16.6% (Figure 3C) and 6.0–18.5% (Figure 3D) of net assimilated 13C was respired via rhizosphere respiration at all growth stages, respectively, and this proportion corresponded to the amount of root-derived CO2, that is, 2.8–7.2 g CO2-C pot−1 for maize (Figure 4A) and 0.4 to 3.3 CO2-C pot−1 for wheat (Figure 4B), respectively. The root-derived CO2 in the total soil CO2 emissions was 28.8–66.5% in the maize-planted treatment (Figure 4C) and 12.8–69.6% in the wheat-planted treatment (Figure 4D) according to the 13CO2 pulse labeling technique. With the increase in the developmental stages of maize and wheat, the contribution of soil-derived C (SOC and SIC) to soil CO2 emissions increased from approximately 33 and 31% at the elongation stage to 74 and 87% at the grain filling stage in maize and wheat, respectively (Figures 4C,D).
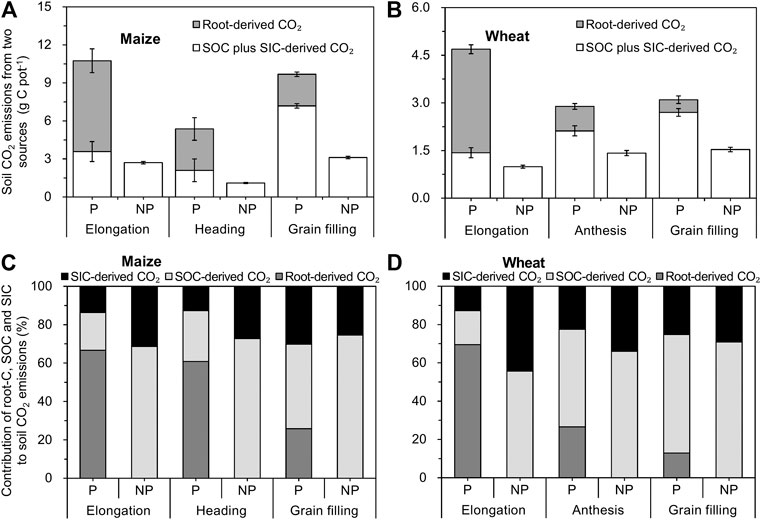
FIGURE 4. Two-source (A, B) and three-source (C, D) partitioning of soil CO2 emissions from the crop-planted soil using 13C labeling and natural abundance (mean ± SE, n = 3 for maize and n = 4 for wheat). Note: p and NP represent planted and nonplanted, respectively.
The proportion of SOC-derived CO2 was 20% for maize and 18% for wheat at the elongation stage and thereafter increased to 44 and 62%, respectively, at the grain filling stage (Figures 4C,D). In maize and wheat plants, 14–30% (Figure 4C) and 13–25% (Figure 4D) of SIC-derived CO2 was respired via the rhizosphere at all growth stages, respectively. A linear two-source isotopic mixing model was used to calculate the contribution of SOC-derived and SIC-derived CO2 to total CO2 emissions in the unplanted soils (Figures 4C,D). In the unplanted soil, SOC-derived CO2 accounted for the majority (69–75% and 56–71% for maize- and wheat-unplanted soils) of soil CO2 emissions, while the contribution of CO2 released from SIC dissolution was 25–31% and 29–44% at different growth stages, respectively (Figures 4C,D).
RE of Maize and Wheat on SOC and SIC Release
A positive RE was found in both soils planted with maize and wheat, resulting from enhanced CO2 release from SOC decomposition and SIC dissolution (Figure 5). The RE of maize and wheat enhanced soil total C (STC) release by 86% (Figure 5A) and 58% (Figure 5B) over the whole growth period (from the elongation until the grain filling stage), respectively. For maize, the RE on SOC and SIC release was the lowest (14 and 74%) at the elongation stage and increased to 84 and 268% at the grain filling stage, respectively (Figures 5C,E). The RE of wheat ranged from 51 to 77% for SOC-derived CO2 and from 34 to 76% for SIC-derived CO2 at all growth stages, being highest at the grain filling stage (Figures 5D,F). SOC decomposition in soils planted with maize and wheat increased by 54% (Figure 5C) and 64% (Figure 5D) over the entire growth season, respectively, compared to that in unplanted soils. The maize RE on SIC release (159%; Figure 5E) was higher than that on SOC release from the elongation to the grain filling stages, whereas wheat RE resulted in lower SIC-derived CO2 emissions (49%; Figure 5F).
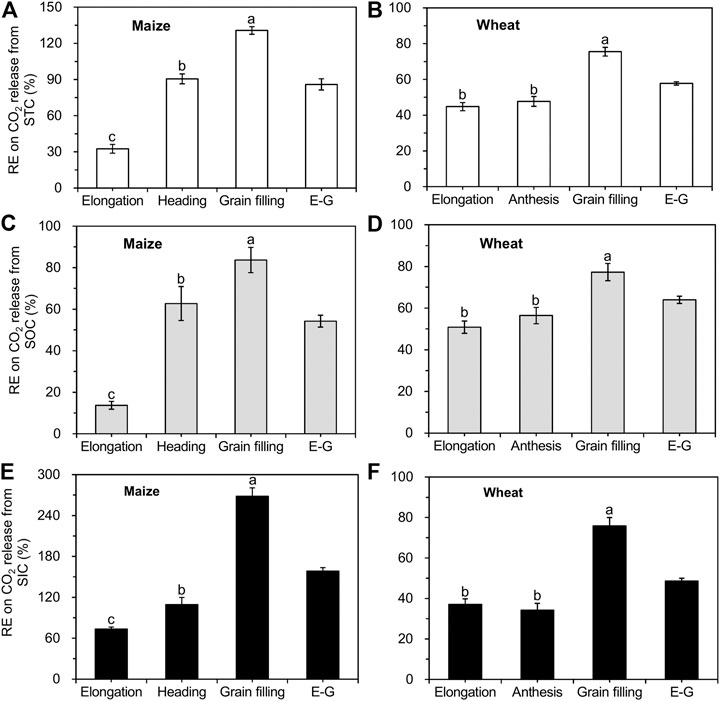
FIGURE 5. Comparison of the crop rhizosphere effect (RE) on CO2 release from STC, SOC, and SIC (mean ± SE, n = 3 for maize and n = 4 for wheat). Note: STC represents soil total C; E-G indicate the growth stages from elongation to grain filling.
In carbonate-rich soils with maize and wheat plants, from the elongation stage to the grain filling stage, the contribution of each source to total soil CO2 emissions was as follows (Figure 6): 1) root-derived CO2 was 50 and 42% 2) basal SOC-derived CO2 was 19 and 24%, 3) basal SOC-derived CO2 was 8 and 13%, 4) SOC-derived CO2 stimulated by RE was 11 and 15%, and 5) SIC-derived CO2 stimulated by RE was 12 and 6% for maize and wheat, respectively.
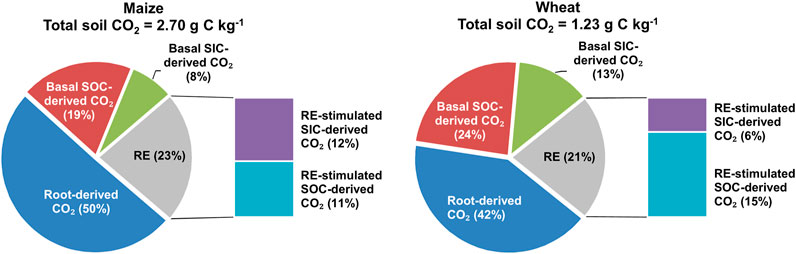
FIGURE 6. Contribution of five C sources (basal SOC- or SIC-derived CO2, root-derived CO2, and RE-stimulated SOC- or SIC-derived CO2) to cumulative CO2 emissions from the belowground system over the whole growth stage. Note: RE stands for the rhizosphere effect.
Discussion
Contribution of Carbonate Dissolution to Soil CO2 Emissions
In our experiments, we observed that the estimated contribution of SIC to total soil-derived CO2 emissions from unplanted soils ranged from 30 to 35% (Figure 4). Data from published articles showed that the contribution of carbonate (including soil endogenous inorganic C and exogenous lime) dissolution to soil endogenous C (SIC + SOC) release was between 3 and 95%, with an average value of 42 ± 4% and a 95% CI of 27–59% (Supplementary Table S2), which was much higher than our results. This indicates that the contribution of carbonate dissolution to soil CO2 emissions is more important than previously thought. For instance, we estimated by literature synthesis that the contribution of SIC-derived CO2 from carbonate-rich soils was 40 ± 4% and 47 ± 7% from liming of acidic soils (Figure 7A). Especially in intensive crop production systems with high nitrogen fertilization, the degree of carbonate dissolution may be high due to the neutralization of nitrogen fertilization–induced acidity (Zamanian et al., 2018; Raza et al., 2020).
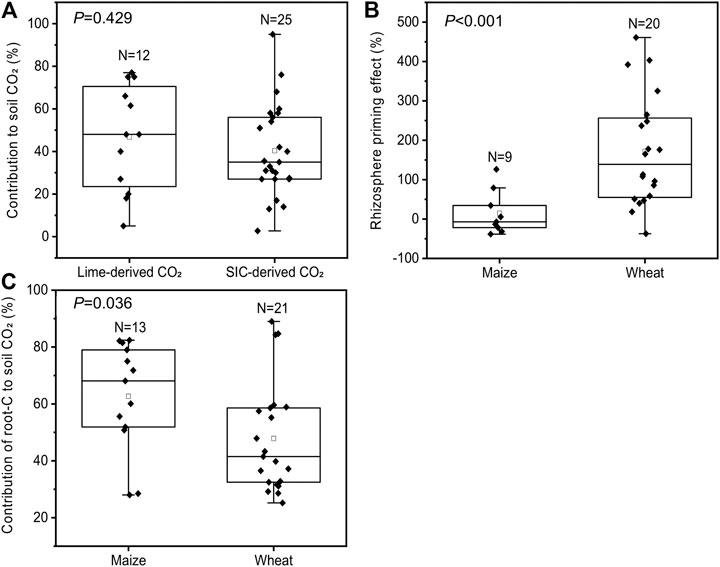
FIGURE 7. Literature synthesis based on 13C/14C tracer experiments. Contribution of lime application in acidic soils or soil native inorganic C in carbonate-rich soils to total soil CO2 emissions (A), maize and wheat rhizosphere effects on SOC decomposition (B), and contribution of root-derived and soil-derived CO2 to total CO2 emissions from soils planted with maize and wheat (C). Note (A) is based on a literature synthesis including 12 observations from 9 studies of lime application and 25 observations from 24 studies of soil CO2 partitioning in carbonate-rich soils (Supplementary Table S2) (B) is based on a literature synthesis including 9 observations from 5 studies of the maize rhizosphere effect and 20 observations from 8 studies of the wheat rhizosphere effect (Supplementary Table S3) (C) is based on a literature synthesis including 13 observations from 8 studies of maize and 21 observations from 6 studies of wheat (Supplementary Table S4); the N in the box represents the number of data points; the line and square within the box represent the median and mean values of all data; the bottom and top edges of the box represent 25 and 75 percentiles of all data, respectively; and the bottom and top bars represent 5 and 95 percentiles of all data, respectively; the scattered black diamonds indicate data points.
Possible Uncertainties in Partitioning Soil CO2 Emissions by Three Sources
The partitioning of soil CO2 in carbonate-rich soils with plants presents particular challenges (Tamir et al., 2011; Meng et al., 2013; Fang et al., 2020a). In carbonate-rich soils with plants (pH > 7), the following four sources may be the main contributors to CO2 respiration (Figure 1): 1) root-derived CO2, 2) SOC-derived CO2, and 3) CO2 from either root-derived or SOC-derived CO2 that has been retained in the soil solution in the form of HCO3− (Zamanian et al., 2018) or 4) exchanged with soil carbonate (Chevallier et al., 2016; Bughio et al., 2017). Therefore, in carbonate-rich soils with plants, this approach accommodates the potential inorganic 13C release/absorption for quantifying 13C-labeled soil CO2 emissions by using a control treatment (unlabeled treatments) and exploiting Δ13C values (i.e., the difference between the δ13C values of the unlabeled vs. 13C-labeled treatments) to determine the contribution of 13C-labeled CO2 to rhizosphere respiration.
With this method, we assumed that the possible effects of isotopic fractionation by CO2 production from three different sources (root, SOC, and SIC) are negligible when using 13C natural abundance. However, the literature was not conclusive on this point. The first shortcoming of the method affecting the accuracy is the magnitude of possible 13C isotope fractionation between roots and root-derived CO2. For instance, the synthesis by Werth and Kuzyakov (2010) found that the δ13C value of CO2 released by root-derived respiration was more 13C-depleted by approximately 2.1 ± 2.2‰ for C3 plants and 1.3 ± 2.4‰ for C4 plants than was root tissue. Similar to Werth and Kuzyakov (2010), Zhu and Cheng (2011) also found that the δ13C value of root-derived CO2 was more 13C-depleted relative to root biomass during rhizosphere respiration (0.9–1.7‰ in C3 plants vs. 3.7–7.0‰ in C4 plants). Thus, isotopic fractionation by root-derived respiration should be considered when calculating the contribution of root sources to soil CO2 emissions using 13C natural abundance. It is possible to identify 13C fractionation between root-derived CO2 and root biomass, utilizing plants grown in C-free medium (e.g., in the vermiculite–sand mixture) (Cheng, 1996; Zhu and Cheng, 2011).
In carbonate-rich soils, only four studies have partitioned the soil CO2 emissions from three C sources (exogenous organic C, SOC, and SIC; Supplementary Table S2) by using the difference in δ13C signatures between SOC and SIC (Tamir et al., 2011; Plestenjak et al., 2012; Fang et al., 2020a; Fang et al., 2020b). However, the limitation of 13C natural abundance has been the same as with any other single-tracer method (e.g., 14C or 13C labeling), in which only two C sources of soil CO2 emissions can be separated (Blagodatskaya et al., 2011; Cui et al., 2017; Shahbaz et al., 2018). By using the δ13C signature difference, in carbonate-rich soils, previous studies determined three C sources contributed to soil CO2 emission, assuming that SOC- (Tamir et al., 2011) or SIC-derived CO2 emissions (Fang et al., 2020a; Fang et al., 2020b) were not affected by organic C addition. This may have caused underestimation or overestimation of SOC and SIC emissions because of ignoring the activation effects of organic C addition on SOC decomposition (priming effect) or SIC dissolution (organic acids released from organic C decomposition). Alternatively, the IsoSource program proposed by Phillips and Gregg (2003) has shown the potential for estimating the range of contributions of the three C sources to total soil CO2 emissions (Plestenjak et al., 2012; Sun et al., 2019). In this study, with the aid of 13CO2 pulse labeling combined with 13C natural abundance techniques, we took root effects on SOC and SIC release into account to estimate SIC and SOC contributions to soil CO2 emissions. Similar to most studies about SIC- and SOC-derived CO2 partitioning using 13C natural abundance, our study also assumed that the δ13C of SIC-derived CO2 is equal to the δ13C of carbonate and that of SOC-derived CO2 is equal to the δ13C of SOC. However, by a survey of the literature, Werth and Kuzyakov (2010) found a 13C enrichment of SOC-derived CO2 compared to SOC in most cases for C3 soils (between -0.5‰ and +1.7‰), while it was more depleted for C4 soils (up to -2.0‰). The soils used in our experiments were collected from an annual production system of winter wheat–summer maize since the 1990s, and our previous study found that the contribution of maize-derived C to SOC ranged from 3.5 to 11.6% using 13C natural abundance, which indicated that the SOC was mainly derived from C3 wheat (Meng et al., 2014). Therefore, the isotopic fractionation range was closer to that of C3 soil in our study. As in many isotopic studies on SOC decomposition, the isotopic fractionation between SOC and SOC-derived CO2 was usually neglected in the calculations due to the small fractionation range. Especially in laboratory studies with surface soils, a thin soil layer (approximately 20 cm in this study) likely leads to a small fractionation range (Boström et al., 2007). To determine the fractionation of SIC-derived CO2 relative to SIC, it is important to eliminate the interference of SOC-derived CO2 (Skidmore et al., 2004). Recently, a series of sterilization studies were conducted to partition the contribution of SIC to total soil CO2 emissions by eliminating the microbial respiration process (Ma et al., 2017; Wang et al., 2020). Consequently, in future studies, isotope fractionation in δ13C values between SIC- and SIC-derived CO2 should be measured by sterilization treatment.
RE of Maize and Wheat on SOC and SIC Release
The RE on SOC decomposition has been widely observed in numerous studies (Kumar et al., 2016; Yin et al., 2020), but studies of SIC release mediated by plants are still rare (Ahmad et al., 2013; Ahmad et al., 2020). Our results supported our hypothesis that RE would enhance SIC dissolution and subsequent CO2 emission. From the elongation stage to the grain filling stage, the cumulative soil CO2 emissions substantially increased by 159% (Figure 5E) and 49% (Figure 5F) in the presence of maize and wheat plants, respectively, compared with those without plants. Consistent with our studies, Ahmad et al. (2013) also showed that dissolution of lime was significantly enhanced in planted soil compared to unplanted control soil. Several reasons may be responsible for the positive RE (accelerated rates of SIC dissolution) on SIC release: 1) the released protons from plant roots acidify the soil and lead to soil carbonate dissolution (Mubarak and Nortcliff, 2010; Ahmad et al., 2013); 2) organic acids produced during the oxidation of organic matter (SOC and rhizodeposited C) may contribute to carbonate dissolution (Tamir et al., 2011); and 3) due to the exchange between CO2, HCO3−, and CaCO3 in carbonate soils, soil CO2 from root-derived CO2 and rhizosphere-stimulated SOC-derived CO2 may increase the partial pressure of CO2 in the soil and hence result in CaCO3 dissolution (Kumar et al., 2016; Zamanian et al., 2018). In this study, living roots significantly enhanced SOC mineralization over the whole growth stage, by 54% for maize (Figure 5C) and 64% for wheat (Figure 5D), compared to that in unplanted control soils. Moreover, the contribution of root-derived CO2 to the total soil CO2 efflux in our experiment ranged from 40 to 50% in maize and wheat plants (Figure 6). Hence, in our study, the positive RE on SIC release may be caused by the increase in partial pressure of CO2 in the soil, which was derived from RE-stimulated SOC-derived CO2 and root-derived CO2.
With the progression of the growth period, the positive RE of maize and wheat on SOC decomposition increased significantly (Figures 5C,D). This corresponded well with the changes in the whole plant biomass of maize and wheat, which increased with the growth stage (Figures 2A,B), indicating that plants invest additional C resources into root exudates (Cheng et al., 2014; Zhu et al., 2018). Cheng et al. (2014) showed that enhanced root exudates may accelerate RE for SOM decomposition. Recent meta-analyses also noted that a positive RE on SOC decomposition (increased rates of SOC decomposition) has been more frequently reported than a negative RE (Huo et al., 2017). The positive RE has often been explained by the microbial activation mechanism, which is related to root-released labile C substrates stimulating microbial growth in the rhizosphere, thus leading to higher extracellular enzyme activities and accelerated SOC decomposition (Kumar et al., 2016; Huo et al., 2017). By literature synthesis of maize and wheat RE studies (Figure 7B), we found that the mean effect sizes of maize and wheat RE were 15% (95% CI between -27 and 75%) and 172% (95% confidence interval between 53 and 261%), respectively. Most of our results were in the confidence interval from the literature synthesis, which showed that the RE of maize and wheat led to 14–84% (Figure 5C) and 51–77% (Figure 5D) increases in the SOC decomposition rate at different growth stages, respectively. The intensity of the RE was dependent on root activity and rhizodeposit quantity. For instance, Kumar et al. (2016) suggested that the RE is determined in large part by rhizodeposit quantity. Hence, the RE at the early growth stages may not represent that over the whole growth season. The longer timescale of monitoring (99 days for maize and 230 days for wheat) in this study may provide a much more complete assessment of RE than previously described (Supplementary Table S3). However, the majority of studies of maize and wheat RE were conducted at the early growth stages, for example, <50 DAE in maize and <110 DAE in wheat (Supplementary Table S3).
Contribution of Root-Derived and Soil-Derived CO2 to Soil CO2 Emissions
Based on literature data from 13C/14C tracer experiments, we found that the contribution of root-derived CO2 to total soil CO2 emissions was 63% in maize-planted soil and 48% in wheat-planted soil (Figure 7C), which is comparable with our results (50% for maize and 42% for wheat; Figure 6). Hence, due to crop-derived CO2, maize and wheat plants strongly increased total CO2 emissions compared to those from unplanted soil. SOC- and SIC-derived CO2 emissions increased in the presence of maize and wheat roots (Figure 6). However, root exclusion experiments often use root-free soils and neglect the RE on soil-derived CO2, which may lead to overestimation (positive RE) of root-derived CO2 (Kuzyakov, 2002; Huo et al., 2017). In acidic and neutral soils, the difference between results obtained with both isotope and nonisotope methods corresponds to the interaction between root exudates and SOC decomposition (Kuzyakov et al., 2001; Huo et al., 2017). In the carbonate-rich soils in this study, the RE also accelerated SIC-derived CO2 emissions (Figure 6) due to the secretion of protons from roots (Mubarak and Nortcliff, 2010; Ahmad et al., 2013) and the increase in soil CO2 concentrations from root-derived CO2 and RE-stimulated SOC-derived CO2 (Kumar et al., 2016; Zhu et al., 2018; Yin et al., 2020). In this study, the positive RE led to additional SIC-derived CO2 emissions of approximately 159% in maize-planted soil (Figure 5E) and 49% in wheat-planted soil (Figure 5F) compared to those from unplanted soil from the elongation stage to the grain filling stage. Therefore, ignoring the RE of maize and wheat on soil-derived CO2 emissions would result in underestimation by 46 and 36% compared to those from nonisotope methods, respectively (Figure 6).
Conclusion
The combination of 13C pulse labeling and 13C natural abundance techniques applied to carbonate-rich soils allowed us to separate the three sources of CO2 emissions using only one stable isotope. We demonstrated this approach by partitioning soil CO2 emissions derived from root-derived respiration (50 and 42% of total soil CO2 emissions for maize and wheat, respectively), SOC mineralization (30 and 39%), and SIC dissolution (20 and 19%). Hence, in carbonate-rich soils, ignoring carbonate dissolution will lead to overestimation of SOC mineralization. Our results showed that the RE of maize and wheat stimulated SOC (54 and 64% for maize and wheat, respectively) and SIC (159 and 49%) release above the rates in unplanted soils. Therefore, ignoring this root effect will result in overestimation of root-derived CO2 emissions.
Data Availability Statement
The data that support the findings of this study are available from the corresponding author upon reasonable request.
Author Contributions
FM conceived and designed the experiments. ZS and MH performed the experiments. ZS, FW, and FM analyzed the data, and ZS, BZ, and FM wrote the paper. All authors reviewed and commented on the manuscript.
Funding
This work received financial support from the National Natural Science Foundation of China (Nos. 31370527, 30870414, and 31988102) and the Natural Science Foundation of Shandong Province (No. ZR2020QD042).
Conflict of Interest
The authors declare that the research was conducted in the absence of any commercial or financial relationships that could be construed as a potential conflict of interest.
Acknowledgments
We appreciate Zichao Zhao for his assistance with isotope analysis.
Supplementary Material
The Supplementary Material for this article can be found online at: https://www.frontiersin.org/articles/10.3389/fenvs.2021.654354/full#supplementary-material
References
Ahmad, W., Dijkstra, F. A., Dalal, R. C., and Singh, B. (2020). Plant Roots Are More Important Than Temperature in Modulating Carbon Release in a Limed Acidic Soil. Eur. J. Soil Sci. 71, 727–739. doi:10.1111/ejss.12899
Ahmad, W., Singh, B., Dijkstra, F. A., and Dalal, R. C. (2013). Inorganic and Organic Carbon Dynamics in a Limed Acid Soil Are Mediated by Plants. Soil Biol. Biochem. 57, 549–555. doi:10.1016/j.soilbio.2012.10.013
Blagodatskaya, E., Yuyukina, T., Blagodatsky, S., and Kuzyakov, Y. (2011). Three-source-partitioning of Microbial Biomass and of CO2 Efflux from Soil to Evaluate Mechanisms of Priming Effects. Soil Biol. Biochem. 43, 778–786. doi:10.1016/j.soilbio.2010.12.011
Boström, B., Comstedt, D., and Ekblad, A. (2007). Isotope Fractionation and 13C Enrichment in Soil Profiles during the Decomposition of Soil Organic Matter. Oecologia 153, 89–98. doi:10.1007/s00442-007-0700-8
Bughio, M. A., Wang, P., Meng, F., Chen, Q., Li, J., and Shaikh, T. A. (2017). Neoformation of Pedogenic Carbonate and Conservation of Lithogenic Carbonate by Farming Practices and Their Contribution to Carbon Sequestration in Soil. J. Plant Nutr. Soil Sci. 180, 454–463. doi:10.1002/jpln.201500650
Cardinael, R., Chevallier, T., Guenet, B., Girardin, C., Cozzi, T., Pouteau, V., et al. (2019). Organic Carbon Decomposition Rates with Depth and Contribution of Inorganic Carbon to CO2 Emissions under a Mediterranean Agroforestry System. Eur. J. Soil Sci. 71, 909–923. doi:10.1111/ejss.12908
Cheng, W., Johnson, D. W., and Fu, S. (2003). Rhizosphere Effects on Decomposition: Controls of Plant Species, Phenology and Fertilization. Soil Sci. Soc. Am. J. 67, 1418–1427. doi:10.2136/sssaj2003.1418
Cheng, W. (1996). Measurement of Rhizosphere Respiration and Organic Matter Decomposition Using Natural 13C. Plant Soil 183, 263–268. doi:10.1007/BF00011441
Cheng, W., Parton, W. J., Gonzalez-Meler, M. A., Phillips, R., Asao, S., McNickle, G. G, et al. (2014). Synthesis and modeling perspectives of rhizosphere priming. New Phytol. 201, 31–44. doi:10.1111/nph.12440
Chevallier, T., Cournac, L., Hamdi, S., Gallali, T., and Bernoux, M. (2016). Temperature dependence of CO2 emissions rates and isotopic signature from a calcareous soil. J. Arid Environ. 135, 132–139. doi:10.1016/j.jaridenv.2016.08.002
Craig, H. (1953). The Geochemistry of the Stable Carbon Isotopes. Geochimica et Cosmochimica Acta 3, 53–92. doi:10.1016/0016-7037(53)90001-5
Cui, J., Ge, T., Kuzyakov, Y., Nie, M., Fang, C., Tang, B., et al. (2017). Interactions between Biochar and Litter Priming: A Three-Source 14C and δ13C Partitioning Study. Soil Biol. Biochem. 104, 49–58. doi:10.1016/j.soilbio.2016.10.014
Dong, X., Singh, B. P., Li, G., Lin, Q., and Zhao, X. (2019). Biochar Increased Field Soil Inorganic Carbon Content Five Years after Application. Soil Tillage Res. 186, 36–41. doi:10.1016/j.still.2018.09.013
Fang, Y., Singh, B. P., Collins, D., Armstrong, R., Van Zwieten, L., and Tavakkoli, E. (2020a). Nutrient Stoichiometry and Labile Carbon Content of Organic Amendments Control Microbial Biomass and Carbon-Use Efficiency in a Poorly Structured Sodic-Subsoil. Biol. Fertil. Soils 56, 219–233. doi:10.1007/s00374-019-01413-3
Fang, Y., Singh, B. P., Farrell, M., Van Zwieten, L., Armstrong, R., Chen, C., et al. (2020b). Balanced Nutrient Stoichiometry of Organic Amendments Enhances Carbon Priming in a Poorly Structured Sodic Subsoil. Soil Biol. Biochem. 145, 107800. doi:10.1016/j.soilbio.2020.107800
Hafner, S., Unteregelsbacher, S., Seeber, E., Lena, B., Xu, X., Li, X., et al. (2012). Effect of Grazing on Carbon Stocks and Assimilate Partitioning in a Tibetan Montane Pasture Revealed by 13CO2 Pulse Labeling. Glob. Change Biol. 18, 528–538. doi:10.1111/j.1365-2486.2011.02557.x
Harris, D., Porter, L. K., and Paul, E. A. (1997). Continuous Flow Isotope Ratio Mass Spectrometry of Carbon Dioxide Trapped as Strontium Carbonate. Commun. Soil Sci. Plant Anal. 28, 747–757. doi:10.1080/00103629709369827
Huo, C., Luo, Y., and Cheng, W. (2017). Rhizosphere Priming Effect: A Meta-Analysis. Soil Biol. Biochem. 111, 78–84. doi:10.1016/j.soilbio.2017.04.003
Kerré, B., Hernandez-Soriano, M. C., and Smolders, E. (2016). Partitioning of Carbon Sources Among Functional Pools to Investigate Short-Term Priming Effects of Biochar in Soil: A 13C Study. Sci. Total Environ. 547, 30–38. doi:10.1016/j.scitotenv.2015.12.107
Kumar, A., Kuzyakov, Y., and Pausch, J. (2016). Maize Rhizosphere Priming: Field Estimates Using 13C Natural Abundance. Plant Soil 409, 87–97. doi:10.1007/s11104-016-2958-2
Kuzyakov, Y., and Bol, R. (2005). Three Sources of CO2 Efflux from Soil Partitioned by13C Natural Abundance in an Incubation Study. Rapid Commun. Mass. Spectrom. 19, 1417–1423. doi:10.1002/rcm.1938
Kuzyakov, Y., Ehrensberger, H., and Stahr, K. (2001). Carbon Partitioning and Below-Ground Translocation by Lolium Perenne. Soil Biol. Biochem. 33 (1), 61–74. doi:10.1016/S0038-0717(00)00115-2
Kuzyakov, Y. (2010). Priming Effects: Interactions between Living and Dead Organic Matter. Soil Biol. Biochem. 42 (9), 1363–1371. doi:10.1016/j.soilbio.2010.04.003
Kuzyakov, Y. (2002). Review: Factors Affecting Rhizosphere Priming Effects. J. Plant Nutr. Soil Sci. 165 (4), 66–70. doi:10.1002/1522-2624(200208)165:4<382::AID-JPLN382>3.0.CO;2-%23
Lal, R. (2004). Soil Carbon Sequestration Impacts on Global Climate Change and Food Security. Science 304, 1623–1627. doi:10.1126/science.1097396
Lin, G., Ehleringer, J. R., Rygiewicz, P. T., Johnson, M. G., and Tingey, D. T. (1999). Elevated CO 2 and Temperature Impacts on Different Components of Soil CO 2 Efflux in Douglas‐fir Terracosms. Glob. Change Biol. 5, 157–168. doi:10.1046/j.1365-2486.1999.00211.x
Lardner, T., George, S., and Tibbett, M. (2015). Interacting controls on innate sources of CO2 efflux from a calcareous arid zone soil under experimental acidification and wetting. J. Arid Environ. 122, 117–123. doi:10.1016/j.jaridenv.2015.07.001
Liu, S., Zhou, L., Li, H., Zhao, X., Yang, Y., Zhu, Y., et al. (2020). Shrub Encroachment Decreases Soil Inorganic Carbon Stocks in Mongolian Grasslands. J. Ecol. 108, 678–686. doi:10.1111/1365-2745.13298
Ma, J., Liu, R., and Li, Y. (2017). Abiotic Contribution to Total Soil CO2 Flux across a Broad Range of Land-Cover Types in a Desert Region. J. Arid Land 9, 13–26. doi:10.1007/s40333-016-0061-4
Meng, F., Dungait, J. A. J., Zhang, X., He, M., Guo, Y., and Wu, W. (2013). Investigation of Photosynthate-C Allocation 27 Days after 13C-Pulse Labeling of Zea mays L. At Different Growth Stages. Plant Soil 373, 755–764. doi:10.1007/s11104-013-1841-7
Meng, F., Lal, R., Kuang, X., Ding, G., and Wu, W. (2014). Soil Organic Carbon Dynamics within Density and Particle-Size Fractions of Aquic Cambisols under Different Land Use in Northern China. Geoderma Reg. 1, 1–9. doi:10.1016/j.geodrs.2014.05.001
Mubarak, A. R., and Nortcliff, S. (2010). Calcium Carbonate Solubilization through H-Proton Release from Some Legumes Grown in Calcareous Saline-Sodic Soils. Land Degrad. Dev. 21, 24–31. doi:10.1002/ldr.962
Phillips, D. L., and Gregg, J. W. (2003). Source Partitioning Using Stable Isotopes: Coping with Too Many Sources. Oecologia 136, 261–269. doi:10.1007/s00442-003-1218-3
Plestenjak, G., Eler, K., Vodnik, D., Ferlan, M., Čater, M., Kanduč, T., et al. (2012). Sources of Soil CO2 in Calcareous Grassland with Woody Plant Encroachment. J. Soils Sediments 12, 1327–1338. doi:10.1007/s11368-012-0564-3
Raza, S., Miao, N., Wang, P., Ju, X., Chen, Z., Zhou, J., et al. (2020). Dramatic Loss of Inorganic Carbon by Nitrogen‐induced Soil Acidification in Chinese Croplands. Glob. Change Biol. 26, 3738–3751. doi:10.1111/gcb.15101
Remus, R., and Augustin, J. (2016). Dynamic Linking of 14C Partitioning with Shoot Growth Allows a Precise Determination of Plant-Derived C Input to Soil. Plant Soil 408, 493–513. doi:10.1007/s11104-016-3006-y
Schindlbacher, A., Borken, W., Djukic, I., Brandstätter, C., Spötl, C., and Wanek, W. (2015). Contribution of carbonate weathering to the CO2 efflux from temperate forest soils. Biogeochemistry 124, 273–290. doi:10.1007/s10533-015-0097-0
Shahbaz, M., Kumar, A., Kuzyakov, Y., Börjesson, G., and Blagodatskaya, E. (2018). Priming Effects Induced by Glucose and Decaying Plant Residues on SOM Decomposition: A Three-Source 13C/14C Partitioning Study. Soil Biol. Biochem. 121, 138–146. doi:10.1016/j.soilbio.2018.03.004
Skidmore, M., Sharp, M., and Tranter, M. (2004). Kinetic Isotopic Fractionation during Carbonate Dissolution in Laboratory Experiments: Implications for Detection of Microbial CO2 Signatures Using δ13C-DIC. Geochim. Cosmochim. Acta 68, 4309–4317. doi:10.1016/j.gca.2003.09.024
Sun, Z., Wu, S., Zhang, Y., Meng, F., Zhu, B., and Chen, Q. (2019). Effects of Nitrogen Fertilization on Pot‐grown Wheat Photosynthate Partitioning within Intensively Farmed Soil Determined by 13 C Pulse‐labeling. J. Plant Nutr. Soil Sci. 182, 896–907. doi:10.1002/jpln.201800603
Tamir, G., Shenker, M., Heller, H., Bloom, P. R., Fine, P., and Bar-Tal, A. (2011). Can Soil Carbonate Dissolution Lead to Overestimation of Soil Respiration? Soil Sci. Soc. America J. 75, 1414–1422. doi:10.2136/sssaj2010.0396
Tian, J., Pausch, J., Yu, G., Blagodatskaya, E., and Kuzyakov, Y. (2016). Aggregate Size and Glucose Level Affect Priming Sources: A Three-Source-Partitioning Study. Soil Biol. Biochem. 97, 199–210. doi:10.1016/j.soilbio.2016.03.013
Wang, X. J., Xu, M. G., Wang, J. P., Zhang, W. J., Yang, X. Y., Huang, S. M., et al. (2014). Fertilization Enhancing Carbon Sequestration as Carbonate in Arid Cropland: Assessments of Long-Term Experiments in Northern China. Plant Soil 380, 89–100. doi:10.1007/s11104-014-2077-x
Wang, Z. Y., Xie, J. B., Wang, Y. G., and Li, Y. (2020). Biotic and Abiotic Contribution to Diurnal Soil CO2 Fluxes from Saline/Alkaline Soils. Sci. Rep. 10, 5396. doi:10.1038/s41598-020-62209-2
Weng, Z., Liu, X., Eldridge, S., Wang, H., Rose, T., Rose, M., et al. (2020). Priming of Soil Organic Carbon Induced by Sugarcane Residues and its Biochar Control the Source of Nitrogen for Plant Uptake: A Dual 13C and 15N Isotope Three-Source-Partitioning Study. Soil Biol. Biochem. 146, 107792. doi:10.1016/j.soilbio.2020.107792
Werth, M., and Kuzyakov, Y. (2010). 13C Fractionation at the Root-Microorganisms-Soil Interface: A Review and Outlook for Partitioning Studies. Soil Biol. Biochem. 42, 1372–1384. doi:10.1016/j.soilbio.2010.04.009
Whitman, T., and Lehmann, J. (2015). A Dual-Isotope Approach to Allow Conclusive Partitioning between Three Sources. Nat. Commun. 6, 8708. doi:10.1038/ncomms9708
Wu, H., Guo, Z., Gao, Q., and Peng, C. (2009). Distribution of Soil Inorganic Carbon Storage and its Changes Due to Agricultural Land Use Activity in China. Agric. Ecosyst. Environ. 129 (4), 413–421. doi:10.1016/j.agee.2008.10.0210.1016/j.agee.2008.10.020
Yin, L., Xiao, W., Dijkstra, F. A., Zhu, B., Wang, P., and Cheng, W. (2020). Linking Absorptive Roots and Their Functional Traits with Rhizosphere Priming of Tree Species. Soil Biol. Biochem. 150, 107997. doi:10.1016/j.soilbio.2020.107997
Yu, Z., Li, Y., Jin, J., Liu, X., and Wang, G. (2017). Carbon Flow in the Plant-Soil-Microbe Continuum at Different Growth Stages of Maize Grown in a Mollisol. Arch. Agron. Soil Sci. 63, 362–374. doi:10.1080/03650340.2016.1211788
Zamanian, K., and Kuzyakov, Y. (2019). Contribution of Soil Inorganic Carbon to Atmospheric CO2 : More Important Than Previously Thought. Glob. Change Biol. 25, e1–e3. doi:10.1111/gcb.14463
Zamanian, K., Zarebanadkouki, M., and Kuzyakov, Y. (2018). Nitrogen Fertilization Raises CO2efflux from Inorganic Carbon: A Global Assessment. Glob. Change Biol. 24, 2810–2817. doi:10.1111/gcb.14148
Zhu, B., and Cheng, W. (2011). 13C Isotope Fractionation during Rhizosphere Respiration of C3 and C4 Plants. Plant Soil 342, 277–287. doi:10.1007/s11104-010-0691-9
Zhu, B., Gutknecht, J. L. M., Herman, D. J., Keck, D. C., Firestone, M. K., and Cheng, W. (2014). Rhizosphere Priming Effects on Soil Carbon and Nitrogen Mineralization. Soil Biol. Biochem. 76, 183–192. doi:10.1016/j.soilbio.2014.04.033
Keywords: rhizosphere effect, soil inorganic carbon, soil organic carbon, three-source partitioning CO2, 13C isotope
Citation: Sun Z, Zhu B, Wang F, He M and Meng F (2021) Rhizosphere Effects of Maize and Wheat Increase Soil Organic and Inorganic Carbon Release in Carbonate-Rich Soils: A Three-Source 13C Partitioning Study. Front. Environ. Sci. 9:654354. doi: 10.3389/fenvs.2021.654354
Received: 18 January 2021; Accepted: 12 April 2021;
Published: 12 May 2021.
Edited by:
Lu-Jun Li, Northeast Institute of Geography and Agroecology (CAS), ChinaReviewed by:
Na Li, Northeast Institute of Geography and Agroecology (CAS), ChinaCarsten W. Mueller, University of Copenhagen, Denmark
Copyright © 2021 Sun, Zhu, Wang, He and Meng. This is an open-access article distributed under the terms of the Creative Commons Attribution License (CC BY). The use, distribution or reproduction in other forums is permitted, provided the original author(s) and the copyright owner(s) are credited and that the original publication in this journal is cited, in accordance with accepted academic practice. No use, distribution or reproduction is permitted which does not comply with these terms.
*Correspondence: Fanqiao Meng, mengfq@cau.edu.cn