High Crystal Number Densities From Mechanical Damage
 Amanda Lindoo
 Katharine V. Cashman
- School of Earth Sciences, University of Bristol, Bristol, United Kingdom
Laboratory experiments investigating syn-eruptive crystallization are fundamental for interpreting crystal and vesicle textures in pyroclasts. Previous experiments have advanced our understanding by varying decompression and cooling pathways, volatile components, and melt composition. However, they have largely failed to produce the high crystal number densities seen in many cryptodome and dome samples. This is feasibly due to the relatively simple decompression pathways employed in experimental studies. In this study, we approach the problem by exploring non-linear decompression pathways. We present two series of experiments: (1) decompression from low initial starting pressure and (2) a compression-and-release step after the initial decompression. The purpose of each series was to simulate (1) decompression of magma that stalls during ascent and (2) pressure cycling that occurs in non-erupted magma during episodic explosive activity. The experiments were carried out on a synthetic rhyodacite (SiO2 = 69 wt%) held initially at 50 MPa and 885°C then decompressed at rates of 0.026 and 0.05 MPa s−1 to 10 MPa A subset of experiments was then subjected to a compression step to 110 MPa followed by near-instantaneous release back to 10 MPa. A substantial volume fraction of dendritic microlites (ϕxtl = 0.27–0.32, Na = 4.79 × 103 mm–2) formed during the initial hold at 50 MPa; additional crystallization during subsequent decompression to ≥ 10 MPa was minimal, as evidenced by only small increases in crystallinity (ϕxtl = 0.28–0.33) and comparable crystal number densities (4.11–7.81 × 103 mm–2). Samples that underwent recompression followed by a second decompression showed no increase in crystal volume fraction but did show extensive disruption of the initial dendritic, box-work microlite structures that produced high number densities (Na = 43.5–87.2 × 103 mm–2) of small individual crystals. The disruption was driven by a combination of rapid vesiculation, expansion and resulting shear along the capsule walls. From these results, we suggest that high crystal number densities may be a signature of rapid deformation occurring after magma stalling in the subsurface, perhaps related to pressure cycling and accompanying rapid changes in vesicularity during repeated small and shallow-sourced explosions. We compare our experiments to pyroclasts from shallow intrusions that preceded the 18 May 1980 eruption of Mount St Helens. These pyroclasts were erupted both prior to 18 May, during episodic precursory explosive activity, and by the 18 May initial lateral blast. The pattern of precursory activity indicates multiple episodes of pressurization (prior to explosive events) and rapid decompression (during explosive events) that we use to illustrate the significance of our experimental results.
Introduction
When referenced against experimental equivalents, crystal and vesicle textures in the products of volcanic eruptions provide key insights into magmatic processes (Marsh, 1998; Hammer, 2008; Cashman, 2020). Experimental studies of H2O-saturated melts have underscored the importance of decompression rate in controlling crystal nucleation and growth (Hammer and Rutherford, 2002; Couch et al., 2003; Martel and Schmidt, 2003; Brugger and Hammer, 2010; Martel, 2012; Riker et al., 2015b; Befus and Andrews, 2018). Crystals can influence nucleation and growth of gas bubbles, the overall degassing efficiency of the magma, and therefore, the intensity of volcanic eruptions (e.g., Wright et al., 2009; Okumura et al., 2012; Martel and Iacono-Marziano, 2015; Lindoo et al., 2017; deGraffenried et al., 2019). For this reason, crystal and bubble textures are used to constrain threshold conditions that determine shifts in eruptive style. Key textural parameters are crystal number density (per area Na, or per volume Nv), volume fraction (ϕxtl), shape and size, all of which vary with rates of nucleation and growth (Hammer, 2008; Cashman, 2020). Of these, crystal number density is the most variable and therefore the most sensitive to decompression path. Importantly, with only a few exceptions (e.g., Martel, 2012), experimental Na’s (∼104 mm–2) are 1–2 orders of magnitude lower than the highest Na’s recorded in natural samples (>105 mm–2; Hammer and Rutherford, 2002; Riker et al., 2015b; Cashman, 2020). Moreover, the complex dendritic crystal textures that characterize experimental charges are rarely observed in volcanic pyroclasts.
It is well established that both initial conditions and decompression pathways affect final crystal textures (Shea and Hammer, 2013). In a recent review, Cashman (2020) speculated that because very high Na are found in samples that experienced non-linear decompression pathways (including both arrest and unloading), high Na may record pressure cycling within volcanic conduits (e.g., Melnik and Sparks, 2002; Cashman, 2004). Episodic explosions and gas-venting episodes that accompany volcanic activity are a manifestation of pressure cycling in the shallow conduit, as explosions require pressure build-up and sudden release. Although this is well known, the effect of pressure cycling on shallow magma has not been investigated experimentally. To fill this gap, we ran two series of experiments with non-linear decompression paths. One examines the effects of temporary magma arrest in the shallow conduit on the constituent crystal population, the other adds a recompression-decompression step to simulate a single cycle of pressurization-release. We assess the consequences of decompression path as manifested in the abundance and crystal form of plagioclase, the dominant mineral phase produced at low pressures (≤50 MPa). We then compare the results with those of finely crystalline (high Na) pyroclasts ejected from Mount St Helens during precursory explosions and the initial (blast) phase of the 18 May 1980 eruption.
Materials and Methods
Starting Material
To expand on previous decompression experiments, we use a synthetic, volatile-free analog to Mount St Helens Sugar Bowl rhyodacite (SB3: SiO2, 69.52; TiO2, 0.36; Al2O3, 16.05; FeOt, 3.36; MnO, 0.06; MgO, 0.83; CaO, 3.00; Na2O, 4.90; K2O, 1.81; P2O5, 0.10) for which phase relations and crystallization kinetics have been established (Riker et al., 2015a, b). Powdered SB3 was loaded into ∼25 mm long AuPd capsules along with enough water to saturate the melt at the starting pressure of 50 MPa (∼3.2 wt%). The capsules were triple crimped shut and weighed. Then the crimps were welded and the capsule weighed again to check for water loss. The triple crimp was extended a third of the way down the capsule to form a torpedo shape. This shape confines the sample within the lower half of the capsule so that it maintains a cylindrical shape. The extra headspace accommodated by the capsule fins prevents capsule rupture because of gas expansion at low final pressures. The capsule was put in an oven overnight and weighed again before the experiment to verify the integrity of the weld.
Experimental Method
Capsules were placed into a cup welded onto the end of an Inconel rod. Magnets welded into the opposite end allowed the rod to be manually raised and lowered within the pressure vessel via an external ring magnet (Ihinger, 1991). The experiments were pressurized to 50 MPa and then heated to 885°C. Two experiments were held at 50 MPa for 24 and 72 h and subsequently quenched to establish baseline textures for comparison with the decompression results. Two sets of decompression experiments were performed which we refer to as “static” and “dynamic.” “Static” refers to the conventional process of decompressing the experiment to a final pressure and dropping the sample into the water-cooled region using the external magnet either immediately or after annealing at the final pressure. “Dynamic” refers to pressure cycling that involved recompression and a second decompression. Experiments in both series were held for 24 h before decompression. Of the static series, three experiments were decompressed from 50 to 10 MPa at a continuous decompression rate of 0.026 MPa s–1 (Supplementary Figure 1). One of the three experiments was quenched immediately upon reaching final pressure, while the other two were held for 1 and 6 h prior to quench. Another experiment was decompressed from 50 to 10 MPa at a continuous rate of 0.05 MPa s–1 and immediately quenched. In the dynamic series, four experiments were performed. Two experiments were decompressed continuously at a rate of either 0.026 or 0.05 MPa s–1 from 50 to 10 MPa followed by a compression step to 110 MPa and quench at high pressure (Supplementary Figure 1, D1). Although the pressure increase to 110 MPa is in excess of what we expect in a volcanic conduit, this value was constrained by the experimental apparatus. Two experiments were decompressed continuously at 0.05 MPa s–1 from 50 to 10 MPa, immediately (within 15 s) compressed to 110 MPa and then unloaded (within 2–3 s) back to 10 MPa and quenched (Supplementary Figure 1, D2).
Capsules from static runs maintained their torpedo shape throughout the experiment and the quenched samples remained concentrated in the lower half of the capsule, with no melt migrating into the capsule “fins.” The experimental slugs often broke along their widths (horizontally) while being extracted from the AuPd tubing, so that sections were taken from the middle of the experiments for textural analyses. Quenched samples from dynamic experiments, in contrast, had variable capsule shapes and melt configurations. Capsules from recompression experiments (D1) were compressed inwards. Capsules from experiments that underwent a second decompression (D2) were similar in appearance to static experiments (i.e., re-inflated), although in one of these experiments melt migrated into the capsule fins. To document lateral variability, we examined the entire length of D2 samples to look for textural heterogeneities.
Textural Measurements
Back-scattered electron (BSE) images were collected from carbon-coated polished thick sections on a Hitachi S-3500N scanning electron microscope or JEOL JXA8530F Hyperprobe at the University of Bristol. Image magnifications were selected based on a 15-image nesting strategy outlined in Shea et al. (2010). To resolve both microlites and vesicles we used magnifications of 40×–2,000×. The images were segmented in Adobe Photoshop, so that each phase corresponded to one digital grayscale value. Plagioclase microlites had similar grayscale values to the surrounding glass, which made automated analysis impossible, in spite of our attempts to use a trainable segmentation plugin (Lormand et al., 2018)1. For this reason, we outlined plagioclase microlites manually. Segmented images were analyzed in ImageJ2 for microlite areas, widths, and lengths along with vesicle areas. The data from ImageJ were used to calculate microlite and vesicle area fraction, vesicle size distributions, microlite and vesicle number densities, and microlite aspect ratios. We also used a plugin to derive vesicle shape parameters (Liu et al., 2015).
Importantly, all of our experiments yielded complex dendritic plagioclase microlites that are not easily characterized by single shape factors. For example, sub-parallel arrangements of acicular microlites are likely to comprise a single crystal in three-dimensions (Supplementary Figure 2), which complicates accurate measurement of number density and microlite lengths. While recognizing this limitation, we estimated Na for the 24 h baseline experiment, two static experiments and three dynamic experiments to quantify the effects of pressure cycling by counting sub-parallel crystals as a singular crystal. In the dynamic experiments, most dendritic networks were disrupted so that it was more straightforward to count each crystal (Table 1 and Supplementary Figure 3).
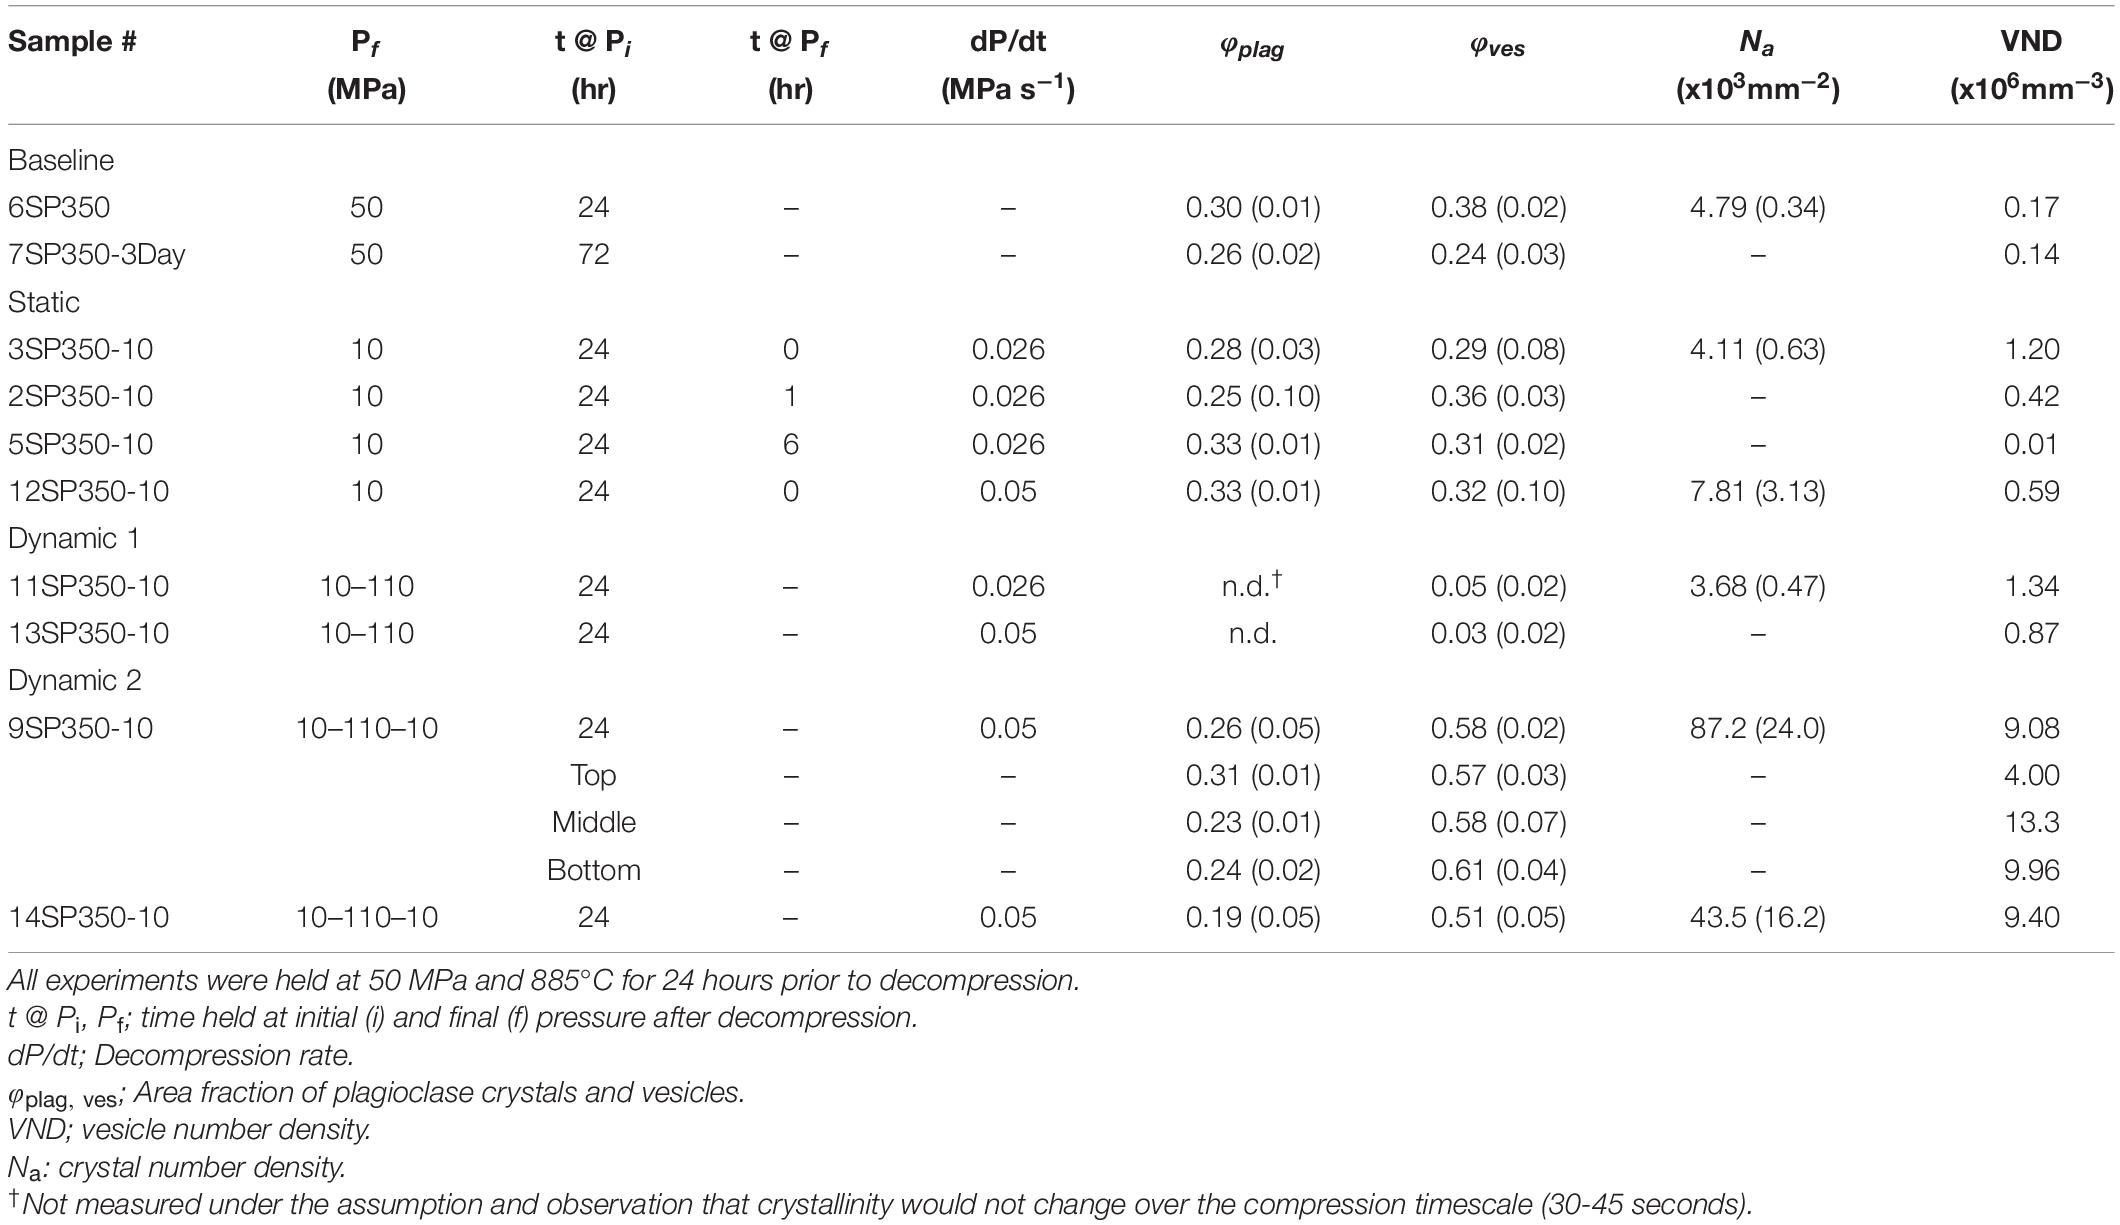
Table 1. Experimental run conditions and textures.
Results
Plagioclase is the dominant microlite phase in our experiments (accounting for > 90% of the total crystallinity) and the focus of our analysis. Iron-oxides account for much of the remaining crystallinity, although the experimental charges also include orthopyroxene and a Si-phase. Sample vesicularity varies as a function of decompression path (Figure 1).
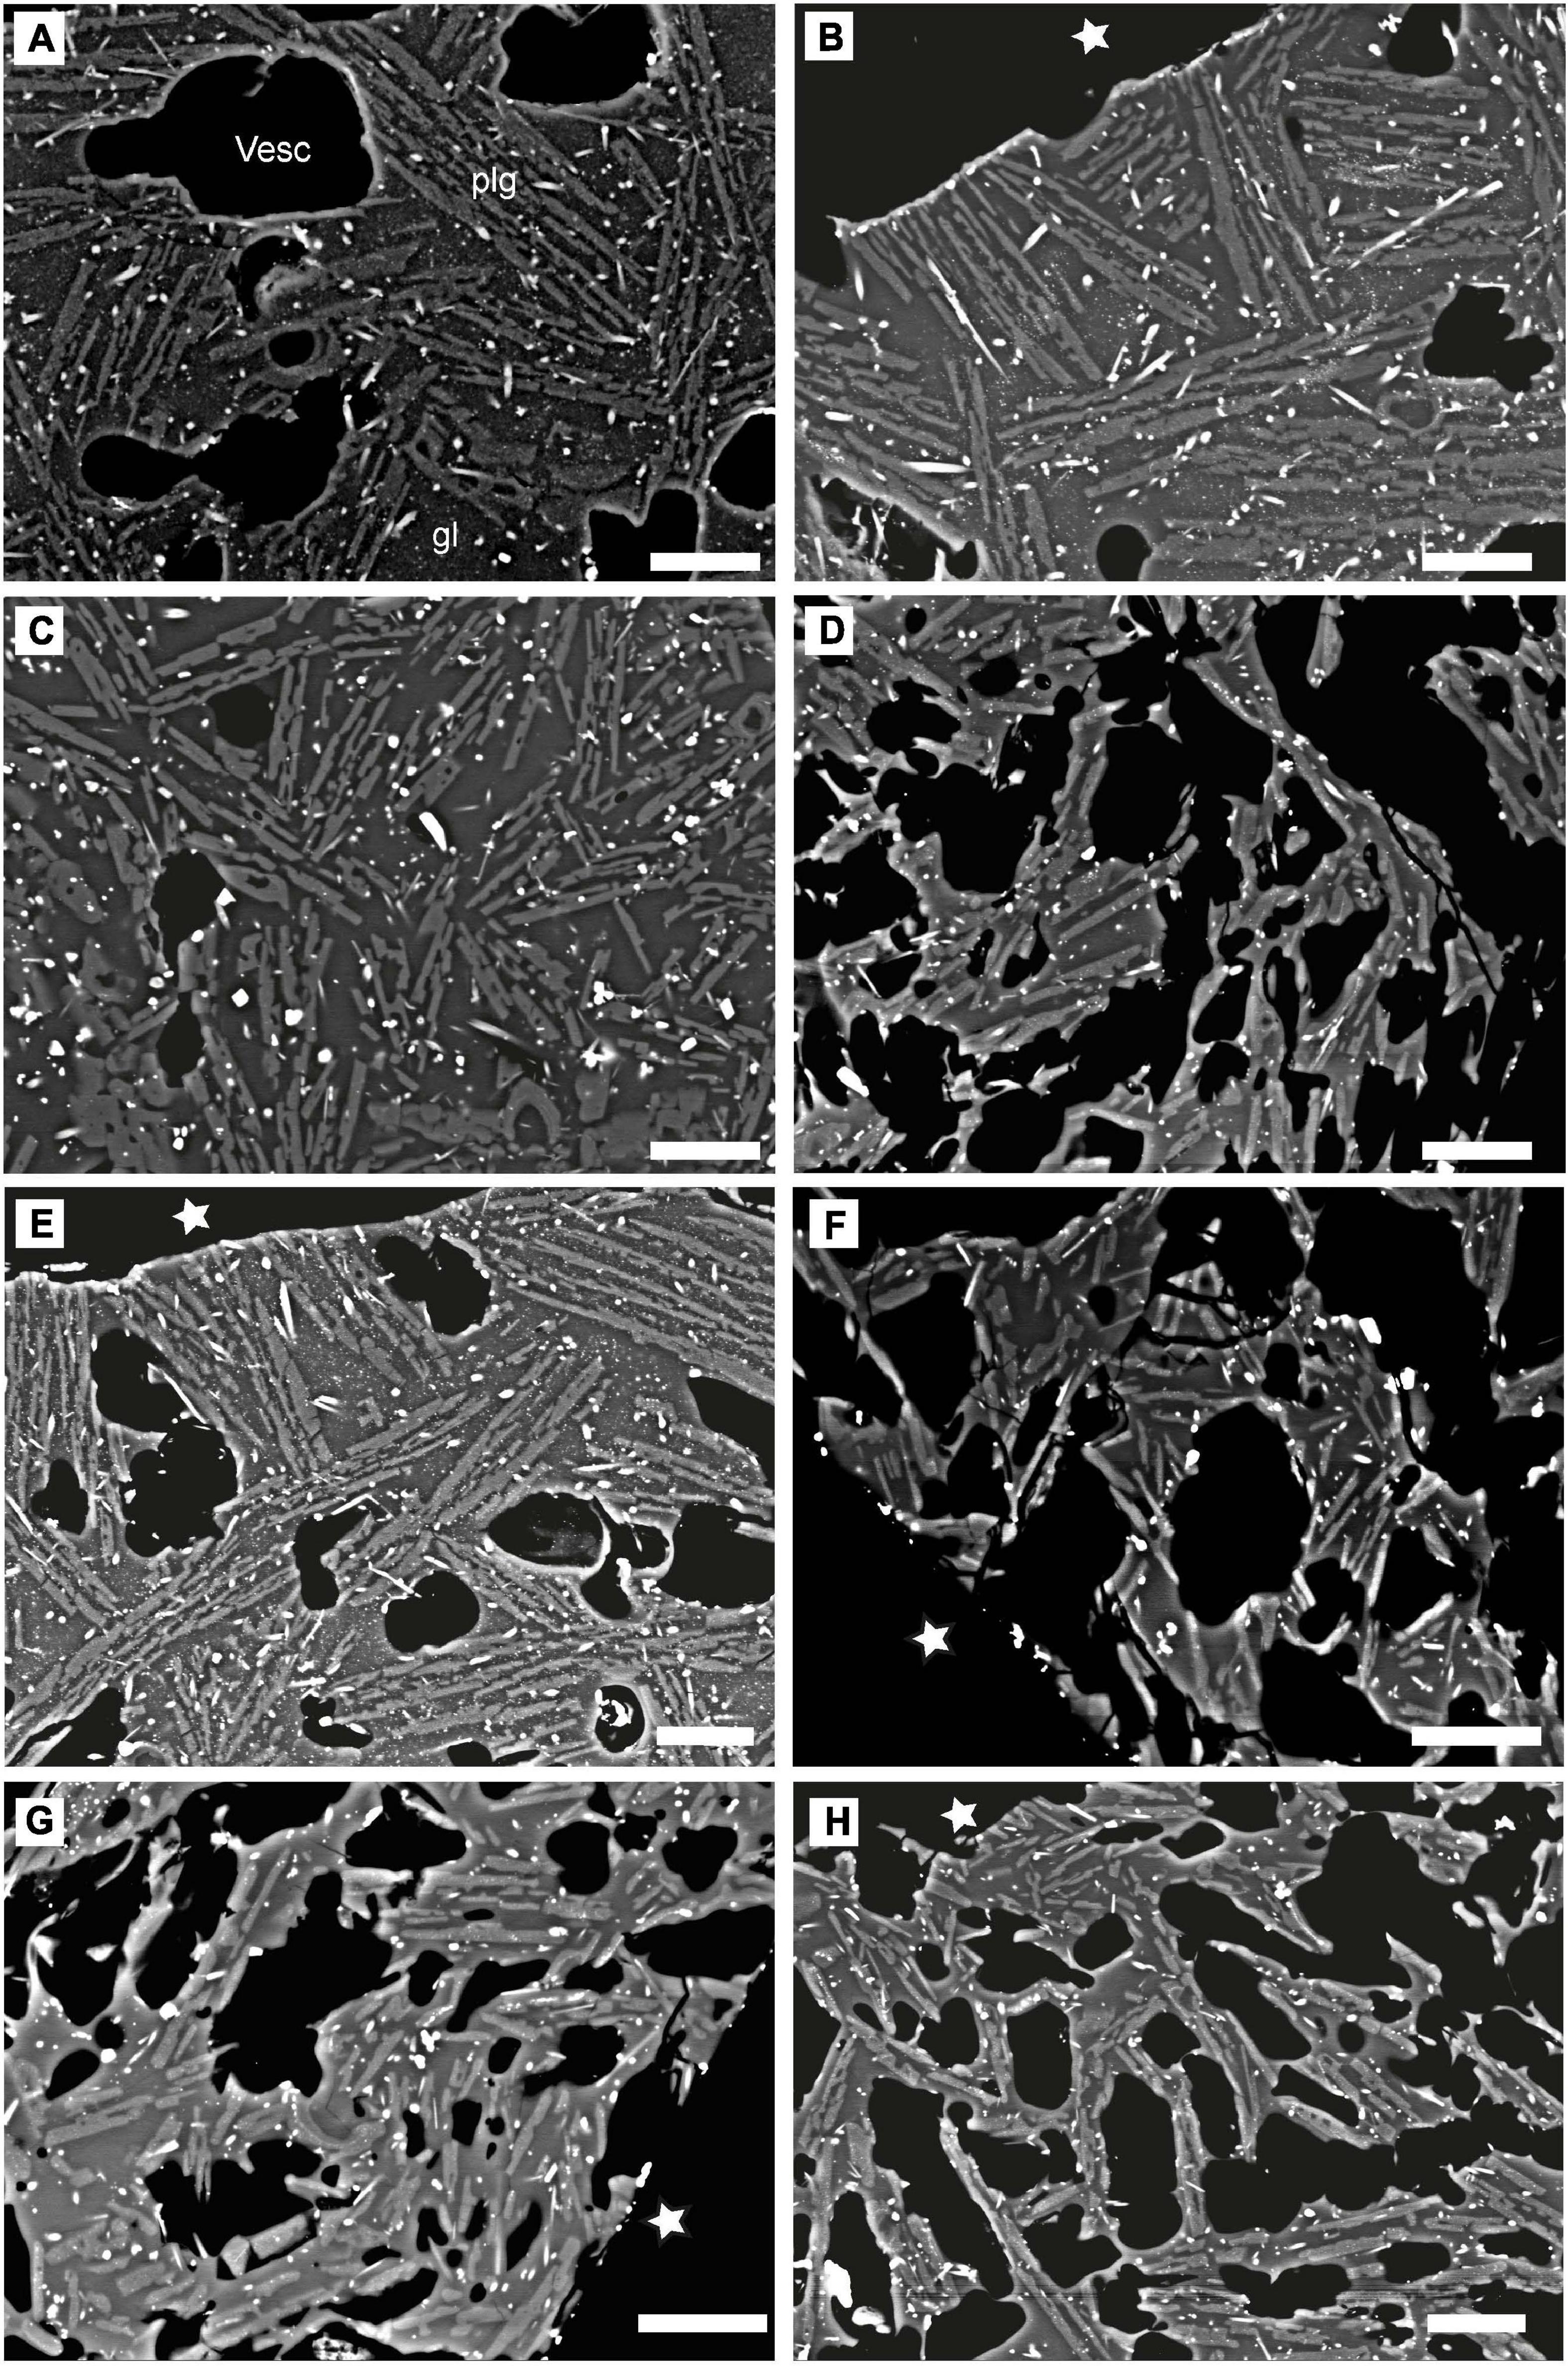
Figure 1. Plagioclase textures observed in experiments. (A) Baseline experiment held for 24 h at 50 MPa. (B,E) Experiment continuously decompressed from 50 to 10 MPa at 0.026 MPa s–1. (C) Re-compression to 110 MPa. (D) Experiment after decompressing from 110 MPa to 10 MPa. (F) Top, (G) middle, and (H) bottom sections, respectively, of dynamic compression experiment 9SP350-10. Stars mark the boundary of the quenched experiment with the capsule wall. Vesicles (vesc), plagioclase microlites (plg), and glass are denoted in image (A). The white pixels are Fe-oxides. Scale bar corresponds to 10 μm and applies to all eight images.
Baseline Experiments
Baseline experiments at 50 MPa vary in both crystallinity and bulk vesicularity depending on hold time; interestingly, both decrease with increasing time at pressure. For example, after 24 h samples had crystallinities of ϕxtl = 0.31 ± 0.01 and vesicularities of ϕves = 0.38 ± 0.02 (Figure 1A), while after 72 h ϕxtl = 0.26 ± 0.02 and ϕves = 0.24 ± 0.03 (Table 1). The estimated crystal number density after 24 h is Na = 4.79 ± 0.34 × 103 mm–2. Crystals in both 24 and 72 h experiments exhibit dendritic morphology. Vesicle size distributions (VSD) of the baseline experiments at 50 MPa are bimodal (Figure 2). This bimodality is due to large hydration bubbles (diameter ≥ 200 μm) inherited from pore spaces in the powdered sample. The baseline experiment held at 50 MPa for 72 h, in contrast, has a unimodal VSD that, together with the decrease in vesicularity, suggests gas loss to the capsule fin. However, the 24 and 72 h experiments have similar vesicle number densities (VND) of VND = 0.17 × 10⁶ and 0.14 × 106 mm–3, respectively.
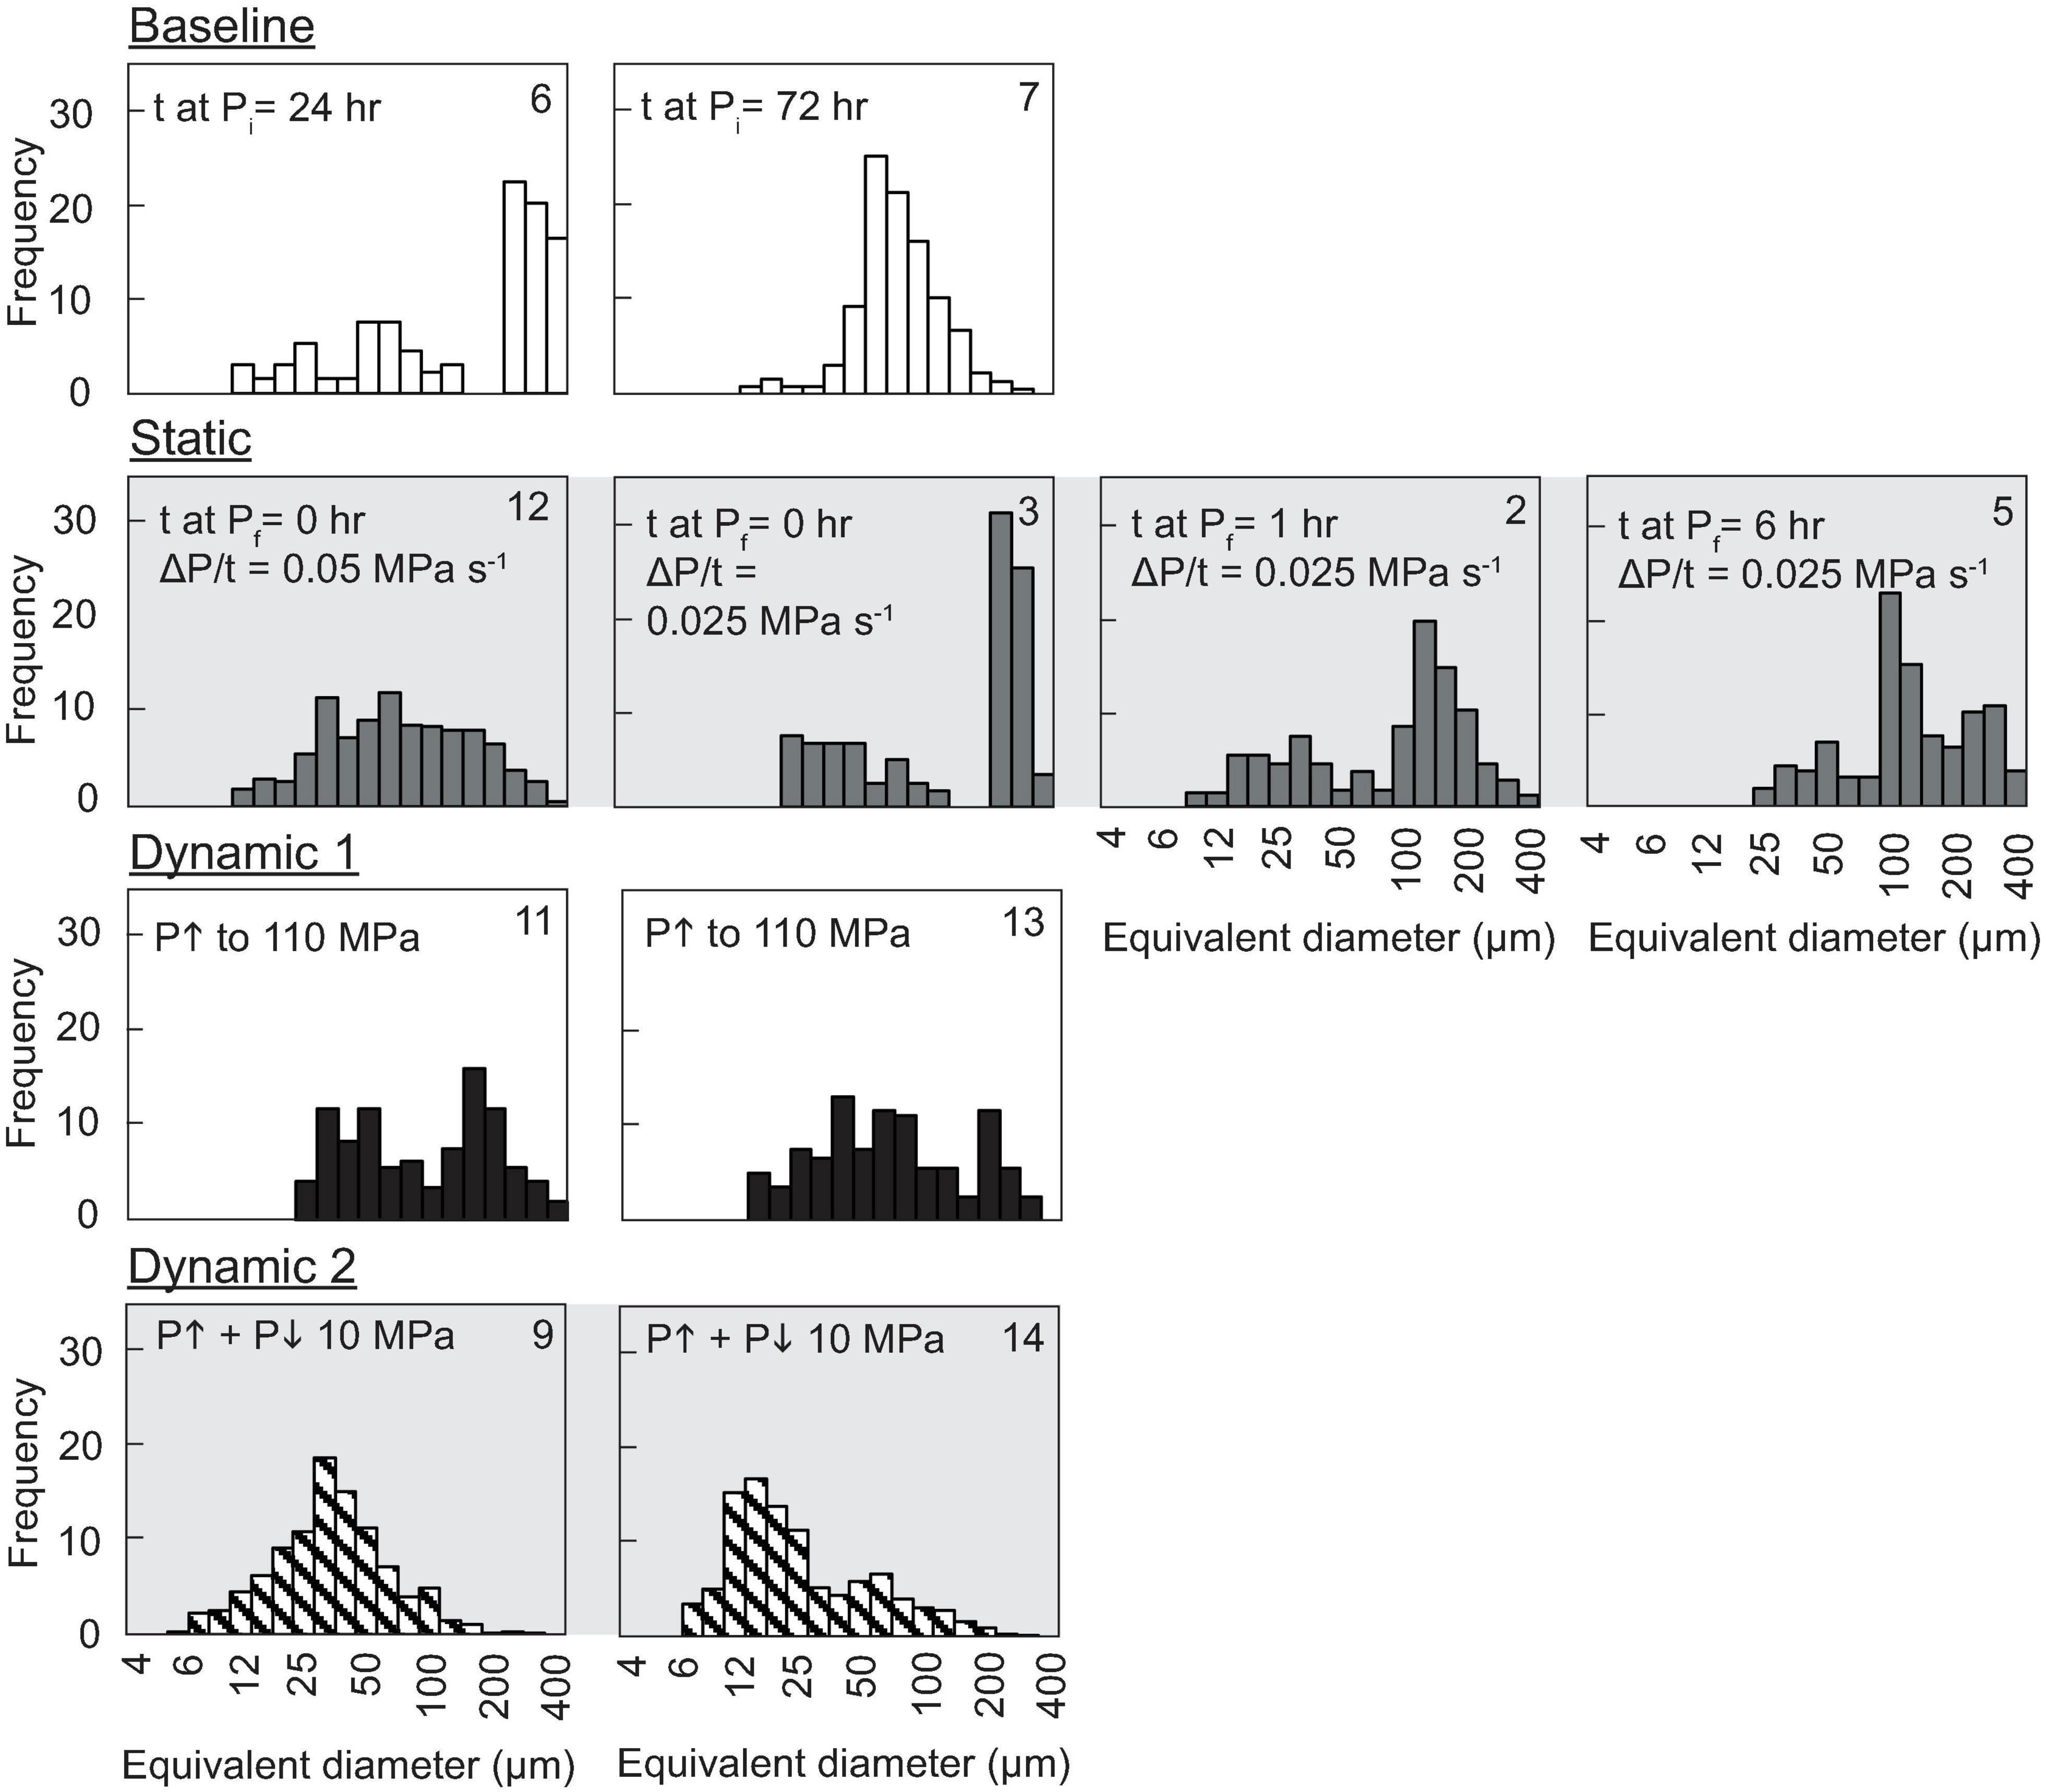
Figure 2. Vesicle size distributions. Sample numbers have been abbreviated and are listed in the right-hand corner of each histogram. Colors of bar graphs correspond to baseline (white), static (gray), D1 (black) and D2 (hatched) experiments. Text in the left-hand corners communicate differences between experiments in the same experimental set. Full detail on experimental conditions are listed in Table 1.
Static Experiments
Samples decompressed at a rate of 0.026 MPa s–1 and held at 10 MPa for 0 and 1 h have ϕxtl = 0.26 ± 0.02 and 0.27 ± 0.02, respectively; these values are within error of the 72 h baseline experiments. The experiment held at 10 MPa for 6 h showed an increase in crystallinity to ϕxtl = 0.33 ± 0.02. An increase in decompression rate to 0.05 MPa s–1 produced the same crystallinity within error (ϕxtl = 0.34 ± 0.02). The estimated crystal number density (Na = 7.81 ± 3.13 × 103 mm–2) is slightly higher yet within error of the 0.025 MPa s–1 experiment (Na = 4.11 ± 0.63 × 103 mm–2). In all experiments plagioclase microlites are dendritic; the widths of dendritic microlite arms average 1.3 μm ± 0.1 (Figures 1B,E). The crystal aspect ratios for static experiments follow a normal distribution centered at length/width = 3.7, but cuts off below 1.5 (Figure 3, static). Decompression to 10 MPa does not change the bulk vesicularity significantly (ϕves = 0.29 ± 0.08 and 0.32 ± 0.10; Table 1) but vesicle number densities increase (VND = 1.20 × 10⁶ and 0.59 × 106 mm–3, respectively). Decompression experiments that were held for an hour or longer at Pf = 10 MPa, however, show gradual bubble coalescence over time (Figure 2, static and Supplementary Figure 4), which is reflected in a decrease in vesicle number density (VND = 0.42 × 10⁶ and 0.01 × 106 mm–3 for 1 and 6 h anneal times at Pf).

Figure 3. Frequencies of microlite aspect ratios. Histograms of aspect ratios from static experiments (3SP350-10 and 12SP350-10, gray bars) are compared with those found in a D2 experiment (9SP350-10, stacked yellow and blue bars). Yellow bars represent aspect ratios measured within 10’s of microns from the capsule-magma interface. Blue bars represent aspect ratios measured in images collected from the interior of the quenched experiment. An increase in the relative frequency of equant, lower aspect ratio microlites was found in the experiment that underwent a second decompression. Critically, the smallest aspect ratios were found along the capsule walls (yellow bars, D2–edge) vs. the middle (blue bars, D2–middle).
Dynamic Experiments
To understand the more complicated decompression path in these experiments, we first report the results of the compression step (D1) and then the results of the combined compression-release experiments (D2).
Compression to 110 MPa caused the experimental capsules to deform; this deformation squeezed the experimental magmas throughout the lower section of the capsule. Surprisingly, microlites in these samples show no clear evidence of alignment or breakage (Figure 1C). The crystal number density for sample 11SP350-10 (Na = 3.68 ± 0.46 × 103 mm–2), for example, is within error of static experiment values (Table 1). We therefore conclude that the (rapid) compression step had no observable effect on the crystal texture. Bulk vesicularities decreased to ϕves < 0.10 (Table 1; D1) while vesicle number densities (1.34 × 10⁶ and 0.87 × 106 mm–3) were similar to static experiments quenched immediately after decompression.
A near instantaneous pressure release to 10 MPa after compression, in contrast, caused the most striking textural difference seen within the experiments (Table 1, D2 and Figures 1D,F–H). Most consequential is a dramatic change in crystal habit as a result of the disruption of the delicate and complex dendritic crystal structure. Qualitatively, the extent of disruption appears to vary with distance from the capsule wall. Along the margins of the magma-capsule interface (stars in Figures 1F–H), groupings of sub-parallel plagioclase microlites, which we interpret to be single crystals in three-dimensions, are largely obliterated and microlites are randomly oriented with respect to their neighbors. In the interior of the experiment, 10’s of microns away from the capsule wall, the disruption is less severe, but groups of crystals (branches of one single crystal) are shorter than in the static experiments decompressed to the same pressure. Crystal breakage skews the aspect ratio distribution positively (Figure 3, D2), with the most equant microlites found near the capsule wall (Figure 3, D2–edge). The volume fraction of plagioclase crystals, in contrast, is within error of that observed in the static experiments although highly variable (high standard deviation in ϕxtl), reflecting the high degree of spatial heterogeneity throughout the length of the dynamic experiments, with the top portion (fin, Figure 1F) showing much smaller and simpler crystals than samples residing in the middle or lower part of the capsule (Figures 1G,H). The latter have some of the lowest observed crystallinities in all experiments (ϕxtl = 0.23 ± 0.01 and 0.24 ± 0.02) while the top section is more microlite-rich (ϕxtl = 0.31 ± 0.01). Importantly, similar spatial heterogeneity is found throughout the middle section of the replicate D2 experiment (14SP350-10).
Also notable is the change in the vesicle population of the D2 experiments, where vesicularities of ϕves = 0.58 ± 0.02 and 0.51 ± 0.05 are ≥ 17% higher than those in static experiments (ϕves = 0.28 ± 0.07) due to a nucleation event during final pressure release (Figure 2 and Supplementary Figure 4). Bubble nucleation is indicated by higher vesicle number densities (∼107 vesicles mm–3) and a right-skewed vesicle size distribution (Figure 2; Sample 14SP350-10). Furthermore, both D2 experiments show characteristic negative crystal shapes where bubble expansion is accommodated by deformation within the crystal network (Supplementary Figure 4). That this is not apparent in measurements of vesicle shape parameters is a consequence of the high vesicle shape variability within samples (Supplementary Figure 5).
Discussion
Experimental Textures
Plagioclase textures in the baseline and static experiments are comparable to those in water-saturated, single-step decompression experiments performed on the same composition but from a starting pressure of 200 MPa (Riker et al., 2015a, b). Both baseline experiment crystallinities are within error of phase equilibria experiments at 50 MPa and display similar dendritic morphology. An experiment held at 10 MPa for 6 h has a slightly higher crystallinity that suggests a small amount of additional crystallization. Because the crystallinities of our decompression experiments are similar to the initial (baseline) values, although the crystallinity of the sample decompressed at a rate of 0.05 MPa s–1 is slightly higher (but within error), we assume little to no crystallization occurred during decompression (13–26 min) or within 1 h of dwell time after reaching 10 MPa. Our estimated crystal number densities support this assumption. The limited new crystal nucleation and growth and the dendritic form of microlites are most likely a result of sluggish kinetics at relatively high melt viscosity (Hammer and Rutherford, 2002). From this we concur with Cichy et al. (2011) that crystallization processes in silicic magmas, and therefore microlite size, shape, and abundance, are largely set at depth.
To the authors’ knowledge, only one other study has experimentally investigated silicic magma decompression and crystallization from an initial pressure of 50 MPa (Martel and Schmidt, 2003). Here decompression from 50 to 15 MPa preserved a stable plagioclase abundance of ϕxtl = 0.20–0.25 over 5-orders of magnitude variation in decompression rate. Na-values also remained stable, except for an experiment decompressed at 2 MPa s–1, where incomplete water exsolution yielded a lower plagioclase number density. We do not want to overinterpret the results of Martel and Schmidt (2003), especially as they also report difficulty estimating Na, but this observation implies that increasing the decompression rate to > 0.05 MPa s–1 would not produce higher plagioclase number densities, and certainly not on the order of magnitude required to be comparable to those of dome or cryptodome samples. Therefore, another mechanism besides rapid, decompression-induced crystallization from ≤ 50 MPa must be invoked to explain high Na (Nv) pyroclasts.
High Microlite Number Densities a Result of Mechanical Breakage
The visual contrast in crystal textures observed in the static and dynamic experiments (Figure 1) can be quantified using both variations in crystal shape (Figure 3) and crystal number densities. Figure 4 compares Na of one baseline (6SP350-10), two static experiments (3SP350-10 and 12SP350-10) and two dynamic experiments (D2; 9SP350-10 and 14SP350-10; Table 1). At 4.11–7.81 × 103 mm–2, Na-values for the static experiments are similar to those reported by Riker et al. (2015b) for single-step decompression from 200 to 50 and 25 MPa at a rate of 0.0002–0.002 MPa s–1. Measured Na-values for the D2 experiments, in contrast, are nearly an order of magnitude higher (43.5–87.2 × 103 mm–2; Figure 4), an increase that appears to be a consequence of extensive crystal breakage.

Figure 4. Textural data from experimental samples and eruption products compared with this study. Counting parallel microlites in static (S) and D1(recompression) experiments as single crystals (Supplementary Figure 3) results in number densities similar to the experimental study of Riker et al (R15; 2015b). An apparent increase in crystallinity due to broken dendrites accounts for the order of magnitude difference in experimental (D2) samples. D2 experiments are comparable to MSH blast dacite (MSH blast) and ash (Pre-18 May) samples. Data from additional experimental samples are from Martel and Schmidt (2003; MS03), Martel (2012; M12). Natural sample data from Hammer et al (1999; H99), and Martel and Poussineau (2007; MP07).
Experiments are inherently simplified due to the limitations of the cold-seal pressure vessel apparatus. Most notably absent in typical decompression experiments is shear. Although natural samples provide ample evidence for shear, including pervasive flow banding and microstructural evidence of shear dilatancy (Smith, 2002), the role of shear has been largely overlooked in cold-seal experiments except when manifested as bubble deformation due to bubble expansion or shrinkage and capsule deformation (Larsen and Gardner, 2000; Burgisser and Gardner, 2004; Mongrain et al., 2008; Marxer et al., 2015). The compression and unloading steps that we imposed in our experiments caused physical changes in the distribution of melt and bubbles within the capsule and therefore some degree of shear stress.
To evaluate conditions of deformation accompanying our experiments, we first examine the vesicle population. During the initial decompression, which used relatively slow decompression rates (0.026–0.05 MPa s–1), bulk vesicularity remained essentially constant. This, along with the gradual decrease in bulk vesicularity accompanying extended hold periods at low pressure, reflects moderate outgassing. Under these conditions, we suggest that the high aspect ratio and considerable area fraction of the dendrites may have allowed the crystals to resist bubble expansion (i.e., the threshold for random loose packing was met; Martel and Schmidt, 2003; Oppenheimer et al., 2015; Lindoo et al., 2017), although the crystal framework may also have facilitated the development of permeable pathways (outgassing). Alternative explanations for the relatively low vesicularities are degassing due to bubble rise or disequilibrium degassing. Bubble rise seems unlikely given the high crystallinity and high melt viscosity; disequilibrium degassing is also unlikely as our decompression rates are nearly an order of magnitude slower than those found to prevent equilibrium degassing in silicic compositions (>0.25 MPa s–1; Gardner et al., 1999; Martel and Schmidt, 2003; Burgisser and Gardner, 2004). Therefore we assume low vesicularities are a result of outgassing.
Compression decreased the experimental capsule diameter by collapsing the capsule walls, which displaced the partially molten sample within the lower half of the capsule. Interestingly, this displacement did not appear to cause crystal breakage, crystal alignment or bubble elongation (Figure 1C). The subsequent near-instantaneous pressure drop, in contrast, favored bubble nucleation and expansion over growth of pre-existing bubbles, as manifested in the increase in both vesicularity and the number of small vesicles in the experimental charges. Expansion caused by the added volume of new bubbles (ϕves = 0.51–0.61) displaced the sample vertically into the upper half of the capsule. Critically, this rapid expansion provides some insight into the effect on dendrites of the resulting shear, most obviously in the destruction of delicate dendritic fabrics (compare Figure 1C with Figures 1D,F–H). Dendrite disruption is quantitatively revealed in measurements of crystal aspect ratios, which are lower (more equant) in the D2 samples (Figure 3, static vs. D2 and Supplementary Figure 3), although relic microlites with higher aspect ratios show that the breakage was not complete.
Given that the crystals survived capsule deformation upon compression, we attribute the breakage to rapid bubble expansion caused by instantaneous decompression. Possible mechanisms of crystal breakage during expansion include crystal-crystal interactions, viscous flow within the bubble-melt shell, and/or strain due to coupling of the melt and crystals during vesiculation (Pallister et al., 1996; Lensky et al., 2004). In this regard, an important observation is the concentration of broken (low aspect ratio) and jumbled crystals along the capsule walls (Figure 3, D2 edge vs. middle). These observations suggest that the extent of crystal breakage is related to the shear gradient imposed across the long axis of the capsule during volume expansion. To explore the expansion hypothesis, we estimated the elongational strain in dynamic experiments by dividing the vertical change in sample height (from the bulk volume increase) by the initial height. We then calculated strain rates using the approximate duration of the pressure step. Compression from 10 to 110 MPa occurred over 10–20 s; pressure release back to 10 MPa was considerably shorter at 2–3 s. During the compression step, calculated bulk strain rates are 0.02–0.04 s–1. Bulk strain rates during the unloading step are an order of magnitude higher at 0.5–0.7 s–1 and slighty higher than vesiculation-induced strain rates ∼0.001–0.4 s–1 reported in other crystal-free experiments (Larsen and Gardner, 2000; Mongrain et al., 2008).
In summary, pressure cycling dramatically altered experimental crystal textures by disrupting complex crystal forms. This disruption is manifested in a crystal population with smaller and simpler individual crystals present at higher number densities. Is there evidence for similar processes in natural pyroclasts?
Mount St Helens
The complex dendritic textures observed in our static experiments are a departure from those found in pyroclasts, which typically have a much simpler form. This invites the obvious question of why box-work, dendritic crystals are rare in natural samples, especially given abundant evidence for shallow conduit storage prior to eruption in many volcanic systems. An additional question relates to the ability of the fragile dendritic structures to withstand sudden magma decompression and transport within the volcanic conduit.
We address this question using pyroclasts from both precursory explosions and the climactic eruption of Mount St Helens on 18 May 1980. Evidence for pressure cycling of magma intruded within the edifice comes from patterns of precursory activity, which included 2 months of unrest that involved intense seismicity and extreme deformation of the volcano’s north flank (system pressurization) and episodic phreatomagmatic explosions (rapid depressurization of the shallow system; Christiansen and Peterson, 1981) that emitted juvenile pyroclasts from the growing cryptodome (Cashman and Hoblitt, 2004). The lateral blast that marked the opening phases of the climactic eruption produced a deposit dominated by “blast dacite” clasts from the cryptodome; these show evidence for pre-eruptive degassing, extreme densification (pressurization) and at least two vesiculation events (Hoblitt and Harmon, 1993).
The Mount St Helens 18 May 1980 blast dacite is composed of two texturally distinct populations of juvenile material: (1) a dense (average ρ = 2,300 kg m–3, average ϕves = 0.12), black, micro-crystalline dacite and (2) a gray, more vesicular [average ρ = 1,600 kg m–3, average ϕves = 0.38, 0.63 (maximum)], microlite-rich dacite (Hoblitt and Harmon, 1993; Figures 5A–D and Table 2). The dense black dacite has higher crystallinities (ϕxtl ≤ 0.48) and crystal number densities (≤1.8 × 105 mm–2) than the gray dacite (ϕxtl = 0.30–0.40; 4–6 × 104 mm–2; Cashman and Hoblitt, 2004). Plagioclase microlites in the dense dacite are commonly aligned and can show evidence of dilatancy (e.g., Smith, 2000; Figures 5A,C). Alignment of plagioclase microlites is less obvious in the gray dacite clasts, which have lower crystallinities, variable microlite sizes and shapes, and abundant vesicles (Figures 5B,D). The relatively low crystallinity of the latter samples, together with the elongate (in BSE) and often hopper-like crystal forms suggest rapid decompression, most likely from > 50 MPa.
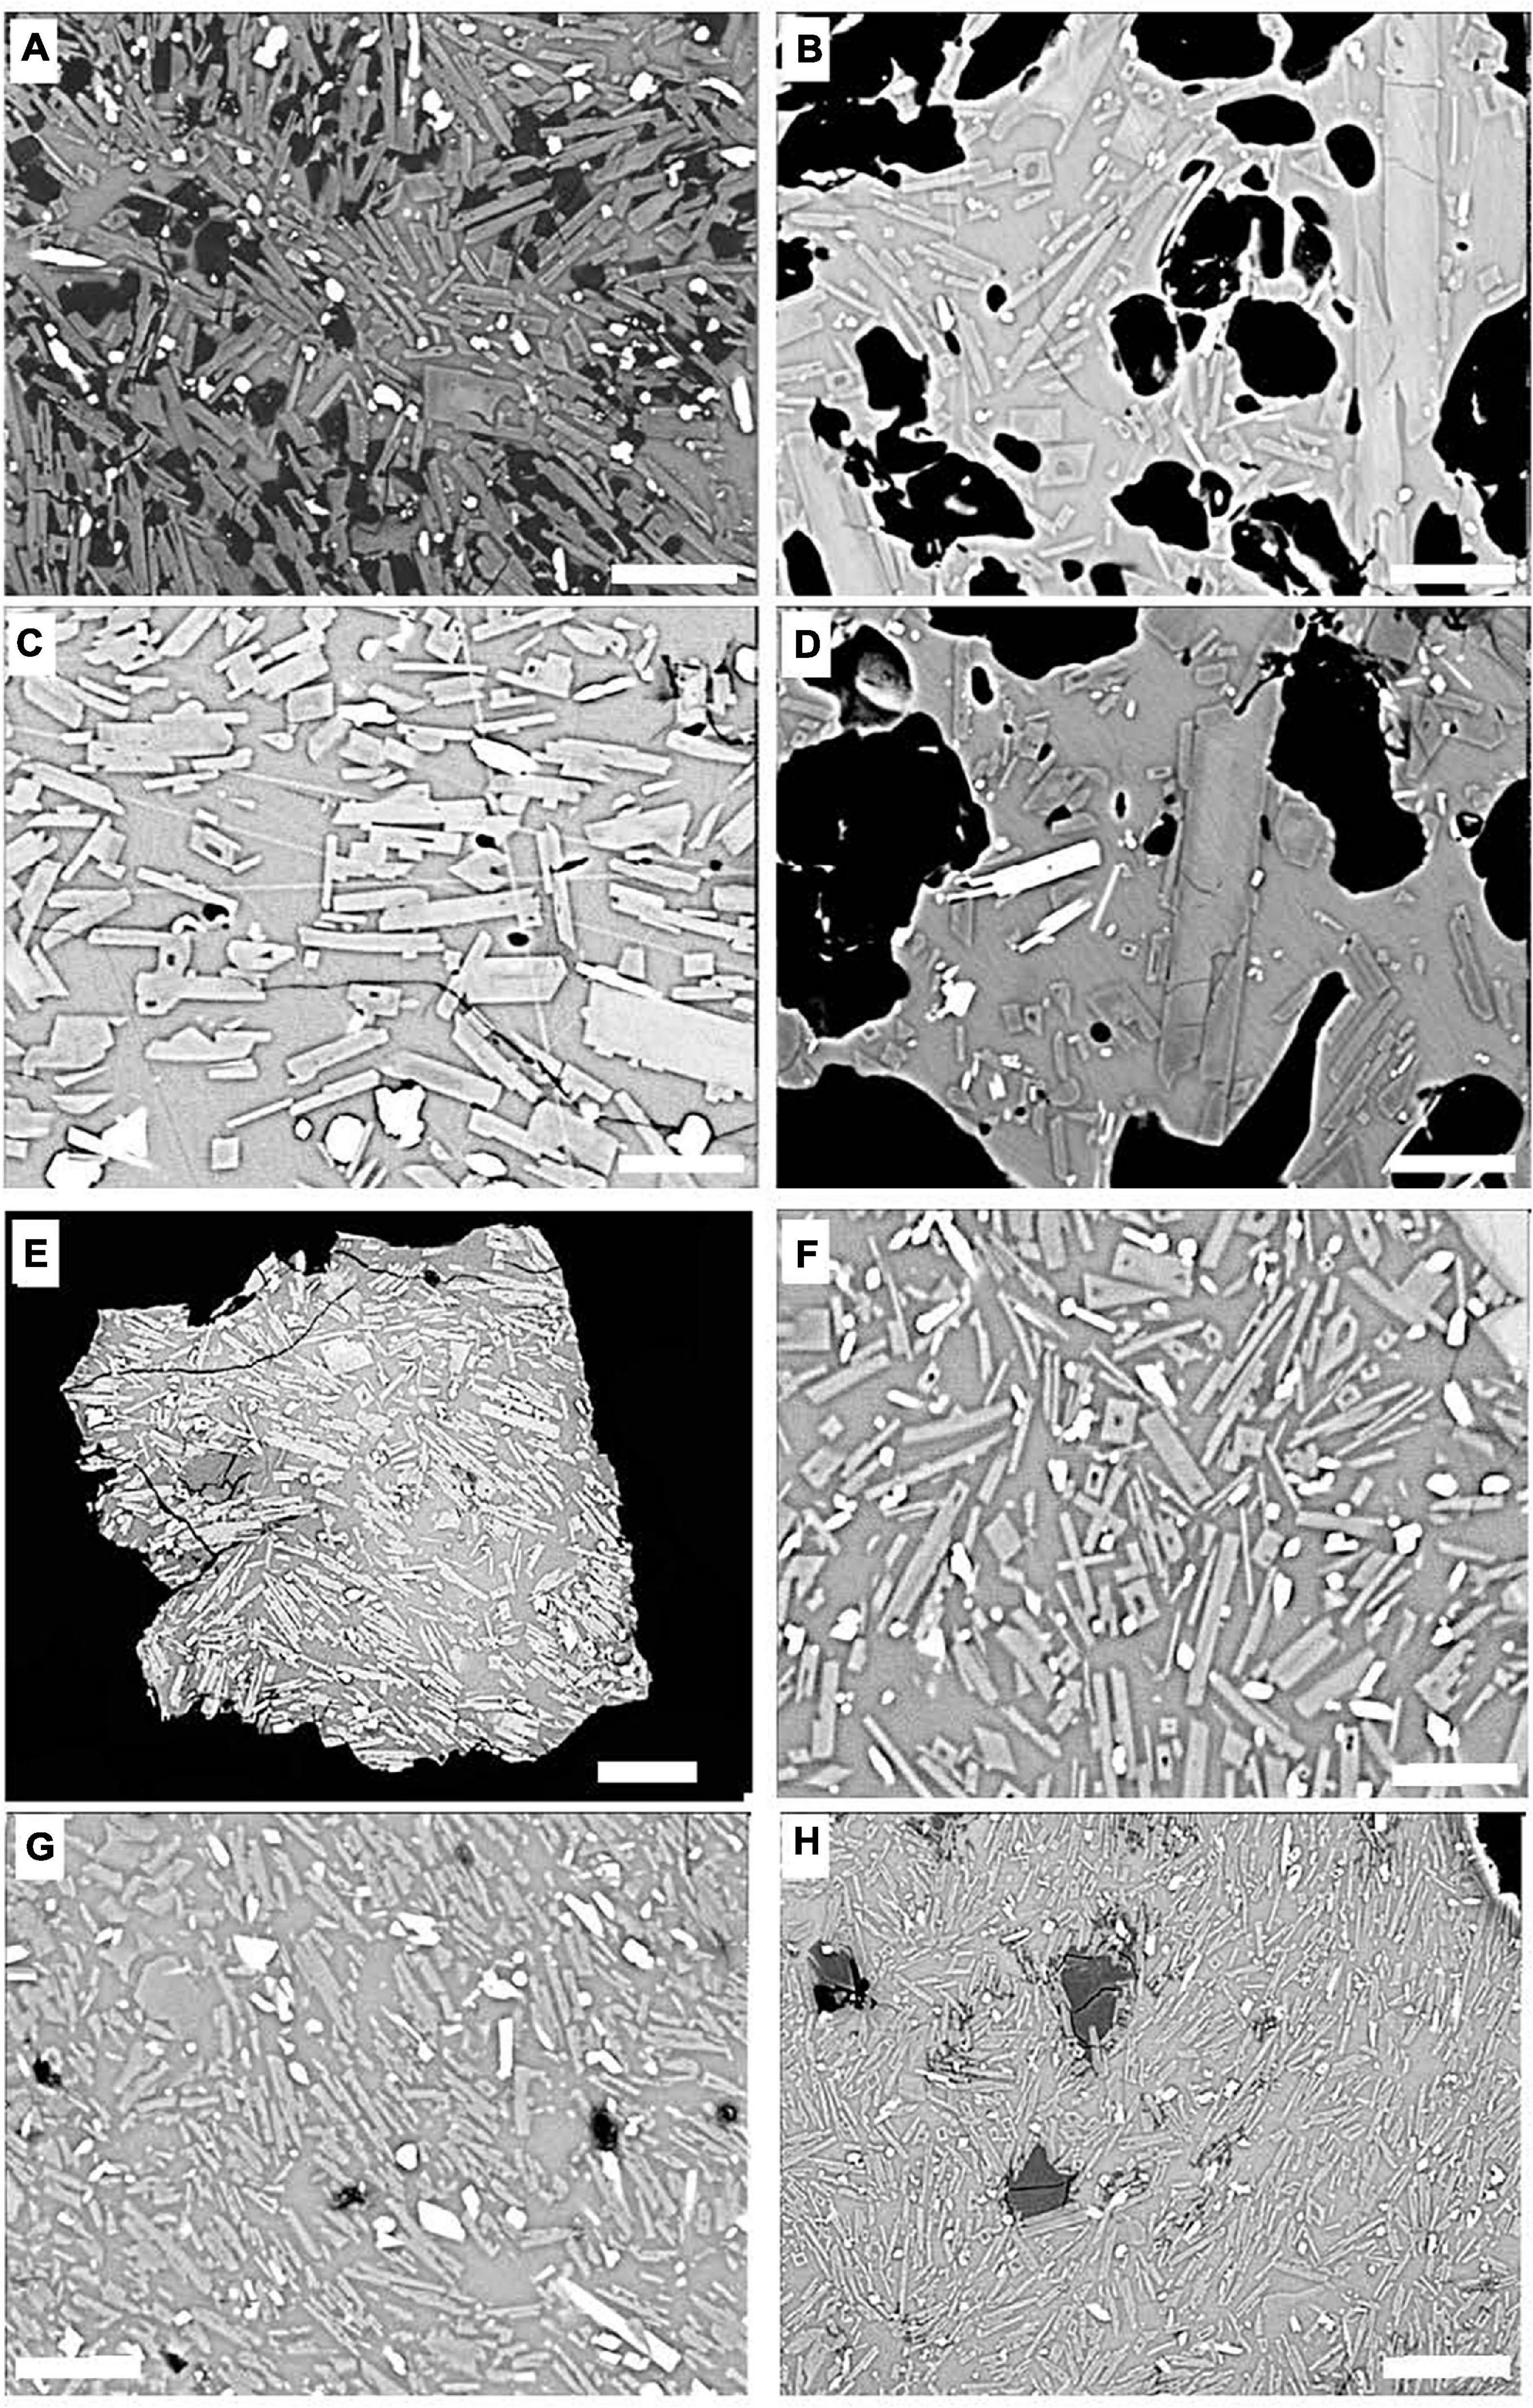
Figure 5. Mount St Helens pyroclasts and precursory ash. The dense black dacite (A,C) has higher crystallinities and crystal number densities than the gray dacite (B,D). The black dacite has on average a lower vesicularity than the gray dacite. Ash samples from March 28 (E,F) are dense; microlite textures range from complex dendritic clusters (E) to well-aligned individual plagioclase microlites (F). Samples from an eruption on April 16 (G,H) exhibit a wide range of individual crystal sizes and shapes, from larger, less numerous and more equant plagioclase microlites (G) to fragments with extraordinarily high number densities (>3 × 105 mm–2) and a Si-phase (H). Rectangular, gray crystals are plagioclase microlites; dark gray amorphous patches are a Si-phase and black voids are vesicles. Scale bar corresponds to 10 mm in all images except (E), where the scale bar is 25 mm.
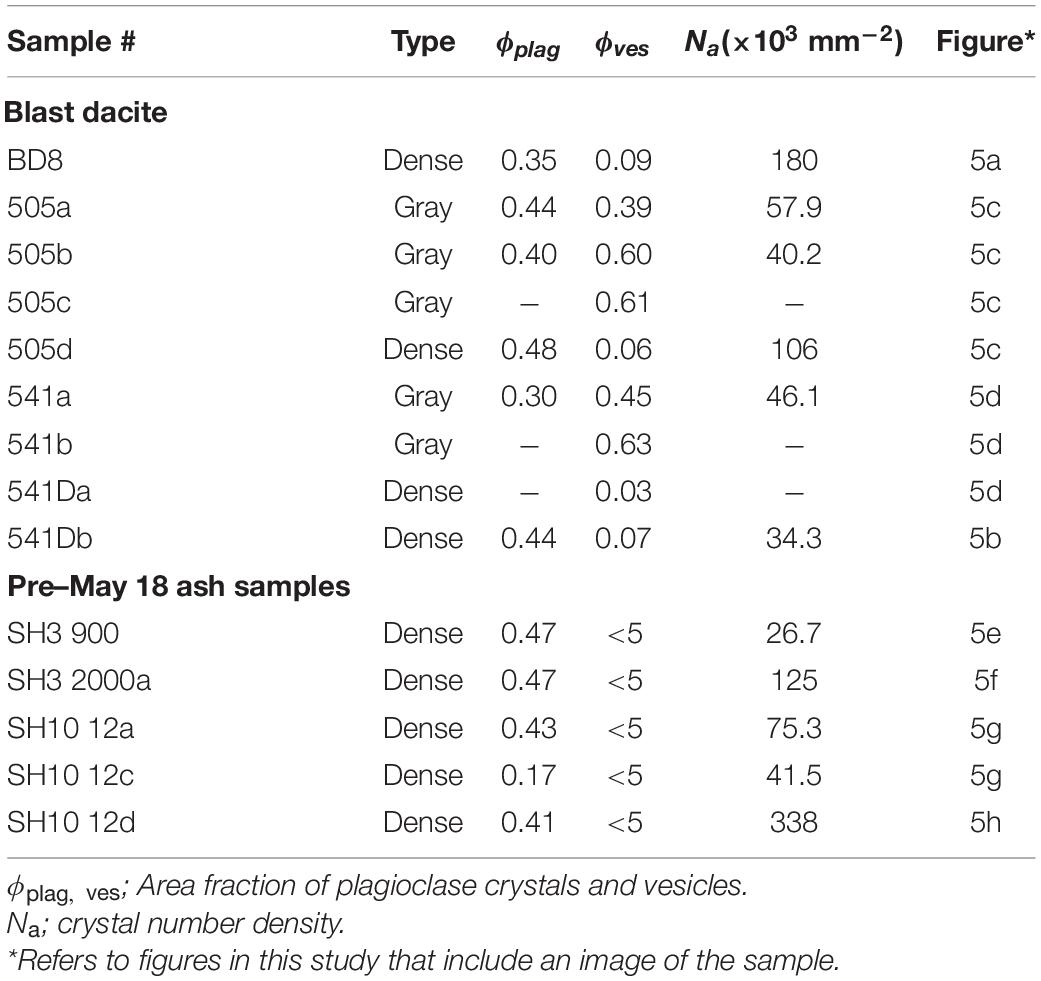
Table 2. Textural characteristics of Mount St Helens eruptive products.
Ash samples from the precursory eruptions are dominated by pulverized material from the edifice (characteristic of phreatic eruptions) but include a minor proportion of dense microlite-rich particles that are texturally similar to the dense dacite (Figures 5E–H). The vesicularity of individual ash particles is uniformly low (ϕves < 0.05). Most ash samples have high plagioclase crystallinities (ϕxtl = 0.41–0.47) that are similar to those of the dense blast dacite (Table 2). Crystal number densities are variable (0.27–3.40 × 105 mm–2) but, in the extreme, exceed those of the dense blast dacite (0.34–1.80 × 105 mm–2). In form, crystals are highly anisotropic and often skeletal, with pronounced alignment. Also apparent are minor amounts of a silica phase (dark patches in Figures 5A,H) and, in some ash particles (e.g., Figures 5E,G), clusters of parallel crystals that are reminiscent of crystal forms in our static, pressurization and baseline experiments.
Our earliest-erupted sample is from an eruption that occurred at ∼0200 PST on 28 March (Christiansen and Peterson, 1981). This eruption was the second precursory explosion (the first occurred at 1236 PST on 27 March) and therefore had arguably experienced pressurization prior to each explosion, and sudden decompression during the first explosion (Figure 6). Most ash samples from this event are dense (completely outgassed), suggesting that they derived from the outermost outgassed margin of the growing cryptodome. Plagioclase microlites have shapes that range from complex dendritic (Figure 5E) to aligned elongate individual crystals (Figure 5F). The time between events allows ∼13.5 h for annealing (+ recompression + degassing?) prior to fragmentation by the second explosion. Interestingly, these earliest ash samples are the only ones that preserve complex dendrites, perhaps reflecting the limited pressure cycling affecting the intruding magma at this time. Episodic explosive activity continued through April 22, including the eruption of April 16 that produced our other precursory ash sample. This sample includes particles with both larger and less numerous plagioclase crystals (Figure 5F) and particles with very high number densities and incipient Si-phase precipitation (Figure 5H). Together these textural characteristics suggest that later precursory eruptions tapped variably degassed sections within the cryptodome and over a pressure range that was more extensive than tapped during the initial eruptions, although still more limited than the extent of cryptodome material exposed by the 18 May blast (Figures 5A–D).
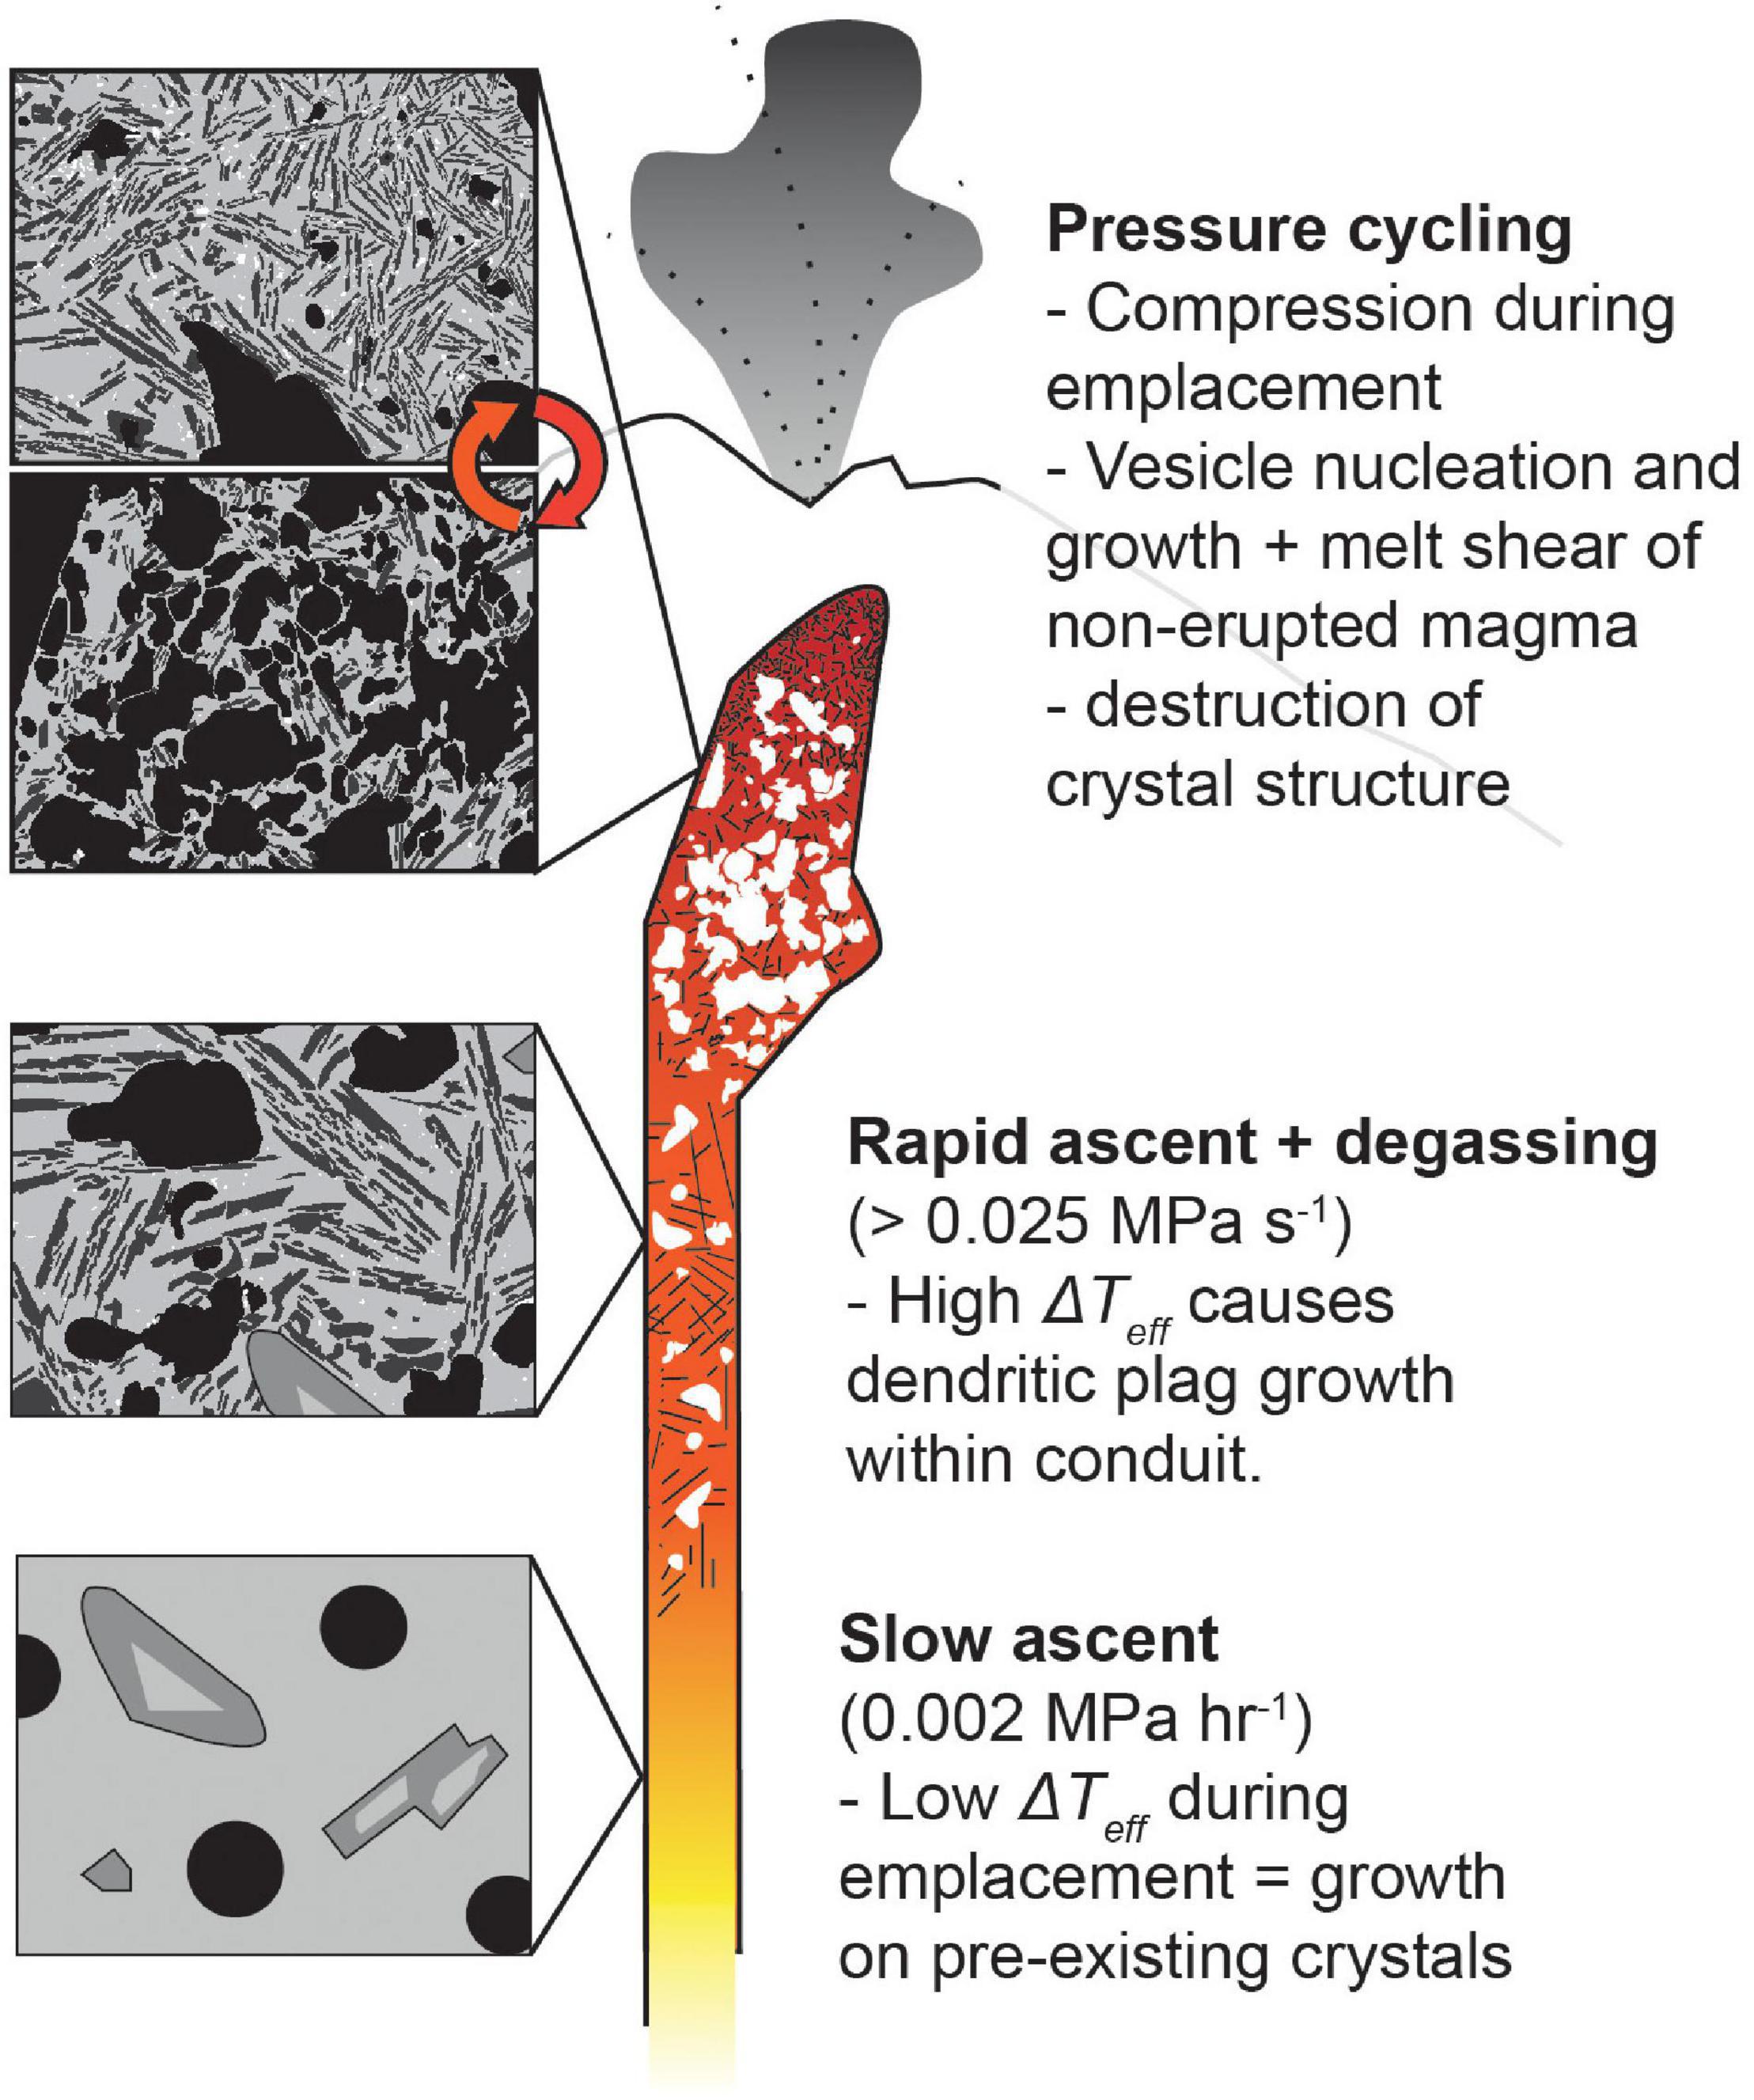
Figure 6. Schematic of Mount St Helens magma ascent path. Slow ascent (0.002 MPa h–1) from the deep storage region suppresses plagioclase nucleation and favors growth on pre-existing crystals. At pressures ≤ 50 MPa, high effective undercooling (ΔTeff) and sluggish kinetics at high melt viscosity cause dendritic microlites to form. The magma underwent compression during intrusion into the edifice then experienced a series of recompression—decompression events during phreatomagmatic explosions. Pressure cycling damaged the dendritic crystal structures, which created numerous, small crystal fragments.
More generally, crystal number densities from cryptodome (blast and precursory ash) samples (0.27–3.40 × 105 mm–2) bracket those of our dynamic experiments and are similar to the highest observed in the experiments of Martel (2012; Figure 4). Number densities are also similar to those of samples from precursory explosions of Pinatubo in 1991 (Hammer et al., 1999) and surge deposits from Mt. Pelée (Martel and Poussineau, 2007). The cryptodome samples, however, have higher overall plagioclase crystallinities (≤48%) than the other samples, with most lying along the Na-phi trend defined by the experiments of Riker et al. (2015b). These high crystallinities may reflect the combined effect of composition, including H2O content (melt viscosity), and annealing time at the final pressure (e.g., Scandone et al., 2007).
The textures of the cryptodome samples raise several questions about the conditions of cryptodome intrusion that our experiments help to address. The first relates to the degassing efficiency of the intruding magma, as indicated by the low vesicularity of pre-climatic and dense cryptodome samples. Our static experiments suggest that degassing at shallow levels is likely facilitated by permeability development provided by the high microlite abundance (ϕxtl > 0.30) and aspect ratio (Oppenheimer et al., 2015; Lindoo et al., 2017; deGraffenried et al., 2019) combined with the slow ascent rates and the observed crystal alignment, which would promote high permeability anisotropy and aid gas escape to the conduit margins (Schneider et al., 2012). Textural indications of shear dilatancy (Figure 5A) also suggest magma compaction, and even recompression, as the advancing cryptodome forced the north flank of the edifice outward. Interestingly, the low vesicularity of the early erupted (pre- 18 May) cryptodome magma (ϕves = < 0.05–0.12) and variable vesicularity of the gray dacite erupted on 18 May (ϕxtl = 0.38 on average, and up to 0.63) are similar to those in our D1 (recompression), static, and D2 (pressure release) experiments, respectively.
Another question regards the origin of the high crystal number densities observed in the cryptodome samples. Decompression-only experiments that come closest to replicating the observed textures are those of Martel (2012; Figure 4). These experiments had initial plagioclase populations of ∼104 mm–2, were decompressed from 200 to 5–30 MPa at rates of 0.0001–0.04 MPa s–1 and then allowed a maximum of 4 days anneal time. It is difficult to relate these decompression trajectories to magma ascent at Mount St. Helens prior to 18 May 1980, however, as all evidence indicates slow intrusion into the edifice (at a rate ∼ 0.002 MPa h–1 or 5.6 × 10⁻⁷ MPa s–1, inferred from measured deformation of the volcano’s north flank; Cashman, 2020), conditions that should promote continuous crystallization and a wide range of plagioclase sizes. Our dynamic experiments provide an alternative mechanism for generating very high crystal number densities. Initial crystallization within the conduit at pressures ≤ 50 MPa should produce moderate plagioclase crystallinities and dendritic crystal networks (Figure 6). There is clear evidence for stalling of the cryptodome magma at < 20 MPa, as indicated by the maximum water content measured in the blast dacite (Hoblitt and Harmon, 1993; Blundy et al., 2010) and patterns of surface deformation (Donnadieu and Merle, 1998). Pressure cycling would have disrupted an originally fragile dendritic crystal structure to produce the observed high number of individual small crystals, many of which are highly anisotropic and often skeletal in form. Evidence for compression comes from both crystal alignment and near-complete degassing of many cryptodome samples (high density and near-absence of vesicles). Evidence for episodes of rapid decompression to low (atmospheric) pressure is provided by the episodic pre-eruptive phreatomagmatic activity, which would have caused rapid decompression followed by a slow recompression of the unerupted magma within the growing cryptodome (e.g., Clarke et al., 2015).
There are still several questions remaining. Our experiments are not designed exactly to mimic decompression paths experienced by Mount St Helens magma, particularly given the high recompression pressures required by our experimental equipment. Additionally, the small size of our experimental capsules limits the absolute amount of shear (and shear rate) that can be achieved by decompression and expansion. Thus, while disruption of crystal structures in our experiments appears to require both vesiculation and shear along the capsule wall, simple shear due to magma flow within volcanic conduits may be sufficient to break dendritic crystals. Flow banding in volcanic rocks on the micro and macro scales (e.g., Smith, 2002) offer insight into how the experiments might scale to a conduit setting. In our experiments, extensive crystal breakage occurs on the scale of 10’s of microns near the capsule walls, although broken crystals are found throughout the entire width and length of the D2 experiments (∼3 mm diameter, ∼10 mm length). Banding on similar and larger length scales has been found in the products of both effusive and higher intensity eruptions (Castro et al., 2002; Gonnermann and Manga, 2005). Additionally, the variable plagioclase microlite textures in the cryptodome samples require highly variable decompression and eruption paths, including different locations, durations and numbers of both pauses and pressure cycles experienced en route to the surface. To characterize all possible decompression paths will require additional experiments that vary initial (shallow) starting pressure, number and location of stalling events and cyclical pressure perturbations.
Stepping back, we pose more general questions related to alteration of crystal populations by eruptive processes. It has long been recognized that the contrasting textures of pāhoehoe and ‘a‘ā lava flows reflect the role of shear in the open channel flows that produce ‘a‘ā (Emerson, 1926), although the extent to which this difference results from increased melt advection or mechanical breakage remains a point of discussion (e.g., Kouchi et al., 1986; Vona and Romano, 2013; Tripoli et al., 2019). The potential for rapid bubble expansion to affect crystal textures, in contrast, has been considered only as an explanation for syn-eruption fragmentation of phenocrysts driven by ΔP-driven expansion of volatile-bearing melt inclusions (e.g., Tait, 1992; Best and Christiansen, 1997; Williamson et al., 2010; Van Zalinge et al., 2018). Bubble expansion as a common mechanism for disrupting dendritic crystal structures is appealing because rapid decompression and bubble expansion are widely considered to supply the driving force for much explosive activity. Indeed, it is tempting to speculate that the abundant fine ash produced during Vulcanian explosions may be the end result of rapid expansion of microlite-rich magma from very shallow levels in the conduit.
Conclusion
Here we introduce a mechanism for producing finely crystalline (high Na, low ϕxtl) textures in pyroclasts. In contrast to previous experimental studies, we performed decompression experiments that model magma ascent from shallow storage (e.g., magma stalled in conduit) followed by pressure fluctuations accompanying patterns of intermittent explosions or ash venting that characterize Vulcanian, phreatomagmatic and extrusive activity. Initial equilibration at a low initial pressure of 50 MPa generated extensive crystallization of dendritic microlites; subsequent decompression to 10 MPa produced little to no additional crystallization. Pressure fluctuations after decompression caused the bulk magma volume to contract and expand. Rapid pressure release, in particular, mechanically worked the fragile arms of dendritic microlites so that box-work crystals were broken into numerous individual segments with simpler forms. Overall, this created an apparent increase in crystal number density. Through this lens, we re-interpret precursory ash and pyroclasts ejected prior to and during the 18 May 1980 eruption of Mount St Helens. Crystal textures in our experimental samples help explain the high crystal number densities and textural heterogeneities in Mount St Helens samples and provide some insight into the degassing history of the cryptodome. Ultimately, this study highlights that crystal textures are not only a reflection of crystallization kinetics, but also of the ability of a crystal population to withstand shallow conduit dynamics.
Data Availability Statement
The original contributions presented in the study are included in the article/Supplementary Material, further inquiries can be directed to the corresponding author/s.
Author Contributions
KC conceived the project. AL conducted the experiments and collected BSE images. AL and KC analyzed textures of experiments and natural samples, respectively. Both authors collaborated in data interpretation, discussion of results, and preparing the manuscript.
Funding
This work was supported by the AXA Research Fund (KC).
Conflict of Interest
The authors declare that the research was conducted in the absence of any commercial or financial relationships that could be construed as a potential conflict of interest.
The handling editor declared a shared research group Diseqm with the author AL at the time of review.
Acknowledgments
We thank Brian Tattitch for experimental advice on pressure cycling. Constructive comments from two reviewers improved the manuscript. We also thank Fabio Arzilli for efficient handling of the manuscript.
Supplementary Material
The Supplementary Material for this article can be found online at: https://www.frontiersin.org/articles/10.3389/feart.2021.659459/full#supplementary-material
Footnotes
References
Befus, K. S., and Andrews, B. J. (2018). Crystal nucleation and growth produced by continuous decompression of Pinatubo magma. Contrib. Mineral. Petrol. 173:92.
Best, M. G., and Christiansen, E. H. (1997). Origin of broken phenocrysts in ash-flow tuffs. Geol. Soc. Am. Bull. 109, 63–73. doi: 10.1130/0016-7606(1997)109<0063:oobpia>2.3.co;2
Blundy, J., Cashman, K. V., Rust, A., and Witham, F. (2010). A case for CO2-rich arc magmas. Earth Plan. Sci. Lett. 290, 289–301.
Brugger, C. R., and Hammer, J. E. (2010). Crystal size distribution analysis of plagioclase in experimentally decompressed hydrous rhyodacite magma. Earth Planet. Sci. Lett. 300, 246–254. doi: 10.1016/j.epsl.2010.09.046
Burgisser, A., and Gardner, J. E. (2004). Experimental constraints on degassing and permeability in volcanic conduit flow. Bull. Volcanol. 67, 42–56. doi: 10.1007/s00445-004-0359-5
Cashman, K. V. (2004). Volatile controls on magma ascent and eruption. GMS 150, 109–124. doi: 10.1029/150gm10
Cashman, K. V. (2020). Crystal size distribution (CSD) analysis of volcanic samples: advances and challenges. Front. Earth Sci. 8:291. doi: 10.3389/feart.2020.00291
Cashman, K. V., and Hoblitt, R. P. (2004). Magmatic precursors to the 18 May 1980 eruption of Mount St. Helens, USA. Geology 32, 141–144. doi: 10.1130/g20078.1
Castro, J., Manga, M., and Cashman, K. (2002). Dynamics of obsidian flows inferred from microstructures: insights from microlite preferred orientations. Earth Plan. Sci. Lett. 199, 211–226.
Christiansen, R. L., and Peterson, D. W. (1981). Chronology of the 1980 eruptive activity. US Geol. Surv. Prof. Pap. 1250, 17–30.
Cichy, S. B., Botcharnikov, R. E., Holtz, F., and Behrens, H. (2011). Vesiculation and microlite crystallization induced by decompression: a case study of the 1991–1995 Mt Unzen eruption (Japan). J. Petrol. 52, 1469–1492. doi: 10.1093/petrology/egq072
Clarke, A. B., Ongaro, T. E., and Belousov, A. (2015). “Vulcanian eruptions,” in The Encyclopedia of Volcanoes, eds H. Sigurdsson, B. Houghton, S. McNutt, H. Rymer, and J. Stix (Cambridge, MA: Academic Press), 505–518. doi: 10.1016/b978-0-12-385938-9.00028-6
Couch, S., Sparks, R. S. J., and Carroll, M. R. (2003). The kinetics of degassing-induced crystallization at Soufriere Hills Volcano, Montserrat. J. Petrol. 44, 1477–1502.
deGraffenried, R. L., Larsen, J. F., Graham, N. A., and Cashman, K. V. (2019). The influence of phenocrysts on degassing in crystal-bearing magmas with rhyolitic groundmass melts. Geophys. Res. Lett. 46, 5127–5136. doi: 10.1029/2018gl081822
Donnadieu, F., and Merle, O. (1998). Experiments on the indentation process during cryptodome intrusions: new insights into Mount St. Helens deformation. Geology 26, 79–82. doi: 10.1130/0091-7613(1998)026<0079:eotipd>2.3.co;2
Gardner, J. E., Hilton, M., and Carroll, M. R. (1999). Experimental constraints on degassing of magma: isothermal bubble growth during continuous decompression from high pressure. Earth Planet. Sci. Lett. 168, 201–218. doi: 10.1016/s0012-821x(99)00051-5
Gonnermann, H. M., and Manga, M. (2005). Flow banding in obsidian: a record of evolving textural heterogeneity during magma deformation. Earth Plan. Sci. Lett. 236, 135–147.
Hammer, J. E. (2008). Experimental studies of the kinetics and energetics of magma crystallization. Rev. Mineral. Geochem. 69, 9–59. doi: 10.2138/rmg.2008.69.2
Hammer, J. E., and Rutherford, M. J. (2002). An experimental study of the kinetics of decompression-induced crystallization in silicic melt. J. Geophys. Res. 107, ECV 8-1–ECV 8-24.
Hammer, J. E., Cashman, K. V., Hoblitt, R. P., and Newman, S. (1999). Degassing and microlite crystallization during pre-climactic events of the 1991 eruption of Mt. Pinatubo, Philippines. Bull. Volcanol. 60, 355–380.
Hoblitt, R. P., and Harmon, R. S. (1993). Bimodal density distribution of cryptodome dacite from the 1980 eruption of Mount St. Helens, Washington. Bull. Volcanol. 55, 421–437. doi: 10.1007/bf00302002
Ihinger, P. D. (1991). An Experimental Study of the Interaction of Water With Granitic Melt. Dissertation (Ph.D.), California Institute of Technology. doi: 10.7907/1ds0-5n95
Kouchi, A., Tsuchiyama, A., and Sunagawa, I. (1986). Effect of stirring on crystallization kinetics of basalt: texture and element partitioning. Contrib. Mineral. Petrol. 93, 429–438. doi: 10.1007/bf00371713
Larsen, J. F., and Gardner, J. E. (2000). Experimental constraints on bubble interactions in rhyolite melts: implications for vesicle size distributions. Earth Planet. Sci. Lett. 180, 201–214. doi: 10.1016/s0012-821x(00)00166-7
Lensky, N. G., Navon, O., and Lyakhovsky, V. (2004). Bubble growth during decompression of magma: experimental and theoretical investigation. J. Volcanol. Geother. Res. 129, 7–22. doi: 10.1016/s0377-0273(03)00229-4
Lindoo, A., Larsen, J. F., Cashman, K. V., and Oppenheimer, J. (2017). Crystal controls on permeability development and degassing in basaltic andesite magma. Geology 45, 831–834. doi: 10.1130/g39157.1
Liu, E. J., Cashman, K. V., and Rust, A. C. (2015). Optimising shape analysis to quantify volcanic ash morphology. GeoResJ 8, 14–30. doi: 10.1016/j.grj.2015.09.001
Lormand, C., Zellmer, G. F., Németh, K., Kilgour, G., Mead, S., Palmer, A. S., et al. (2018). Weka trainable segmentation plugin in imagej: a semi-automatic tool applied to crystal size distributions of microlites in volcanic rocks. Microsc. Microanal. 24, 667–675. doi: 10.1017/s1431927618015428
Marsh, B. (1998). On the interpretation of crystal size distributions in magmatic systems. J. Petrol. 39, 553–599. doi: 10.1093/petroj/39.4.553
Martel, C. (2012). Eruption dynamics inferred from microlite crystallization experiments: application to Plinian and dome-forming eruptions of Mt. Pelée (Martinique, Lesser Antilles). J. Petrol. 53, 699–725. doi: 10.1093/petrology/egr076
Martel, C., and Iacono-Marziano, G. (2015). Timescales of bubble coalescence, outgassing, and foam collapse in decompressed rhyolitic melts. Earth Planet. Sci. Lett. 412, 173–185. doi: 10.1016/j.epsl.2014.12.010
Martel, C., and Poussineau, S. (2007). Diversity of eruptive styles inferred from the microlites of Mt Pelée andesite (Martinique. Lesser Antilles). J. Volcanol. Geother. Res. 166, 233–254. doi: 10.1016/j.jvolgeores.2007.08.003
Martel, C., and Schmidt, B. C. (2003). Decompression experiments as an insight into ascent rates of silicic magmas. Contrib. Mineral. Petrol. 144, 397–415. doi: 10.1007/s00410-002-0404-3
Marxer, H., Bellucci, P., and Nowak, M. (2015). Degassing of H2O in a phonolitic melt: a closer look at decompression experiments. J. Volcanol. Geother. Res. 297, 109–124. doi: 10.1016/j.jvolgeores.2014.11.017
Melnik, O., and Sparks, R. S. J. (2002). Dynamics of magma ascent and lava extrusion at Soufrière Hills Volcano, Montserrat. Geol. Soc. Lond. Mem. 21, 153–171. doi: 10.1144/gsl.mem.2002.021.01.07
Mongrain, J., Larsen, J. F., and King, P. L. (2008). Rapid water exsolution, degassing, and bubble collapse observed experimentally in K-phonolite melts. J. Volcanol. Geother. Res. 173, 178–184. doi: 10.1016/j.jvolgeores.2008.01.026
Okumura, S., Nakamura, M., Nakano, T., Uesugi, K., and Tsuchiyama, A. (2012). Experimental constraints on permeable gas transport in crystalline silicic magmas. Contrib. Mineral. Petrol. 164, 493–504. doi: 10.1007/s00410-012-0750-8
Oppenheimer, J., Rust, A. C., Cashman, K. V., and Sandnes, B. (2015). Gas migration regimes and outgassing in particle-rich suspensions. Front. Phys. 3:60. doi: 10.3389/fphy.2015.00060
Pallister, J. S., Hoblitt, R. P., Meeker, G. P., Knight, R. J., and Siems, D. F. (1996). “Magma mixing at Mount Pinatubo: petrographic and chemical evidence from the 1991 deposits,” in Fire and Mud: Eruptions and Lahars of Mount Pinatubo, Philippines, 687–731.
Riker, J. M., Blundy, J. D., Rust, A. C., Botcharnikov, R. E., and Humphreys, M. C. (2015a). Experimental phase equilibria of a Mount St. Helens rhyodacite: a framework for interpreting crystallization paths in degassing silicic magmas. Contrib. Mineral. Petrol. 170:6.
Riker, J. M., Cashman, K. V., Rust, A. C., and Blundy, J. D. (2015b). Experimental constraints on plagioclase crystallization during H2O and H2O–CO2-saturated magma decompression. J. Petrol. 56, 1967–1998. doi: 10.1093/petrology/egv059
Scandone, R., Cashman, K. V., and Malone, S. D. (2007). Magma supply, magma ascent and the style of volcanic eruptions. Earth Planet. Sci. Lett. 253, 513–529. doi: 10.1016/j.epsl.2006.11.016
Schneider, A., Rempel, A. W., and Cashman, K. V. (2012). Conduit degassing and thermal controls on eruption styles at Mount St. Helens. Earth Planet. Sci. Lett. 357, 347–354. doi: 10.1016/j.epsl.2012.09.045
Shea, T., and Hammer, J. E. (2013). Kinetics of cooling-and decompression-induced crystallization in hydrous mafic-intermediate magmas. J. Volcanol. Geother. Res. 260, 127–145. doi: 10.1016/j.jvolgeores.2013.04.018
Shea, T., Houghton, B. F., Gurioli, L., Cashman, K. V., Hammer, J. E., and Hobden, B. J. (2010). Textural studies of vesicles in volcanic rocks: an integrated methodology. J. Volcanol. Geother. Res. 190, 271–289. doi: 10.1016/j.jvolgeores.2009.12.003
Smith, J. V. (2000). Textural evidence for dilatant (shear thickening) rheology of magma at high crystal concentrations. J. Volcanol. Geother. Res. 99, 1–7. doi: 10.1016/s0377-0273(99)00191-2
Smith, J. V. (2002). Structural analysis of flow-related textures in lavas. Earth Sci. Rev. 57, 279–297. doi: 10.1016/s0012-8252(01)00081-2
Tait, S. (1992). Selective preservation of melt inclusions in igneous phenocrysts. Am. Mineral. 77, 146–155.
Tripoli, B., Manga, M., Mayeux, J., and Barnard, H. (2019). The effects of deformation on the early crystallization kinetics of basaltic magmas. Front. Earth Sci. 7:250. doi: 10.3389/feart.2019.00250
Van Zalinge, M. E., Cashman, K. V., and Sparks, R. S. J. (2018). Causes of fragmented crystals in ignimbrites: a case study of the Cardones ignimbrite, Northern Chile. Bull. Volcanol. 80, 1–15.
Vona, A., and Romano, C. (2013). The effects of undercooling and deformation rates on the crystallization kinetics of Stromboli and Etna basalts. Contrib. Mineral. Petrol. 166, 491–509. doi: 10.1007/s00410-013-0887-0
Williamson, B. J., Di Muro, A., Horwell, C. J., Spieler, O., and Llewellin, E. W. (2010). Injection of vesicular magma into an andesitic dome at the effusive–explosive transition. Earth Planet. Sci. Lett. 295, 83–90. doi: 10.1016/j.epsl.2010.03.027
Keywords: crystallization, volcanic systems, syn-eruptive, microlites, Mount St Helens
Citation: Lindoo A and Cashman KV (2021) High Crystal Number Densities From Mechanical Damage. Front. Earth Sci. 9:659459. doi: 10.3389/feart.2021.659459
Received: 27 January 2021; Accepted: 12 April 2021;
Published: 28 May 2021.
Edited by:
Fabio Arzilli, The University of Manchester, United KingdomReviewed by:
Matteo Masotta, University of Pisa, ItalyBruce Houghton, University of Hawaii, United States
Copyright © 2021 Lindoo and Cashman. This is an open-access article distributed under the terms of the Creative Commons Attribution License (CC BY). The use, distribution or reproduction in other forums is permitted, provided the original author(s) and the copyright owner(s) are credited and that the original publication in this journal is cited, in accordance with accepted academic practice. No use, distribution or reproduction is permitted which does not comply with these terms.
*Correspondence: Amanda Lindoo, a.lindoo@bristol.ac.uk