
Spatio-Temporal Coupling Characteristics and the Driving Mechanism of Population-Land-Industry Urbanization in the Yangtze River Economic Belt

1
Business School, Hubei University, Wuhan 430062, China
2
College of Public Administration, Huazhong Agricultural University, Wuhan 430070, China
*
Author to whom correspondence should be addressed.
Land 2021, 10(4), 400; https://doi.org/10.3390/land10040400
Submission received: 19 March 2021
/
Revised: 7 April 2021
/
Accepted: 8 April 2021
/
Published: 11 April 2021
(This article belongs to the Section Urban Contexts and Urban-Rural Interactions)
Abstract
:The purpose of this paper is to probe into the coupled coordination of urbanization in population, land, and industry to improve urbanization quality. A coupled coordination degree model, spatial analysis method and spatial metering model are employed. The study area is 110 prefecture-level cities in the Yangtze River Economic Belt. The study shows that: (1) the coupling degree of the population-land-industry urbanization grew very slowly between 2006 and 2016. On the whole, the three-dimensional urbanization is in a running-in period, and land-based urbanization dominates, while population-based urbanization and industry-based urbanization are relatively lagging behind. (2) The three major urban agglomerations, the Chengdu-Chongqing, the middle reaches of the Yangtze River and the Yangtze River Delta, are parallel to the whole area in terms of the coupling degree of the three dimensional urbanization with a well-ordered structure, especially in the central cities of the three major urban agglomerations. (3) There is significant spatial correlation in the coupling degree and coordination degree of the three-dimensional urbanization. The high value of coupling degree and coordination degree are clustered continuously in developed cities, provincial capitals, and central cities of the downstream reaches of the Yangtze River. (4) The coordinated degree has significant positive spatial autocorrelation, showing obvious spatial agglomeration characteristics: H-H agglomeration areas are concentrated in the downstream developed areas such as Jiangsu, Zhejiang, and Shanghai. L-L agglomeration areas are mainly concentrated in upstream undeveloped areas, but the number of their cities shows a decreasing trend. (5) The coordination degree of the three-dimensional urbanization is the result of the comprehensive effect of economic development level, the government’s decision-making behavior, and urban location. Among them, the economic development level, urbanization investment, traffic condition, and urban geographical location play a decisive role. This paper contributes to the existing literatures by exploring urbanization quality, spatial correlation and influencing factors from the perspectives of the three-dimensional urbanization in the Yangtze River Economic Belt. The conclusion might be helpful to promote the coupling and coordinated development of urbanization in population-land-industry, and ultimately to improve urbanization quality in the Yangtze River Economic Belt.
1. Introduction
The non-agriculturalization of the population, land, and industry comprehensively drive urban and rural development, and the evolutionary relationship among them is also an important basis for measuring the characteristics of the stages of urban and rural transformation [1]. The promotion of urbanization depends on the non-agricultural development of land and industry. However, the non-agriculturalization of population is not based on the coordinated development of the non-agriculturalization of industry and land, which is a pathological and unsustainable form of development [2,3]. The report of the 19th National Congress of the Communist Party of China (CPC) clearly states that the principal contradiction facing Chinese society has evolved. What we now face is the contradiction between unbalanced and inadequate development, and the people’s ever-growing need for a better life. Among them, the biggest imbalance in terms of development is the imbalance between urban and rural development. The biggest development insufficiency is the insufficient development of agriculture and rural areas [4]. In urban and rural development, population and industry are converging on cities and towns. Rural land has been transformed into urban construction land, which causes population levels, industry, and land urbanization to gradually improve. Land non-agriculturalization is a common process of industrialization and urbanization [5,6,7]. The loss of cultivated land caused by land non-agriculturalization has become a global phenomenon with the rapid growth of the economy and population [8,9]. In particular, the increase in non-agricultural growth has further led to the expansion of residential areas in neighboring areas, the destruction of the surrounding areas and the spread of cities [10,11,12]. Therefore, land should be maintained by agricultural use or converted to construction land, which has been the focus of the rural school and urban school debate [13]. However, excessive non-agriculturalization of arable land has a huge impact on agricultural output and quality of urbanization. As a result, China, Japan, the United States and other countries have been trying to protect farmland and have formulated a series of policies to protect the cultivated land in case of excessive non- agriculturalization [14,15,16]. Over the past 40 years of reform and opening up, China’s rapid urbanization, with its massive population transfer and rapid expansion of urban land, has been widely attended by scholars at home and abroad [17,18]. Land urbanization is occurring faster than population urbanization. This has resulted in some problems, such as the increasing number of amphibious migrant workers, the destruction of the ecological environment, an imbalance between urban and rural development, and the wasting of resources [19]. This has not only affected the further development of urbanization in China, but also the transformation of urban and rural society. In this critical period, when China is implementing a rural revitalization strategy and promoting new urbanization, the problem of how to promote the coupled development of population-land-industry urbanization (PLIU) is a major issue that needs to be solved urgently by the Chinese government. This subject is also a focus of academic circles.
In recent years, scholars have taken great importance to the phenomenon of urban sprawl. The ideas of urban control such as the compact city, smart growth, and urban growth boundary have been proposed and aroused the urban development model of urban control, and the relationship between land expansion and population growth [20,21]. Deciding how to ensure the coupled coordination of urbanization in population, land and industry has become the key to the improvement of urbanization quality. Many scholars have done a significant amount of theoretical and empirical research into the coordinated development of the population, land, and industry urbanization. The related research is mainly concentrated in the urbanization of population and land [22,23], as well as the development relationship between population and industry urbanization [24,25], industry and land urbanization [26,27], population and jobs [28,29] and the population-building mismatches [30,31]. The scope of this research includes the urbanization theory of population, land and industry [32], spatial patterns [33], coupling coordination [34], driving factors [35], and policy regulation [36]. Results of some studies indicate how land mismatches have frequently resulted in a considerably high rate of greenfield conversion to urban use, causing landscape fragmentation and biodiversity loss, and reducing the availability of buildable land [37,38]. The uncoordinated development of population, land, and industry will have a negative impact on urban sustainability [1].
The relationship between population, land, and industry in the process of urbanization should be scientifically coordinated, so as to promote new urbanization and realize urban-rural integration [1,39,40]. Given the above, in the past several years, these scholars have broadly discussed the coordination degree methods and their empirical PLIU results. Taking the Beijing-Tianjin-Hebei region as an example, He & Shao (2018) used the coupling coordination degree model to measure the coordination of PLIU based on an evaluation of population, land, and industrial urbanization. The study concluded that the development of PLIU in the Beijing-Tianjin-Hebei region was not coordinated, and a serious spatial heterogeneity phenomenon exists [41]. Zhang et al. (2019) measured the level of PLIU in China, using the Hawking model to analyze the co-evolution mechanism and path of PLIU. The study found that China has formed a trend of PLIU coordinated development, but the country needs to further strengthen its industry and economy-driven society and promote the coordinated development of China’s urbanization [42]. Li et al. (2018) used the structural vector auto-regression model to make an empirical analysis of the dynamic influence between Beijing’s PLIU systems. The study concluded that land urbanization can support the healthy and benign development of population and industrial urbanization [43]. The theory and empirical results of these studies constitute a base for coordination development of land, population and industry urbanization policies oriented toward sustainability of city and rural integration.
In conclusion, these studies showed that a significant spatial difference exists in the coupling and coordination degree for PLIU, and some regions have shown a trend of coupling and coordinated development. However, on the whole, the coordination of population-land-industry must be further improved. The driving mechanism and policy support for the coordinated development should be further explored, and the scale of the research needs to be further refined. In addition, there is also a lack of detection of the correlation between coordinated development and spatial location, and a lack of description of the spatial correlation of coordination degree distribution in previous researches. Geographical entities always show a certain spatial relevance, as Tobler’s First Law of Geography points out, everything is related to everything else, but near things are more related to each other [44]. Spatial autocorrelation analysis is an analytical method to test whether the observed value of a certain point in space is correlated with the value of its adjacent points. At present, spatial autocorrelation theory and method have been applied in biology [45], ecology [46], epidemiology [47], social science [48], criminology [49], genetics [50], etc., and it has proven to be an effective method to study spatial differentiation and spatial patterns. In view of this, taking one of China’s most important strategic regions, namely the Yangtze River Economic Belt (YREB), as an example, this paper uses a coupling coordination degree model, spatial analysis, and a spatial metering model to discuss the spatial-temporal coupling of PLIU and its driving mechanism. Population, land, and industry urbanization panel data from 2006 to 2016 are used. The results can provide theoretical and practical guidance for the coordinated development of PLIU in the YREB, thereby enriching existing research content related to regional development and economic geography.
The remainder of this paper is structured as follows: this section introduces the background and literature review. Section 2 presents the study area and data recourse. Section 3 introduces the research methods, and Section 4 reports the research results. The final section contains the discussion and conclusions.
2. Materials and Methods
2.1. Study Area
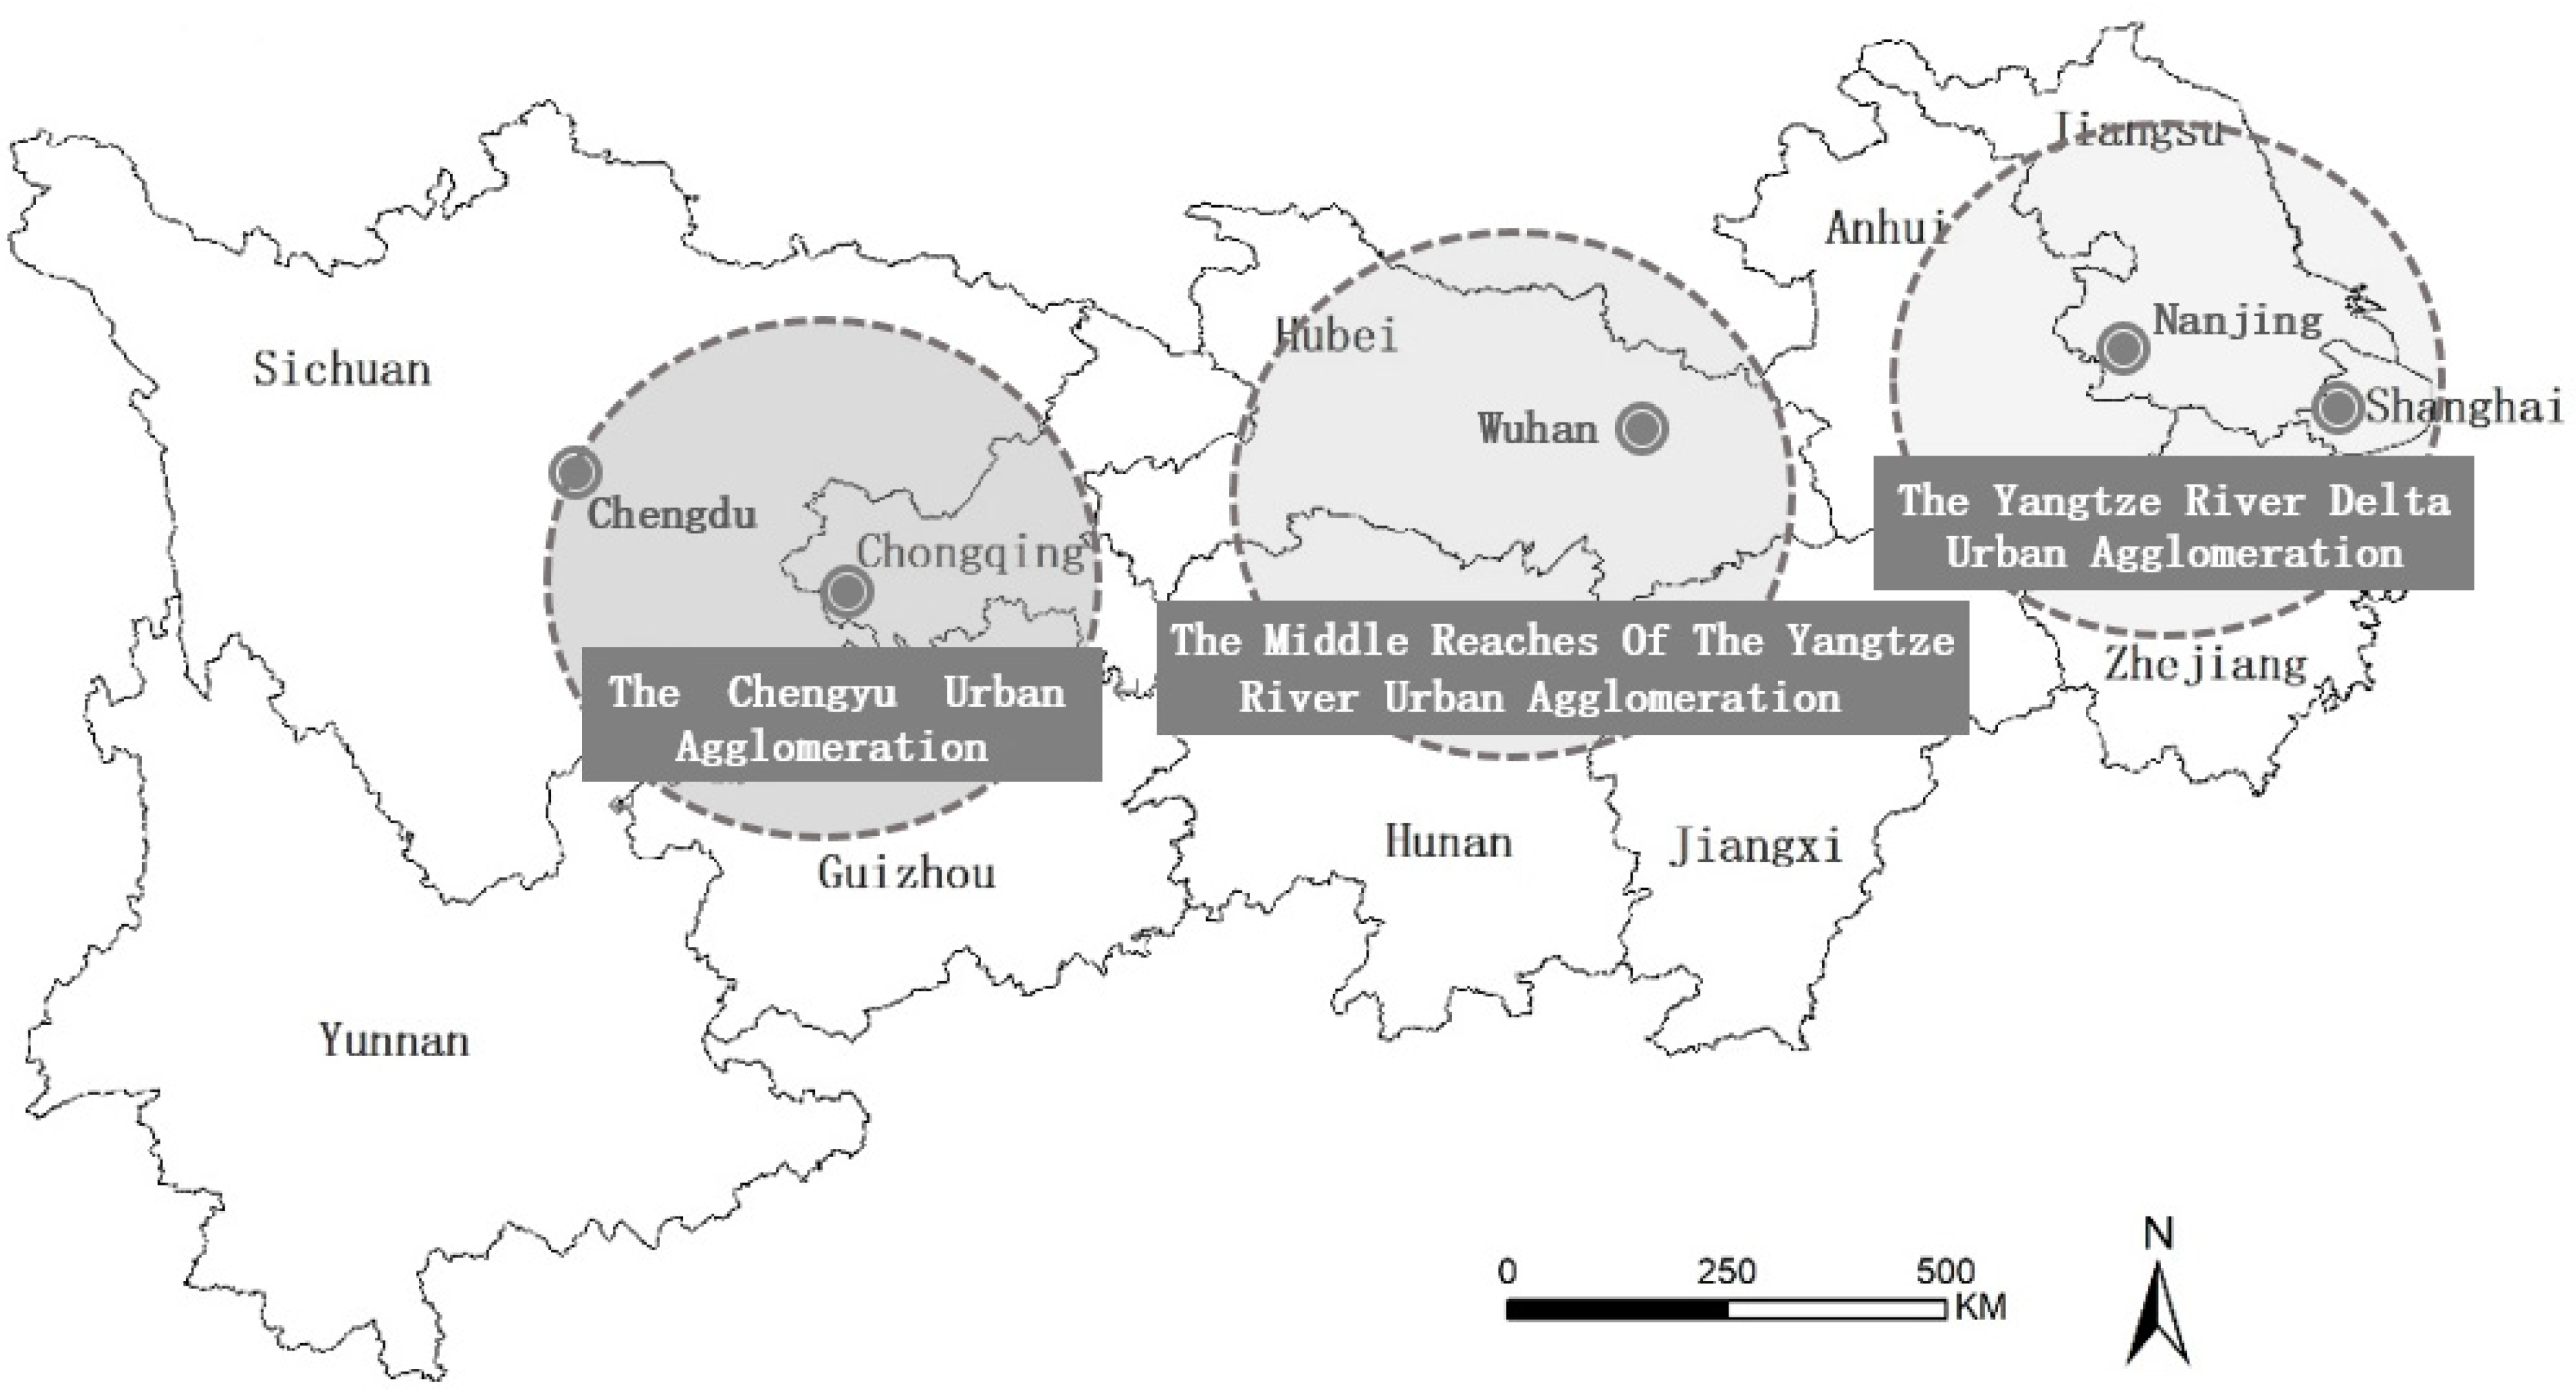
Since the State Council issued the ‘‘Guidance on Promoting the Development of the Yangtze River Economic Belt by Relying on the Golden Waterway’’ in September 2014, the development of the YREB has attracted extensive attention from the international community. In September 2016, the “Outline of the Development Plan for the Yangtze River Economic Belt” was officially issued. The document depicts the grand blueprint for the development of the YREB from a planning background, taking into consideration the general requirements, protection of the ecological environment, innovation-driven industrial transformation and upgrading, and promotion of new urbanization. The outline also looks at building a new pattern of all-round opening, an innovative system of regional coordinated development mechanisms, safeguard measures, etc. This guide also provides a significant policy support for exploring the coordinated development of PLIU in the YREB. The YREB covers the eastern, central, and western regions of China, including Shanghai, Jiangsu, Zhejiang, Anhui, Jiangxi, Hubei, Hunan, Chongqing, Sichuan, Yunnan, and Guizhou, with 11 provinces and cities (Figure 1).
The YREB covers an area of approximately 2.05 million square kilometers, accounting for 21% of the national total; the area’s population and economic aggregate both exceed 40% of the national total. By the beginning of 2018, the urbanization rate was 58.3%, and the GDP was 45.2% of that of the entire country; the added value of the three industries accounted for 43%, 50%, and 43.7% of the national total, respectively. The YREB consists of the three major urban agglomerations in the Chengyu urban agglomeration, the middle reaches of the Yangtze River urban agglomeration, and the Yangtze River Delta urban agglomeration. The area has important ecological status, comprehensive strength, and huge development potential, and is now undergoing a rapid transition, evolving from a rural society into an urban society. The area’s development is faced with such problems as a severe ecological situation, unbalanced regional development, industrial transformation and upgrading, and an incomplete regional cooperation mechanism [51,52]. This provides a typical region for exploring the coordinated development of PLIU. The spatial heterogeneity of the region has great theoretical value and practical significance to the spatiotemporal coupling characteristics and driving mechanism of PLIU. The results can provide a theoretical reference for the coordinated development of PLIU in the YREB, for the government to improve urbanization quality and realize the coordinated development of regional economy.
2.2. Data Source
The data used in this paper are mainly from the China Urban Statistics Yearbook, China Regional Economic Statistics Yearbook and China Urban Construction Statistics Yearbook, 2006–2017. Partial data are obtained by sorting out the above data. However, data were missing in some cities, due to the adjustment of administrative divisions. For example, Chaohu City in Anhui Province was not included in the study. Finally, 110 prefecture-level cities (dijishi) were selected as research objects. According to the definition of population, land, and industrial urbanization, and based on previous studies [38,39], this paper selects the proportion of non-agricultural population in the total population to represent the population urbanization level (Ui). In addition, the proportion of urban built-up area in the total urban area is selected to represent the land urbanization level (Li), and the proportion of the city’s secondary and tertiary industries in terms of GDP is selected to represent the level of industrial urbanization (Ii).
2.3. Methods
2.3.1. The Coupling Coordination Degree Model of PLIU
Population urbanization, land urbanization, and industrial urbanization are three subsystems that are interconnected, and which influence each other in the process of urbanization. The coupling coordination relationship between them is analyzed by means of the coupling coordination degree model. The specific model [1] is as follows:
where is the comprehensive evaluation index of the urban i in the PLIU system; a, b, and c are the weights of each subsystem, respectively (the paper thinks that population, land, and industrial urbanization are equally important, so all are taken as 1/3); are the urbanization levels of population, land and industry, respectively, and is the coupling degree of PLIU in city i, representing the linkage intensity of the interaction among PLIU. The Ci value range is [0,1]. The greater the value is, the higher is the coupling degree. When the value is 1, the coupling degree is the best; when the value is 0, the coupling degree is the worst. The coupling coordination degree is the overall evaluation of the three coordinations on the basis of coupling degree. Finally, Di represents the coupling coordination degree, which represents the coordinated development level of PLIU. The value range of Di is [0,1], and the greater the value is, the higher the coordination degree will be. According to relevant studies [53,54] and the actual situation, the coupling degree is divided into four types (Table 1), and the coordination degree is divided into five types (Table 2).
2.3.2. The Driving Mechanism of PLIU Coordinated Development
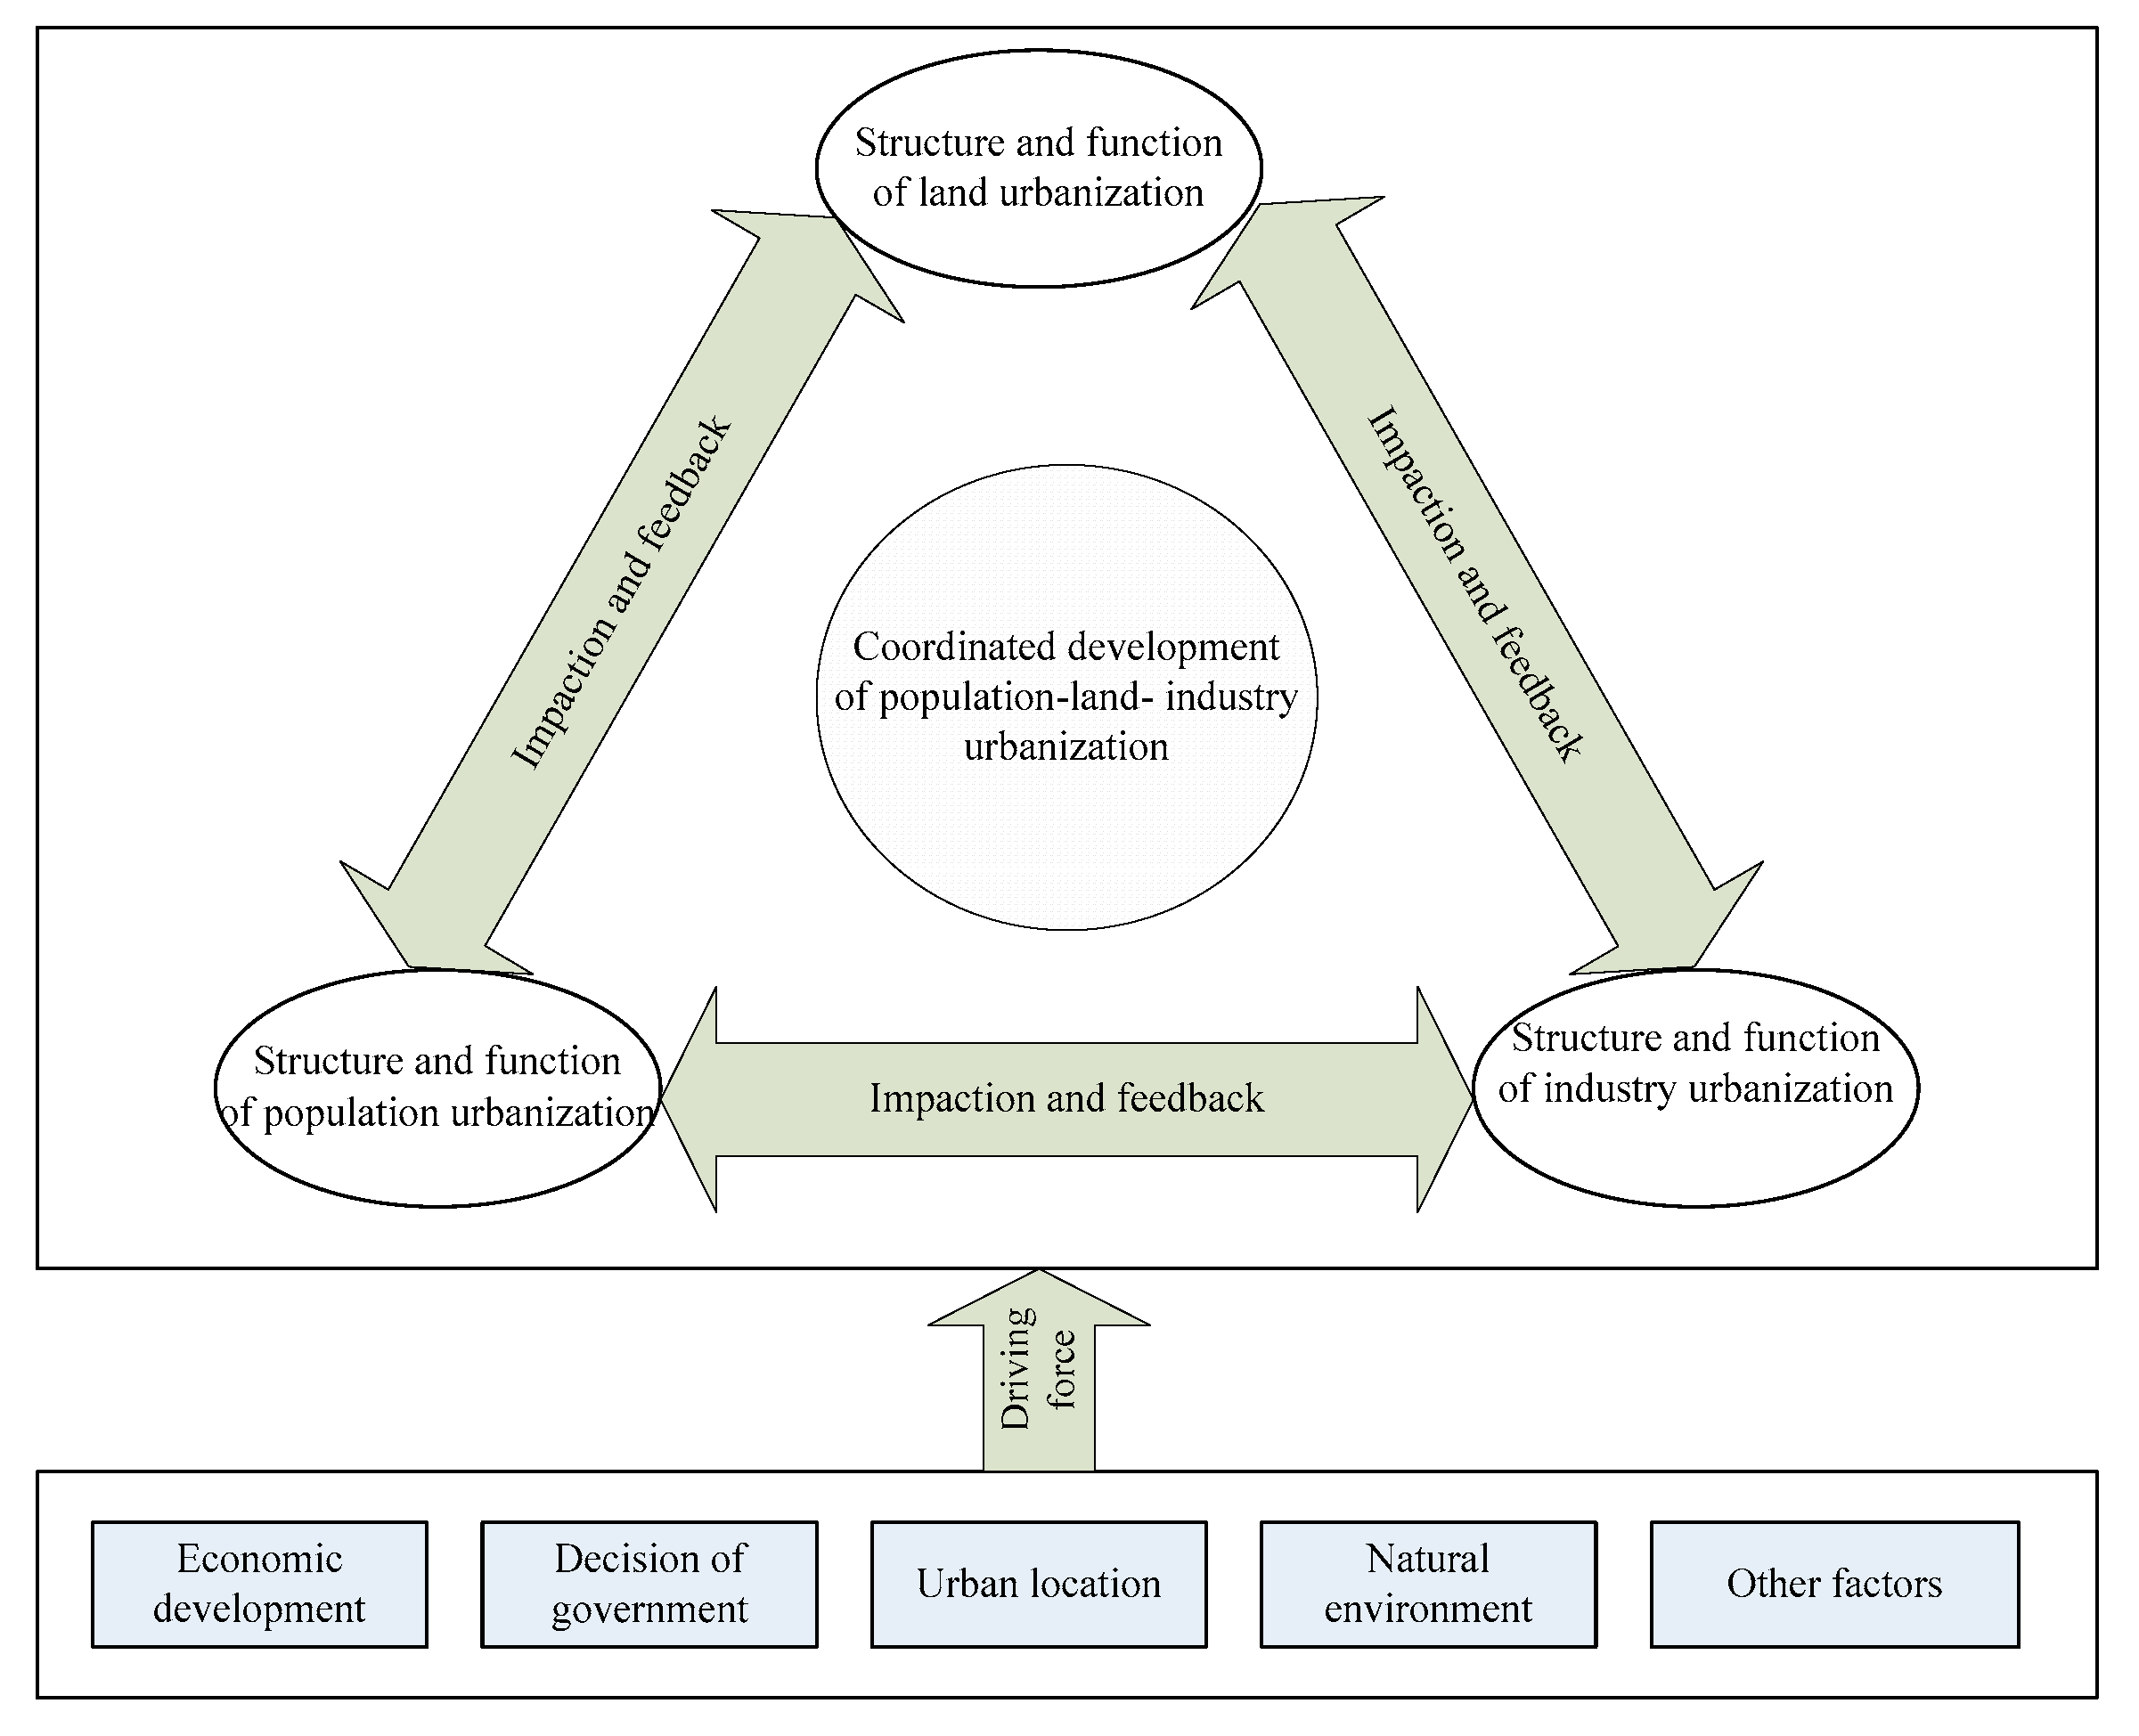
The non-agriculturalization of the population, the expansion of construction land area and the transformation of industrial development are all important bases for promoting the high-quality development of China’s urbanization. Past studies [36,37,38] have shown that, as a complex system, the coordinated development level of urbanization is driven by the economic development level, the government’s decision-making behavior, urban location, natural environment, and other factors (Figure 2).
On the basis of relevant studies, the following assumptions are made:
(1) Economic development is an important driving force of non-agriculturalization, urban land expansion, and industrial development and its coordination, all of which has a significant effect on the coordinated development of urbanization.
(2) The government’s decision-making behavior will significantly affect the resource allocation among cities and between urban and rural areas, including infrastructure facilities, medical and educational resources, and public service resources. These allocations will further affect population flow and industrial development.
(3) Urban location and natural environment play a dual role in urban development. Favorable location conditions will attract more population and more industry, thereby promoting land urbanization and the coordinated development of urbanization. Meanwhile, unfavorable location conditions will limit urban development and adversely affect the coordination of population, land, and industrial development. To sum up, the coordination degree of PLIU is taken as the dependent variable; independent variables are selected to explore the driving mechanism from the three aspects of economic development level, the government’s decision-making behavior, and urban location. Specific indicators are shown in Table 3. Four indicators were selected to represent the level of economic development, including GDP per capita, GDP per unit area of land, the proportion of tertiary industry in GDP, and per capita financial income. Three indicators, including fixed assets investment, number of teachers per 10,000, and the number of hospital beds per 10,000 people, were selected to refer to the government’s decision-making behavior. Three indicators, namely green coverage rate of urban built-up areas, urban road area per capita, and city dummy variable, were selected to represent urban location conditions. Among them, the city dummy variable is represented by the geographical location conditions of the city, such as the topography, the terrain, whether the city is a special economic zone, whether it was a coastal area, and other geographical location conditions of the city, etc., and is scored accordingly.
2.3.3. Spatial Metrological Analysis Based on ArcGIS and GeoDa
In spatial data analysis, it is often necessary to determine whether or not identifiable spatial patterns exist. There are many ways to test for the existence of these patterns; perhaps the most popular is Moran’s I statistic, which is used to test the null hypothesis that the spatial autocorrelation of a variable is zero. If the null hypothesis is rejected, the variable is said to be spatially autocorrelated [55]. GeoDa, a free software program intended to serve as a user-friendly and graphical introduction to spatial analysis for nongeographic information systems (GIS) specialists. It includes functionality ranging from simple mapping to exploratory data analysis, the visualization of global and local spatial autocorrelation, and spatial regression. A key feature of GeoDa is an interactive environment that combines maps with statistical graphics, using the technology of dynamically linked windows [56]. This paper uses spatial autocorrelation and spatial regression analysis of GeoDa to reveal the spatial correlation characteristics and the driving mechanism of PLIU coordinated development in YREB.
Spatial Autocorrelation Analysis
Spatial autocorrelation analysis is used to analyze whether there is significant correlation between the same attribute value of each spatial location and its surrounding location within the scope of the study area. It includes tests and visualization of both global (test for clustering) and local (test for clusters) Moran’s I statistic. The global test is visualized by means of a Moran scatter plot, in which the slope of the regression line corresponds to Moran’s I [57]. Global autocorrelation refers to the comprehensive level of correlation of the same attribute in adjacent locations, which is usually measured by the global Moran’s I index. Local analysis is based on the Local Moran statistic, visualized in the form of significance and cluster maps. Local spatial autocorrelation is used to analyze the regional scale, the spatial location, and the respective levels of the correlation of adjacent positions around the same attribute values. It uses Local Moran’s I index to measure; on this basis, LISA (Local Indicators of Spatial Association) clustering diagram is used to show the spatial agglomeration and discrete characteristics of coordinated development.
Spatial Regression Model of PLIU Coordinated Development
The coordination index of PLIU in the YREB has significant spatial correlation. This paper constructs the adjacent spatial weight matrix of the first order rook in the ArcGIS10.4 in order to make up for the insufficiencies of the traditional measurement model. Then, a common least squares regression model (OLS), a spatial lag model (SLM), and a spatial error model (SEM) are used to make a regression analysis of PLIU by GeoDa. The optimal model is analyzed by the spatial dependence test [58], SLM mainly considers spatial autocorrelation on the basis of traditional panel model and can measure the interaction of different spatial individuals. The basic model is as follows:
where is the spatial autocorrelation coefficient, which represents the interaction between spatial individuals; W is the spatial weight matrix; i = 1, 2, 3, … , N, is the individual on the cross section (a certain region, range); t = 1, 2, 3, ... , T, is the time point (a certain moment) in the time series; yit is the explained variable in region i and time t; Xit is the explanatory variable in region i and time t; is the effect of spatial individuals, reflecting the spatial characteristics that are not affected by time; is the regression coefficient; is the random error term, which is related to both time and space, and its mean is 0, and its variance is , independently identically distributed.
The basic form of SEM is as follows:
where is the spatial autocorrelation coefficient, reflecting the degree of spatial correlation between regression residuals; is the spatial error of autocorrelation; W is the spatial weight matrix; i = 1, 2, 3, … , N, is the individual on the cross section (a certain region, range); t = 1, 2 , 3, ... , T, is the time point (a certain moment) in the time series; yit is the explained variable in region i and time t; Xit is the explanatory variable in region i and time t; is the effect of spatial individuals, reflecting the spatial characteristics that are not affected by time; is the regression coefficient; is the random error term, which is related to both time and space, and its mean is 0, and its variance is , independently identically distributed.
3. Results
3.1. Spatio-temporal Characteristics of PLIU Coupling Degree
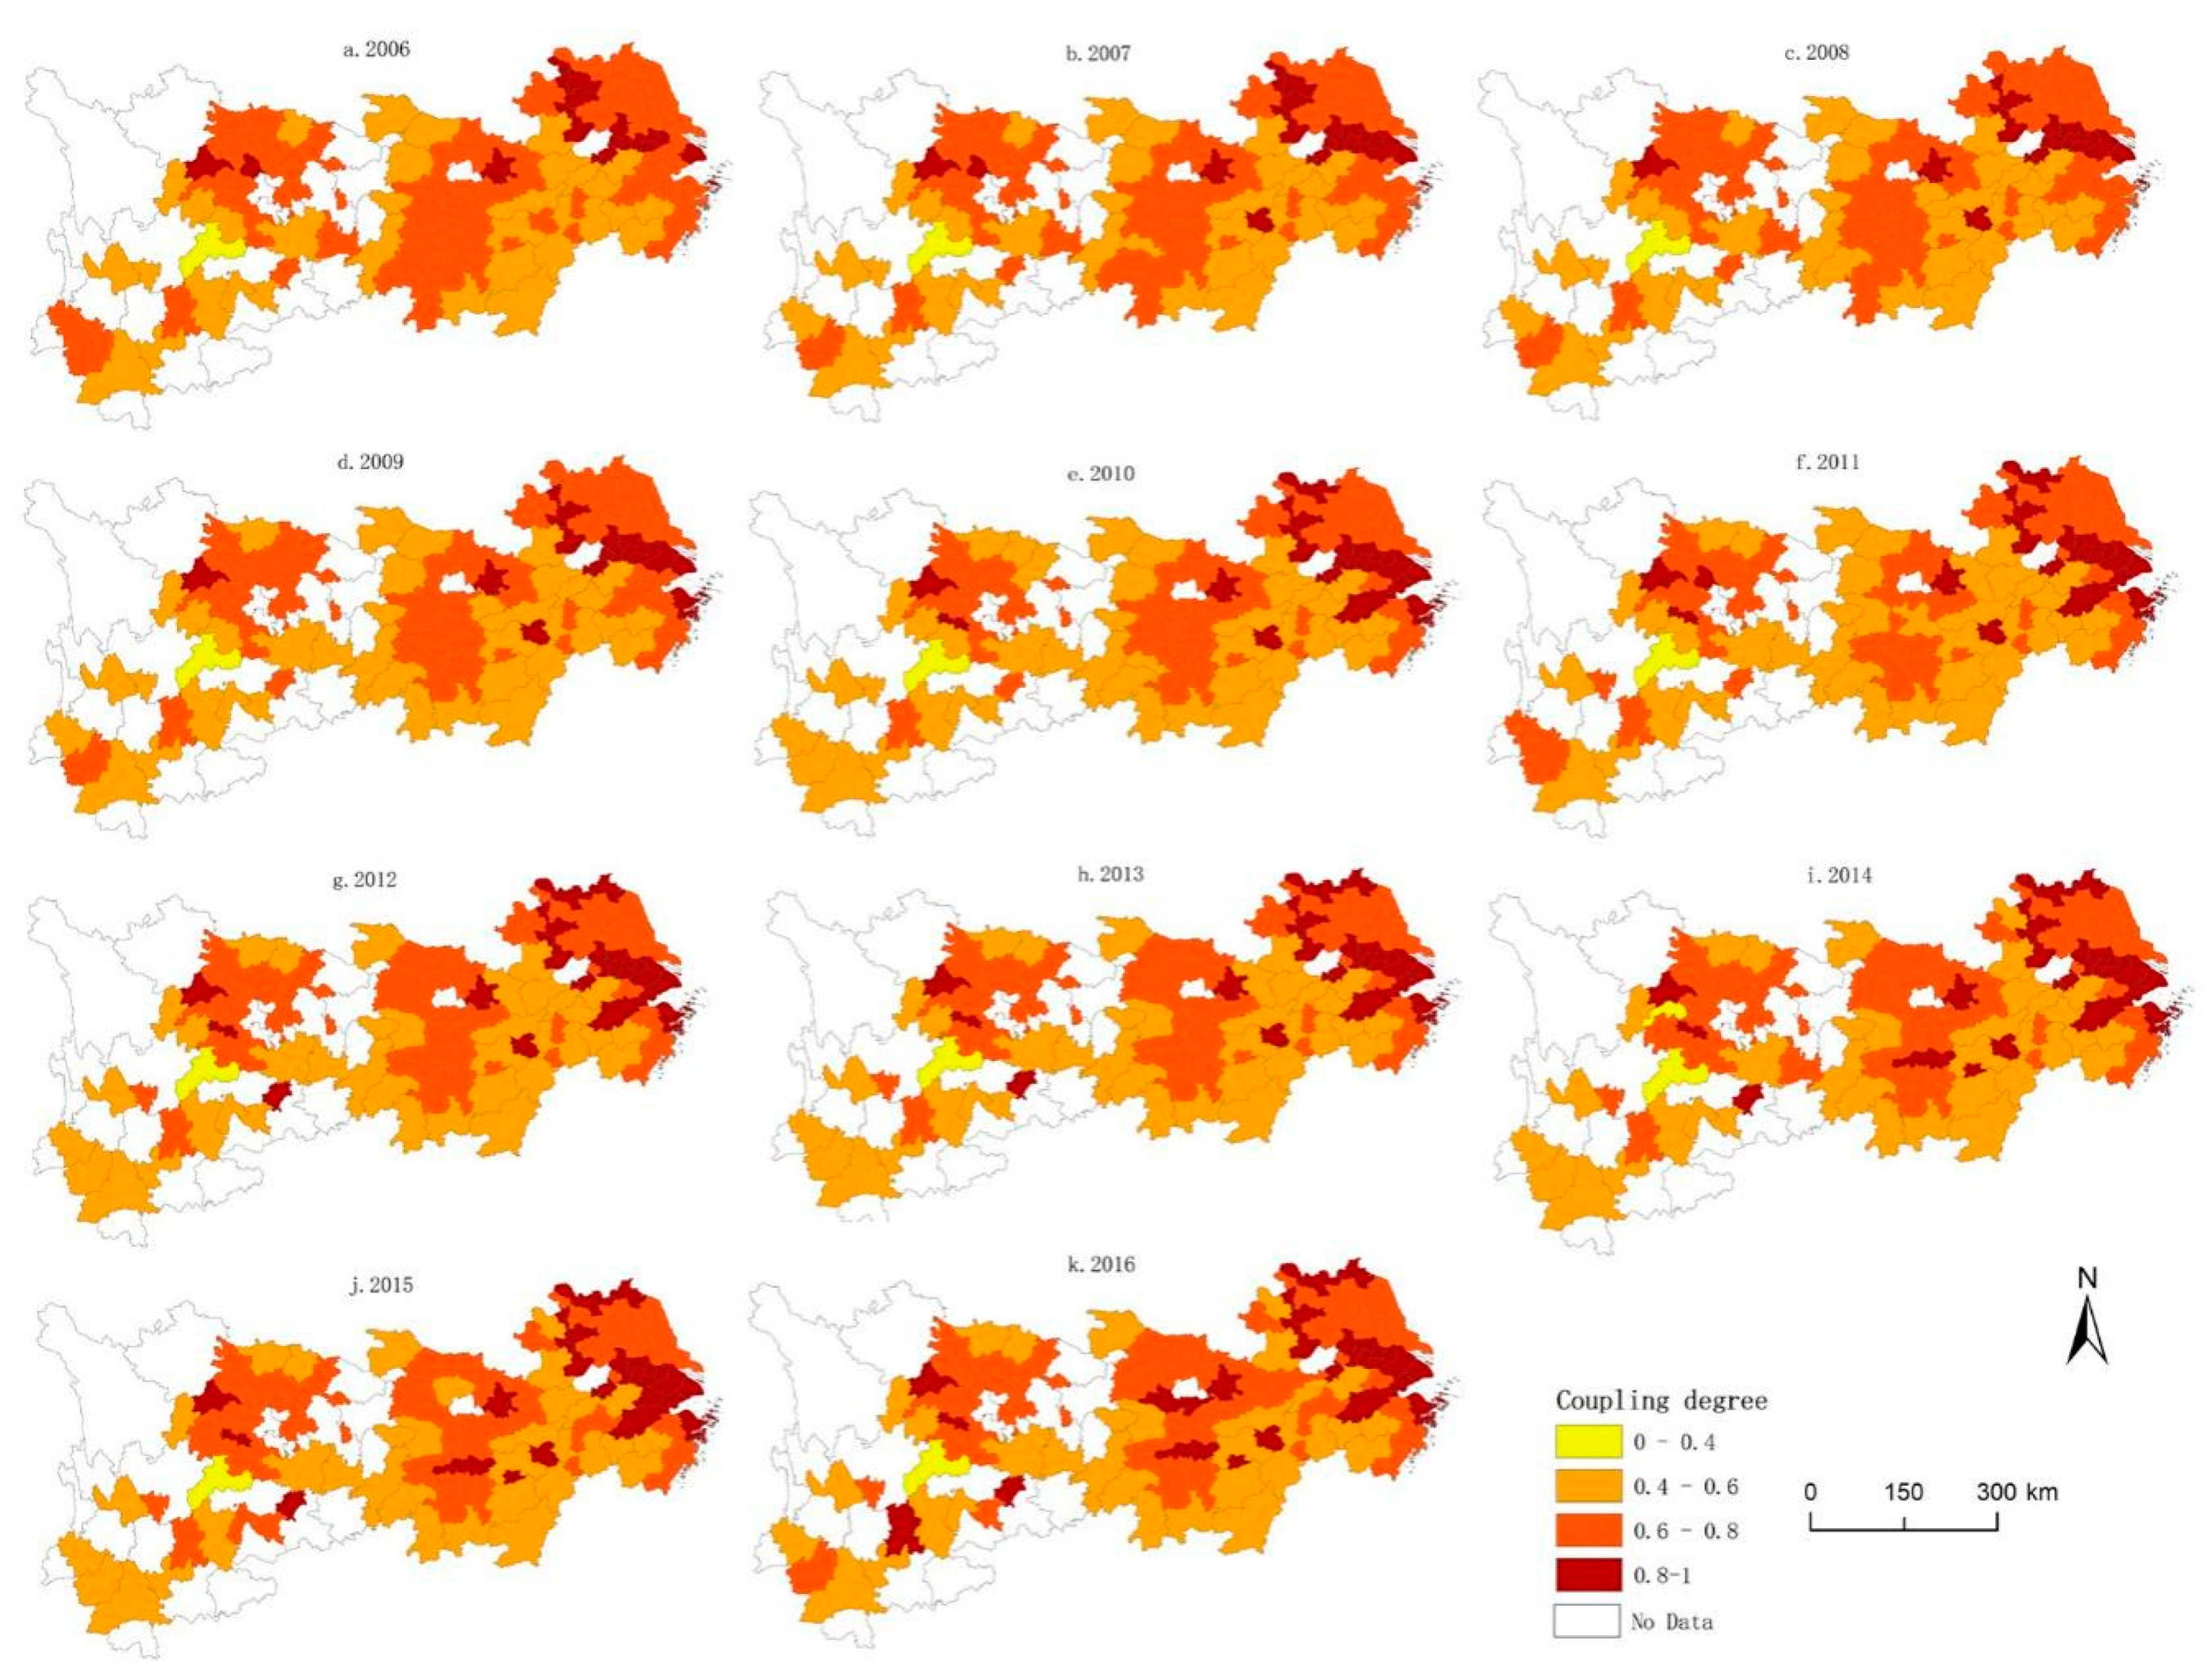
According to the above models and methods, the coupling degree of PLIU in the YREB from 2006 to 2016 is calculated. The spatial distribution diagram of the coupling degree is drawn through ArcGIS10.4 (Figure 3). Then, the spatiotemporal characteristics of the coupling degree development are analyzed.
In terms of time scale, the coupling degree increased slowly, from 0.661 in 2006, to 0.681 in 2016, representing an increase of 3.7% in 11 years and an average annual increase of less than 0.4%. In 2016, the average coupling degree was 0.681. This year belongs to the running-in period, and there is still a large distance from the coupling coordination period. According to the current coupling development trend, the YREB will be in a run-in period for the next decades. That is, the population, land, and industrial urbanization will begin to balance and coordinate, but land urbanization will continue to occupy a dominant position, while population and industrial urbanization relatively lag behind. In terms of spatial pattern, there is a distinct spatial differentiation in the coupling degree. Cities of high value are mainly distributed in the developed areas, such as the Chengyu urban agglomeration, the middle reaches of the Yangtze River urban agglomeration, and the Yangtze River Delta urban agglomeration. The high value coupling zone is centered on the central city and on provincial cities with developed economies, dense population, and strong industry. This coupling zone will gradually diffuse and decrease outwardly in the form of circles. Cities with a low coupling degree are mainly distributed in Guizhou, Hunan, and Yunnan. On the whole, the Chengdu-Chongqing urban agglomeration, the middle reaches of the Yangtze River urban agglomeration, and the Yangtze River Delta urban agglomeration, are in the period of running-in and coordinated coupling, and PLIU is beginning to form good ordered structures. The central cities of the three urban agglomerations have formed a benign coupling structure, and the surrounding cities are in the period of antagonism and low coupling, with a striped distribution pattern. Land urbanization is absolutely dominant; industry and population urbanization lag behind, and the structure between urbanization systems needs to be further optimized in these urban areas.
3.2. Spatial-Temporal Characteristics of PLIU Coordination Degree
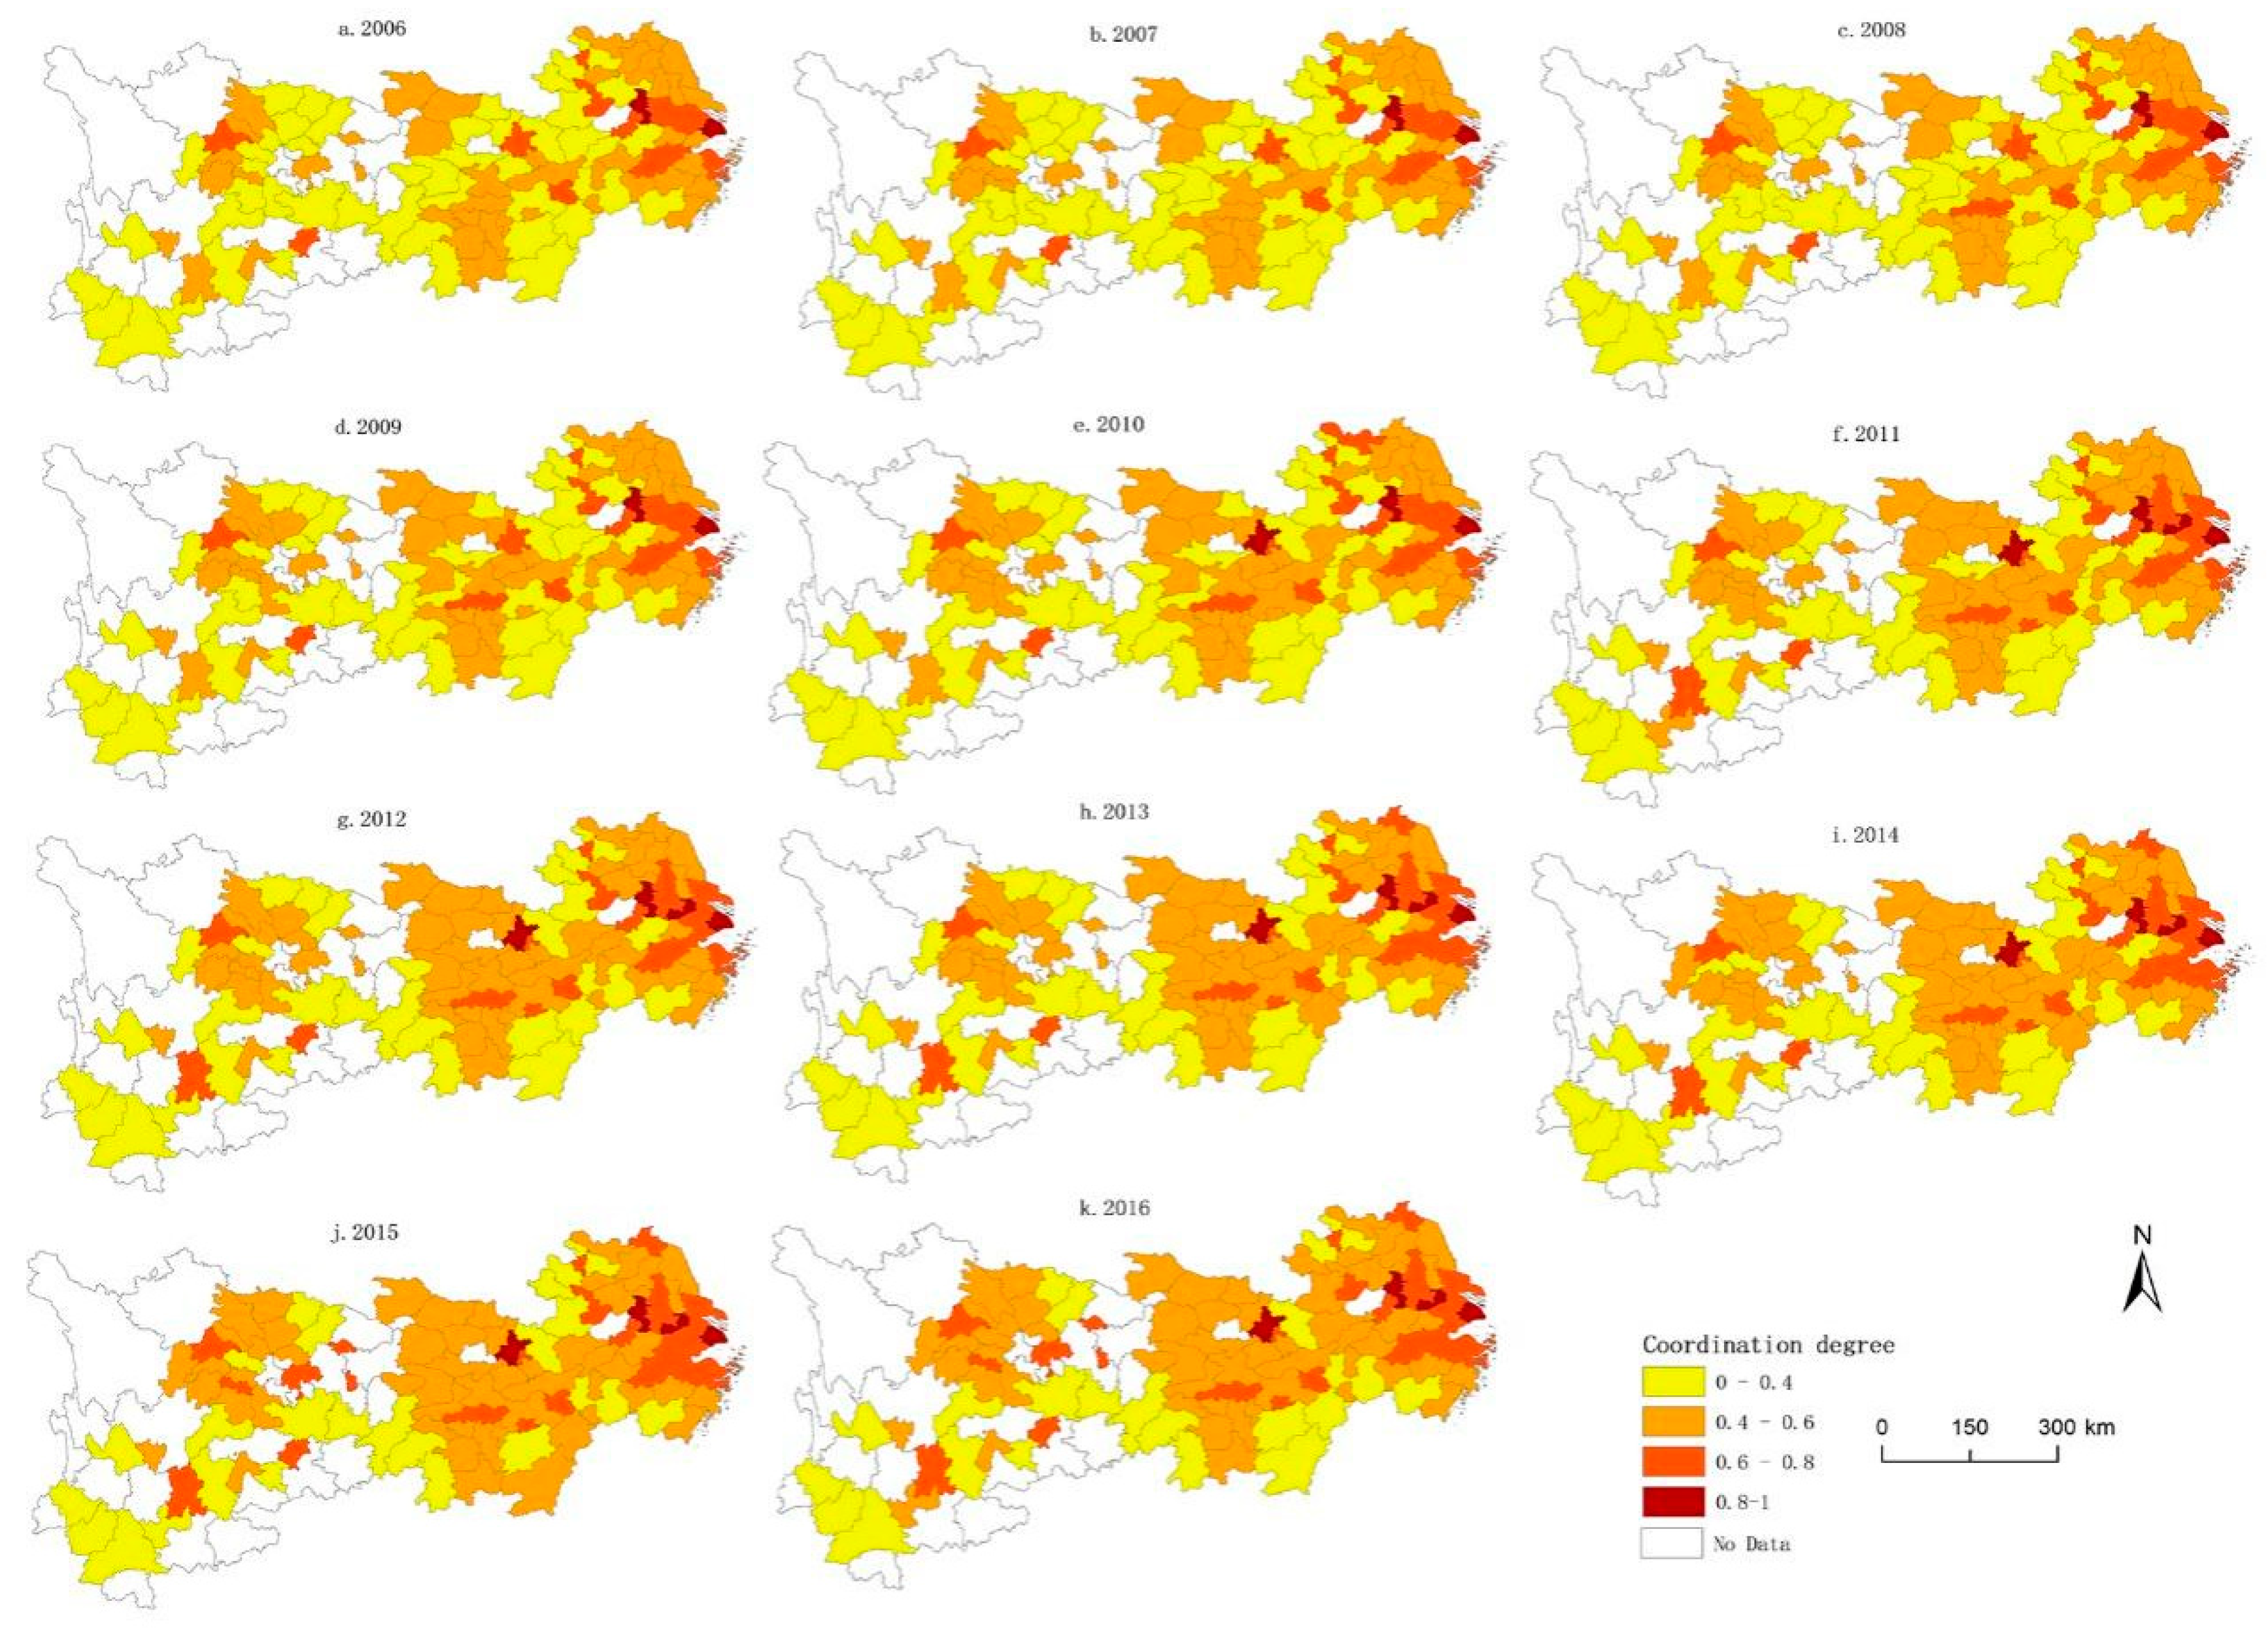
One need not only consider the effect intensity of PLIU, but also its overall coordination, in order to judge whether the transition of PLIU is reasonable. In terms of time scale, the coordination degree experienced an obvious rising trend from 2006 to 2016. The average level of coordination degree rose from 0.45 to 0.51, with an accumulative improvement rate of 13.3% and an average annual increase of 1.2%. By 2016, the average level of coordination degree was 0.51, which was a medium coordination state. According to this trend, the YREB will be in a medium coordination state for the next decade. That is, the PLIU system will be in a cooperative evolution state, but the response sensitivity is still relatively slow. With regard to the spatial pattern (Figure 4), the coupling and the coordination degree of PLIU presents a certain relevance.
The high coordination and the high coupling area are roughly consistent, being mainly distributed in developed cities, a provincial capital city, and the central city of the downstream area. Moderate coordination and low-grade coordination are mainly distributed in cities in the middle and upper reaches. Non-harmonious cities are mainly distributed in the provinces of Yunnan and Guizhou. In general, the coordination is characterized by the distribution of stripes, which are gradually decreasing from east to west. The coordination degree of the upper reaches is the lowest, but the base is small, the potential for ascension is great, and the growth rate is faster. The coordination degree of the middle reaches is moderate, and the growth is slower. The coordination degree of the downstream cities is the highest, the base is large and the growth is slow. The coordination of the YREB has been rising, and the difference is narrowing. Urbanization is also becoming more coordinated and balanced.
3.3. The Spatial Correlation Characteristics of PLIU Coordinated Development
In order to reveal the spatial correlation characteristics of PLIU coordinated development in YREB, GeoDA is employed to conduct global spatial autocorrelation and local spatial autocorrelation analysis based on the coordinated development evaluation results from 2006 to 2016.
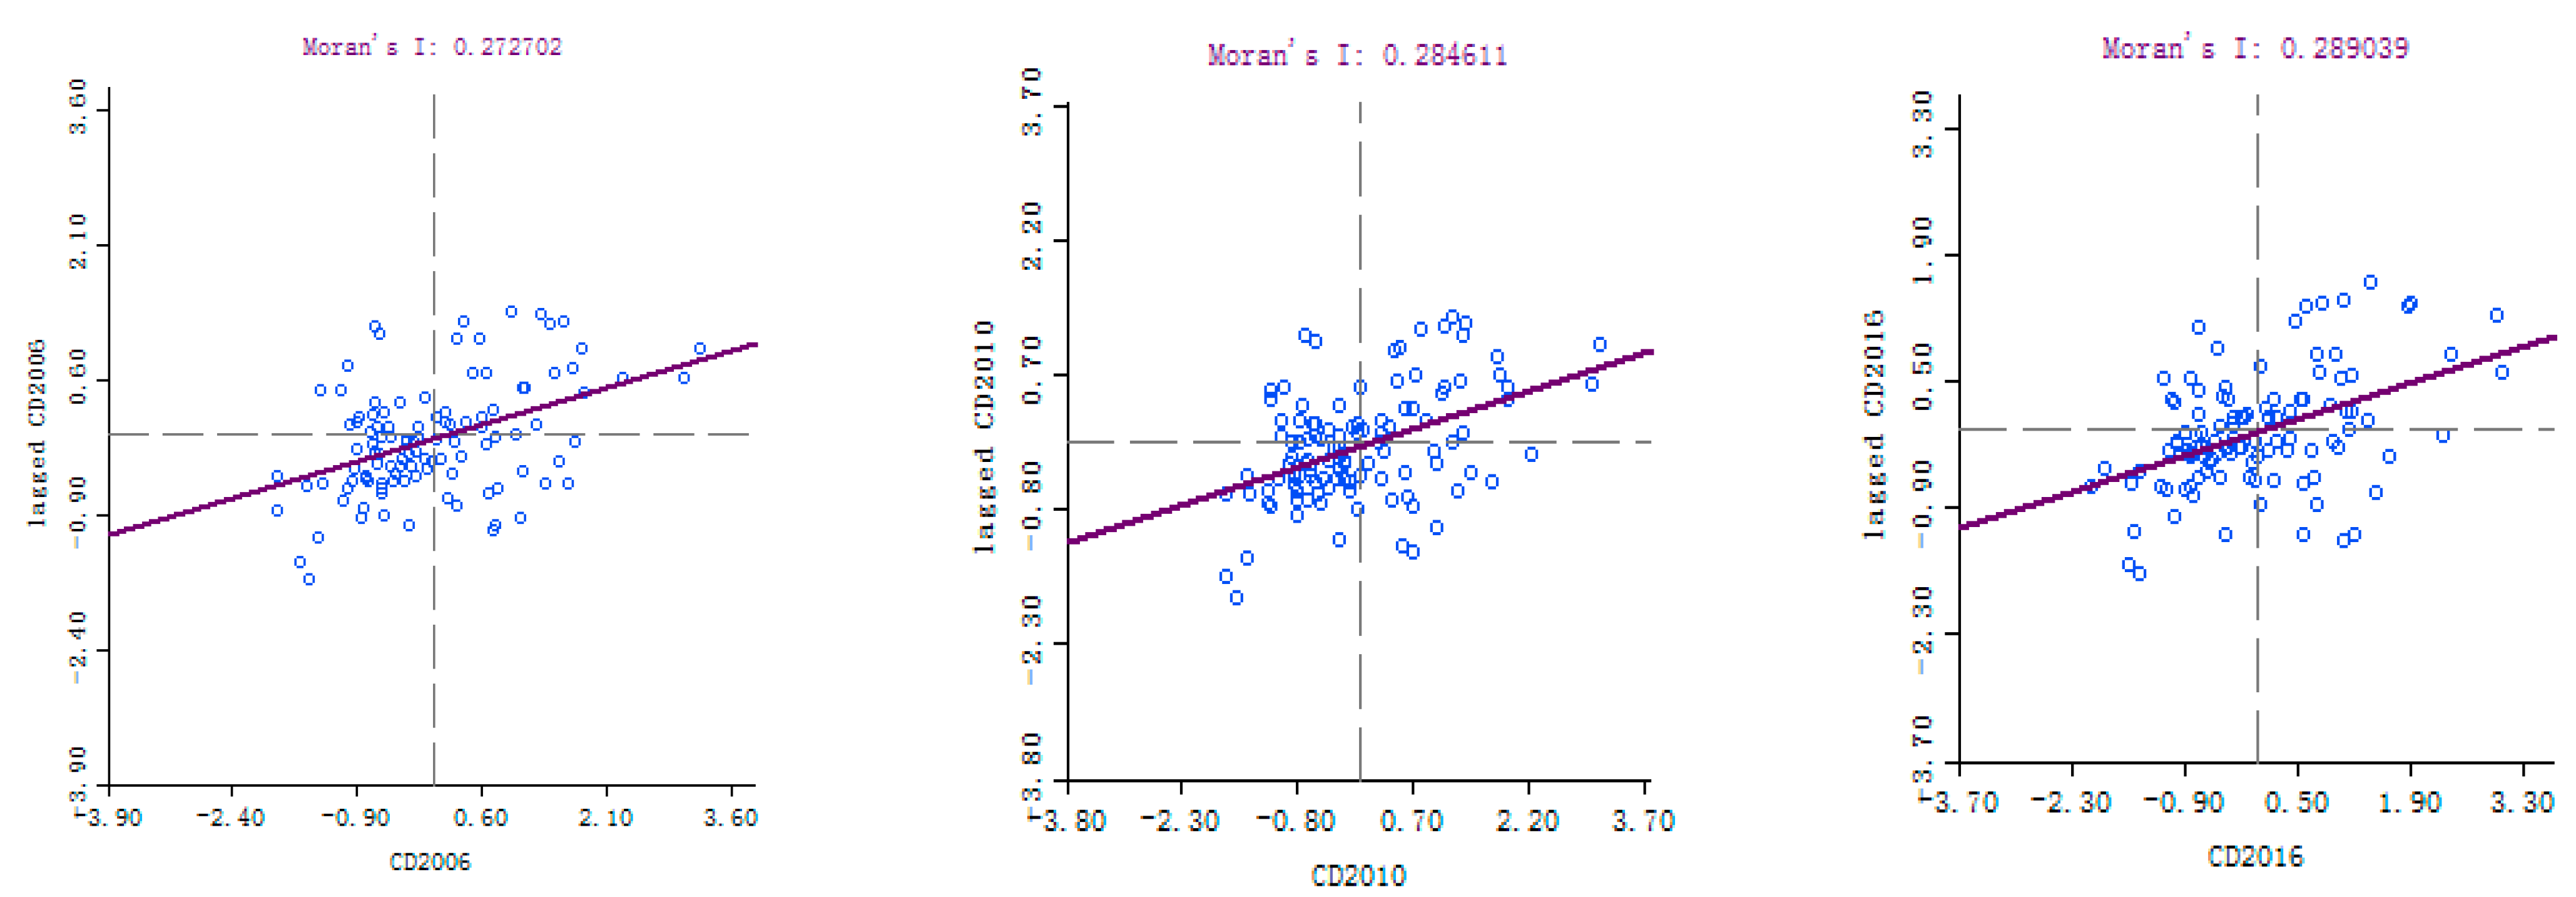
3.3.1. Global Autocorrelation Analysis
The global Moran’s I index was adopted to analyze the spatial correlation level of coordinated development, and the spatial weight matrix was constructed in the GeoDA platform. Based on the coordinated development degree of 110 cities in the YREB in 11 years, the correlation level of coordinated development was calculated (Figure 5). In the Figure 5, CD2006, CD2010, and CD2016 represent the autocorrelation level of coordination degree in 2006, 2010 and 2016, respectively.
The value range of Moran’s I index is [–1, 1]. The closer Moran’s I is to 1, the stronger the spatial positive correlation is in this region. When Moran’s I is close to 0, there is no spatial autocorrelation. The closer Moran’s I is to −1, the stronger the spatial negative correlation is in this region. The coordinated development of Moran’s I index at 0.01 significant level were 0.27, 0.28, 0.29 in 2006, 2010, and 2016, and it develops very stably. The results show that the spatial autocorrelation is obviously positive, most of the points fall in the first and third quadrants, and show the characteristics of concentration distribution, which indicates that the coordinated development of the YREB has obvious spatial agglomeration.
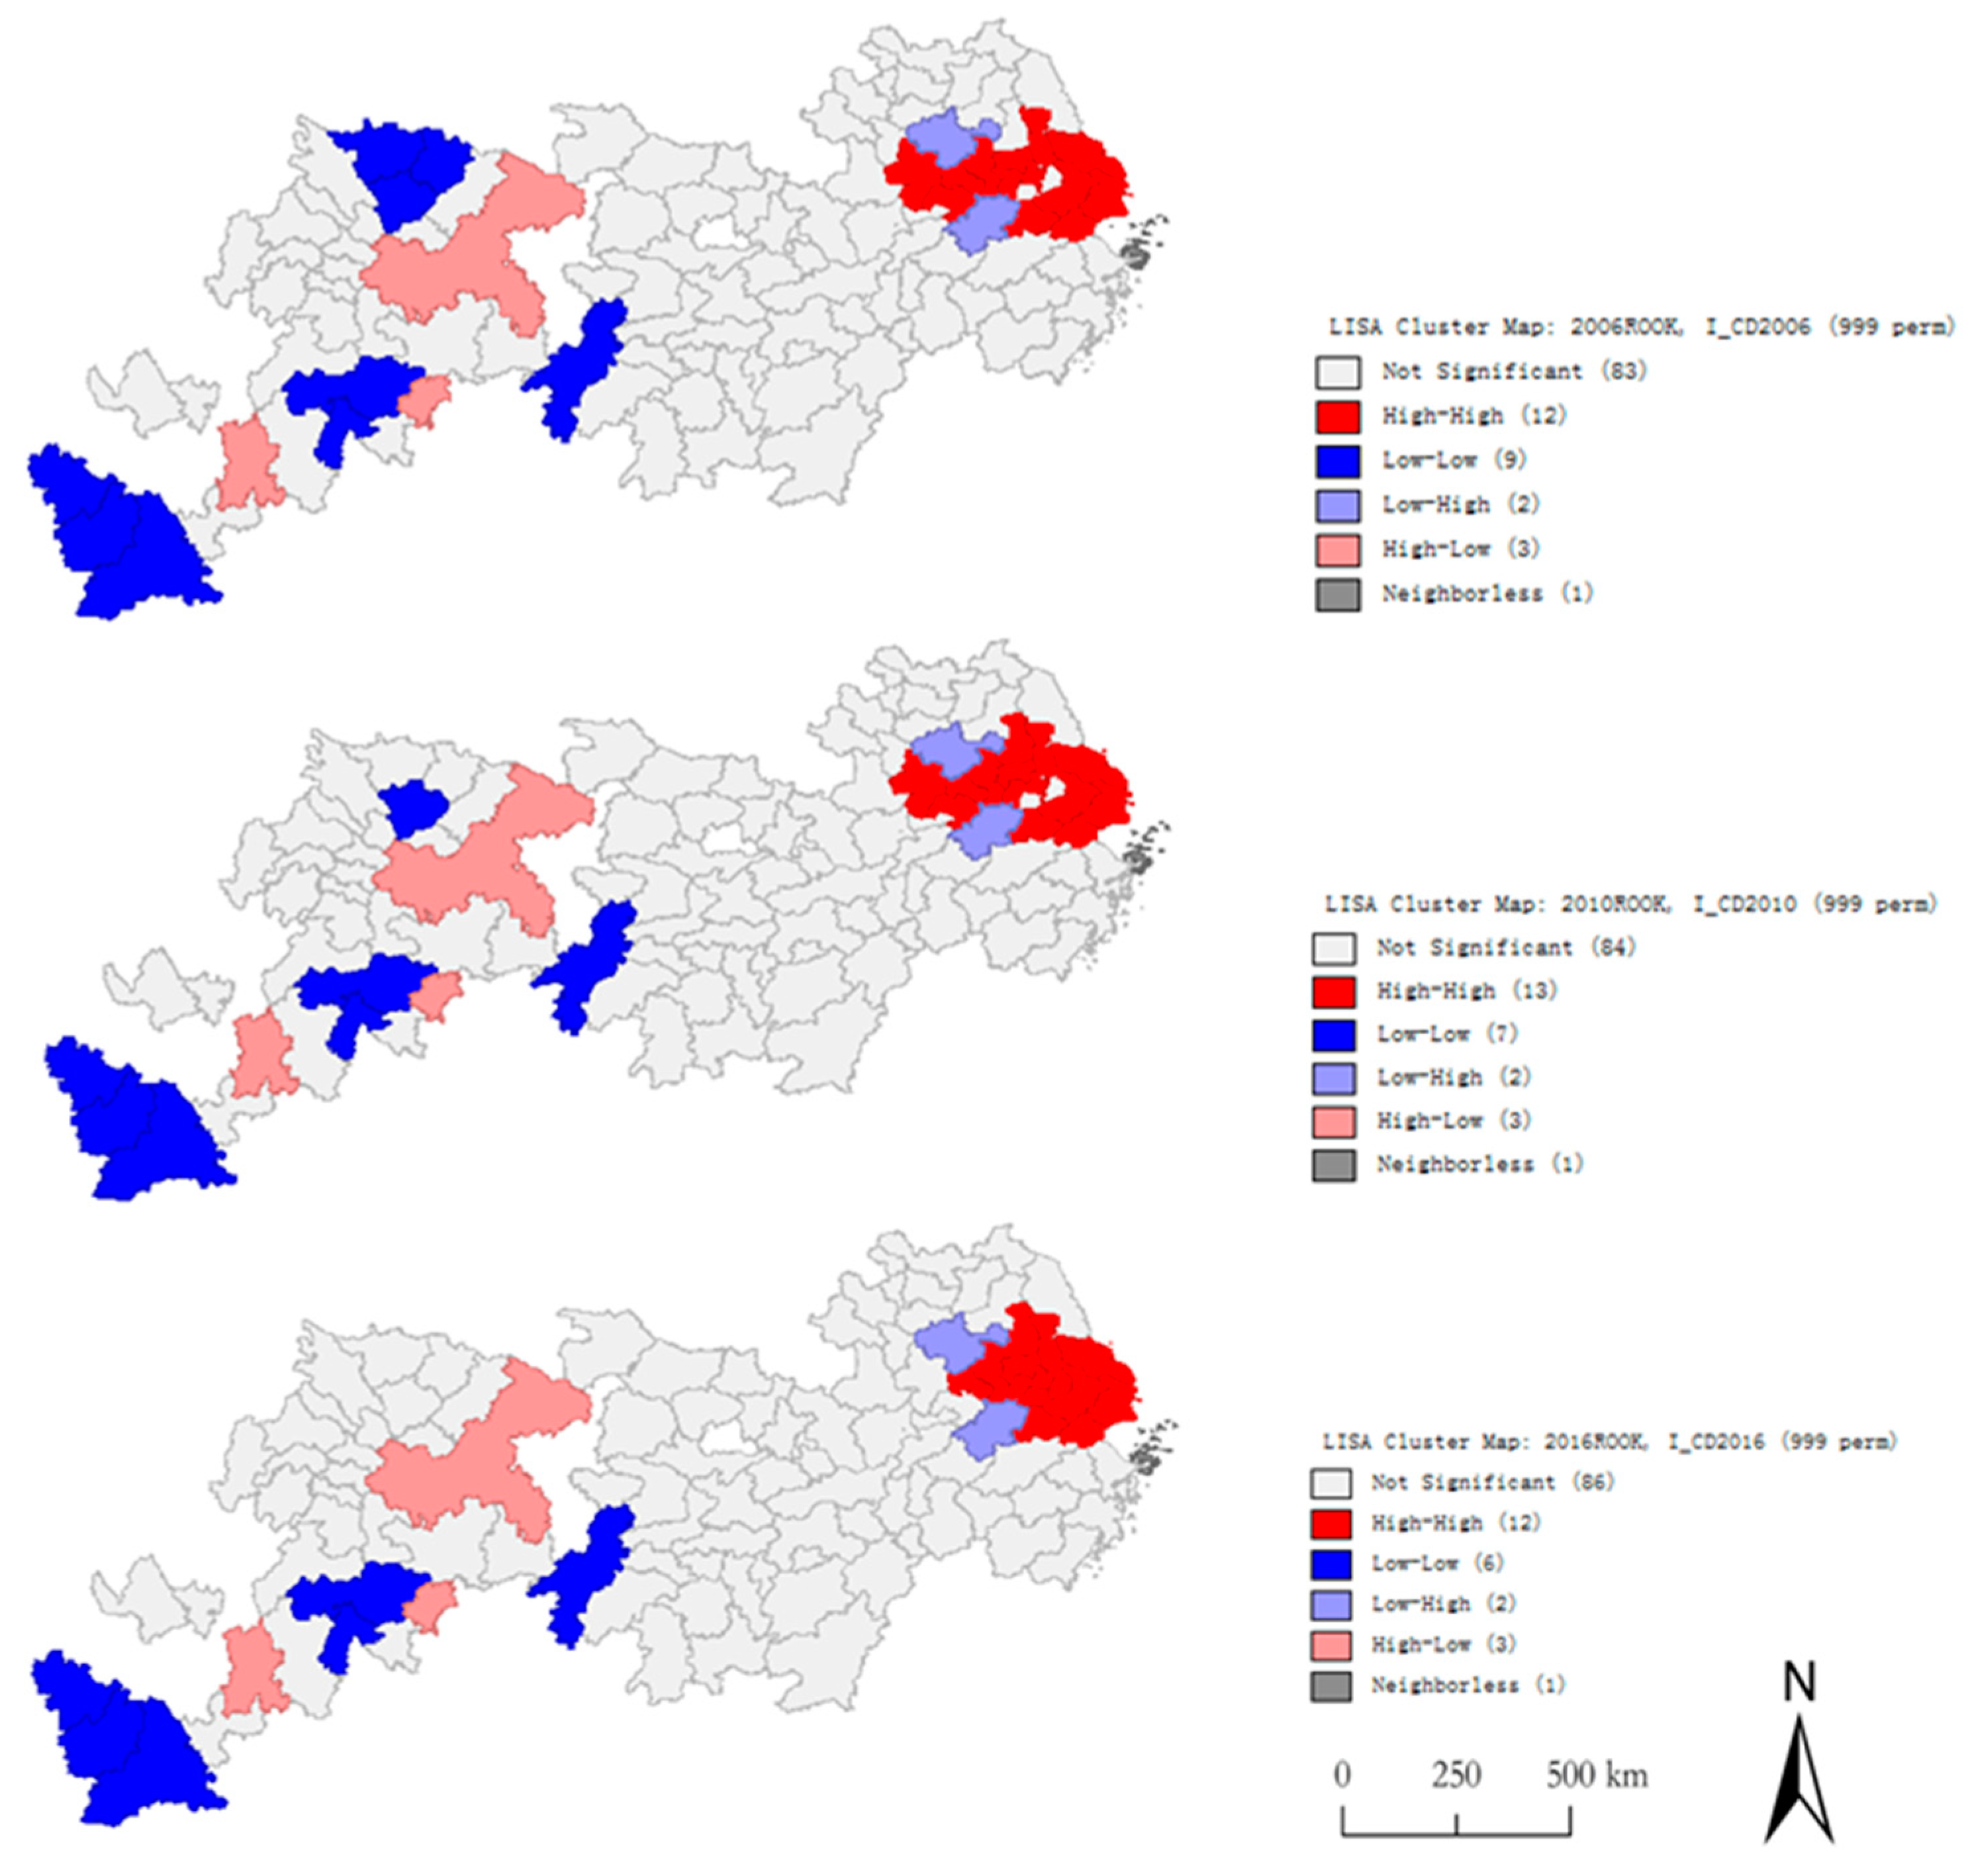
3.3.2. Local Spatial Autocorrelation
Local Moran’s I index and LISA clustering diagram are used to explore the correlation characteristics of local spatial correlation. According to the local Moran’s I index and Lisa cluster diagram, the spatial correlation characteristics of PLIU coordinated development in cities can be divided into five categories: “high-high” (H-H) aggregation, namely high-value spatial clustering; “Low-low” (L-L) aggregation, namely low-value spatial clustering; “High-low” (H-L) aggregation, i.e., the observed values of the surrounding adjacent positions are much lower than the observed values of position i; “Low-high” (L-H) aggregation, that is, the observed values at adjacent locations are much higher than the observed values at location i; “Not significant,” means the observed area is not correlated with the surrounding area. Due to the long study period and relatively stable spatial correlation, LISA clustering diagrams of 2006, 2010, and 2016 were selected to analyze the local correlation characteristics of PLIU coordinated development in the YREB (Figure 6).
3.4. The Driving Mechanism of PLIU Coordinated Development
According to the coordination index and explanatory variables of PLIU, the common least square regression model (OLS), spatial lag model (SLM), and spatial error model (SEM) were used, respectively, to detect the driving factors of PLIU coordinated development. The model selection was based on the spatial dependence test results. In the case of a significant Moran’s I index, the lM-lag value was larger than the lM-error. Also, the lL-LM error was significant, but the lR-LM error was not significant. Therefore, the SLM model was selected. Conversely, the SEM model is selected [59]. According to the results of the spatial dependence test (Table 4), the LM- error is more significant statistically than the LM-lag, and the LL-LM error is significant, while the LL-LM lag is not. Therefore, one can conclude that the SEM model has the best interpretation effect on the change of coordination degree.
In order to solve the problem of multicollinearity, the factor analysis method is used to eliminate the relevant variables. C2, C3, C5, and C7 are deleted from the model, in order to reduce the influence of heteroscedasticity, the paper take the logarithm of the explained variable and then performed OLS estimation. The result of OLS estimation is as follows: multicollinearity condition number is 25.05, test on normality of errors, p is 0.023, problem of multicollinearity can be ignored. Breusch-Pagan test is 4.8177, p > 0.05, problem of heteroskedasticity can be ignored. Adjusted R-squared is 0.7167, p is 0.02 < 0.05, the model is significant. The coordination degree of PLIU is the result of multiple factors by SEM (Table 5).
R-squared is 0.7600, the fitting degree of the model is very good; log likelihood is 64.6337, Sigma-square is 0.0175, Lambda is 0.0023 < 0.05, the model is significant. Meanwhile Breusch-Pagan test is 4.3384, p is 0.6310 > 0.05, problem of heteroskedasticity can be ignored, the Value of Likelihood Ratio test is 8.5612, p is 0.0034, spatial error dependence is significant. The driving mechanism of economic development, the government’s decision-making behavior and urban location are as follows:
(1) The coordination degree of PLIU presents a significant positive correlation with GDP per capita at the significance level of 1%, while per capita financial income has no significant influence. GDP per capita represents the level of urban industrial development. The impact of industrial development on the coordination degree is reflected in two aspects: on the one hand, industrial development can absorb a large number of laborers, thus promoting the transfer of rural population to urban areas and helping to realize population urbanization. On the other hand, land urbanization supported by industrial development has the ability to drive sustainable development and to promote the optimal allocation of land. With the advancement of urbanization, land, industry and the labor force gradually turning to high-tech and service industries, the utilization efficiency of factors will improve, thus promoting the optimal allocation of population, land, and industrial resources, and improving the coordination and sustainable development of urbanization.
(2) The coordination degree of PLIU is significantly positively correlated with green coverage rate in urban built-up areas at the significance level of 5%, while the number of teachers per 10,000 people has no significant influence. Green coverage rate in urban built-up areas represents the government’s decision-making behavior. A good urban environment is a great attraction to the population and industry.
(3) The coordination degree of PLIU is significantly positively correlated with urban traffic condition at the significance level of 10%; there is also positively correlated with urban road area per capita at the significance level of 10%. The urban dummy variable has positively significant influence at the significance level of 5%. ① Urban traffic is an important component of population mobility and industrial transport. Good traffic conditions will promote the flow of people, enhance the industrial connection between cities, improve the efficiency of land use, strengthen the relationship between employment, land, and industry, and coordinate the transformation of the population, land, and industry. ② A city’s location has significant influence on the coordination of PLIU. The downstream of the YREB, which is flat, is suitable for the development of industry and agriculture. This area has attracted a large number of people and industry agglomeration, significantly improving the urbanization level and coordination. Compared with the flat downstream area, the upstream region, where the terrain has many ups and downs, is bigger but is not conducive to the layout of industry and agriculture. As such, the upstream urbanization lags far behind the downstream areas.
4. Conclusions and Discussion
4.1. Conclusions
(1) In terms of time scale, land urbanization occupies a dominant position, while the development of population and industrial urbanization lagged behind from 2006 to 2016. The coordination degree of PLIU experienced an obvious rising trend but will be in the running-in period for a long time to come. With regard to the spatial pattern, the coupling degree of PLIU has obvious spatial differentiation. High coupling areas are mainly distributed in the downstream developed cities, provincial capital cities, and central cities. Low coupling areas are mainly distributed in middle- and upper-reach cities, while non-harmonious cities are mainly distributed in the provinces of Yunnan and Guizhou. In general, the coupling degree of the Chengdu-Chongqing urban agglomeration, the middle reaches of the Yangtze River urban agglomeration, and the Yangtze River Delta urban agglomeration are all in the period of running-in and coordinated coupling. The population, land and industrial urbanization have begun to form a good orderly structure, and the central cities have formed a benign coupling structure.
(2) The coupling and coordination degree of PLIU show a certain correlation in spatial distribution. In addition, the regions with a high coordination degree and high coupling degree are roughly consistent and are mainly distributed in downstream developed cities, provincial capital cities, and central cities. Moderate and low coordination regions are mainly distributed in cities in the region’s middle and upper parts, while non-harmonious cities are mainly distributed in parts of Yunnan and Guizhou Provinces. The coordination degree of the middle and lower reaches of the YREB is increasing, and the difference is gradually narrowing; the urbanization process also gradually tends to be coordinated and balanced.
(3) The coordinated development of PLIU in the YREB has significant positive spatial autocorrelation, showing obvious spatial agglomeration characteristics from 2006 to 2016. H-H agglomeration areas are concentrated in the downstream developed areas such as Jiangsu, Zhejiang, and Shanghai. There are significant spillover effects such as regional coordination in these areas, which improves the overall level of coordinated development among regions. L-L agglomeration areas are mainly concentrated in upstream undeveloped areas of Hunan, Sichuan, Guizhou, Yunnan provinces, but the number of their cities shows a decreasing trend, indicating that their coordinated development situation is gradually improving.
(4) The coordination degree of PLIU is the result of the comprehensive effects of urban economic development level, the government’s decision-making behavior, urban location, and other factors. The level of economic development, urbanization investment and urban environment, traffic, and city geographical locations all play a decisive role. Therefore, the following suggestions are proposed: ①Continue to promote the economic development to ensure the coordinated development of regional economies. ②Strengthen investment in urbanization. Improve urban environments to attract population and industry layout, promoting the citizenization of population and upgrading of the industry. ③ In the process of urbanization, pay closer attention to the urbanization of the “people”. Improve traffic conditions to optimize land use, and to attract the population and industrial agglomeration, promoting the transformation of land, population, and industrial urbanization.
4.2. Discussion
The YREB is a good study area for probing into the coupled coordination of urbanization in population, land, and industry to improve urbanization quality. Taking the Belt as an empirical area, this paper probed into the coordinated development of the urbanization of population, land, and industry. This study came up with some significative conclusions. This paper contributes to the existing literatures. At present, obvious spatial differences exist in the coupling and coordination degrees of PLIU in the YREB. The Chengdu-Chongqing urban agglomeration, the middle reaches of the Yangtze River urban agglomeration, and the Yangtze River Delta urban agglomeration are in a state of high coordination, while the coordination degree of PLIU in other regions has been and will remain at a low level for a long time. Thus, compared to the existing research on land and population mismatch, this study contributes to the existing literatures by exploring urbanization quality, spatial correlation, and influencing factors from the perspective of three-dimensional urbanization in the YREB. Regional coordinated development is a guarantee of high-quality development. The results of spatial correlation research can provide reference for the government to formulate regional coordinated development policies in the three major urban agglomerations—the Chengdu-Chongqing, the middle reaches of the Yangtze River and the Yangtze River Delta. As an important strategic region for China’s development, the YREB should not only pay attention to the development of several core city clusters; the coordinated development of surrounding cities should also be taken into account. Only in this way can the quality of YREB urbanization be comprehensively improved and can the YREB be transformed into a city belt with global influence.
In other words, population, land, and industry are the three core elements of urbanization. In this article, a coupled coordination degree model, spatial analysis method, and spatial metering model are employed to probe into the coupled coordination of urbanization in population, land, and industry. This research provides a theoretical reference for the government’s formulation of differentiated policies aimed at improving urbanization quality. However, the quality of urbanization is also affected by factors such as urban governance, city size, and ecological environment. In the future, we will conduct further studies on more dimensions to promote the coordination among various elements and improve the quality of urbanization. In addition, we will continue to improve the model and improve data in the future.
Author Contributions
Conceptualization, L.H. and P.Y.; software, P.Y. and B.Z.; data curation, P.Y. and L.H.; visualization, B.Z.; methodology, P.Y. and B.Z.; the writing original manuscript, L.H. and P.Y.; reviewing-editing, L.H. and W.H.; supervision, funding Acqusition, L.H. and W.H. All authors have read and agreed to the published version of the manuscript.
Funding
This research was funded by the National Natural Science Foundation of China (grant number 71,673,105; grant number 71,403,083), and Humanities and Social Science Research Funds for Education Department of Hubei Province (grant number, 20D004).
Data Availability Statement
Not applicable.
Acknowledgments
We thank the anonymous referees for their comments on the paper. We are grateful to Hai Liu, Man Yuan and Liu Tian for their help in the part of data processing. All of the errors and omissions remain our own.
Conflicts of Interest
The authors declare no conflict of interest.
References
- Yany, R.; Liu, Y.S.; Long, H.L. The study on non-agricultural transformation co-evolution characteristics of “population-land-industry”: Case study of the Bohai Rim in China. Geogr. Res. 2015, 34, 475–486. [Google Scholar]
- Jian, X.H.; Luo, J.J.; Huang, K. China’s Urbanization: Quality problems and Healthy Development. Contemp. Financ. Econ. 2013, 9, 5–16. [Google Scholar]
- Duan, C.R.; Lv, L.D.; Zhou, X.J. Major Challenges for China’ s Floating Population and Policy Suggestions: An Analysis of the 2010 Population Census Data. Popul. Res. 2013, 37, 17–24. [Google Scholar]
- Liu, Y.S. Research on the urban-rural integration and rural revitalization in the new era in China. Acta Geogr. Sin. 2018, 73, 637–650. [Google Scholar]
- Guy, S.; Henneberry, J. Understanding urban development processes: Integrating the economic and the social in property research. Urban Stud. 2000, 37, 2399–2416. [Google Scholar] [CrossRef]
- Lin, G.C.S. Reproducing spaces of Chinese urbanisation: New city-based and land-centred urban transformation. Urban Stud. 2007, 44, 1827–1855. [Google Scholar] [CrossRef]
- Firman, T. Land conversion and urban development in the northern region of West Java, Indonesia. Urban Stud. 1997, 34, 1027–1046. [Google Scholar] [CrossRef]
- Kuminoff, N.V.; Sokolow, A.D.; Sumner, D.A. Farmland conversion: Perceptions and realities. AIC Issues Brief 2001, 16, 1–8. [Google Scholar]
- Heilig, G.K. Neglected dimensions of global land-use change: Reflections and data. Popul. Dev. Rev. 1994, 20, 831–859. [Google Scholar] [CrossRef]
- Torre, A.; Melot, R.; Magsi, H.; Bossuet, L.; Cadoret, A.; Caron, A.; Darly, S.; Jeanneaux, P.; Kirat, T.; Pham, H.V.; et al. Identifying and measuring land-use and proximity conflicts: Methods and identification. Springer Plus 2014, 3, 85–100. [Google Scholar] [CrossRef]
- Martellozzo, F.; Ramankutty, N.; Hall, R.J.; Price, D.T.; Purdy, B.; Friedl, M.A. Urbanization and the loss of prime farmland: A case study in the Calgary–Edmonton corridor of Alberta. Reg. Environ. Chang. 2015, 14, 1–13. [Google Scholar] [CrossRef]
- Hosseini, A.; Shabanifard, M.; Rashidi, M.; Saiydzade, M.R. Distribution and Determining of Urban Sprawl in Kerman with Emphasis on Kariz Water System. Phys. Int. 2010, 1, 9–15. [Google Scholar] [CrossRef]
- Azadi, H.; Ho, P.; Hasfiati, L. Agricultural land conversion drivers: A comparison between less developed, developing and developed countries. Land Degrad. Dev. 2011, 22, 596–604. [Google Scholar] [CrossRef]
- McConnell, K.E. The optimal quantity of land in agriculture. Northeast. J. Agric. Resour. Econ. 1989, 18, 63–72. [Google Scholar] [CrossRef] [Green Version]
- Nelson, A.C. Preserving prime farmland in the face of urbanization: Lessons from Oregon. J. Am. Plan. Assoc. 1992, 58, 467–488. [Google Scholar] [CrossRef]
- Lichtenberg, E.; Ding, C. Assessing farmland protection policy in China. Land Use Policy 2008, 25, 59–68. [Google Scholar] [CrossRef]
- Friedmann, J. Four theses in the study of China’s urbanization. Int. J. Urban Reg. Res. 2006, 30, 440–451. [Google Scholar] [CrossRef]
- Chiew, P.Y. Pseudo-Urbanization Competitive government behavior and urban sprawl in China. J. Contemp. China 2012, 21, 281–298. [Google Scholar]
- Chen, M.X.; Sui, Y.W.; Guo, S.S. Perspective of China’s new urbanization after 19th CPC National Congress. Geogr. Res. 2019, 38, 181–192. [Google Scholar]
- Charles, H.; Richard, S. Smart communities and smart growth: Maximizing benefits for the corporation. J. Corp. Real. Estate 2002, 4, 207–214. [Google Scholar]
- Mubarak, F.A. Urban growth boundary policy and residential suburbanization: Riyadh, Saudi Arabia. Habitat Int. 2004, 28, 567–591. [Google Scholar] [CrossRef]
- Zhang, P.Y.; Yang, D.; Li, E.L. The coupled coordination relationship between land urbanization and population urbanization—A case study of the Central Plains Economic Region. Econ. Geogr. 2017, 37, 145–154. [Google Scholar]
- Wang, Y.H.; Yuan, Y.; Wang, Y.L.; Zhang, X.; Qiao, W. Relationship and mechanism of coupling development between population and land urbanization: A case study of Jiangsu province. Geogr. Res. 2017, 36, 149–160. [Google Scholar]
- Liu, J.; Tian, Y.S. Mutual influencing mechanism of industry-population-space in the Pearl River Delta urban agglomeration in the context of the Guangdong-HongKong-Macao Greater Bay Area development. Prog. Geogr. 2018, 37, 1653–1662. [Google Scholar]
- Fan, H.M.; Mu, H.Z. The coupling between population structure and industrial structure of China. Econ. Geogr. 2015, 35, 11–17. [Google Scholar]
- Lu, X.H.; Chen, D.L.; Kuang, B. The spatial-temporal evolution and the interactive effect between urban industrial structure transformation and land use efficiency. China Land Sci. 2018, 32, 66–73. [Google Scholar]
- Freeman, D.G. Sources of Fluctuations in Regional Growth. Ann. Reg. Sci. 2001, 35, 249–266. [Google Scholar] [CrossRef]
- Arauzo-Carod, J.M. Determinants of Population and Jobs at a Local Level. Ann. Reg. Sci. 2007, 41, 87–104. [Google Scholar] [CrossRef]
- Gianluca, E.; Sirio, C.; Gianni, Q.; Alhuseen, A.; Salvati, L. Land mismatches, urban growth and spatial planning: A contribution to metropolitan sustainability. Environ. Impact Assess. Rev. 2020, 84, 106439. [Google Scholar]
- Frenkel, A. The potential effect of national growth-management policy on urban sprawl and the depletion of open spaces and farmland. Land Use Policy 2004, 21, 357–369. [Google Scholar] [CrossRef]
- Hongling, Y.I.N.; Teng, X.U. The mismatch between population urbanization and land urbanization in China. Urban Plan. Forum 2013, 2, 10–15. [Google Scholar]
- He, R.W. Urban-rural integration and rural revitalization: Theory, mechanism and implementation. Geogr. Res. 2018, 37, 2127–2140. [Google Scholar]
- Fang, F. Evaluation and spatial distinction of the coupling of population-land-industry elements in the counties of Beijing-Tianjin-Hebei Region. World Reg. Stud. 2018, 27, 51–59. [Google Scholar]
- Pan, C.L. Evaluation of coordination between population urbanization and land urbanization in ningxia. Chin. J. Agric. Resour. Reg. Plan. 2018, 39, 110–116. [Google Scholar]
- Zhou, Y.; Huang, X.J.; Xu, G.L.; Li, J.B. The coupling and driving forces between urban land expansion and population growth in Yangtze River Delta. Geogr. Res. 2016, 35, 313–324. [Google Scholar]
- Lu, T.G.; Wu, C.F.; Li, H.Y.; You, H.Y.; Cai, X. Spatial clustering and coupling coordination of population-land-economic urbanization in Beijing-Tianjin-Hebei Region. Sci. Geogr. Sin. 2016, 36, 239–246. [Google Scholar]
- Jaeger, J.A.G.; Bertiller, R.; Schwick, C.; Cavens, D.; Kienast, F. Urban permeation of landscapes and sprawl per capita: New measures of urban sprawl. Ecol. Indic. 2010, 10, 427–441. [Google Scholar] [CrossRef]
- Hewitt, R.; Escobar, F. The territorial dynamics of fast-growing regions: Unsustainable land use change and future policy challenges in Madrid, Spain. Appl. Geogr. 2011, 31, 650–667. [Google Scholar] [CrossRef]
- Wu, Y.F.; Liu, Y.S.; Li, Y.R. Spatio-temporal coupling of demographic-landscape urbanization and its driving forces in China. Acta Geogr. Sin. 2018, 73, 1865–1879. [Google Scholar]
- Ma, L.; Long, H.L.; Zhang, Y.N.; Tu, S.S.; Ge, D.Z. Spatio-temporal coupling relationship between agricultural labor changes and agricultural economic development at county level in China and its implications for rural revitalization. Acta Geogr. Sin. 2018, 73, 2364–2377. [Google Scholar]
- He, S.W.; Shao, X. Spatial clustering and coupling coordination of population-land-economic urbanization in Beijing-Tianjin-Hebei Region. Econ. Geogr. 2018, 38, 95–102. [Google Scholar]
- Zhang, Y.; Lei, G.P.; Zhou, M.; Lin, J. Co-evolution of urbanization of population, land and industry in China. Urban Probl. 2019, 1, 14–22. [Google Scholar]
- Li, X.G.; Sun, Y. The dynamic effect of population, land, economic urbanization. Econ. Probl. 2018, 3, 106–111. [Google Scholar]
- Tobler, W.B. A computer movies imulating urban growth in the Detroit region. Econ. Geogr. 1970, 46, 234–240. [Google Scholar] [CrossRef]
- Sokal, R.R.; Oden, N.L. Spatial autocorrelation in biology: 1. Methodology. Biol. J. Linn. Soc. 1978, 10, 199–228. [Google Scholar] [CrossRef] [Green Version]
- Legendre, P. Spatial Autocorrelation: Trouble or New Paradigm? Ecology 1993, 74, 1659–1673. [Google Scholar] [CrossRef]
- Uriel, K.; Kazmierczak, J.J. Spatial analysis of the distribution of Lyme Disease in Wisconsin. Am. J. Epidemiol. 1997, 145, 558–566. [Google Scholar]
- Goodchild, M.F.; Anselin, L.; Appelbaum, R.; Harthorn, B. Toward spatially integrated social science. Int. Reg. Sci. Rev. 2000, 23, 139–159. [Google Scholar] [CrossRef]
- Cohen, J.; Tita, G. Diffusion in Homicide: Exploring a general method for detecting spatial diffusion processes. J. Quant. Criminol. 1999, 15, 451–493. [Google Scholar] [CrossRef]
- Manni, F.; Guérard, E.; Heyer, E. Geographic patterns of (Genetic, Morphologic, Linguistic) variation: How barriers can be detected by using Monmonier’s Algorithm. Hum. Biol. 2004, 76, 173–190. [Google Scholar] [CrossRef]
- Wang, Y.; Yu, W.M. Development of the Yangtze River Economic Belt and relevant fiscal policies. Fisc. Sci. 2018, 9, 58–65. [Google Scholar]
- Pang, Q.H.; Li, M.Z.; Li, H. Research on spatial coupling coordinated development between financial agglomeration, regional innovation and ecological efficiency of Yangtze River Economic Belt. J. Ind. Technol. Econ. 2019, 38, 68–76. [Google Scholar]
- Bai, X.; Song, Y.X.; Hao, F.L. Pattern evolution and influencing mechanism of coordination development of “Five Modernizations” in Northeast China. Geogr. Res. 2018, 37, 67–80. [Google Scholar]
- Wang, C.; Tang, N. Spatio-temporal characteristics and evolution of rural production-living-ecological space function coupling coordination in Chongqing Municipality. Geogr. Res. 2018, 37, 1100–1114. [Google Scholar]
- Ord, J.K.; Getis, A. Local Spatial Autocorrelation Statistics: Distributional Issues and an Application. Geogr. Anal. 2010, 27, 286–306. [Google Scholar] [CrossRef]
- Anselin, L.; Syabri, I.; Kho, Y. GeoDa: An Introduction to Spatial Data Analysis. Geogr. Anal. 2006, 38, 5–22. [Google Scholar] [CrossRef]
- Anselin, L. Spatial Econometrics: Methods and Models; Springer: Berlin/Heidelberg, Germany, 1988. [Google Scholar]
- Anselin, L. The Moran Scatterplot as an ESDA Tool to Assess Local Instability in Spatial Association. In Spatial Analytical Perspectives on GIS in Environmental and Socio-Economic Sciences, 111-25; Fischer, M., Scholten, H., Unwin, D., Eds.; Taylor and Francis: London, UK, 1996. [Google Scholar]
- Zhang, Y.N.; Long, H.L.; Ge, D.Z.; Tu, S.; Qu, Y. Spatio-temporal characteristics and dynamic mechanism of farmland functions evolution in the Huang-Huai-Hai Plain. Acta Geogr. Sin. 2018, 73, 518–534. [Google Scholar]
Figure 1.
The map of the study area.

Figure 2.
The driving mechanism of PLIU coordination development.

Figure 3.
Spatial distribution of PLIU coupling degree in the YREB from 2006 to 2016.

Figure 4.
Spatial distribution of PLIU coordination degree in the YREB from 2006 to 2016.

Figure 5.
Moran’s I scatter plot of PLIU coordinated development in the YREB from 2006 to 2016.

Figure 6.
LISA cluster map of PLIU coordinated development in the YREB from 2006 to 2016.


Table 1.
Classification of PLIU coupling degree.
| Coupling Degree | Coupling Types | Coupling Characteristics |
|---|---|---|
| C ∈ [0,04) | Low coupling period | PLIU systems start to play games with each other, which is in a low-level coupling period and is in an irrelevant state with disordered development. |
| C ∈ [0.4,0.6) | Antagonism period | The interaction of the PLIU system has been strengthened, and the structure of the urbanization system needs to be further optimized. |
| C ∈ [0.6,0.8) | The running-in period | The PLIU system begins to balance and coordinate, but land urbanization is still in the dominant position, while the development of population and industrial urbanization lags behind. |
| C ∈ [0.8,1] | Coordinated coupling period | The benign coupling trend between population, land and industrial urbanization is gradually strengthened and develops in an orderly direction, which is the stage of high-level coupling. |
Table 2.
Classification of PLIU coordination degree.
| Coordination Degree | Coordination Types | Characteristics |
|---|---|---|
| D ∈ [0,0.3) | Incoordination | The PLIU system is in a state of disharmony, and the structure is in a state of disorder. |
| D ∈ [0.3,0.45) | Low coordination | The PLIU system starts to develop towards a coordinated coupling direction, but the coordination degree is low. |
| D ∈ [0.45,0.6) | Moderate coordination | The PLIU system is in a state of collaborative evolution, but the response sensitivity is relatively slow. |
| D ∈ [0.6,0.75] | Higher coordination | The PLIU system is in a high level of synchronous cooperation, and the inter-system structure has been greatly improved. |
| D ∈ [0.75,1] | High coordination | The PLIU systems promote each other, and the urbanization system realizes coordinated and consistent development. |
Table 3.
Explanatory variables.
| Influence Factors | Indexes | Units | Index Significance |
|---|---|---|---|
| Economic development level | C1 GDP per capita | Ten thousand yuan/person | Representing the average level of economic development |
| C2 GDP per unit area of land | One hundred million yuan/hm2 | Representing the level of economic development and the density of output | |
| C3 The proportion of tertiary industry in GDP | % | Representing the state of the economic structure | |
| C4 Per capita financial income | Ten thousand yuan/person | Representing government revenue | |
| The government’s decision-making behavior | C5 Fixed assets investment | One hundred million yuan/hm2 | Representing the strength of government investment |
| C6 Number of teachers per 10,000 | Person | Representing the intensity of investment in education | |
| C7 Number of hospital beds per 10,000 people | Zhang | Representing the intensity of investment in health care | |
| Urban location conditions | C8 Green coverage rate in urban built-up areas | % | Representing the urban ecological environment |
| C9 Urban road area per capita | m2/person | Representing the urban traffic condition | |
| C10 City dummy variable | 0–6 | Representing the urban geographical location conditions |
Note: The city dummy variable represents the topography, or the terrain of the city, and whether the city is a special economic zone, as well as whether the city is a coastal area and other geographical location conditions of the city, and is scored accordingly.
Table 4.
Spatial dependence test of PLIU coordinated development.
| Spatial Dependence Test | MI/DF | VALUE | PROB |
|---|---|---|---|
| Moran’s I (error) | 0.2087 | 3.5927 | 0.0000 |
| Lagrange multiplier (lag) | 1 | 2.2551 | 0.1331 |
| Robust LM (lag) | 1 | 0.2120 | 0.6452 |
| Lagrange multiplier (error) | 1 | 9.8901 | 0.0016 |
| Robust LM (error) | 1 | 7.8470 | 0.0050 |
| Lagrange multiplier (SARMA) | 2 | 10.1021 | 0.0064 |
Table 5.
Spatial regression results of PLIU coordination degree and impact factors in the YREB.
| Variable | Coefficient | Std. Error | z-Value | Probability |
|---|---|---|---|---|
| CONSTANT | −1.4087 | −1.4087 | −10.1239 | 0.0000 |
| C1 GDP per capita | 0.0529 | 0.0090 | 5.8210 | 0.0000 |
| C4 Per capita financial income | 0.0206 | 0.0334 | 0.6193 | 0.5357 |
| C6 Number of teachers per 10,000 people | 0.0009 | 0.0005 | 1.5435 | 0.1227 |
| C8 Green coverage rate in urban built-up areas | 0.0078 | 0.0035 | 2.1881 | 0.0286 |
| C9 Urban road area per capita | 0.0133 | 0.0077 | 1.7301 | 0.0836 |
| C10 Urban virtual variables | 0.0463 | 0.0233 | 1.9841 | 0.0472 |
| LAMBDA | 0.3488 | 0.1148 | 3.0376 | 0.0023 |
Publisher’s Note: MDPI stays neutral with regard to jurisdictional claims in published maps and institutional affiliations. |
© 2021 by the authors. Licensee MDPI, Basel, Switzerland. This article is an open access article distributed under the terms and conditions of the Creative Commons Attribution (CC BY) license (https://creativecommons.org/licenses/by/4.0/).
Share and Cite
MDPI and ACS Style
Huang, L.; Yang, P.; Zhang, B.; Hu, W. Spatio-Temporal Coupling Characteristics and the Driving Mechanism of Population-Land-Industry Urbanization in the Yangtze River Economic Belt. Land 2021, 10, 400. https://doi.org/10.3390/land10040400
AMA Style
Huang L, Yang P, Zhang B, Hu W. Spatio-Temporal Coupling Characteristics and the Driving Mechanism of Population-Land-Industry Urbanization in the Yangtze River Economic Belt. Land. 2021; 10(4):400. https://doi.org/10.3390/land10040400
Chicago/Turabian StyleHuang, Liejia, Peng Yang, Boqing Zhang, and Weiyan Hu. 2021. "Spatio-Temporal Coupling Characteristics and the Driving Mechanism of Population-Land-Industry Urbanization in the Yangtze River Economic Belt" Land 10, no. 4: 400. https://doi.org/10.3390/land10040400
Note that from the first issue of 2016, this journal uses article numbers instead of page numbers. See further details here.