
Effect of Aging Time on Crushing Performance of Al-0.5Mg-0.4Si Alloy for Safety Components of Automobile

 ,
,
Abstract
:1. Introduction
2. Experimental
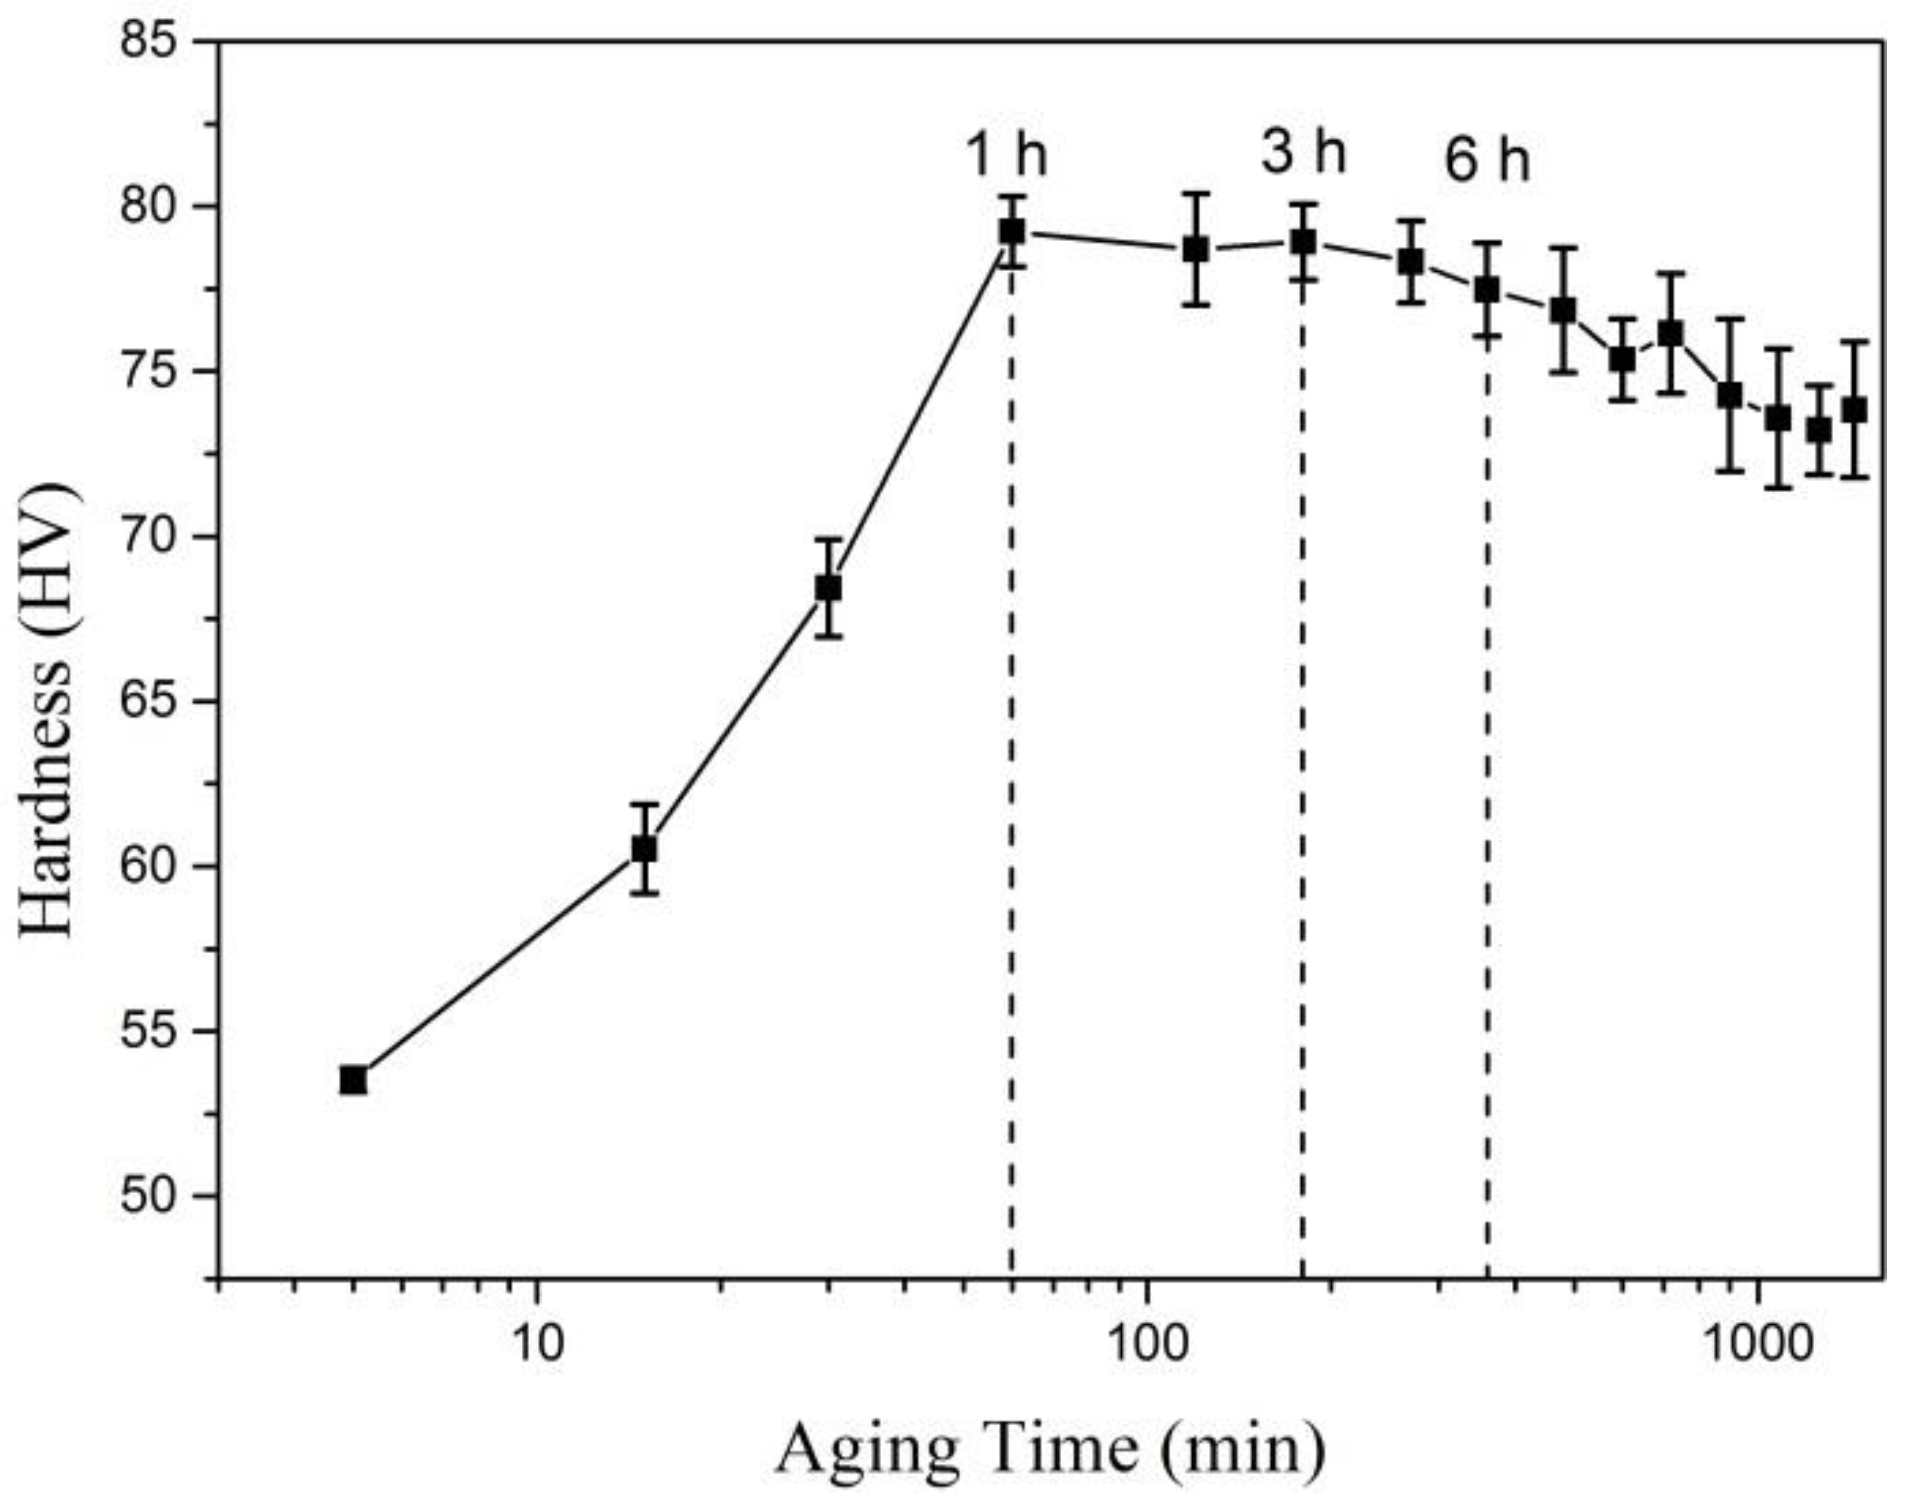
3. Results
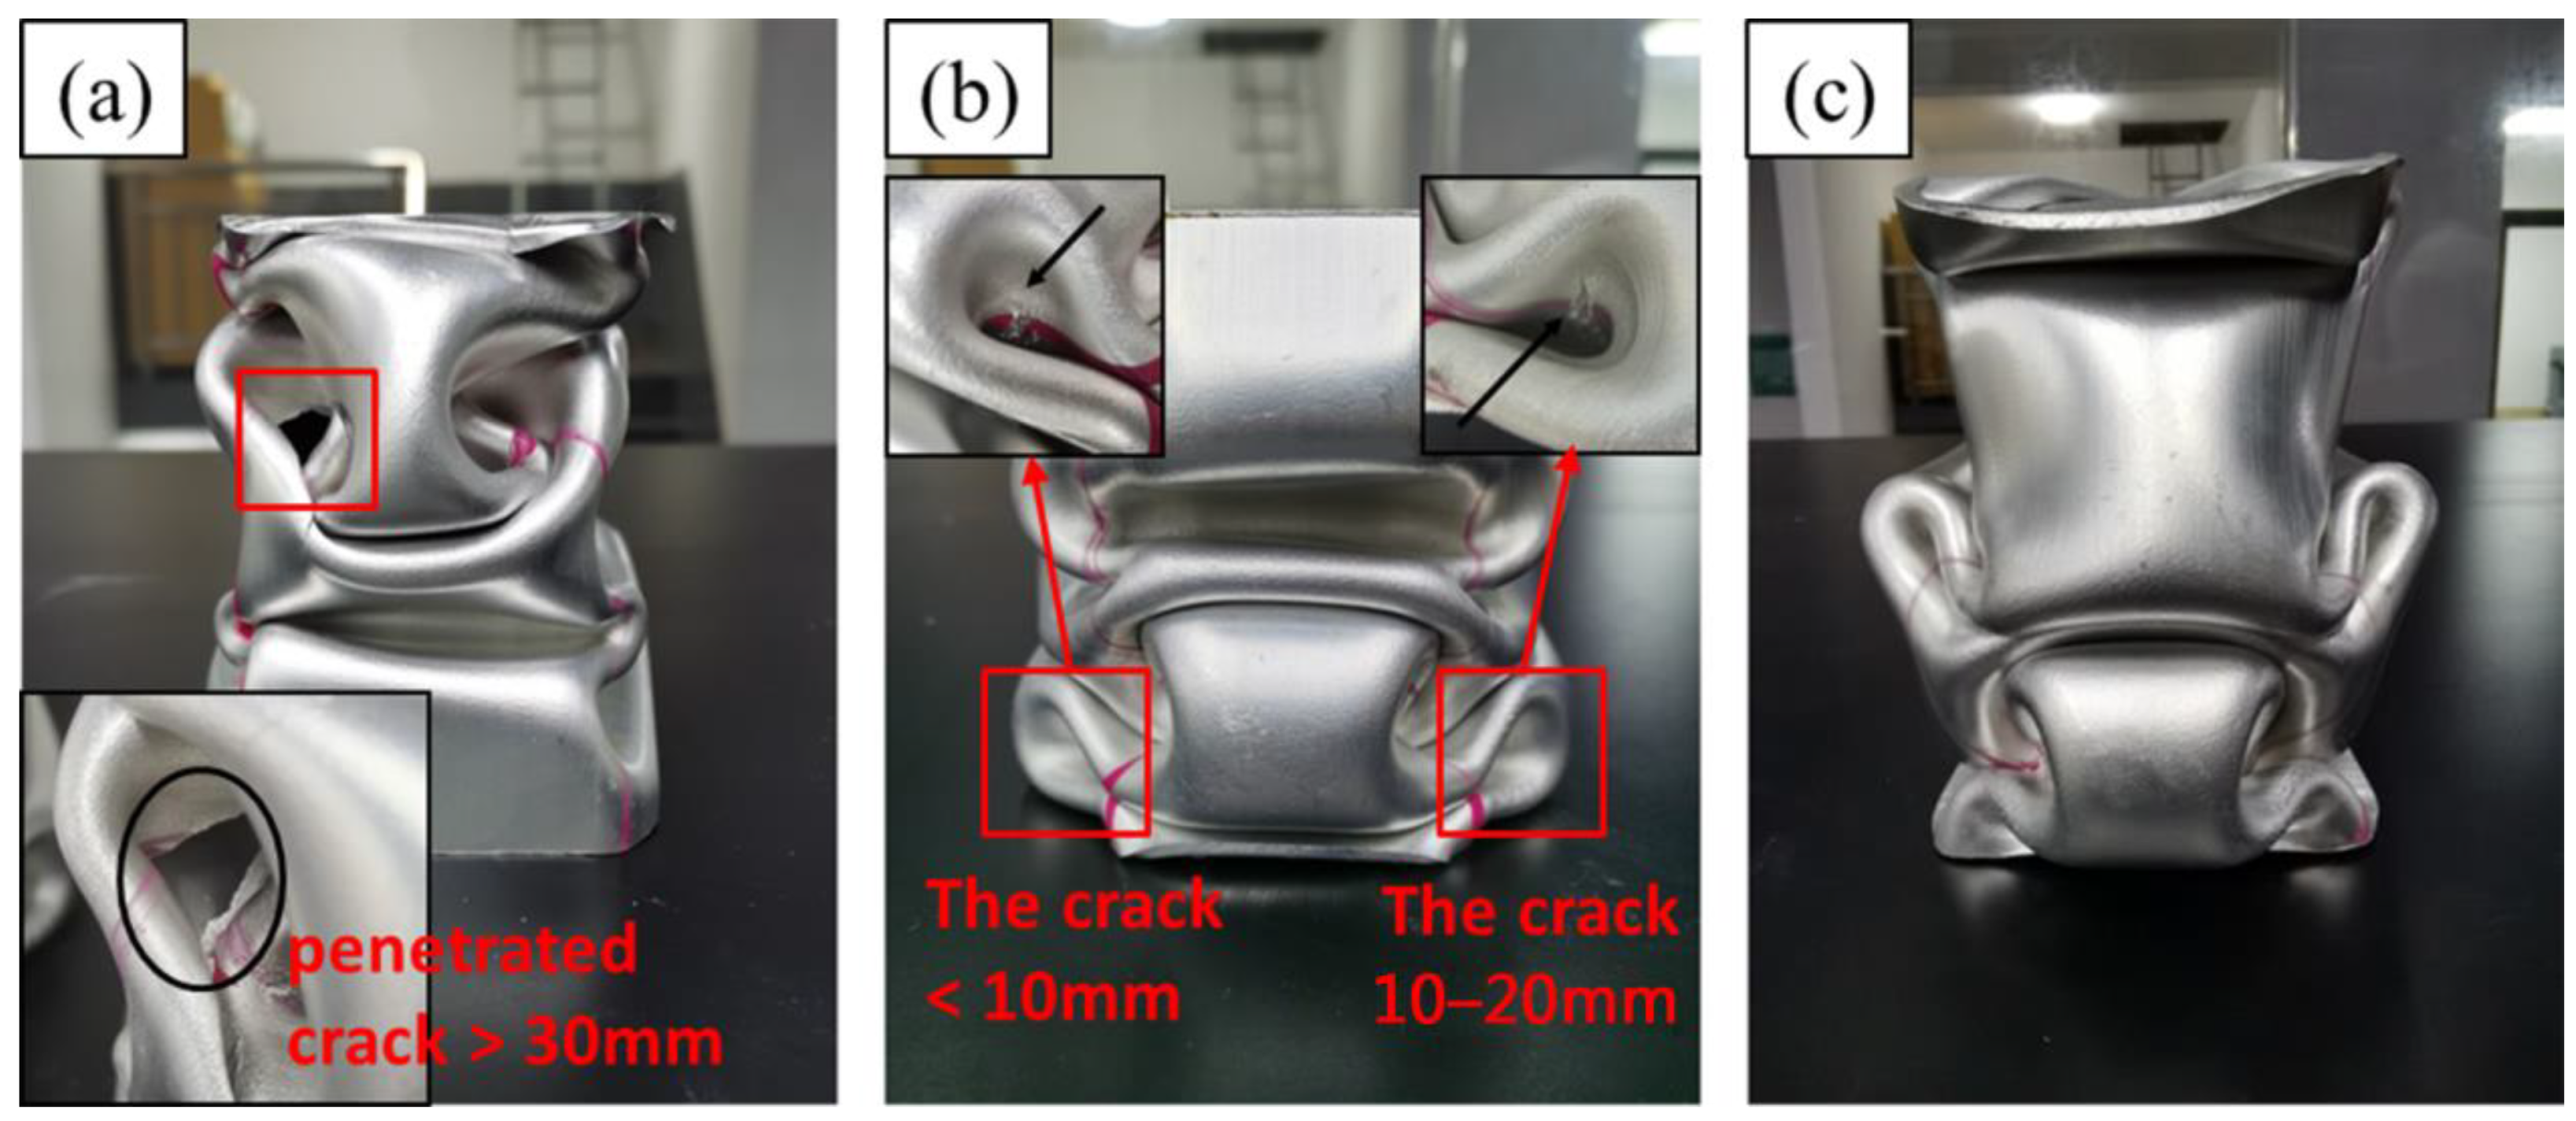
3.1. Crushing Test
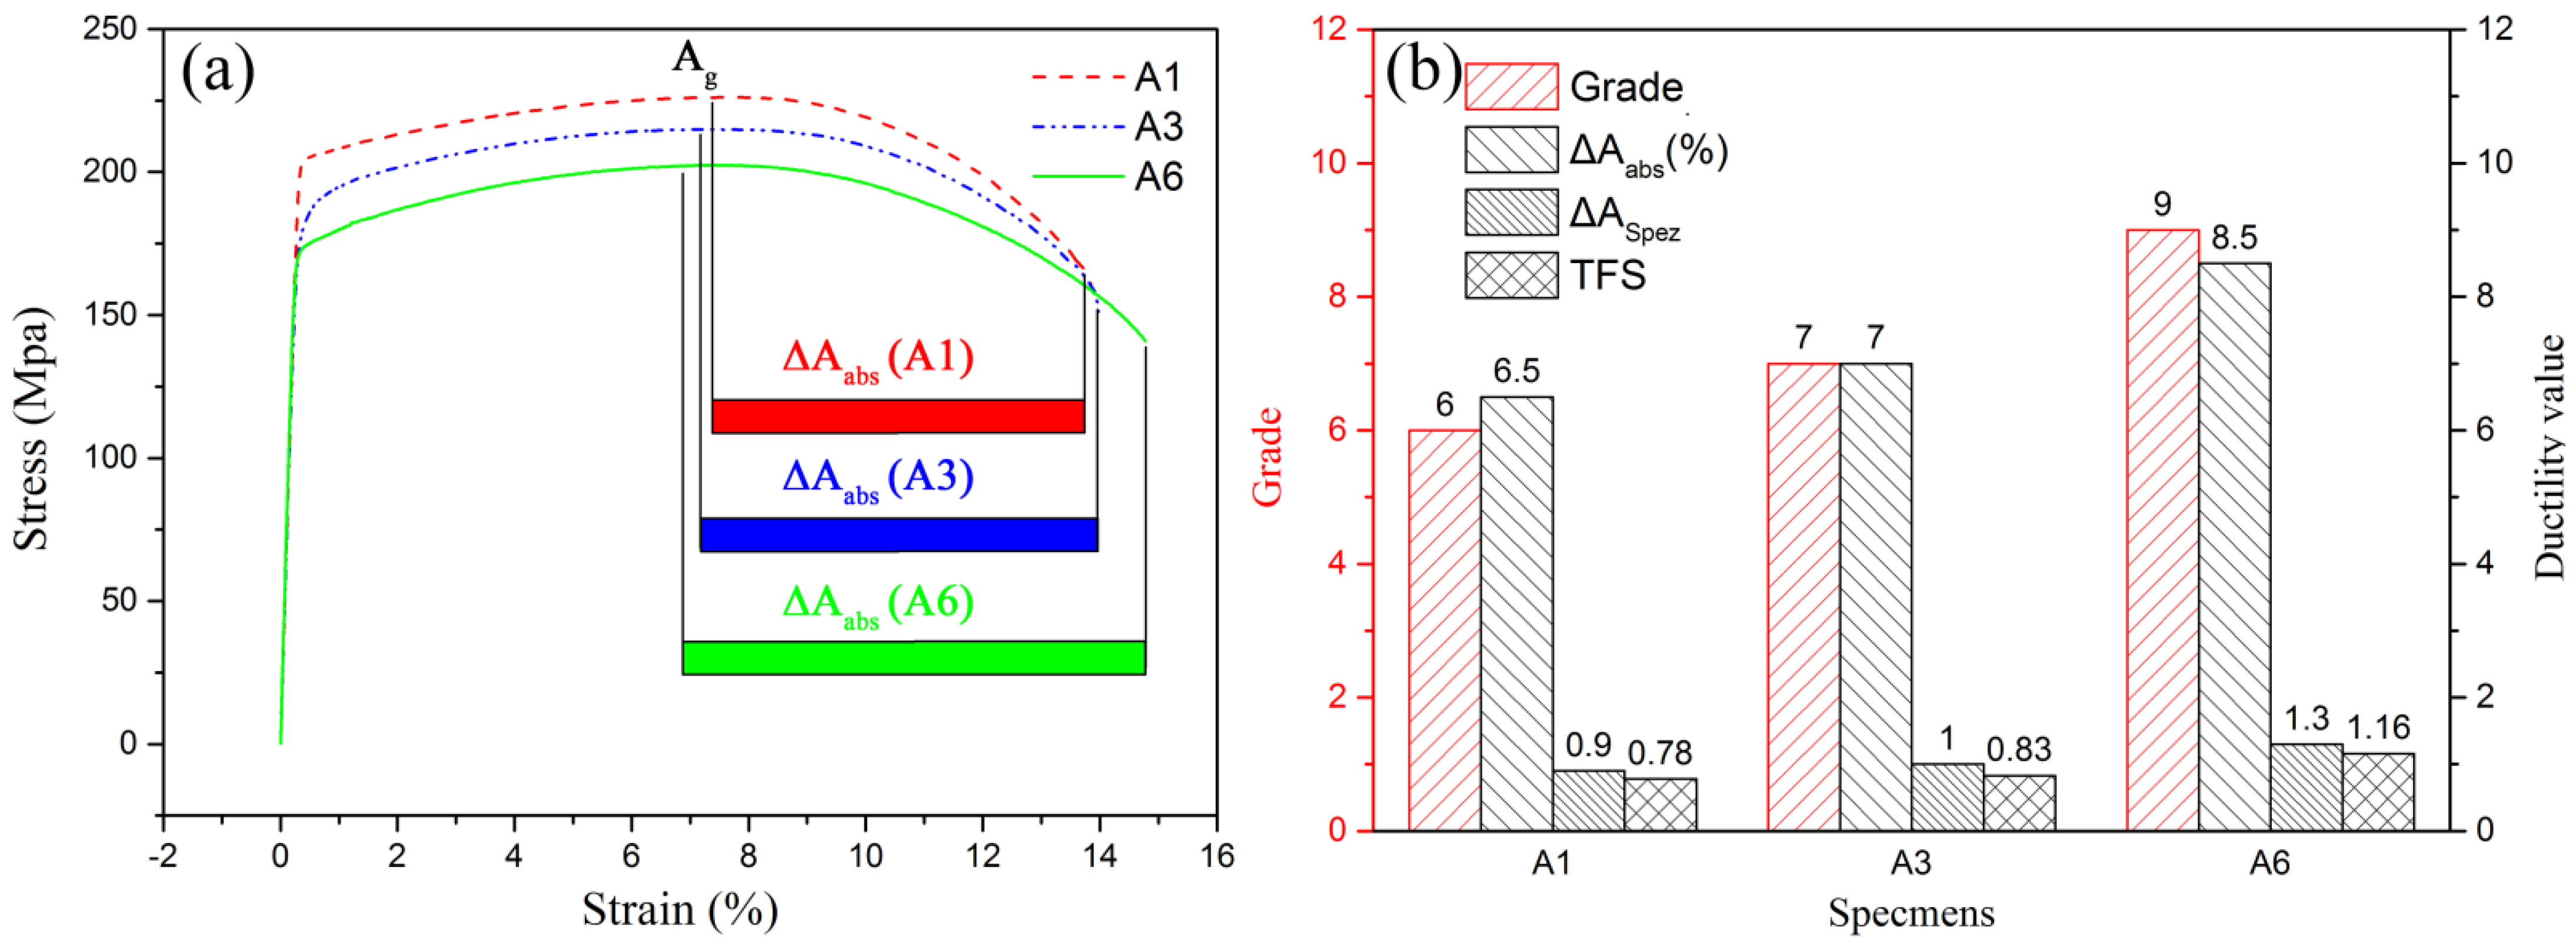
3.2. Tensile Test
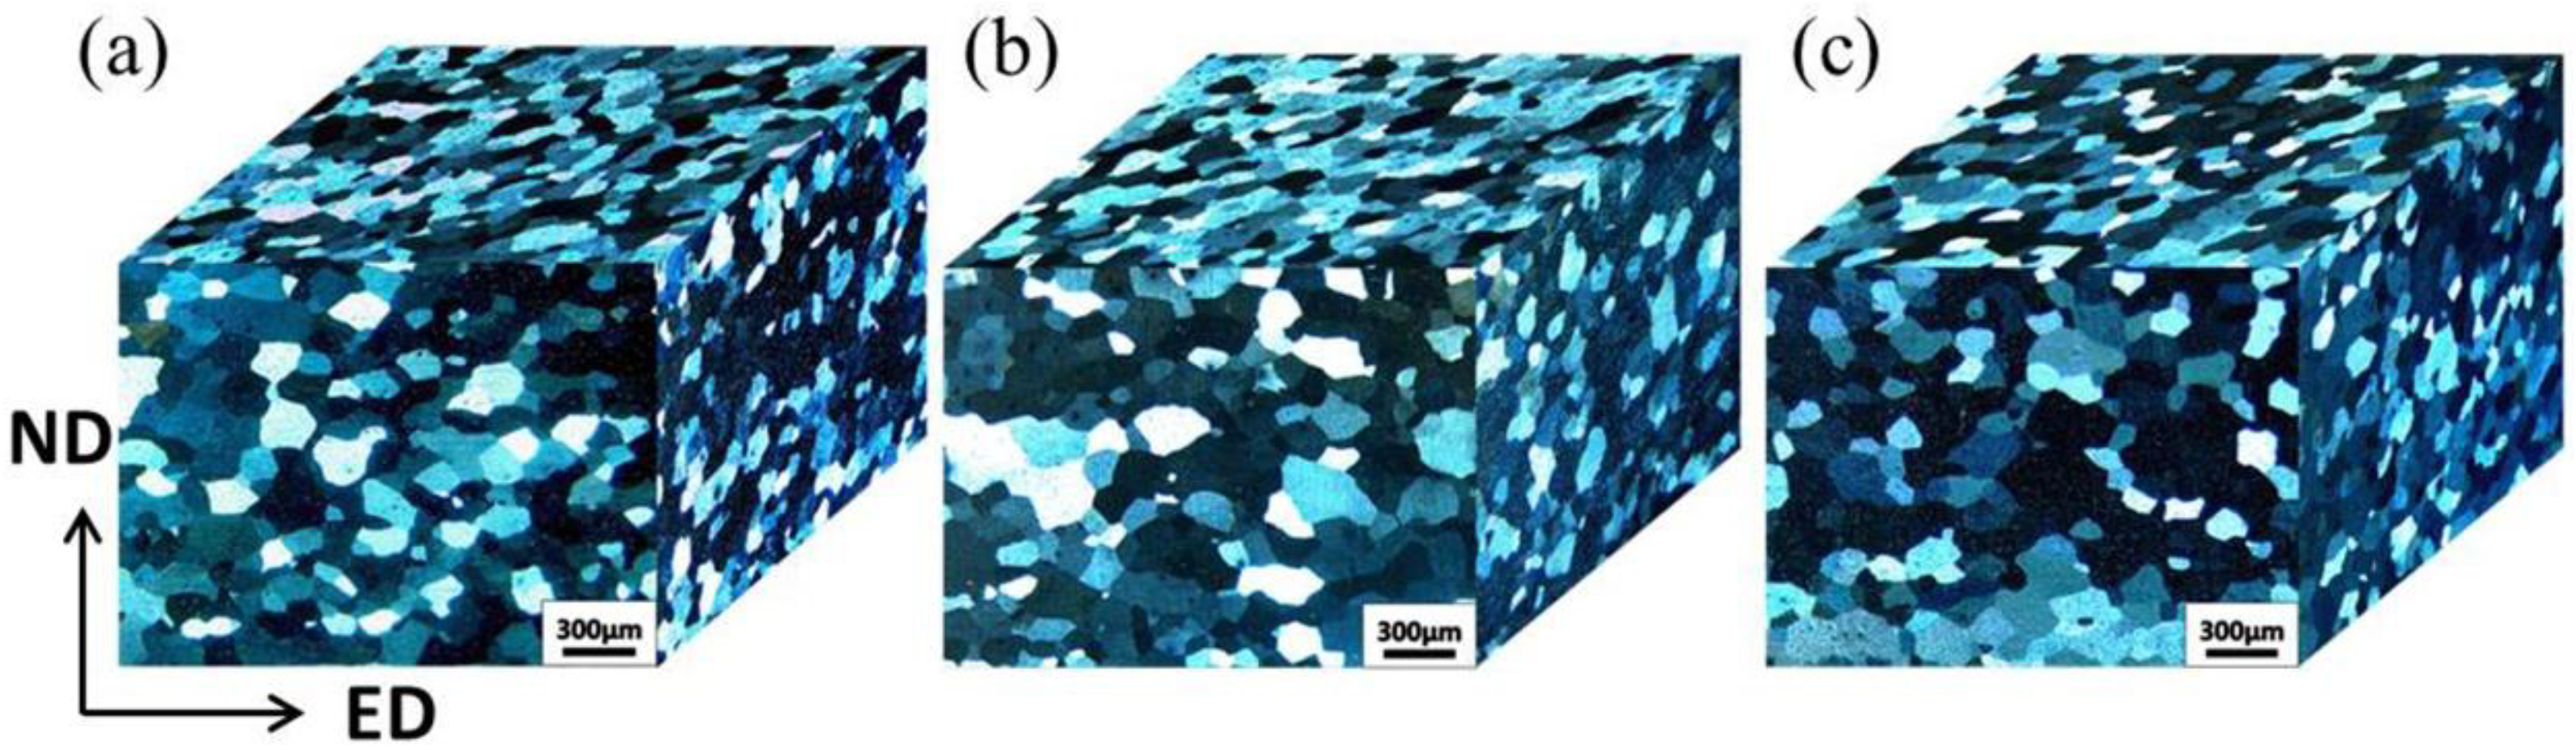
3.3. Metallographic
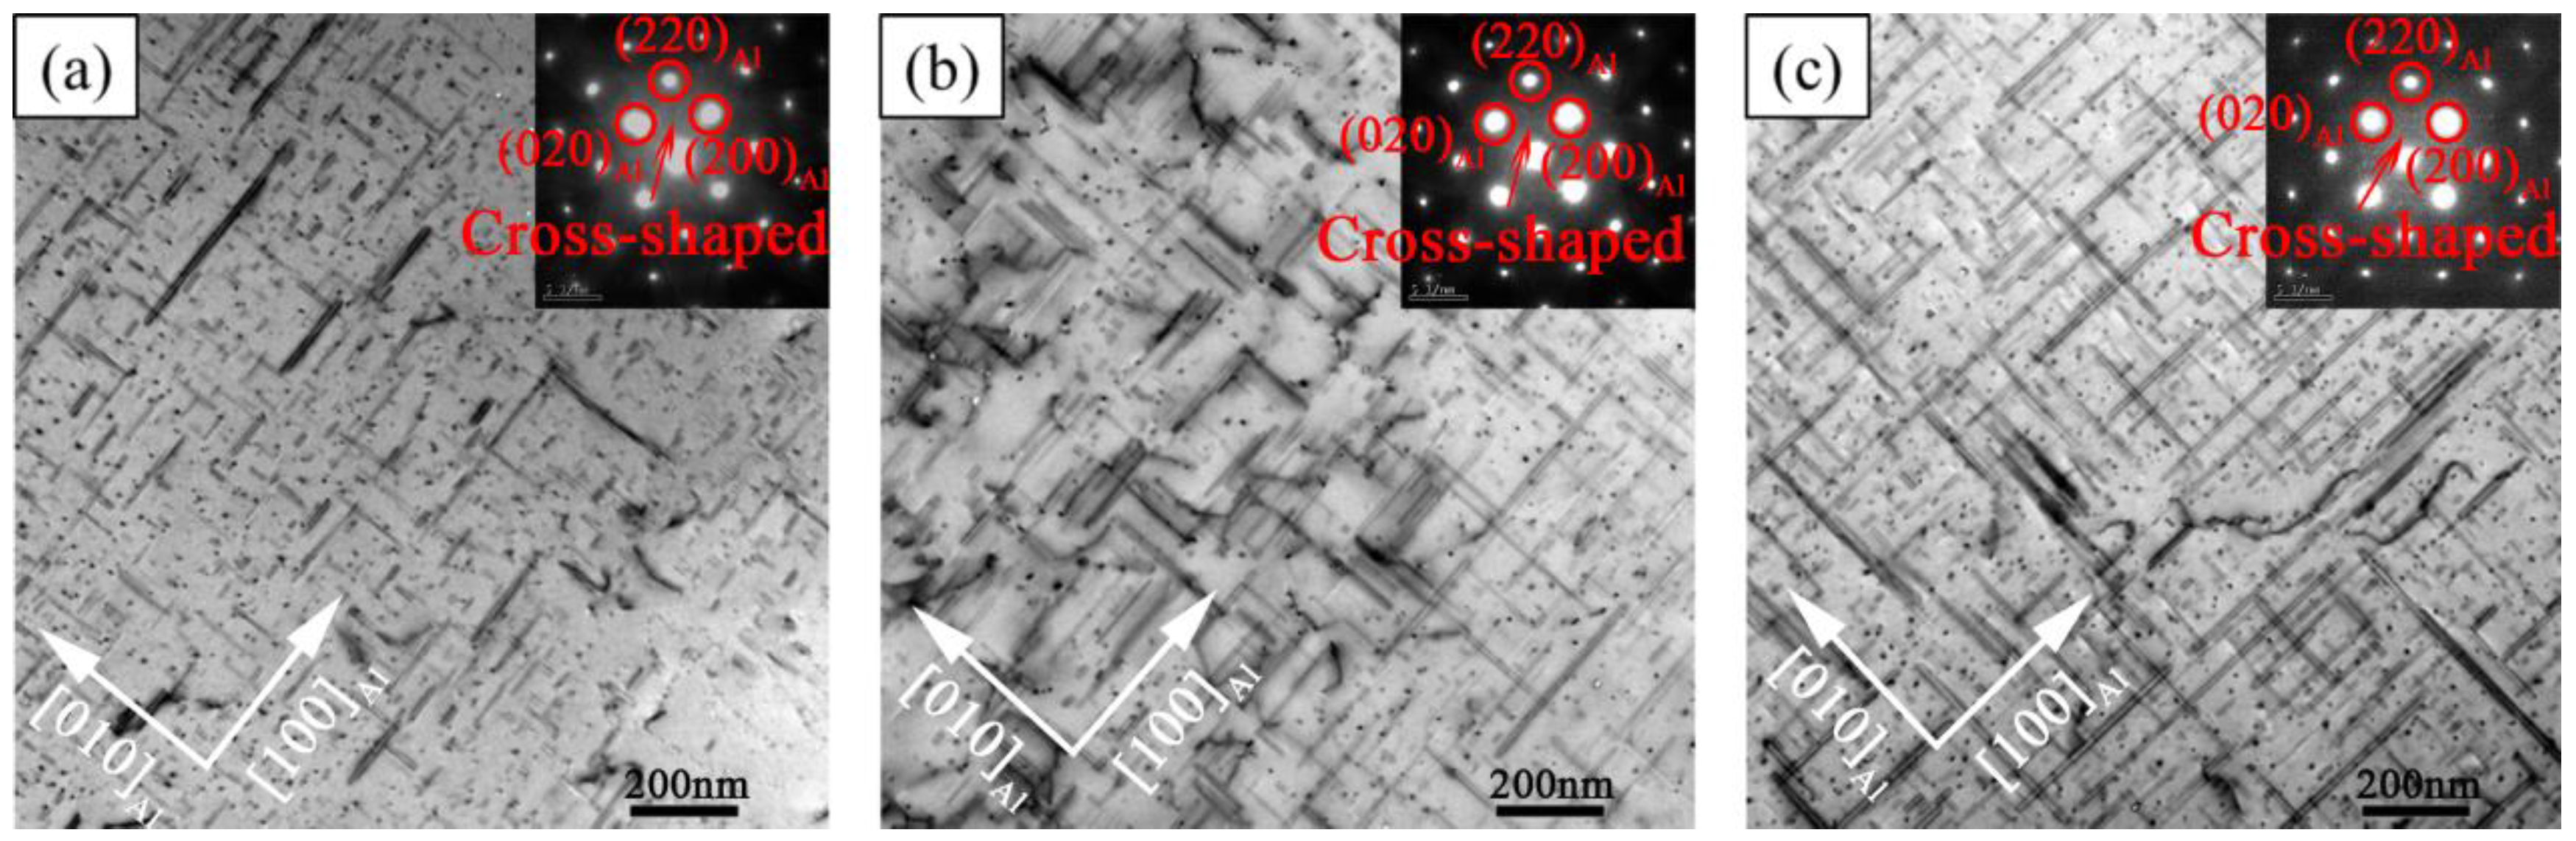
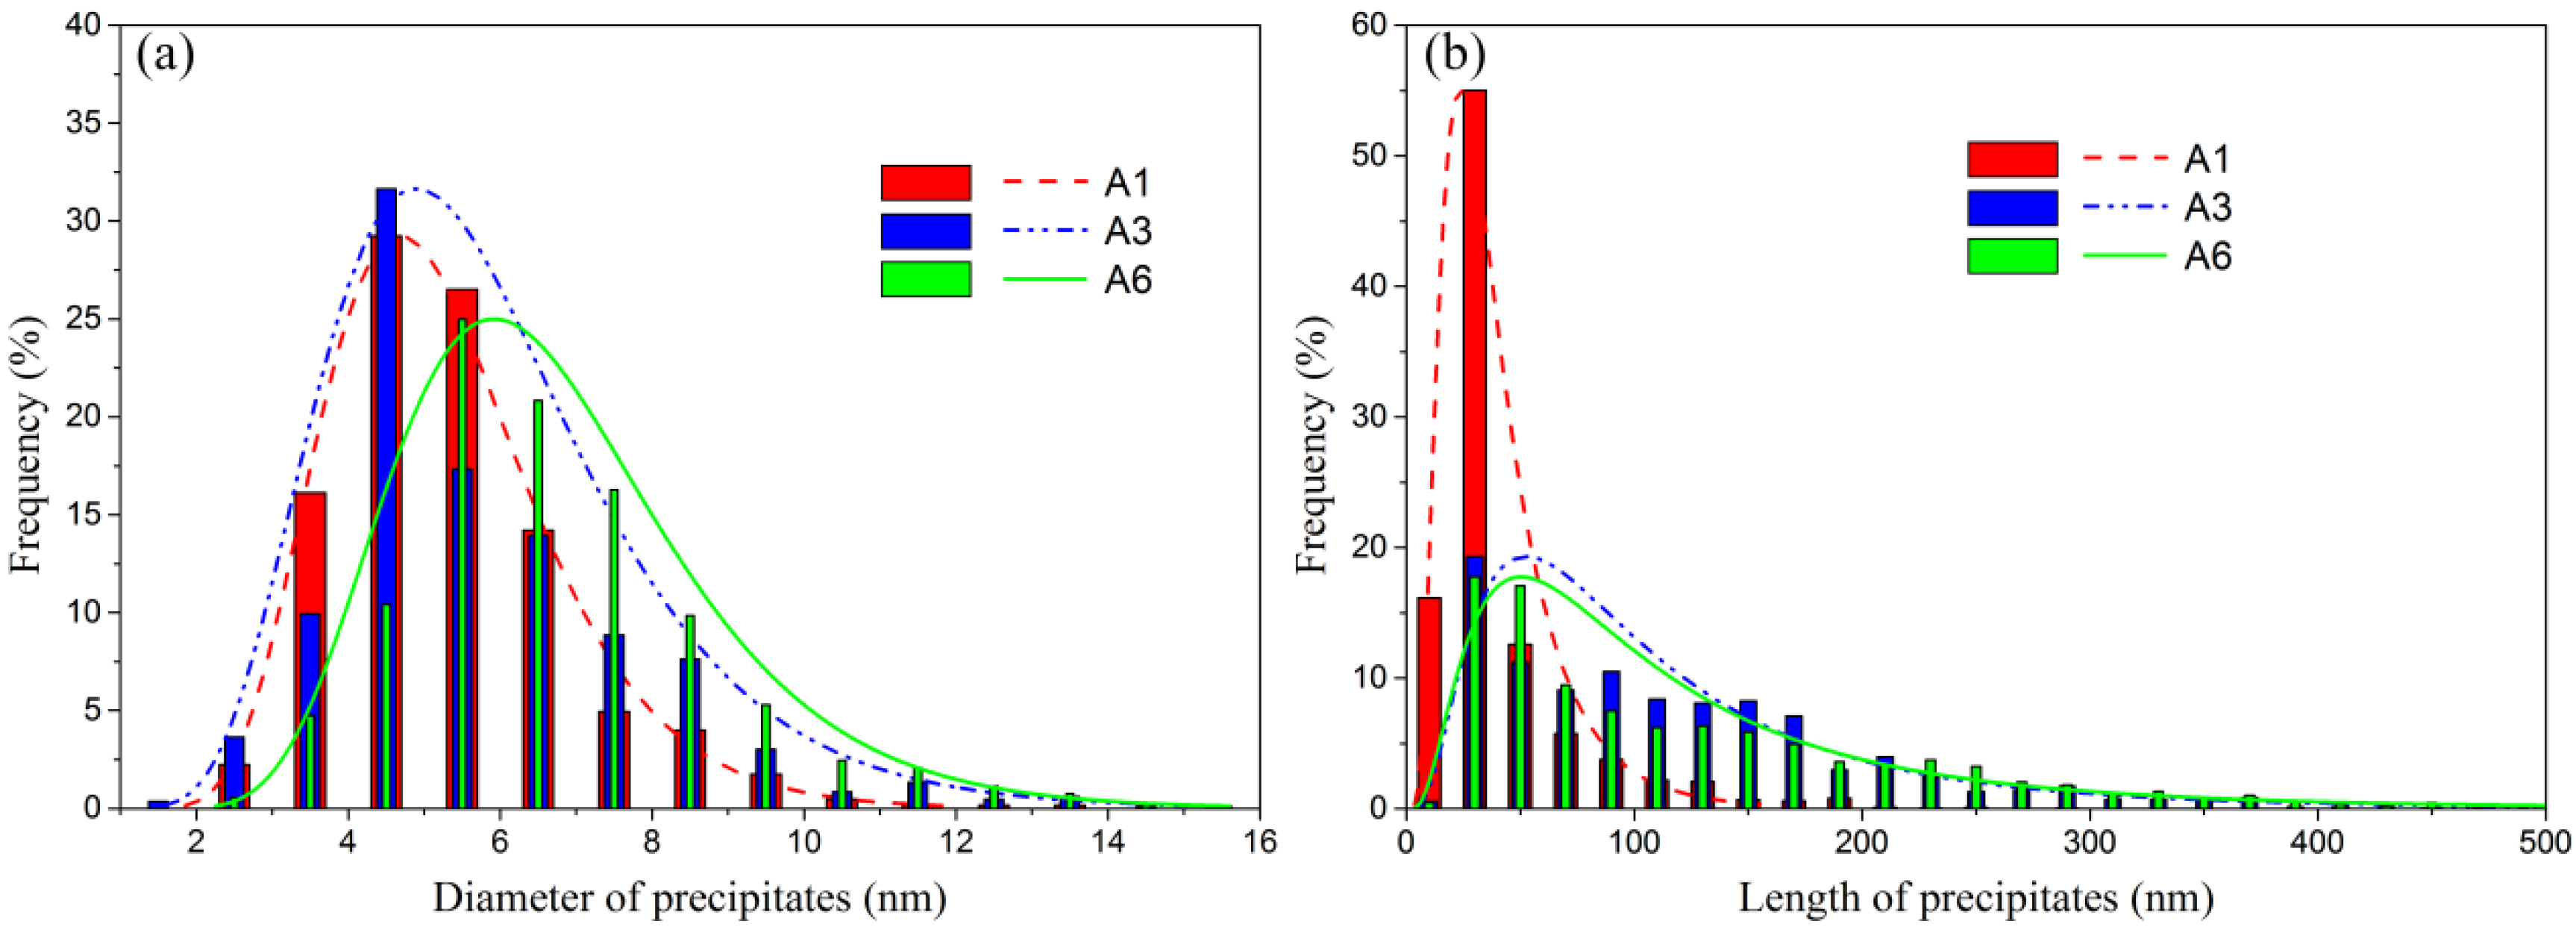
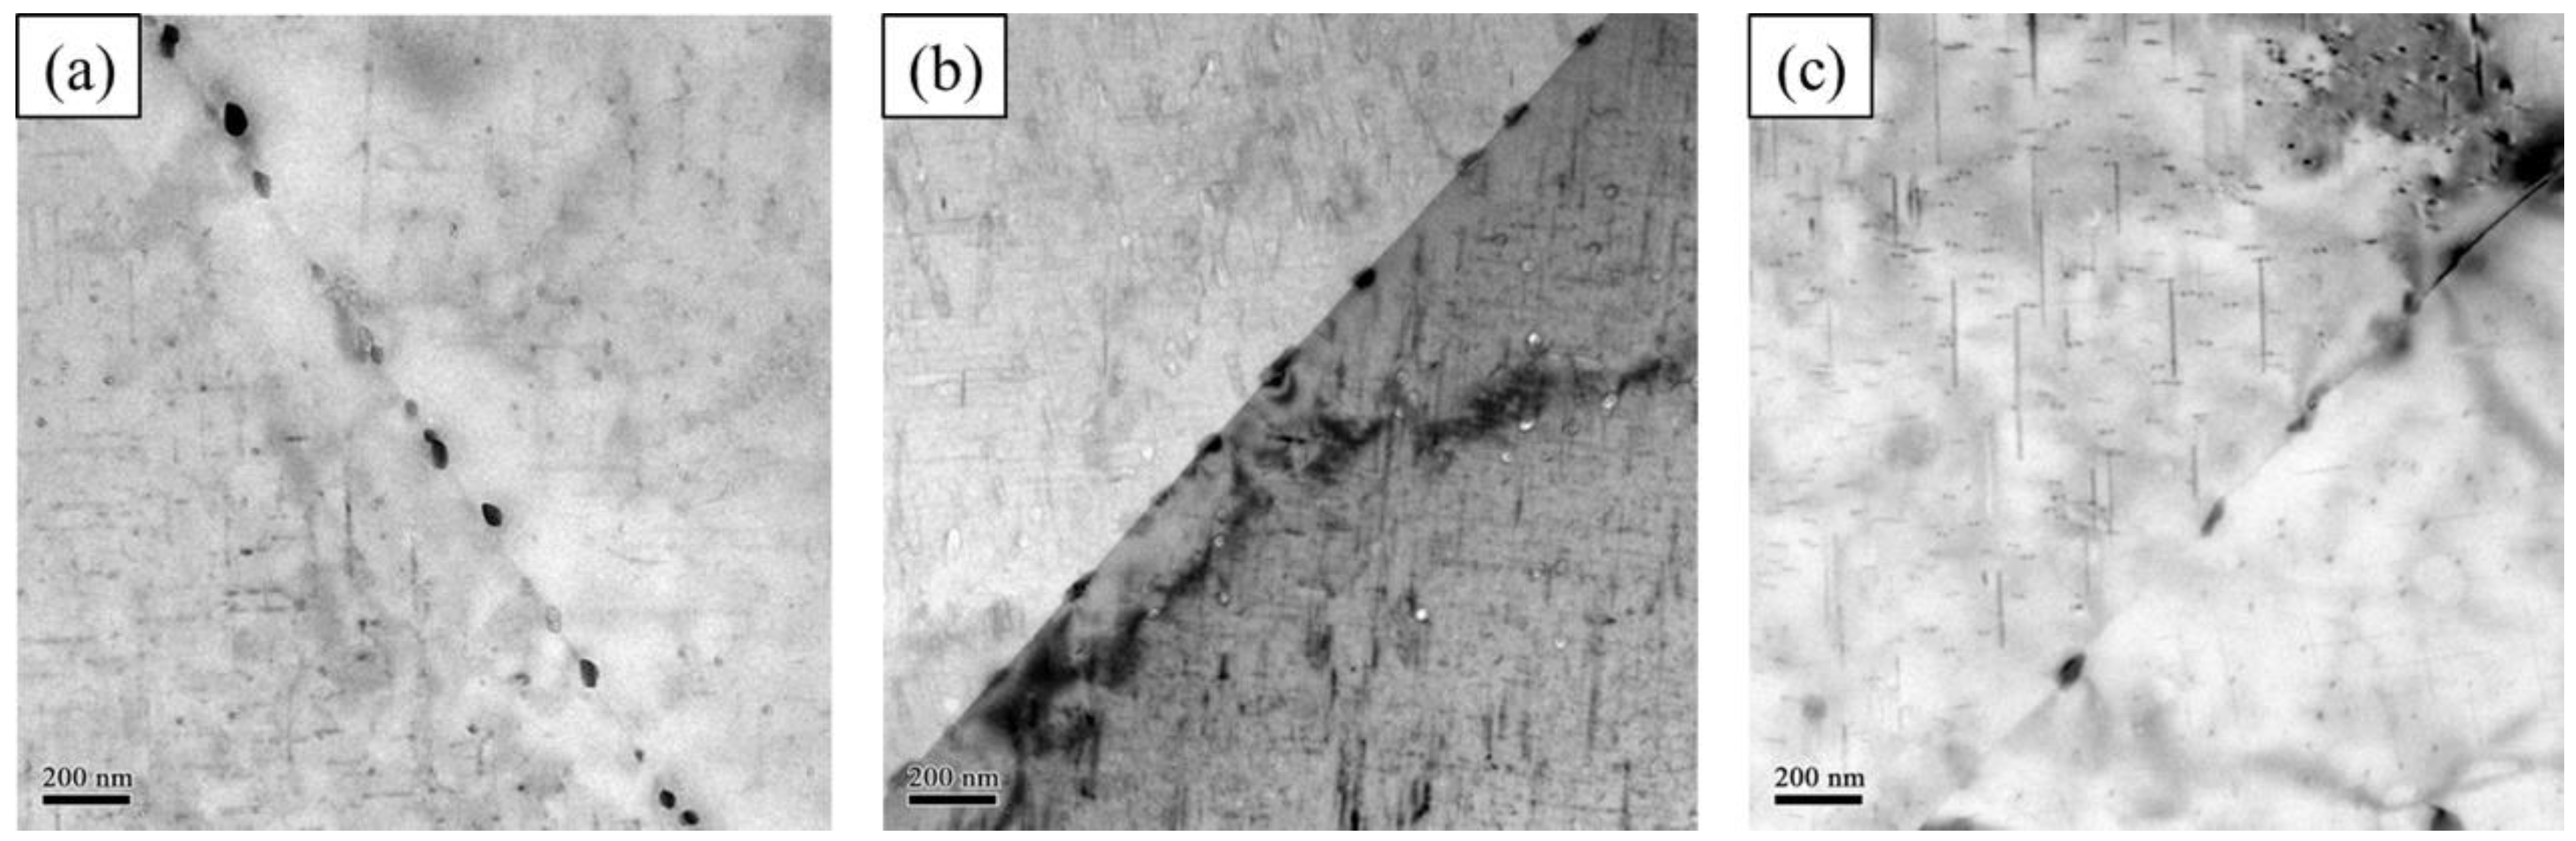
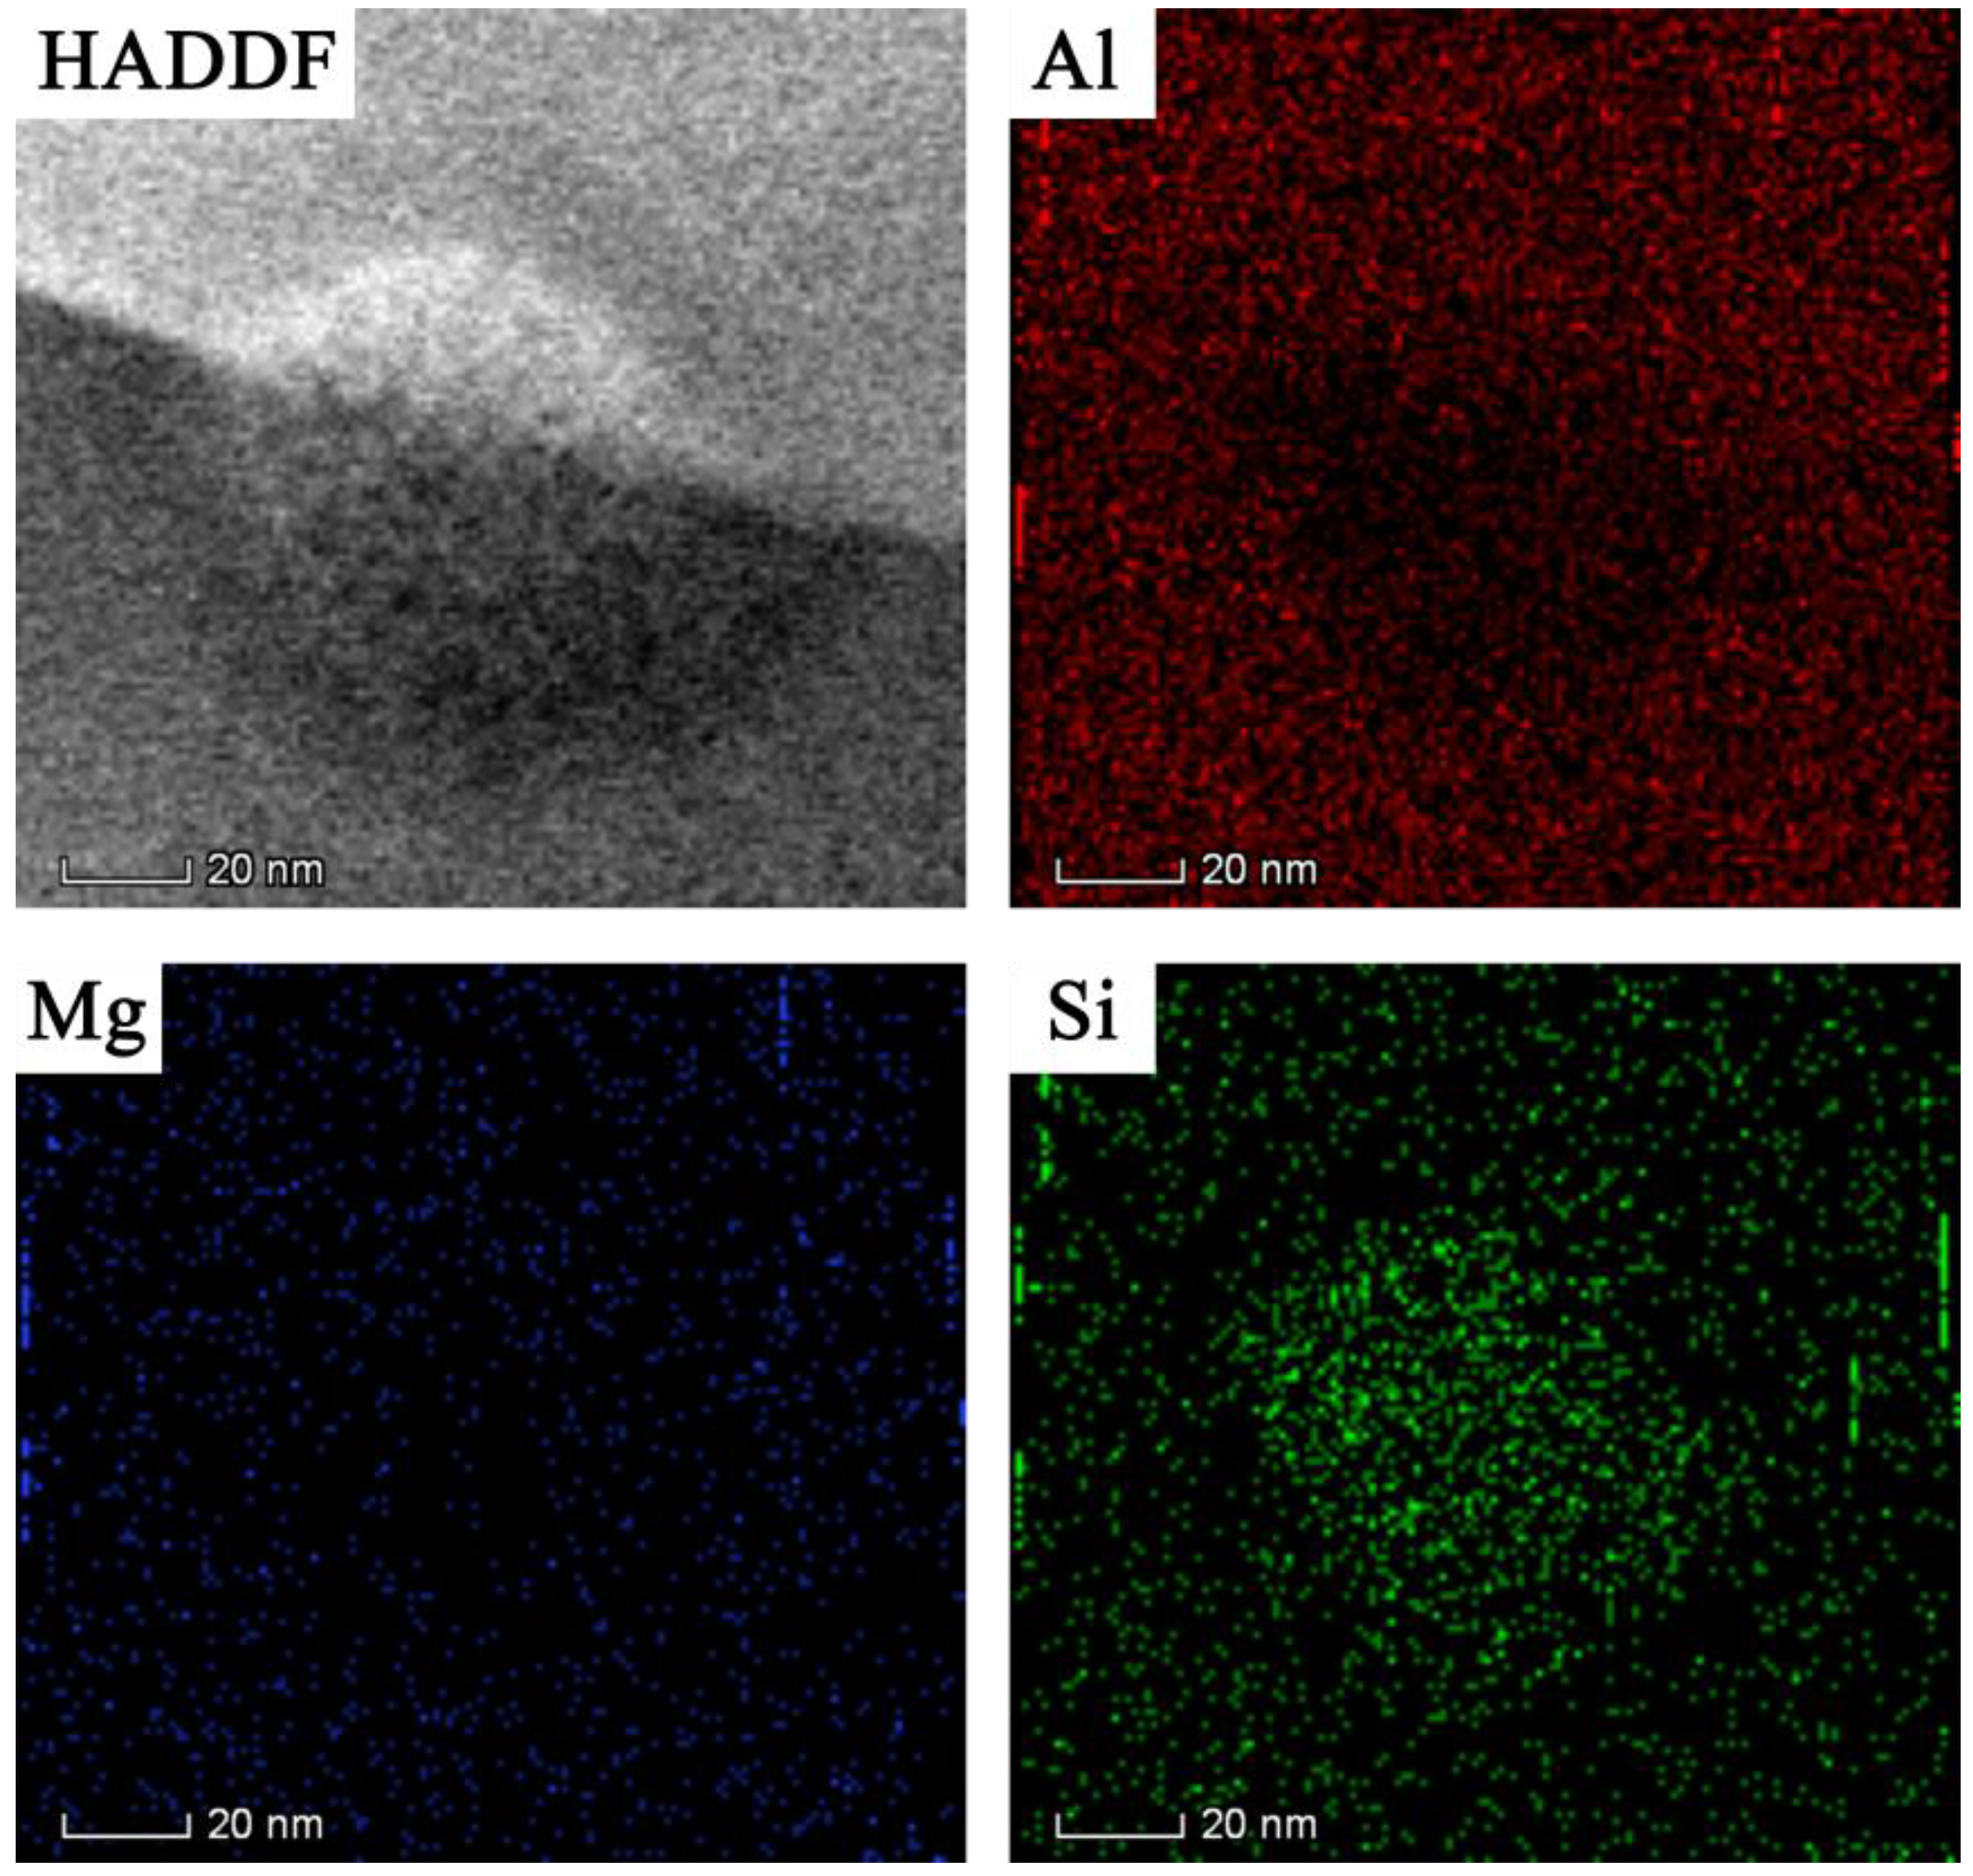
3.4. TEM Results
4. Discussion
5. Conclusions
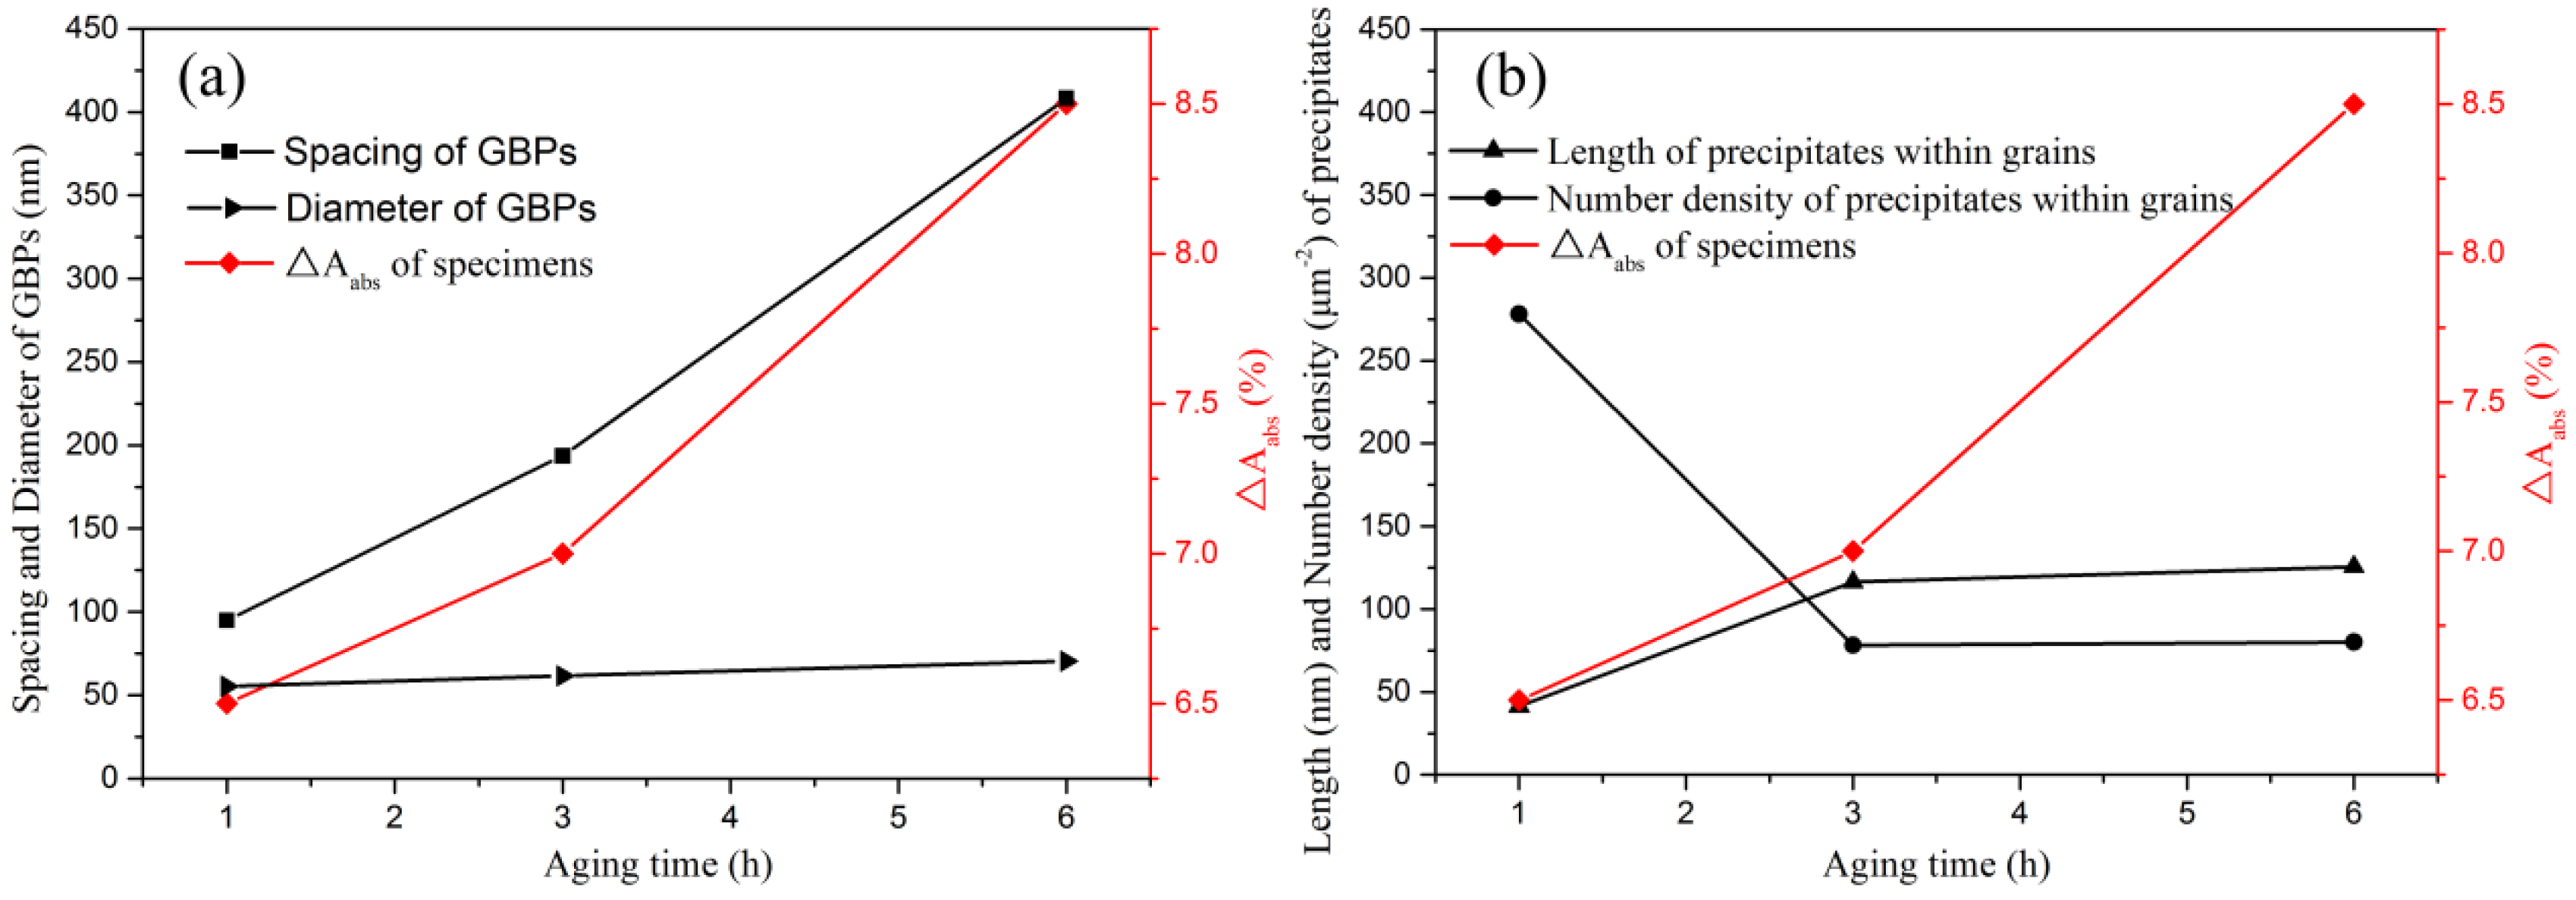
- The crushing performance of the Al-0.5Mg-0.4Si alloy is strongly related to the ∆Aabs. The ∆Aabs of the three specimens aged at 210 °C for 1, 3 and 6 h is 6.5%, 7.0% and 8.5%, respectively, and the crushing performance increases with the increase of the ∆Aabs.
- The spacing of GBPs is the reason for the effect of aging treatment on the crushing performance of the Al-0.5Mg-0.4Si alloy. The spacing of GBPs increases with the increase of aging time. The average spacing of GBPs in the specimens aged at 210 °C for 1, 3 and 6 h is 94.9, 193.6 and 408.2 nm, respectively.
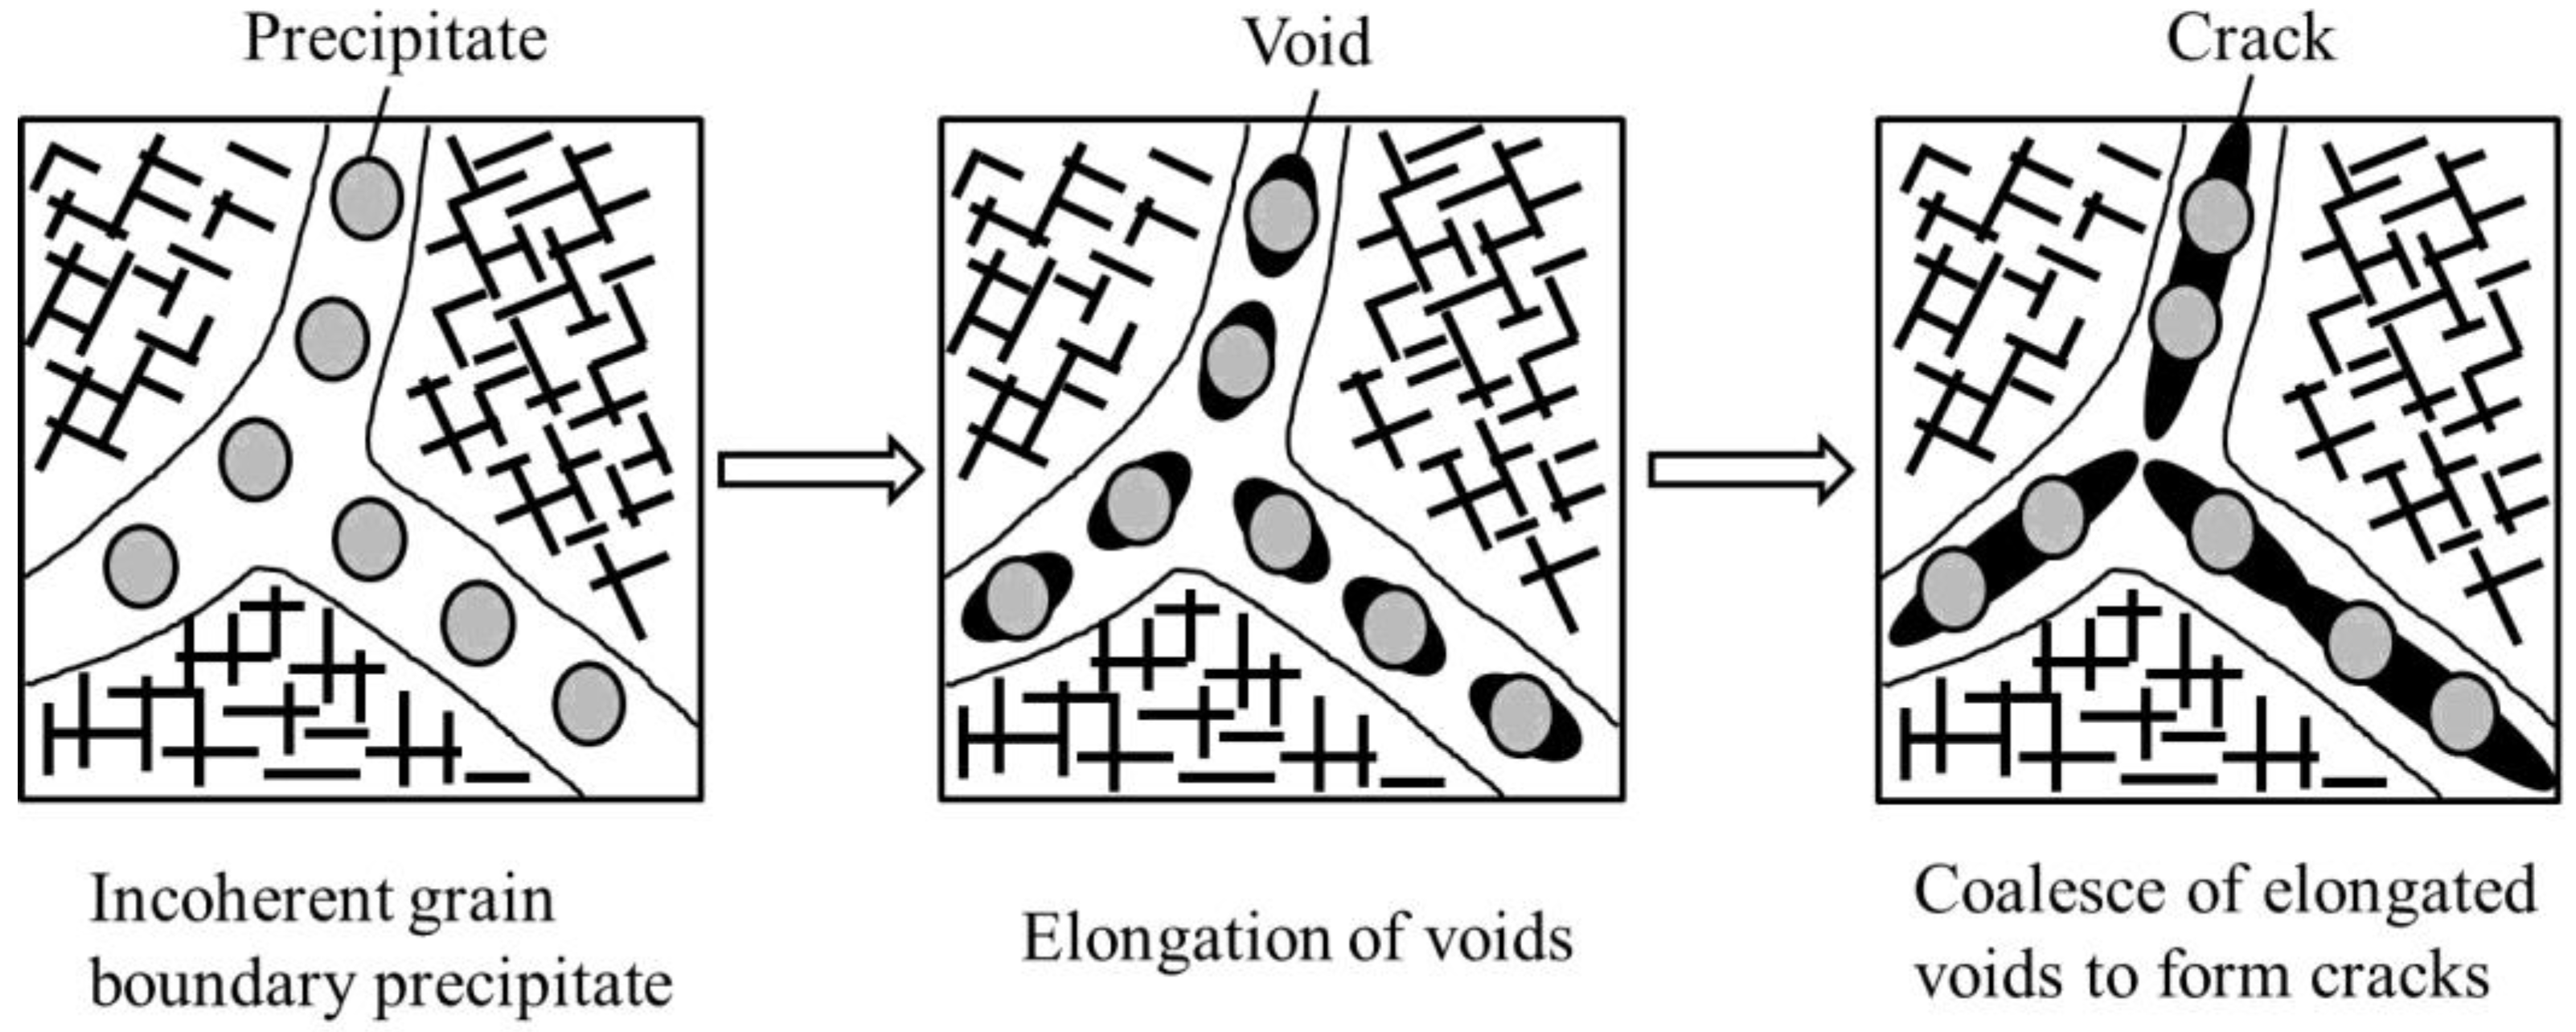
- A microstructure model for recrystallized Al-Mg-Si alloy with high crushing performance is proposed based on nucleation of microcracks from GBPs. The increase of the spacing of GBPs increases the resistance of microcrack formation and thus the ∆Aabs of the specimen, and further leads to an improvement of the crushing performance.
Author Contributions
Funding
Institutional Review Board Statement
Informed Consent Statement
Data Availability Statement
Conflicts of Interest
References
- Han, M.S.; Min, B.S.; Cho, J.U. Fracture properties of aluminum foam crash box. Int. J. Automot. Technol. 2014, 15, 945–951. [Google Scholar] [CrossRef]
- Witteman, W.J. Improved Vehicle Crashworthiness Design by Control of the Energy Absorption for Different Collision Situations. Ph.D. Thesis, Technische Universiteit Eindhoven, Eindhoven, The Netherlands, 1999. [Google Scholar]
- Miller, W.S.; Zhuang, L.; Bottema, J.; Wittebrood, A.; De Smet, P.; Haszler, A.; Vieregge, A.J.M.S. Recent development in aluminum alloys for the automotive industry. Mater. Sci. Eng. A 2000, 280, 37–49. [Google Scholar] [CrossRef]
- Hirsch, J. Recent development in aluminium for automotive applications. Trans. Nonferrous Met. Soc. China 2014, 24, 1995–2002. [Google Scholar] [CrossRef]
- Das, S.K.; Green, J.A.S.; Kaufman, J.G. The development of recycle-friendly automotive aluminum alloys. JOM 2007, 59, 47–51. [Google Scholar] [CrossRef]
- Tang, Z.; Liu, S.; Zhang, Z. Analysis of energy absorption characteristics of cylindrical multi-cell columns. Thin Walled Struct. 2013, 62, 75–84. [Google Scholar] [CrossRef]
- Wu, S.; Li, G.; Sun, G.; Wu, X.; Li, Q. Crashworthiness analysis and optimization of sinusoidal corrugation tube. Thin Walled Struct. 2016, 105, 121–134. [Google Scholar] [CrossRef]
- Singace, A.; El-Sobky, H. Behaviour of axially crushed corrugated tubes. Int. J. Mech. Sci. 1997, 39, 249–268. [Google Scholar] [CrossRef]
- Kim, D.-K.; Lee, S. Impact energy absorption of 6061 aluminum extruded tubes with different cross-sectional shapes. Mater. Des. 1999, 20, 41–49. [Google Scholar] [CrossRef]
- Zhang, X.; Zhang, H. Energy absorption of multi-cell stub columns under axial compression. Thin Walled Struct. 2013, 68, 156–163. [Google Scholar] [CrossRef]
- Wang, J.; Zhang, Y.; He, N.; Wang, C.H. Crashworthiness behavior of Koch fractal structures. Mater. Des. 2018, 144, 229–244. [Google Scholar] [CrossRef]
- Montazeri, S.; Elyasi, M.; Moradpour, A. Investigating the energy absorption, SEA and crushing performance of holed and grooved thin-walled tubes under axial loading with different materials. Thin Walled Struct. 2018, 131, 646–653. [Google Scholar] [CrossRef]
- Bambach, M. Axial capacity and crushing of thin-walled metal, fibre–epoxy and composite metal–fibre tubes. Thin Walled Struct. 2010, 48, 440–452. [Google Scholar] [CrossRef]
- Han, Z.; Li, H.; Xu, X.; Wang, H.; Li, H.; Tao, J. Crushing characteristics of alumi-num/CFRP/aluminum hybrid tubes prepared by spinning forming. Compos. Struct. 2020, 249, 112511. [Google Scholar] [CrossRef]
- Shin, K.C.; Lee, J.J.; Kim, K.H.; Song, M.C.; Huh, J.S. Axial crush and bending collapse of an aluminum/GFRP hybrid square tube and its energy absorption capability. Compos. Struct. 2002, 57, 279–287. [Google Scholar] [CrossRef]
- Conrads, L.; Liebsch, C.; Hirt, G. Increasing the energy absorption capacity of structural components made of low alloy steel by combining strain hardening and local heat treatment. Procedia Eng. 2017, 207, 257–262. [Google Scholar] [CrossRef]
- Kawai, H.; Yoshihara, S.; Hirano, M. Shock Absorbing Material. U.S. Patent Application 10/420,756, 6 November 2003. [Google Scholar]
- Marzoli, M.L.; van de Langkruis, J.; Boezewinkel, J. High Strength Crash Resistant Aluminium Alloy. EP2072628B1, 18 October 2017. [Google Scholar]
- Henn, P.; Liewald, M.; Sindel, M. Investigation on crashworthiness characterisation of 6xxx-series aluminium sheet alloys based on local ductility criteria and edge compression tests. In Proceedings of the International Deep Drawing Research Group 37th Annual Conference, Waterloo, ON, Canada, 3–7 June 2018. [Google Scholar]
- Henn, P.; Liewald, M.; Sindel, M. Investigation on local ductility of 6xxx-aluminium sheet alloys. In Proceedings of the 36th IDDRG Conference—Materials Modelling and Testing for Sheet Metal Forming, Munich, Germany, 2–6 July 2017. [Google Scholar]
- Parson, N.; Fourmann, J.; Beland, J.F. Aluminum Extrusions for Automotive Crash Applications; SAE Technical Paper. No. 2017-01-1272; SAE International: Materials Park, OH, USA, 2017. [Google Scholar]
- Tundal, U.; Resiso, O.; Skejervold, S.R. Al-Mg-Si Aluminium Alloy with Improved Properties. U.S. Patent 9,840,761, 25 April 2013. [Google Scholar]
- Saha, P.K. Aluminum Extrusion Technology; ASM International, Member/Customer Service Center: Materials Park, OH, USA, 2000. [Google Scholar]
- Alexis., S.; Martin, J. High Strength Products Extruded from 6xxx Aluminium Alloys Having Excellent Crash Performance. U.S. Patent Application 15/508,243, 26 October 2017. [Google Scholar]
- Miao, W.F.; Laughlin, D.E. Effects of Cu content and presaging on precipitation characteristics in aluminum alloy 6022. Metall. Mater. Trans. A 2000, 31, 361–371. [Google Scholar] [CrossRef]


| Elements | Mg | Si | Fe | Ti | Mn | Al |
|---|---|---|---|---|---|---|
| Content | 0.52 | 0.42 | 0.14 | 0.01 | 0.01 | Bal. |
| Grade | Description |
|---|---|
| 1 | Entire box fragmentation |
| 2 | Deep transverse cracks and fragmentation and severe corner cracking |
| 3 | Internal and external transverse cracks and severe corner cracking |
| 4 | Internal shallow transverse crack and multiple deep corner cracks |
| 5 | Multiple deep corner cracks on the folds |
| 6 | Few deeper corner cracks on the folds |
| 7 | Few small corner cracks on the folds |
| 8 | One small corner crack on the folds |
| 9 | No cracks on the surface |
| Specimens | Number of Cracks | Grade of Crushing Performance | |||
|---|---|---|---|---|---|
| Length < 10 mm | Length = 10–20 mm | Length = 20–30 mm | Length > 30 mm | ||
| A1 | 2 | 0 | 0 | 1 | 6 |
| A3 | 1 | 1 | 0 | 0 | 7 |
| A6 | 0 | 0 | 0 | 0 | 9 |
| Specimens | YS/MPa | UTS/MPa | A/% | Ag/% |
|---|---|---|---|---|
| A1 | 202.4 ± 4.2 | 226.1 ± 0.2 | 13.7 ± 0.4 | 7.2 ± 0.1 |
| A3 | 186.3 ± 1.8 | 214.1 ± 1.3 | 13.9 ± 1.4 | 6.9 ± 0.2 |
| A6 | 174.3 ± 1.3 | 203.4 ± 0.8 | 15.0 ± 0.3 | 6.5 ± 0.1 |
| Specimens | Average Diameter of the Precipitates (CI 1)/nm | Average Length of the Precipitates (CI)/nm | Average Number Density (CI)/μm−2 |
|---|---|---|---|
| A1 | 5.3 ± 1.5 ([5.2, 5.4]) | 41.3 ± 34.4 ([39.7, 42.9]) | 278.1 ± 12.6 ([277.1, 279.1]) |
| A3 | 5.9 ± 1.9 ([5.8, 6.0]) | 116.4 ± 82.3 ([110.8, 122.0]) | 88.2 ± 3.2 ([88.0, 88.4]) |
| A6 | 6.7 ± 2.1 ([6.5, 6.9]) | 125.6 ± 97.3 ([121.5, 129.7]) | 80.1 ± 3.0 ([79.8, 80.4]) |
| Specimens | Spacing of GBPs (CI 1)/nm | Diameter of GBPs (CI)/nm |
|---|---|---|
| A1 | 94.9 ± 60.4 ([74.9, 114.9]) | 55.4 ± 15.2 ([50.4, 60.4]) |
| A3 | 193.0 ± 125.0 ([154.3, 231.7]) | 61.6 ± 11.0 ([58.2, 65.0]) |
| A6 | 408.2 ± 201.4 ([341.5, 474.9]) | 70.4 ± 14.3 ([65.7, 75.1]) |
Publisher’s Note: MDPI stays neutral with regard to jurisdictional claims in published maps and institutional affiliations. |
© 2021 by the authors. Licensee MDPI, Basel, Switzerland. This article is an open access article distributed under the terms and conditions of the Creative Commons Attribution (CC BY) license (https://creativecommons.org/licenses/by/4.0/).
Share and Cite
Lu, J.; Jiang, H.; Ye, L.; Sun, D.; Zhang, Y.; Zhan, X.; Li, Y.; Ma, L.; Ran, Q.; Tang, J. Effect of Aging Time on Crushing Performance of Al-0.5Mg-0.4Si Alloy for Safety Components of Automobile. Metals 2021, 11, 608. https://doi.org/10.3390/met11040608
Lu J, Jiang H, Ye L, Sun D, Zhang Y, Zhan X, Li Y, Ma L, Ran Q, Tang J. Effect of Aging Time on Crushing Performance of Al-0.5Mg-0.4Si Alloy for Safety Components of Automobile. Metals. 2021; 11(4):608. https://doi.org/10.3390/met11040608
Chicago/Turabian StyleLu, Jinkun, Haichun Jiang, Lingying Ye, Daxiang Sun, Yong Zhang, Xin Zhan, Yuping Li, Lehang Ma, Qingrong Ran, and Jianguo Tang. 2021. "Effect of Aging Time on Crushing Performance of Al-0.5Mg-0.4Si Alloy for Safety Components of Automobile" Metals 11, no. 4: 608. https://doi.org/10.3390/met11040608