
Analyzing the Research Evolution in Response to COVID-19
by
 , , ,
, , ,
Weirong Li
1,2 ,
,
Kai Sun
1,2,
Yunqiang Zhu
1,3,*,
Jia Song
1,3,
Jie Yang
1,
Lang Qian
4 and
Shu Wang
1
1
State Key Laboratory of Resources and Environmental Information System, Institute of Geographic Sciences and Natural Resources Research, Chinese Academy of Sciences, Beijing 100101, China
2
College of Resources and Environment, University of Chinese Academy of Sciences, Beijing 100049, China
3
Jiangsu Center for Collaborative Innovation in Geographical Information Resource Development and Application, Nanjing 210023, China
4
School of Computer Science, South China Normal University, Guangzhou 510000, China
*
Author to whom correspondence should be addressed.
ISPRS Int. J. Geo-Inf. 2021, 10(4), 237; https://doi.org/10.3390/ijgi10040237
Submission received: 12 January 2021
/
Revised: 15 March 2021
/
Accepted: 4 April 2021
/
Published: 7 April 2021
(This article belongs to the Special Issue Scaling, Spatio-Temporal Modeling, and Crisis Informatics)
Abstract
:In order to understand how these studies are evolving to respond to COVID-19 and to facilitate the containment of COVID-19, this paper accurately extracted the spatial and topic information from the metadata of papers related to COVID-19 using text mining techniques, and with the extracted information, the research evolution was analyzed from the temporal, spatial, and topic perspectives. From a temporal view, in the three months after the emergence of COVID-19, the number of published papers showed an obvious growth trend, and it showed a relatively stable cyclical trend in the later period, which is basically consistent with the development of COVID-19. Spatially, most of the authors who participated in related research are concentrated in the United States, China, Italy, the United Kingdom, Spain, India, and France. At the same time, with the continuous spread of COVID-19 in the world, the distribution of the number of authors has gradually expanded, showing to be correlated with the severity of COVID-19 at a spatial scale. From the perspective of topic, the early stage of COVID-19 emergence, the related research mainly focused on the origin and gene identification of the virus. After the emergence of the pandemic, studies related to the diagnosis and analysis of psychological health, personal security, and violent conflict are added. Meanwhile, some categories are most closely related to the control and prevention of the epidemic, such as pathology analysis, diagnosis, and treatment; epidemic situation and coping strategies; and prediction and assessment of epidemic situation. In most time periods, the majority of studies focused on these three categories.
1. Introduction
The emergence of COVID-19 (Coronavirus Disease 2019) has resulted in a significant shock across the whole world, and tens of millions of people are suffering from the respiratory disease caused by SARS-CoV-2 (Severe Acute Respiratory Syndrome Coronavirus 2) [1]. Faced with such an emergency, scientists around the world have been carrying out a vast amount of research and have published a large number of papers to help understand COVID-19 and to support the prevention and control of the epidemic. This raises a question of how these studies are evolving to respond to COVID-19? This question can be further explored by three more detailed questions from different perspectives: (1) In terms of time, how has the number of papers grown over time as the epidemic evolves? (2) Spatially, what is the distribution of these papers based on the country of authors? (3) From a topical perspective, how have the concerned topics changed with the development of the epidemic? Answering these questions cannot only contribute to understanding how scientific research has been facilitating the containment of COVID-19, but also can help scientists to recognize more scientific problems and gaps for improving the current epidemic situation or dealing with any potential issues, such as the social or economic problems indirectly caused by this pandemic. Therefore, in order to answer them, we need to extract the spatio-temporal and topic information from papers using text mining techniques, and then analyze the research evolution in response to COVID-19 from three above-mentioned perspectives.
Text mining refers to the process of recognizing and extracting previously unknown, understandable, potential, and valuable information from unstructured text using natural language processing (NLP) and machine learning techniques [2,3]. In recent years, with the continuous development of related technologies, the capability of extracting topic and spatio-temporal information, and analyzing and understanding text has been greatly improved, which has been well applied in studies related to emergency response and decision support of unexpected events (e.g., environmental natural hazards [4,5,6] or infectious diseases [7,8]). For example, Cvetojevic and Hochmair used text mining, exploratory methods, and regression models to analyze the spread of tweets in response to the November 2015 Paris terrorist attacks [9]. Han et al. mined public opinions from social media data by Latent Dirichlet Allocation (LDA) model [10], and analyzed the spatio-temporal varies of these opinions in the early stage of COVID-19 emergence [11]. Ye et al. extracted topic words from a microblog (a Twitter-like social media in China) related to Gordon fever by LDA model and analyzed the evolution pattern of Gordon fever in China in 2014 combined with spatio-temporal information [12]. Liu et al. analyzed the concerns of the news media during the early stage of the COVID-19 emergency in China through a topic modeling approach [13].
Some studies have also carried out the mining and analysis of related research progress on COVID-19 [14,15,16]. For example, Älgå et al. used the LDA model to extract topics from papers related to COVID-19, and based on topics, impact factor, and publishing time, they analyzed the research progress during the early phrase of COVID-19 pandemic from the perspective of bibliometrics [15]. Zhang et al. extracted the research topics from coronavirus papers, which were published from January 2009 to April 2020, then used the resilience theory to explore how the trajectory of coronavirus research was affected by the COVID-19 pandemic [16]. The above-mentioned studies lay a good foundation for extracting and analyzing topic and spatio-temporal characteristic from papers related to COVID-19 in this work.
Aiming at analyzing how related research have evolved in response to COVID-19, this study designed a method of extracting topic and spatio-temporal information, and then conducted a comprehensive analysis the research evolution. The contributions of this study are twofold: First, an overall process is designed and implemented to extract the country of authors (spatial information) from the institutional information of papers by named entity recognition (NER) techniques and external knowledge bases, mine the topics from the titles and abstracts of papers using topic models, and classify the extracted topics into different categories by machine learning algorithms. Second, using the correlation analysis method, this study explored how studies related to COVID-19 are driven by the spread of this virus from different perspectives and levels, and analyzed the temporal trends, spatial distribution, and topic variation of papers.
The remainder of this paper is organized as follows. Section 2 presents the datasets and methods of spatial information extraction, topic extraction, and classification used in this paper. Section 3 calculates the Spearman’s rank correlation coefficients between related papers and the confirmed cases of COVID-19, and analyzes the temporal trends, spatial distribution, and topic variation of these papers. Section 4 discusses some deficiencies in this study. Finally, Section 5 concludes this article and discusses the future works.
2. Data and Methods
2.1. Data and Data Preprocessing
In this study, we collected and used three datasets. The first dataset included the metadata of papers related to COVID-19 and was obtained from the COVID-19 open research dataset (CORD-19) (https://www.semanticscholar.org/cord19, accessed on 1 March 2021) published by Semantic Scholar, an artificial intelligence-backed search engine for academic publications. CORD-19 is jointly released by the United States National Library of Medicine; the Allen Institute for Artificial Intelligence, Kaggle, Georgetown University; and the White House Office of Science and Technology Policy. CORD-19 is updated on a daily basis and consists of three parts: paper metadata, full text JSON, and SPECTER embeddings. We downloaded this dataset with the version of “cord-19_2021-03-01”, which included 78,125 articles related to COVID-19 published from 15 January 2020 to 28 February 2021. As the metadata already contained the components that describe the topic and temporal information, such as title, abstract, and publishing time, it is not necessary to extract them from the full text, but only using the “paper metadata”. The abstract and title of papers included some interfering information, such as punctuations, special symbols, Internet addresses, and hyperlinks, affecting the accuracy and efficiency of the information extraction. Thus, they were removed beforehand using regular expressions.
Considering the lack of institutional information in the metadata part of CORD-19, which is necessary for extracting the country of authors, we obtained this information by crawling the Microsoft academic website (https://academic.microsoft.com/home, accessed on 1 March 2021) with the title of papers using web crawler technology. As many papers contained more than one piece of institutional information, we used regular expressions to separate them into a single piece of institutional information to make the extraction of the country name and data analysis more convenient.
The second dataset was the global COVID-19 cases data (https://covid19.who.int/table, accessed on 1 March 2021) released by the World Health Organization (WHO), which provides daily updates on the number of new confirmed cases and deaths by country, territory, or region, and reveals the global situation of the COVID-19 pandemic.
The third dataset is the search interest of several keywords related to COVID-19 from Google Trends (http://trends.google.com, accessed on 1 March 2021). Google Trends is a analysis tool, which can tell users the search frequency and related statistics of a search keyword in different periods by analyzing billions of Google search results around the world [17] and has been widely used in various scientific research [18,19,20].
2.2. Methods
The temporal information can be obtained directly from the used datasets, namely, the publishing time of papers in the metadata part of the CORD-19 dataset, while the spatial and topic information are required to be extracted from the other related components of papers. In this section, we present the methods of spatial information extraction and topic extraction and classification, respectively. We also introduce the method of correlation calculation used in this paper.
2.2.1. Spatial Information Extraction
The institutional information can be roughly divided into three categories: The first category provides complete institutional information, composed of the name of the institution, the country name, the city name, etc. For example, the institutional information of “Tsinghua University, Beijing, China”, in which “Tsinghua University” is the name of the institution and “Beijing” and “China” are the city and country, respectively, where Tsinghua University is located. The second category only includes the name of the institution, but there is a toponym in it. For example, the institutional information of “Wuhan University”, where “Wuhan” is a toponym. The third category also only contains the name of the institution. However, there is no toponym in it, such as the institutional information of “Harvard University”.
In response to the different situations of the above-mentioned three categories of institutional information, we propose an automatic process to obtain the authors’ country, which combines the NER techniques and some external knowledge bases such as gazetteer and encyclopedia library. This process is consisted of two steps: (1) institutional information classification, which classifies the input institutional information into one of the above-mentioned three categories, and (2) country information extraction, according to which category the institutional information belongs to, different methods will be employed to extract the country information. The detailed process is shown in Figure 1.
The first step is implemented using NER techniques and gazetteer matching. Specifically, we use the spaCy NER tool and GAMD (https://gadm.org/, accessed on 1 March 2021) as the gazetteer for matching. In some previous studies, spaCy has been proved superior to other toolkits in many ways (such as the efficiency of POS tagging and parsing) [21]. This model supports the entity recognition of multiple types, among which the categories related to institutional information include GPE (e.g., countries, cities, or states) and ORG (e.g., companies, agencies, or institutions). Thus, we first employ the spaCy NER tool on the institutional information to recognize the possibly contained named entities, as the recognized entities from the first category of institutional information will be classified into two categories: ORG and GPE. However, the other two types of institutional information will have only one category in their output, namely, ORG. Therefore, according to the number of categories in the output, we can determine whether the input institutional information belongs to the first category or not. If the input institutional information does not belong to the first category, we will continue to differentiate whether it belongs to the second or the third category by gazetteer matching. We will first process the input information by word segmentation and stop words removal, and then match the processed results with the entries of GAMD. If the processed information can be matched with one entry from the gazetteer, this institutional information will be classified into the second category. Otherwise, it would belong to the third category.
According to the different categories of institutional information identified in the previous step, the second step will employ the corresponding methods to complete the extraction of the country name. For the first category of institutional information, we directly matched the GPE entity recognized by the spaCy model in the last step with the GAMD gazetteer. GAMD provides place names for the administrative areas of all countries, at all levels of subdivision. It organizes the data by rows, and each row in this dataset includes multiple columns, such as “NAME_0” representing the name of the country where the current administrative area is located, and “NAME_1”, “NAME_2”, or “NAME_3”, representing the place names of the multi-level administrative areas. Therefore, when the GPE entity is matched with one row of this dataset, the value of column “NAME_0” in this row is the country name we desire. Regarding the second category of institutional information, as it can also match one row of the gazetteer after word segmentation and stop words removal, we can obtain the country name from this category of information by the same method as used by the first category. With respect to the third category, it cannot match any rows of the gazetteer, as there is no toponym in this category of information. Therefore, we use a different method to obtain the country name, namely, using web crawler technology to automatically search the name of the institution on an encyclopedia website (https://www.thefreedictionary.com/dictionary.htm, accessed on 1 March 2021). As this website annotates the country information of institutions with a unique html label (e.g., “<span class = ‘country-name’> China </span>”), we can simply obtain the country name by extracting the text value corresponding to this label in the web page.
A simpler way to extract the country name of all categories of institutional information is to match the name of the institution with the corresponding web page of the encyclopedia website. However, we will not do it in this way as many institutions are not included on the said website. In such cases, the country name for these institutions cannot be obtained. Therefore, in order to obtain the country name of authors for as many papers as possible, as for the first and second categories of institutional information, we will extract the country name by matching it with the gazetteer, as it contains almost all of the place names for all countries. The country name of the third category of institutional information can only be obtained using the encyclopedia website due to its lack of toponym.
2.2.2. Topic Extraction and Classification
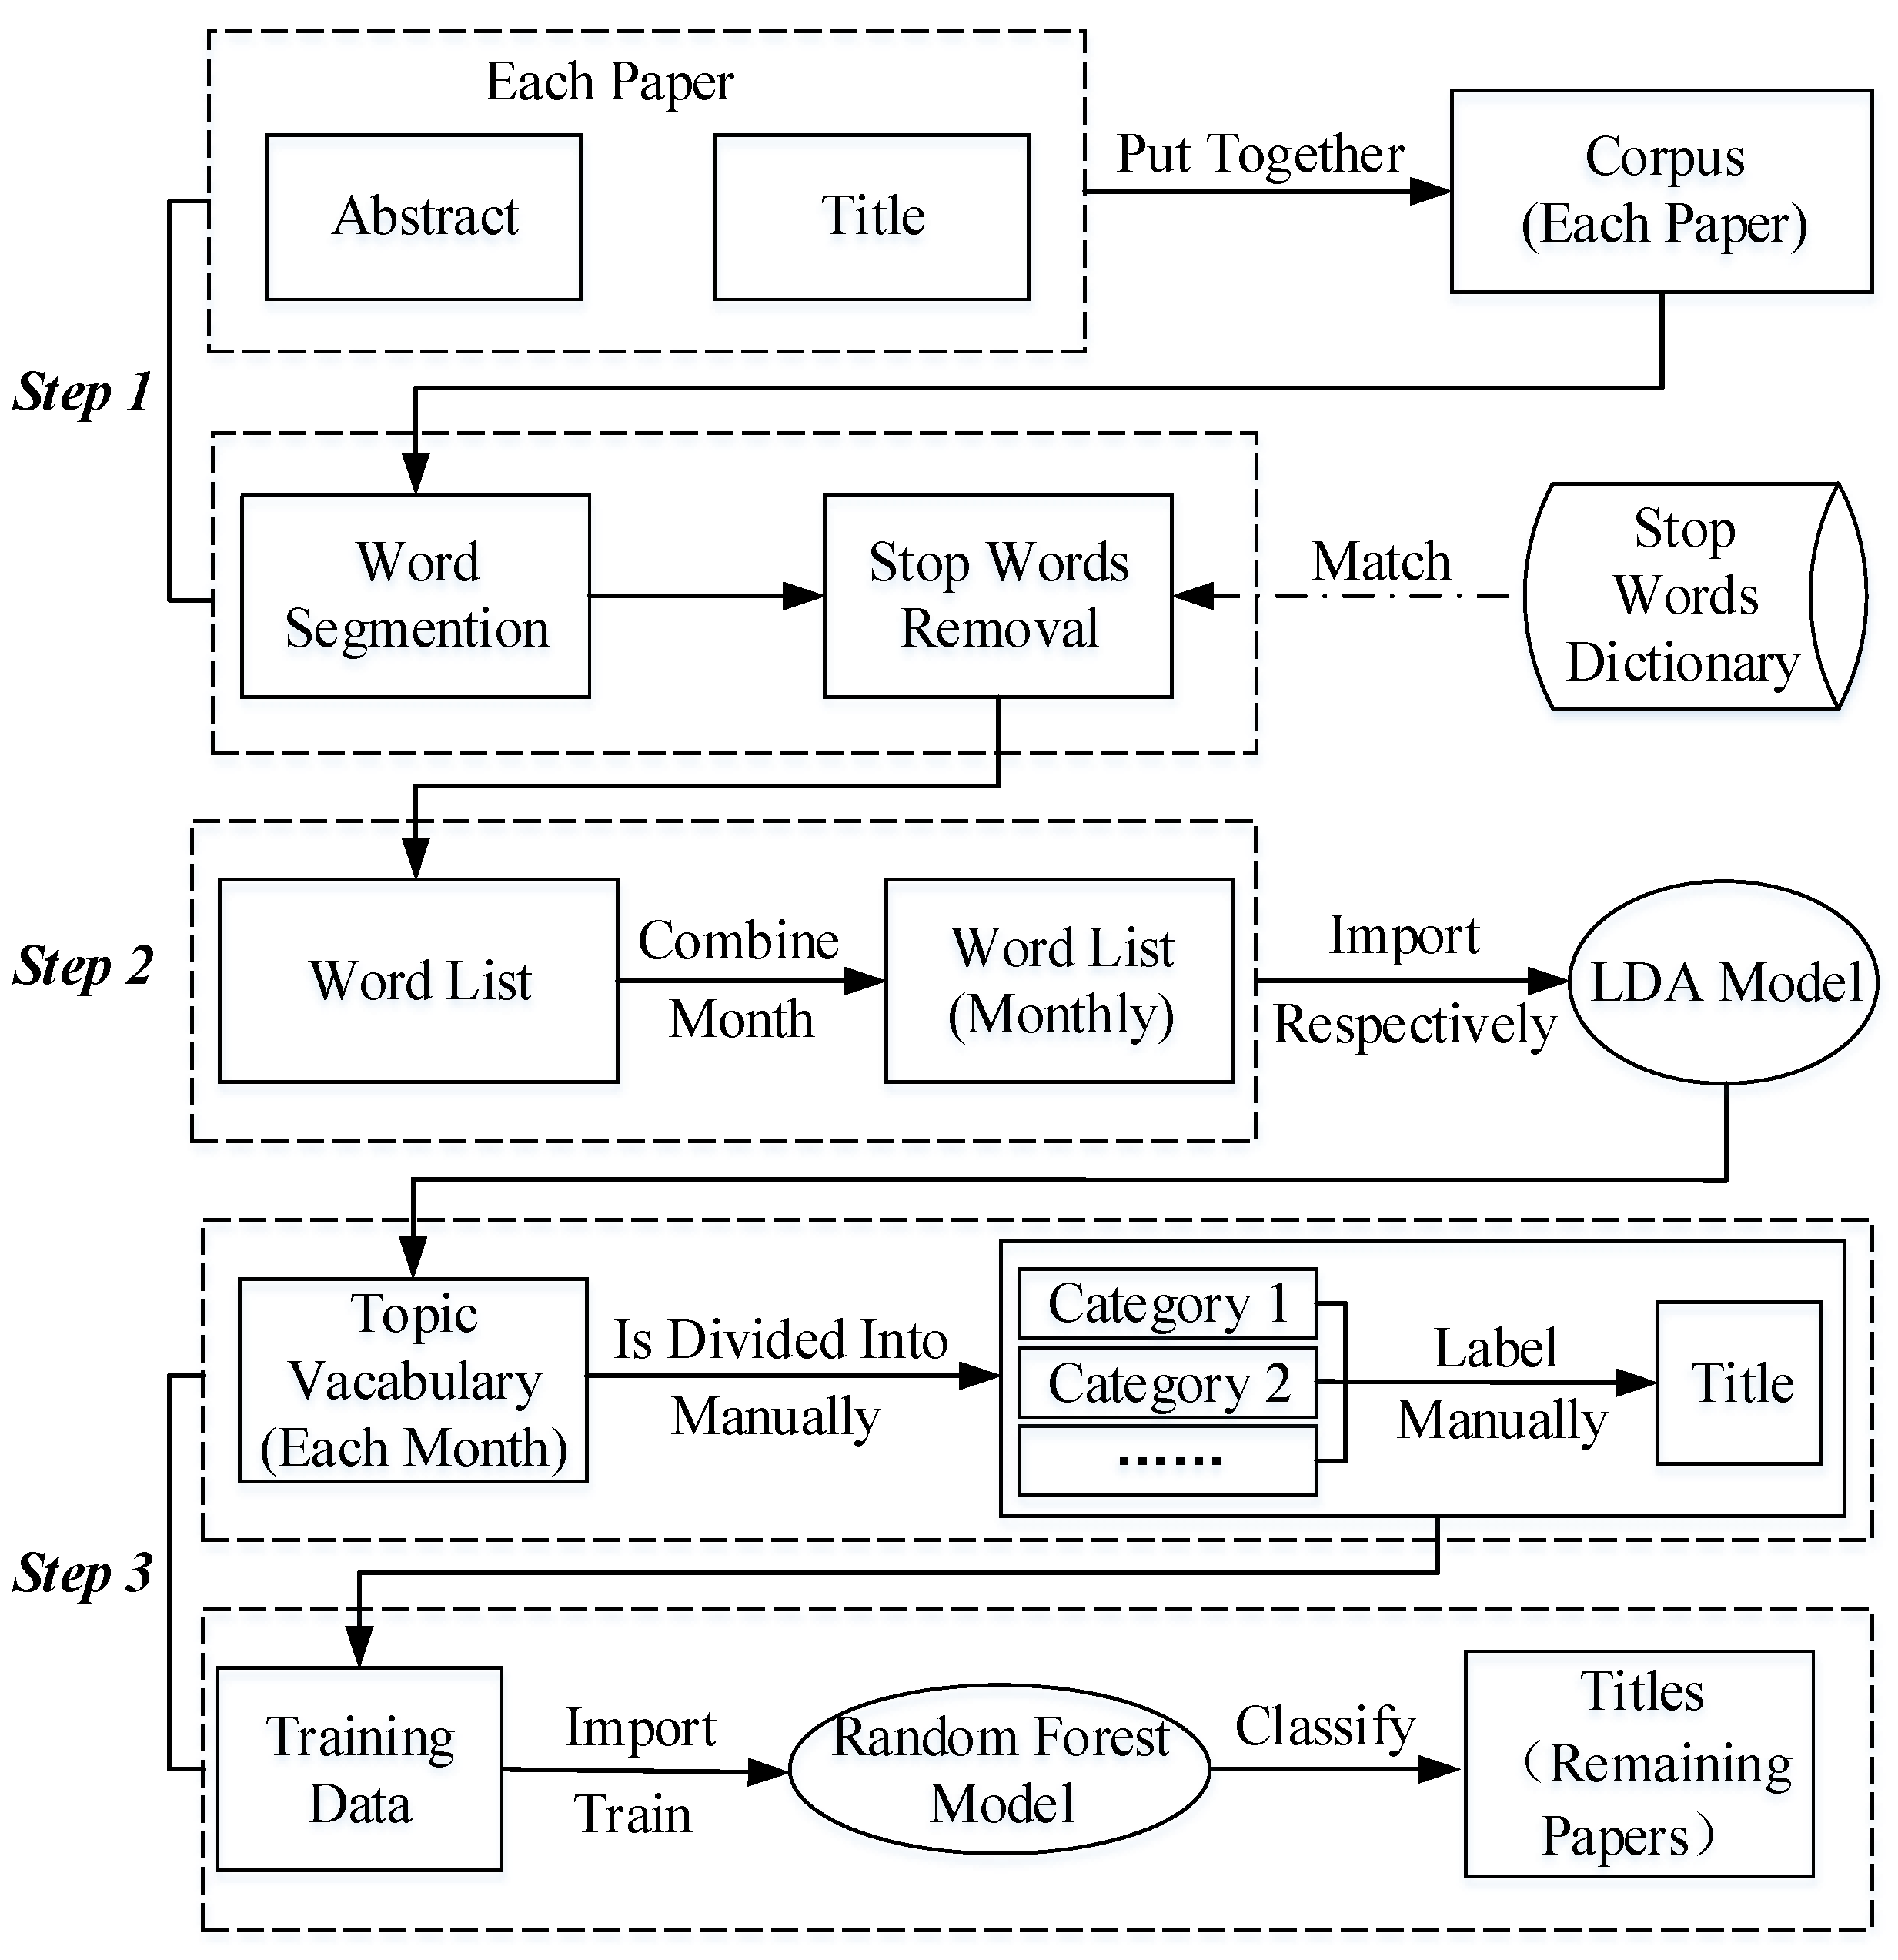
As the abstract and title are usually the most informative sections describing the main idea of an article and are easier to extract information from due to their much smaller number of words than that of the full text of a paper, we will extract the topic from them in this study. After finishing the topic extraction, we will further classify the extracted topics into different categories. The above two tasks are carried out using the LDA model and the random forest algorithm, respectively. Random forest is an ensemble learning algorithm combining multiple decision trees [22], which shows excellent performance in the tasks of text classification, regression, and so on [23,24,25]. The whole process consists of three steps: (1) word segmentation and the stop words removal, (2) topic extraction, and (3) topic classification, as shown in Figure 2.
Step 1. Word segmentation and stop words removal. First, we build a corpus for each paper by putting its title and abstract together. Then, word segmentation is employed on the built corpus and the stop words are removed from it. Finally, the processed corpus is organized as a word list.
Step 2. Topic extraction. This study implements topic extraction by invoking the LDA model (LDA is a topic-generative model, which can output the topics of an input document according to the probability distribution of words in the document [10]) using the Gensim (https://radimrehurek.com/gensim/, accessed on 1 March 2021) package in Python, which takes a nested word list as the input, where each sub-list represents the word list of one document. Specifically, each sub-list includes the word list of the title and abstract of one paper in this study. As we will analyze the change of research topics by month, we combine the word lists of corpuses (each corpus consists of the title and abstract of one paper) of papers published in the same month into a nested list (e.g., [[“nCov-19”, “virus”, “…”], [“…”, “…”]]), and then feed it into the LDA model to extract the topic. There are three important parameters in LDA model—num_topics, alpha, and beta, among which num_topics represents the number of topics to be extracted, alpha affects the sparsity of topics, and beta affects the sparsity of words. In this study, different values of the num_topics parameter are used for topic extraction in different months. Specifically, we assigned this parameter as 5 for January 2020, 10 for February 2020, 15 for March 2020, and 20 for the rest of the months until February 2021 to run the model. We assigned alpha as 1/num_topics and beta as 1/(10*num_topics), learning from the previous literature of Griffiths and Steyvers [26].
Step 3. Topic classification. According to the extracted topic vocabularies in the previous step, we defined several categories for papers related to COVID-19 and labeled the titles of 20,000 papers from 78,125 papers with the defined categories. Of the labeled data, 14,000 are used as the training data and the remaining 6000 as the testing data for the random forests model. The random forest regressor feature in the Python scikit-learn library is used to implement the random forests model in this paper, where n_estimators (the number of decision trees) and max_features (the number of features) are the two most important parameters. We optimally assigned them as 197 and 240, respectively, by parameter tuning. The remaining papers will be automatically classified into the predefined categories based on their titles using the trained model.
2.2.3. Correlation Calculation
There are many measures of correlation analysis, among which the Pearson correlation coefficient, Kendall tau rank correlation coefficient, and Spearman’s rank correlation coefficient are commonly used. As the first method requires the variables to be normally or linearly distributed [27] and the second method is an index reflecting the correlation between categorical variables [28], neither of them are suitable for the case of our study. The Spearman’s rank correlation coefficient calculates the correlation by the ranking of elements in two vectors or collections, which can effectively reveal the direction and the degree of the variation tendency between two variables. Thus, we use this method to analyze the potential correlation between the development of the COVID-19 pandemic and the related studies. The Spearman’s rank correlation coefficient (RS) is calculated as Equation (1), where R(Xi) and R(Yi) denote the rankings of each element in the respective vectors or collections (e.g., if there are two collections: X = [170,150,210,180,160], Y = [180,160,190,169,172], then the element ranking collection of both are R(X) = [3,1,5,4,2] and R(Y) = [4,1,5,2,3]. R(Xi) and R(Yi) are the ith element in R(X) and R(Y), respectively, and N is the number of elements in the vectors or collections.
In this study, we calculated Spearman’s rank correlation coefficient by invoking the Numpy package in Python. In addition to the coefficients Rs, the calculation results will also contain the significance level (p), which is obtained by paired t-test and is used to decide whether two metrics are correlated. When p is less than 0.01, the two metrics are considered to be statistically significantly correlated.
2.2.4. Results Evaluation
We used Precision (P), Recall (R), and F1-measure (F1) [29] to evaluate the accuracy of information extraction and classification in this work, which are the metrics commonly used in the field of information retrieval. Precision refers to the ratio of correctly extracted (classified) items in all extracted (classified) items. Recall is the proportion of correctly extracted (classified) items in all items. There is a trade-off between precision and recall; thus, it was necessary to consider the weighted harmonic mean of precision and recall, namely, the F1-measure. The higher the F1-measure is, the more effective the extraction (classification) methods are. These three metrics are defined by Equations (2)–(4), where denotes the number of country names correctly extracted from the institutional information, or the number of papers correctly classified; denotes the number of country names incorrectly extracted from the institutional information, or the number of papers incorrectly classified; and denotes the total number of country names incorrectly and unsuccessfully extracted, or the total number of papers incorrectly and unsuccessfully classified.
3. Results and Analysis
In this section, we first evaluate the results of the information extraction and classification, and then undertake a comprehensive analysis of the multi-level correlations between the published research papers related to COVID-19 and the development of this epidemic.
3.1. Results
To evaluate our method of spatial information extraction, we randomly selected 6000 pieces of institutional information and labeled them with correct county name as the ground truth. The performances are shown in Table 1. The values of , , and are 5599, 167, and 401, respectively. Thus, the computed precision, recall, and F1-measure using Equations (2)–(4) are 97.1%, 93.3%, and 95.2%, respectively. As for topic classification, the performance of the random forests model on the testing data is shown in Table 2, where is 4883, is 1117, and is also 1117, i.e., the number of unsuccessfully classified papers is 0. Therefore, the calculated evaluation metrics are all 81.3%. The above results indicate that the proposed method was accurate and feasible, thus they can be used for spatial information extraction and topic information extraction and classification on the remaining papers, thereby laying the foundation for the further analysis in the following subsections.
3.2. Temporal Analysis
In order to better analyze and understand the temporal correlation between the COVID-19 pandemic and the related research evolution, we calculate the Spearman’s rank correlation coefficients between the number of confirmed cases and the number of published papers and analyze their trend over time at the overall, the monthly, and daily levels, respectively.
3.2.1. Temporal Analysis at the Overall Level
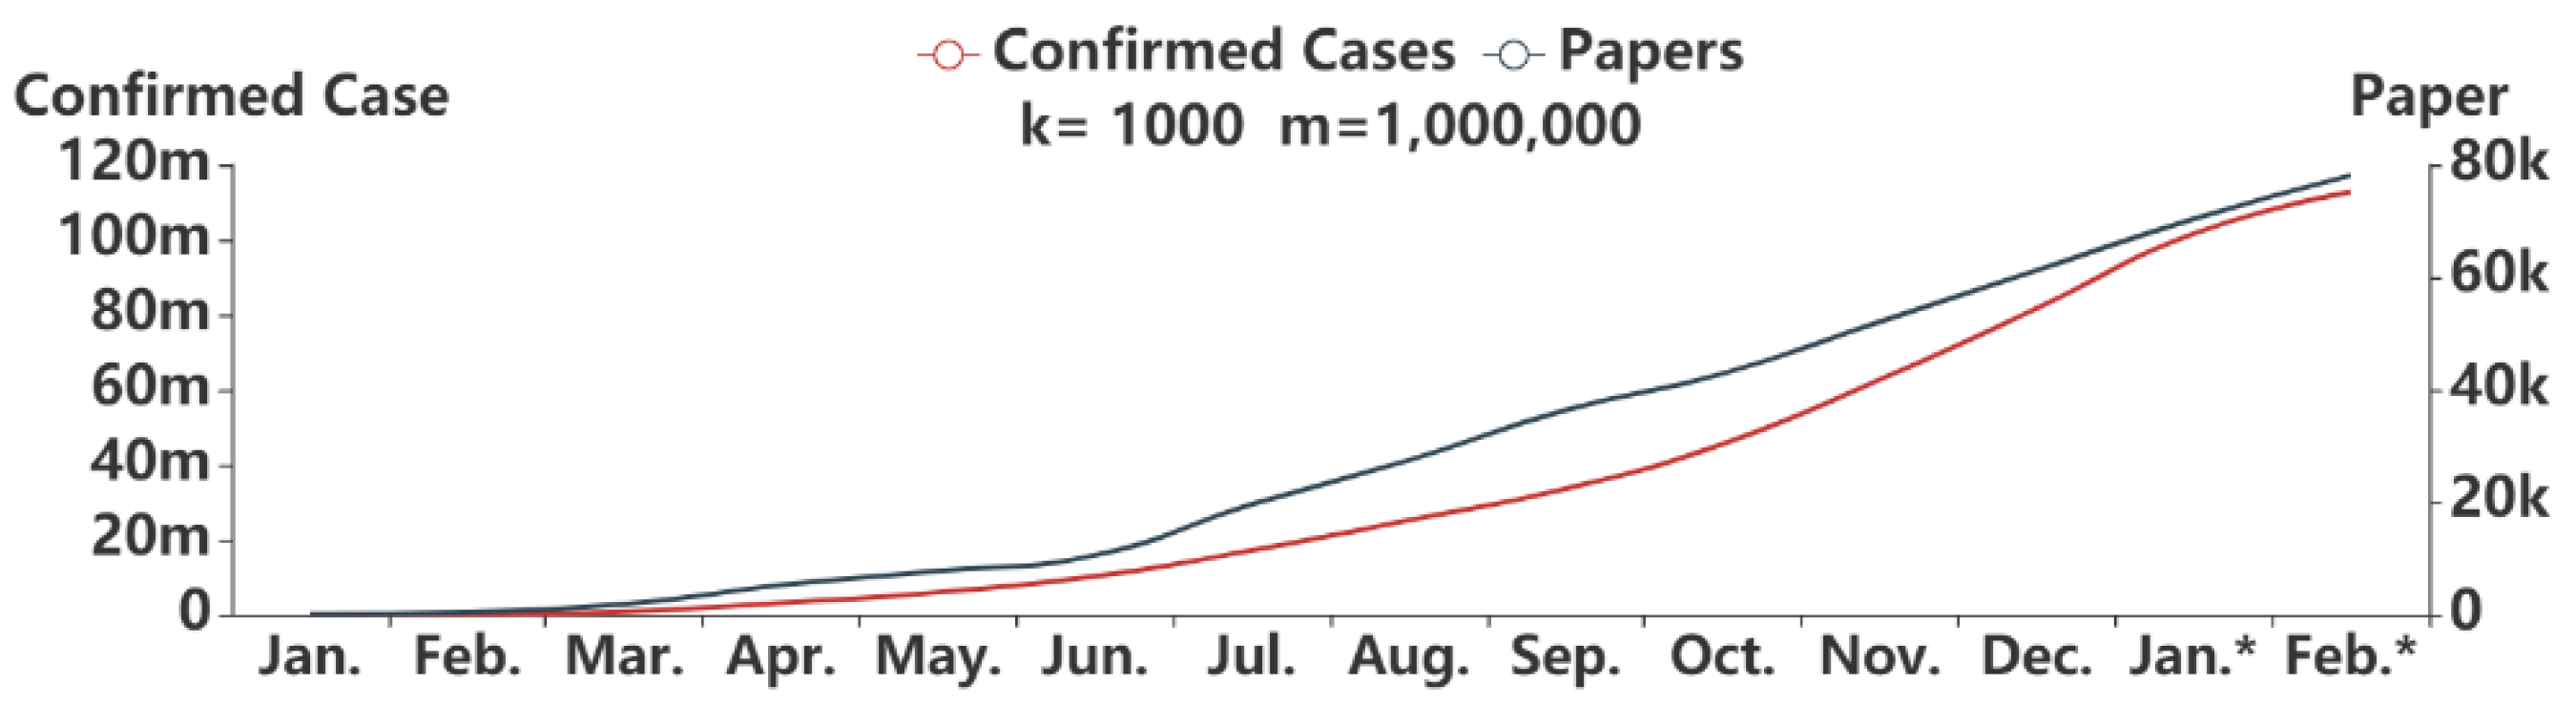
The Spearman’s rank correlation coefficient between the cumulative number of the confirmed cases and the cumulative number of published papers by month is shown in Table 3. The significance level, which is equal to 0 and less than 0.01, indicates that these two variables are statistically highly significant. The coefficient Rs is equal to 1, showing that there is a very strong positive correlation between these two variables.
As shown in Figure 3 and Table 3, the cumulative number of confirmed cases rapidly increased from 9906 to 113,432,271, while the cumulative number of published papers also increased from 37 to 78,125 in the past 14 months. These two curves show a very similar trend. However, from a practical point of view, there is a certain degree of deviation between the cumulative number of papers and confirmed cases. This is because the publication of papers takes a certain amount of time, while the number of confirmed cases can increase rapidly in a short time due to untimely prevention and control.
3.2.2. Temporal Analysis at the Monthly Level
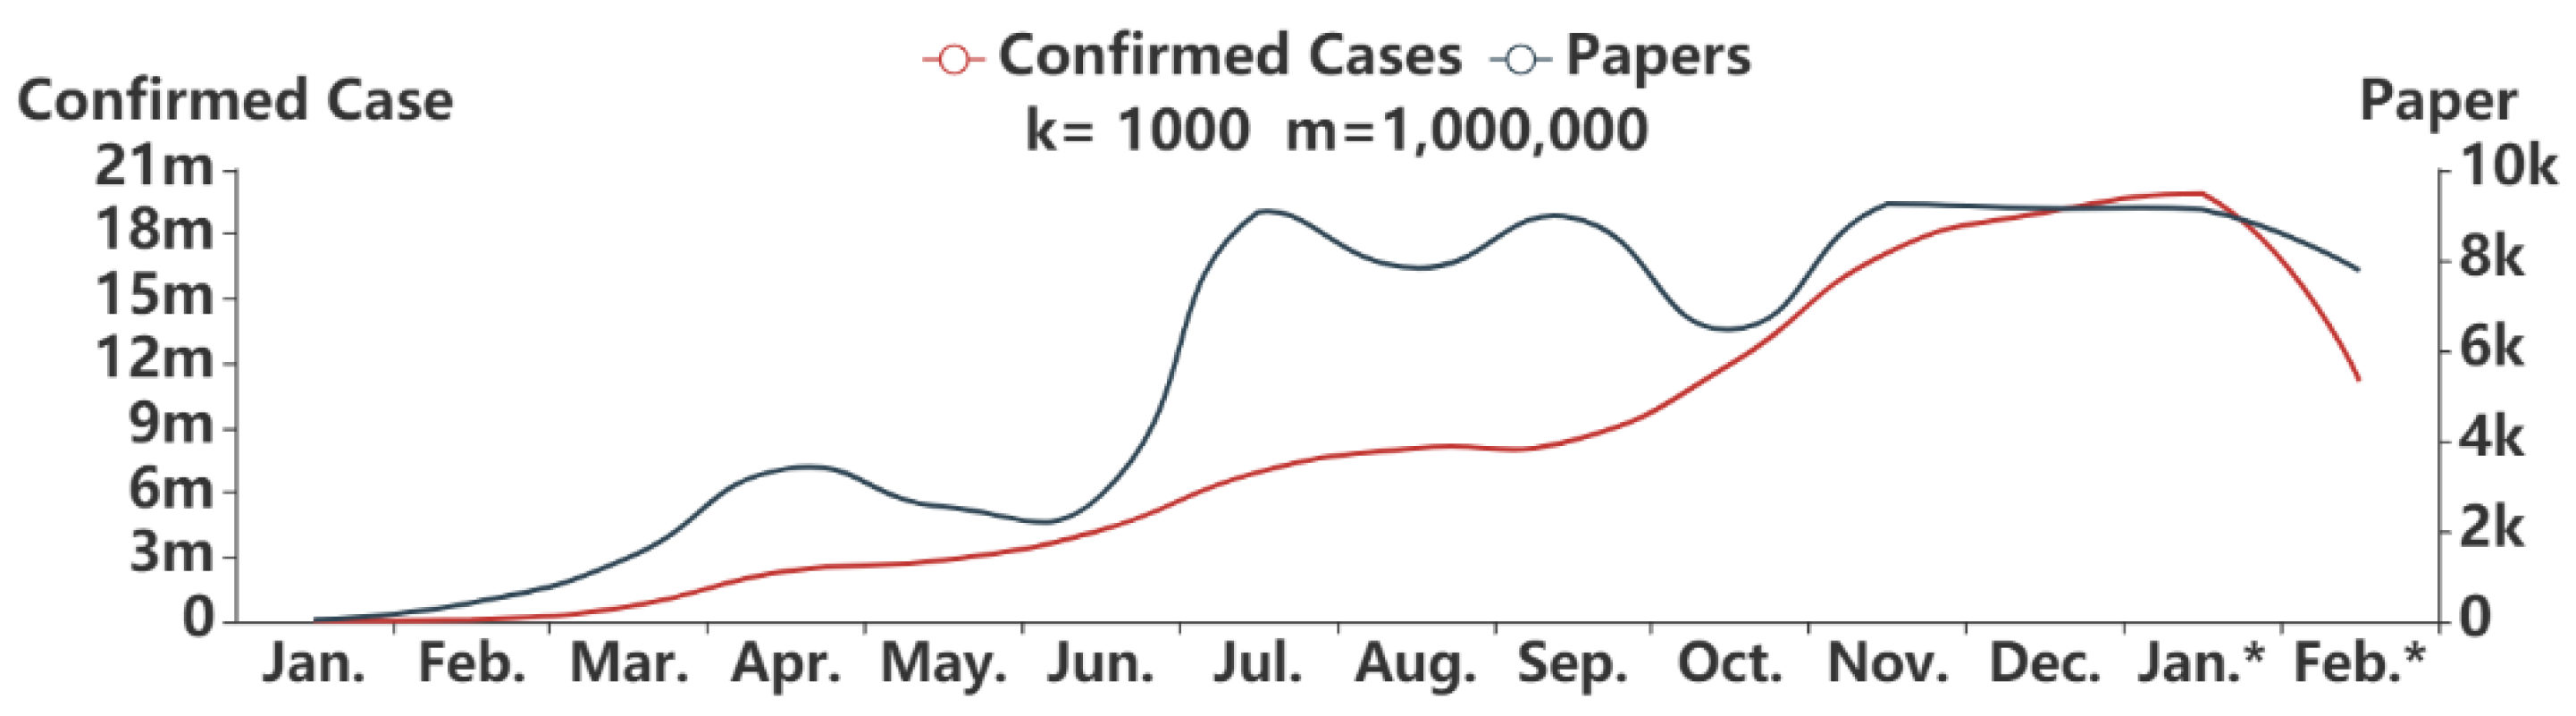
The calculated correlation coefficient between the number of new confirmed cases and the number of new published papers at the monthly level is shown in Table 4. As can be seen, the significance level (p = 2.5 × 10⁻⁵), which is smaller than 0.01, indicates that the correlation between these two variables is statistically significant. The coefficient Rs of 0.89 is much greater than 0 and even much larger than 0.5, showing that these two variables have a high degree of correlation.
Figure 4 shows the changes in the number of new confirmed cases and the number of new published papers by month from January 2020 to February 2021. In general, both variables show an obvious and continuous synchronous upward trend, proving again the high correlation between these two variables. Although a large deviation occurs in a few time nodes (the reason for this may be similar to that mentioned in Section 3.2.1), there is also a good consistency between them in the majority parts of the curves, indicating that the research evolution is driven by the spread of the epidemic. Specifically, only 37 related papers were published in January, the time of COVID-19 emergency. In February, the number began to rise and increased to 404. The number of papers continued to increase with a total of 1411 papers published in March when COVID-19 started to spread across the world. On March 11, WHO declared the emergency of coronavirus as a pandemic. After this, a small peak of 3375 occurred in April. In May and June, the trend remained stable, and the number of papers (2533 and 2788, respectively) did not differ much. In July, the number of papers increased explosively, reaching the highest point in seven months with 9065 papers. There were 7829, 8935, 6467, 9244, 9147, 9121, and 7768 papers published each month from August 2020 to February 2021, respectively, with little fluctuation and a relatively stable trend.
3.2.3. Temporal Analysis at the Daily Level
The Spearman’s rank correlation coefficient between the number of new confirmed cases and the number of new published papers at the daily level is computed, as shown in Table 5. The very small p value, close to 0, indicates that the correlation between these two variables is very statistically significant. These two variables are also significantly positively correlated, with a Rs value of 0.67. Compared with the correlation of these two variables at the monthly level, the correlation at daily level is less positive.
This correlation can also be found by illustrating the numbers of new confirmed cases and the number of new published papers at the daily level as curves, as shown in Figure 5. At the beginning of the COVID-19 emergency, the first paper was published later than the time when the first case of COVID-19 was confirmed. On 24 January, the fluctuation in the number of papers was significantly larger than that of confirmed cases, which may be a cumulative number due to the time delay caused by carrying out research, writing papers, peer reviews, etc. In February, generally, the daily number of papers continued to increase, but compared with the similar trends of these two variables in January, there was a great difference between them in February. This is because the majority of the confirmed cases were reported in China during this period, and some timely and strict prevention measures were taken by the government (e.g., building the Huoshen Mountain Hospital and the Raytheon Mountain Hospital, the delivery of many medical staff members and a large number of medical supplies to Wuhan, and blocking traffic), resulting in the number of confirmed cases increasing at a low rate. This indicates the importance of the rational allocation of medical resources and timely prevention measures for containing the epidemic in a short period of time. Meanwhile, the epidemic was brought into focus for many scientists; thus, the number of papers began to increase.
Subsequently, COVID-19 started to spread around the world in March. More scientists from various countries carried out related research in succession, and the number of papers also increased rapidly. The curves of these two variables showed a similar trend. From April, most countries actively implemented prevention and control measures, the growth trend of the number of daily new confirmed cases seemed relatively stable in the following several months. However, this number became larger and larger. In these months, there were more daily publications than that in previous months because the researchers had more time to publish their papers. One interesting point observed from these curves is a periodic trough by week because papers are usually published on weekdays, thereby leading to a decrease in numbers over the weekend.
3.3. Spatial Analysis
In this section, we first analyze the correlation and spatial distributions of the cumulative number of confirmed cases and the cumulative number of authors by country, and then present the spatial distributions of the numbers of new confirmed cases and the number of authors for new published papers at the monthly level.
3.3.1. Spatial Analysis at the Overall Level
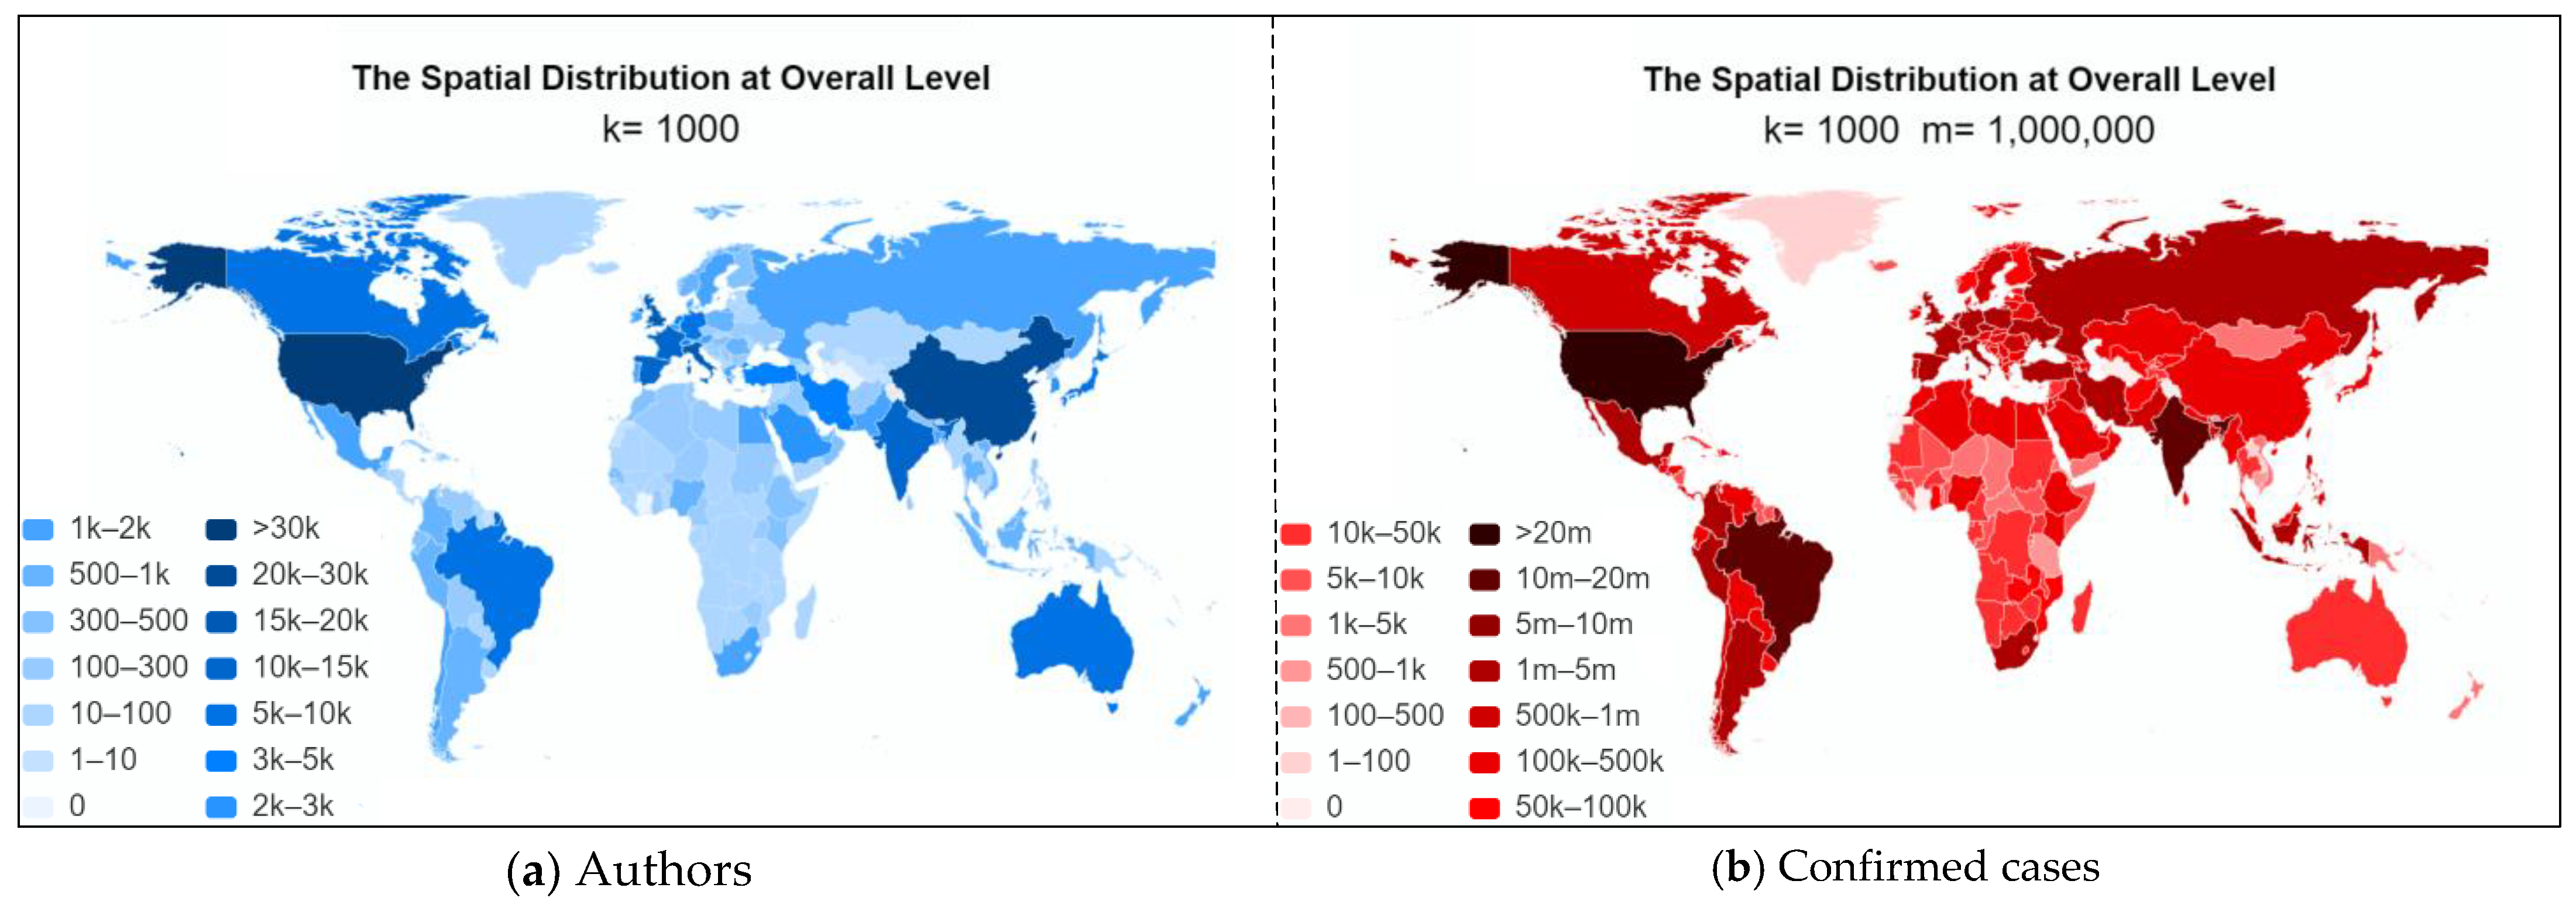
This study can analyze the spatial distribution in two ways: the first way is to count the number of co-authors of each paper by country, this helps us realize the extent to which scientists around the world pay attention to COVID-19 and participate in related research. The second way is to assign different weights for co-authors in a paper, so as to analyze the scientific research contributions of different countries in fighting COVID-19. However, the second way is not only difficult to do, because each author’s contribution to a research is different, but also it is not the goal of our work. Therefore, we chose the first way to analyze the spatial distribution. In Table 6, the calculated result for the correlation coefficient between the cumulative number of authors and confirmed cases is listed. As can be seen, Rs = 0.76 and p = 1.52 × 10−43 (p < 0.01), indicating a strong positive correlation between these two variables. This is consistent with the analyzed results from the temporal perspective.
Table 7 shows the cumulative number of authors over 500 by country. As can be seen, the United States has the largest number of authors, with 58,146. Another country that has more than 20,000 authors participated in related research is China, with a total of 29,011. The following countries are Italy, the United Kingdom, Spain, India, and France, with 18,348, 17,880, 11,214, 11,132, and 11,130 authors, respectively. The countries with between 5000 and 10,000 authors are Germany, Canada, Japan, Brazil, and Australia. Meanwhile, there are approximately 23 countries between 1000 and 5000 authors that participated in related research, and the number of authors in the remaining countries is less than 1000. We cannot simply conclude that those countries have a higher degree of concerns and a greater participation in beating this virus as all countries have very different levels of development, scales, and research capacities. The more developed or bigger a country is, the greater capacity and ability to devote more resources to related studies it has. This is the reason why most of the countries in the top ten are developed countries, except China and India, which are the two most populous countries. Combined with Figure 6, which showed the spatial distributions of the cumulative number of confirmed cases and the cumulative number of authors, we can also observe a good correlation between these two variables. This means the level of scientific research investment in COVID-19 is also indeed correlated with the severity of the epidemic for each country. However, as different countries have different risk tolerances, this will lead to a disproportionate scientific research response under the condition that the number of confirmed cases in these countries is similar. For example, there is scant difference between the number of confirmed cases in China (101,878) and Kenya (105,648), but the risk tolerance in China is stronger than that of Kenya, leading to the number of authors participating in related research in China (29,011) being much higher than that in Kenya (<500), thus affecting the spatial correlation between these two variables.
3.3.2. Spatial Analysis at the Monthly Level
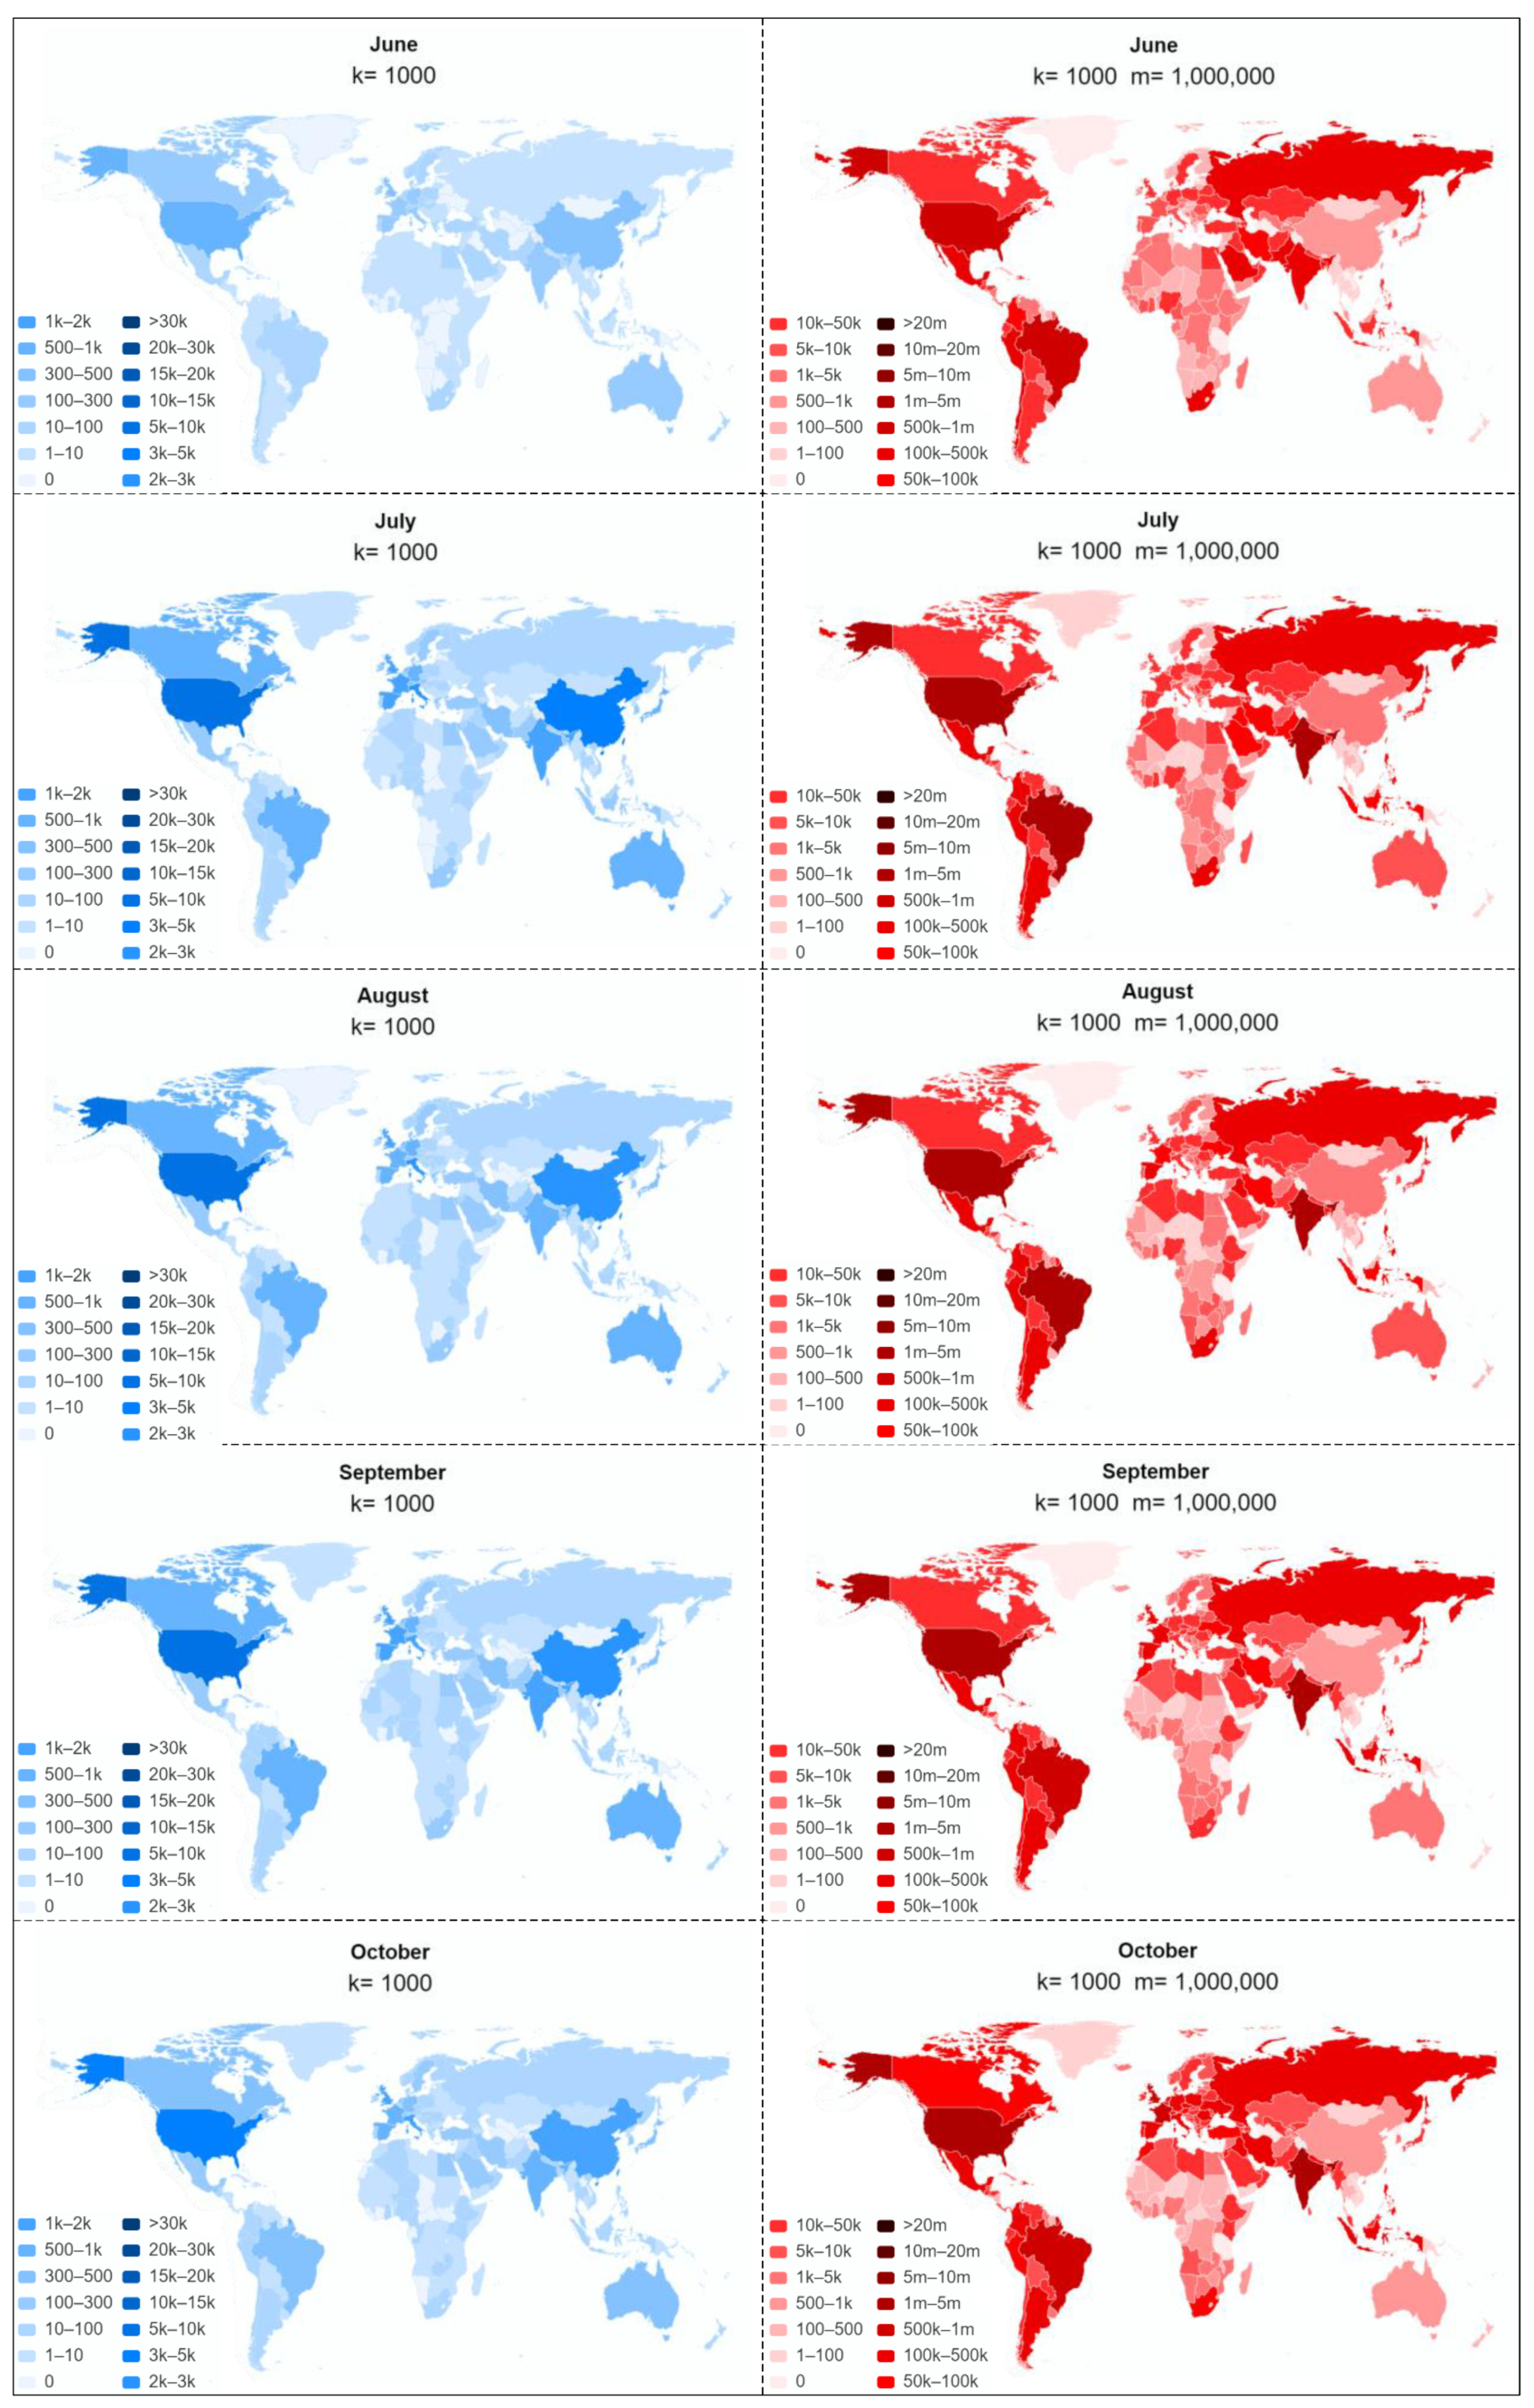
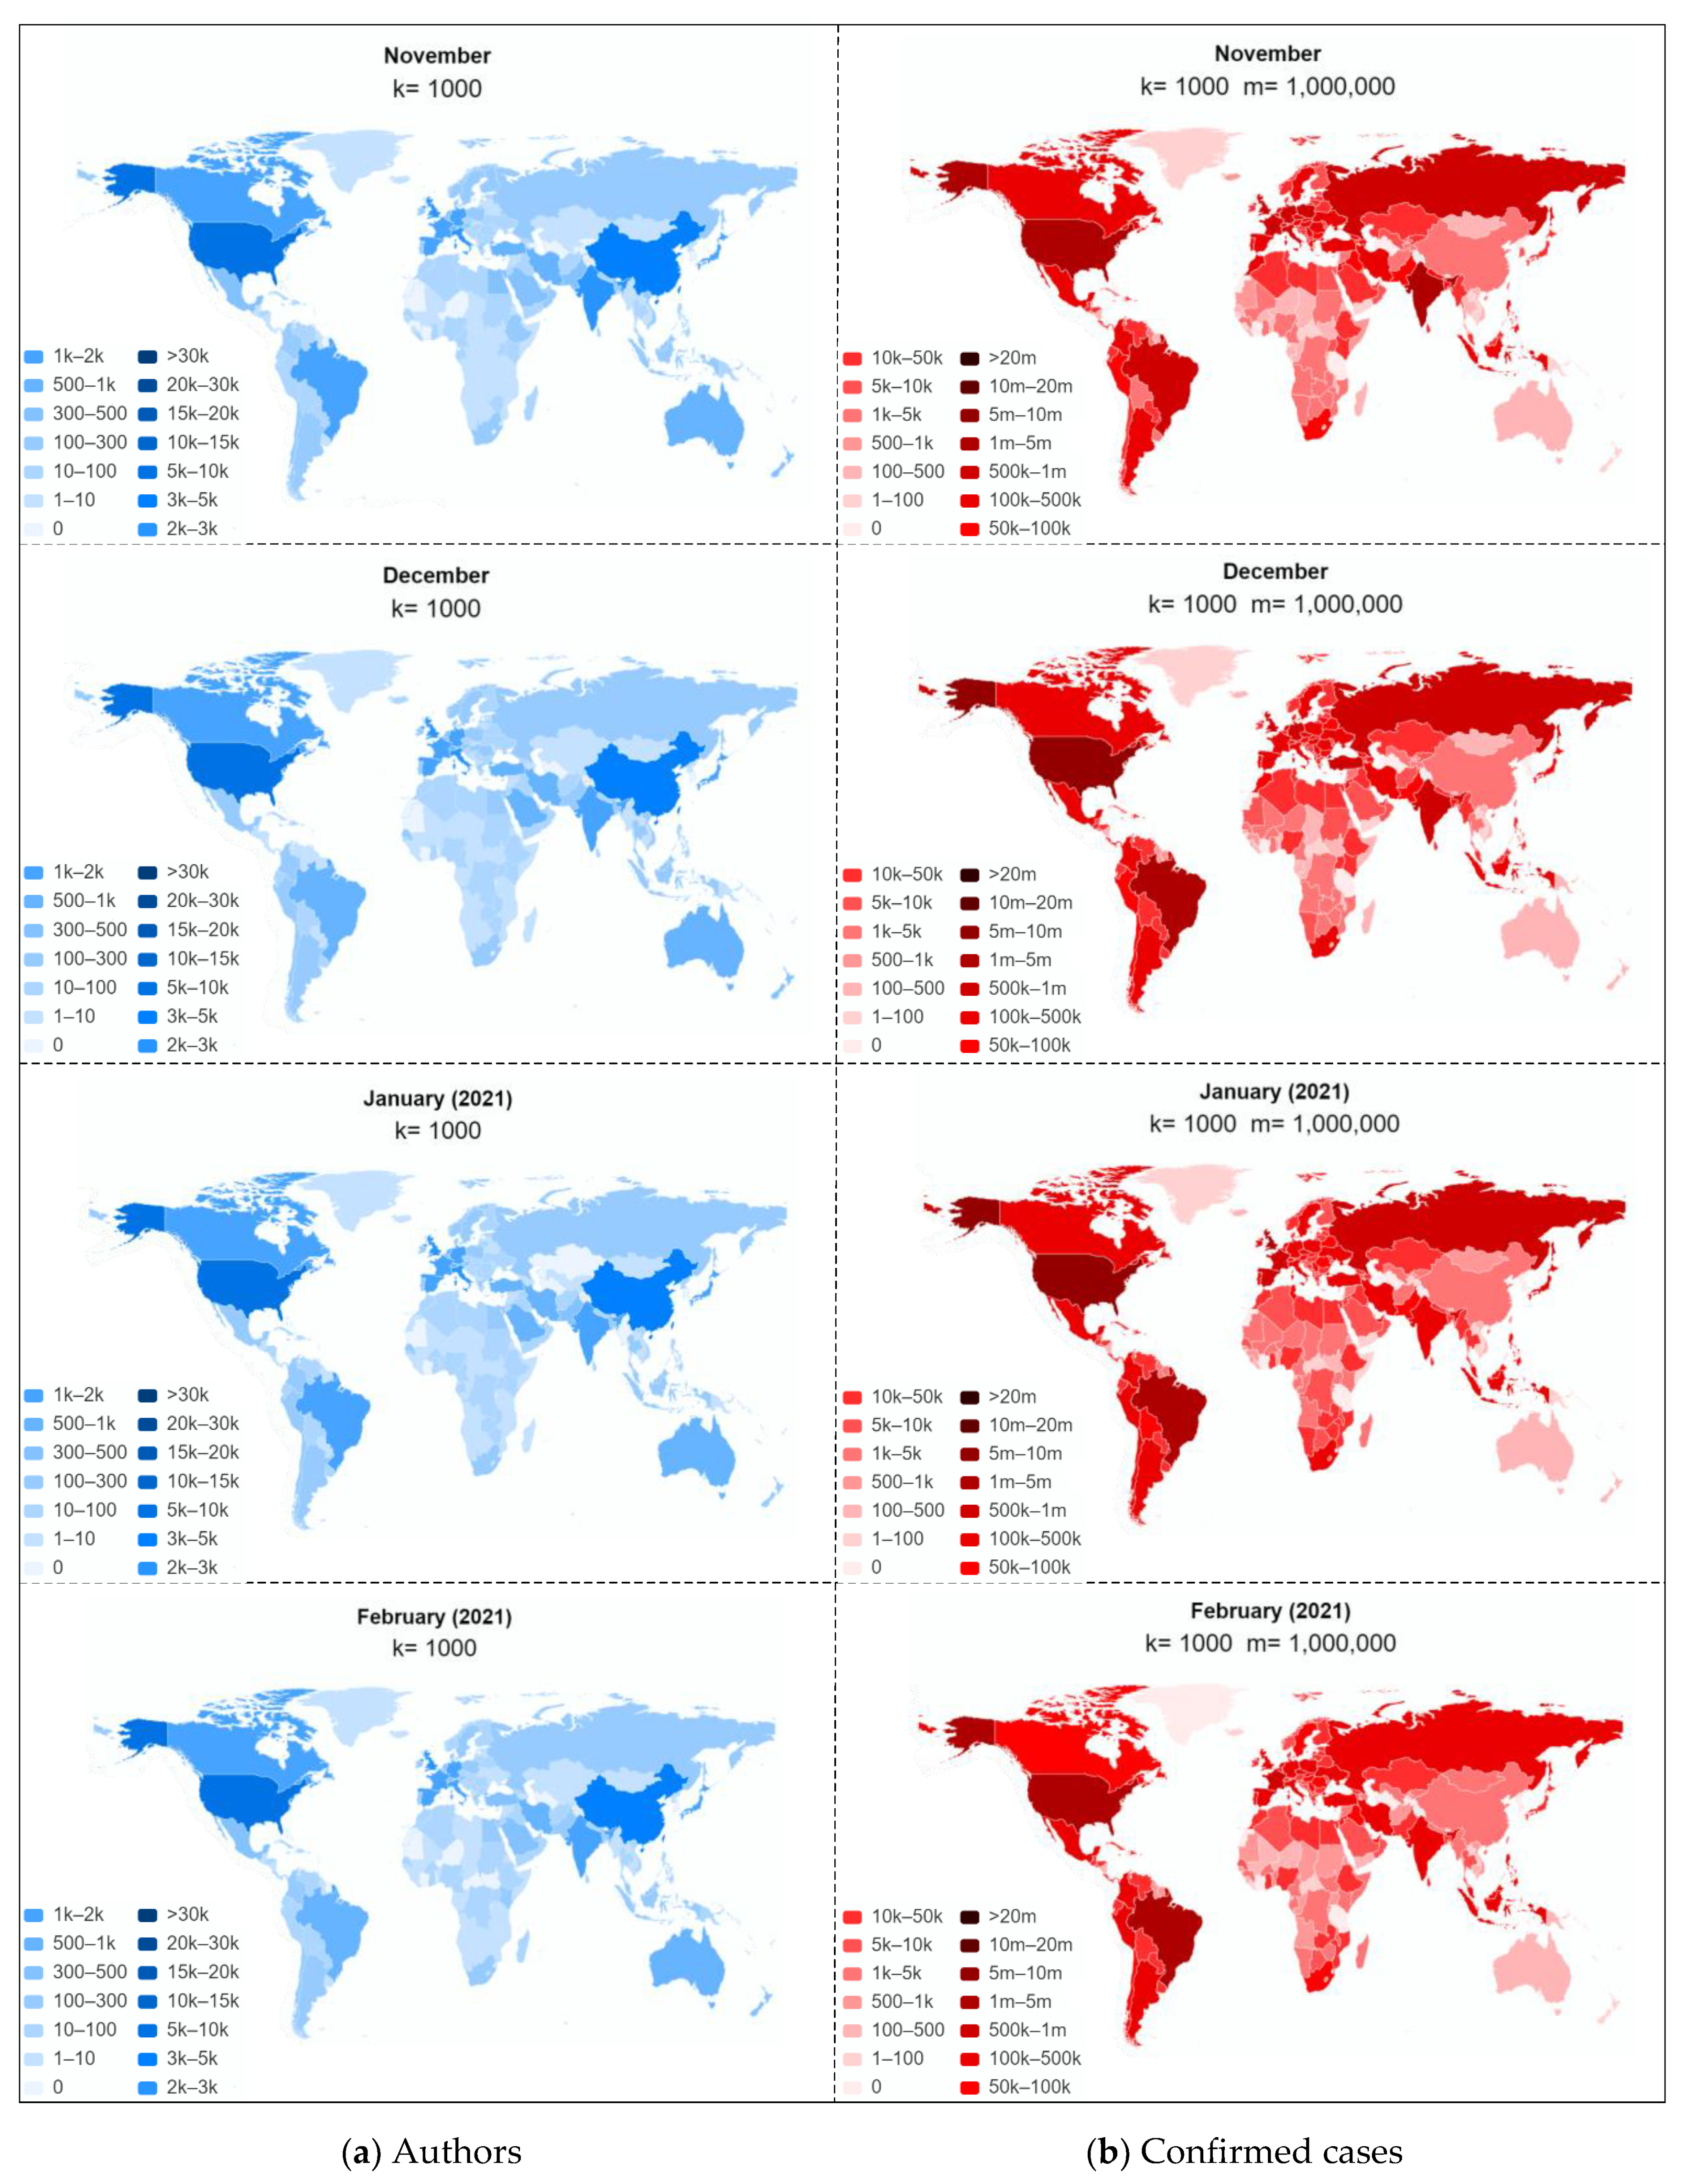
Figure 7 shows the spatial distributions of the number of new confirmed cases and the number of authors of new published papers from January 2020 to February 2021. Only a few scientists from several countries participated in the related research, including China, the United States, the United Kingdom, France, the Netherlands, Australia, Belgium, Brazil, Canada, Switzerland, Italy, and South Korea. As can be seen, in January and February, China had the largest number in terms of both authors and confirmed cases, while those of the United States, Italy, and the United Kingdom were slightly lower than that of China. This is consistent with the fact that the epidemic in this period was concentrated in China. From March, the virus started to spread across the world. The number of new confirmed cases in the United States surpassed that of China, and increasingly more countries began to participate in the related research. However, the country with the largest number of authors remained China until April, which may be because the publication of papers takes more time. In April, the number of authors from the United States began to surpass that of China. In the next ten months, the United States was consistently the country with the largest number of authors, and it also had the largest number of confirmed cases. The number of authors from China, Italy, and the United Kingdom followed those of the United States. Generally, the spatial distributions of these two variables gradually expanded across the globe over time. This not only reflects the spatial correlation between them, but also highlights the correlation between the degree of concern and participation of scientists and the severity of the pandemic in each country.
3.4. Topic Analysis
3.4.1. Analysis of the Extracted Topics by Month
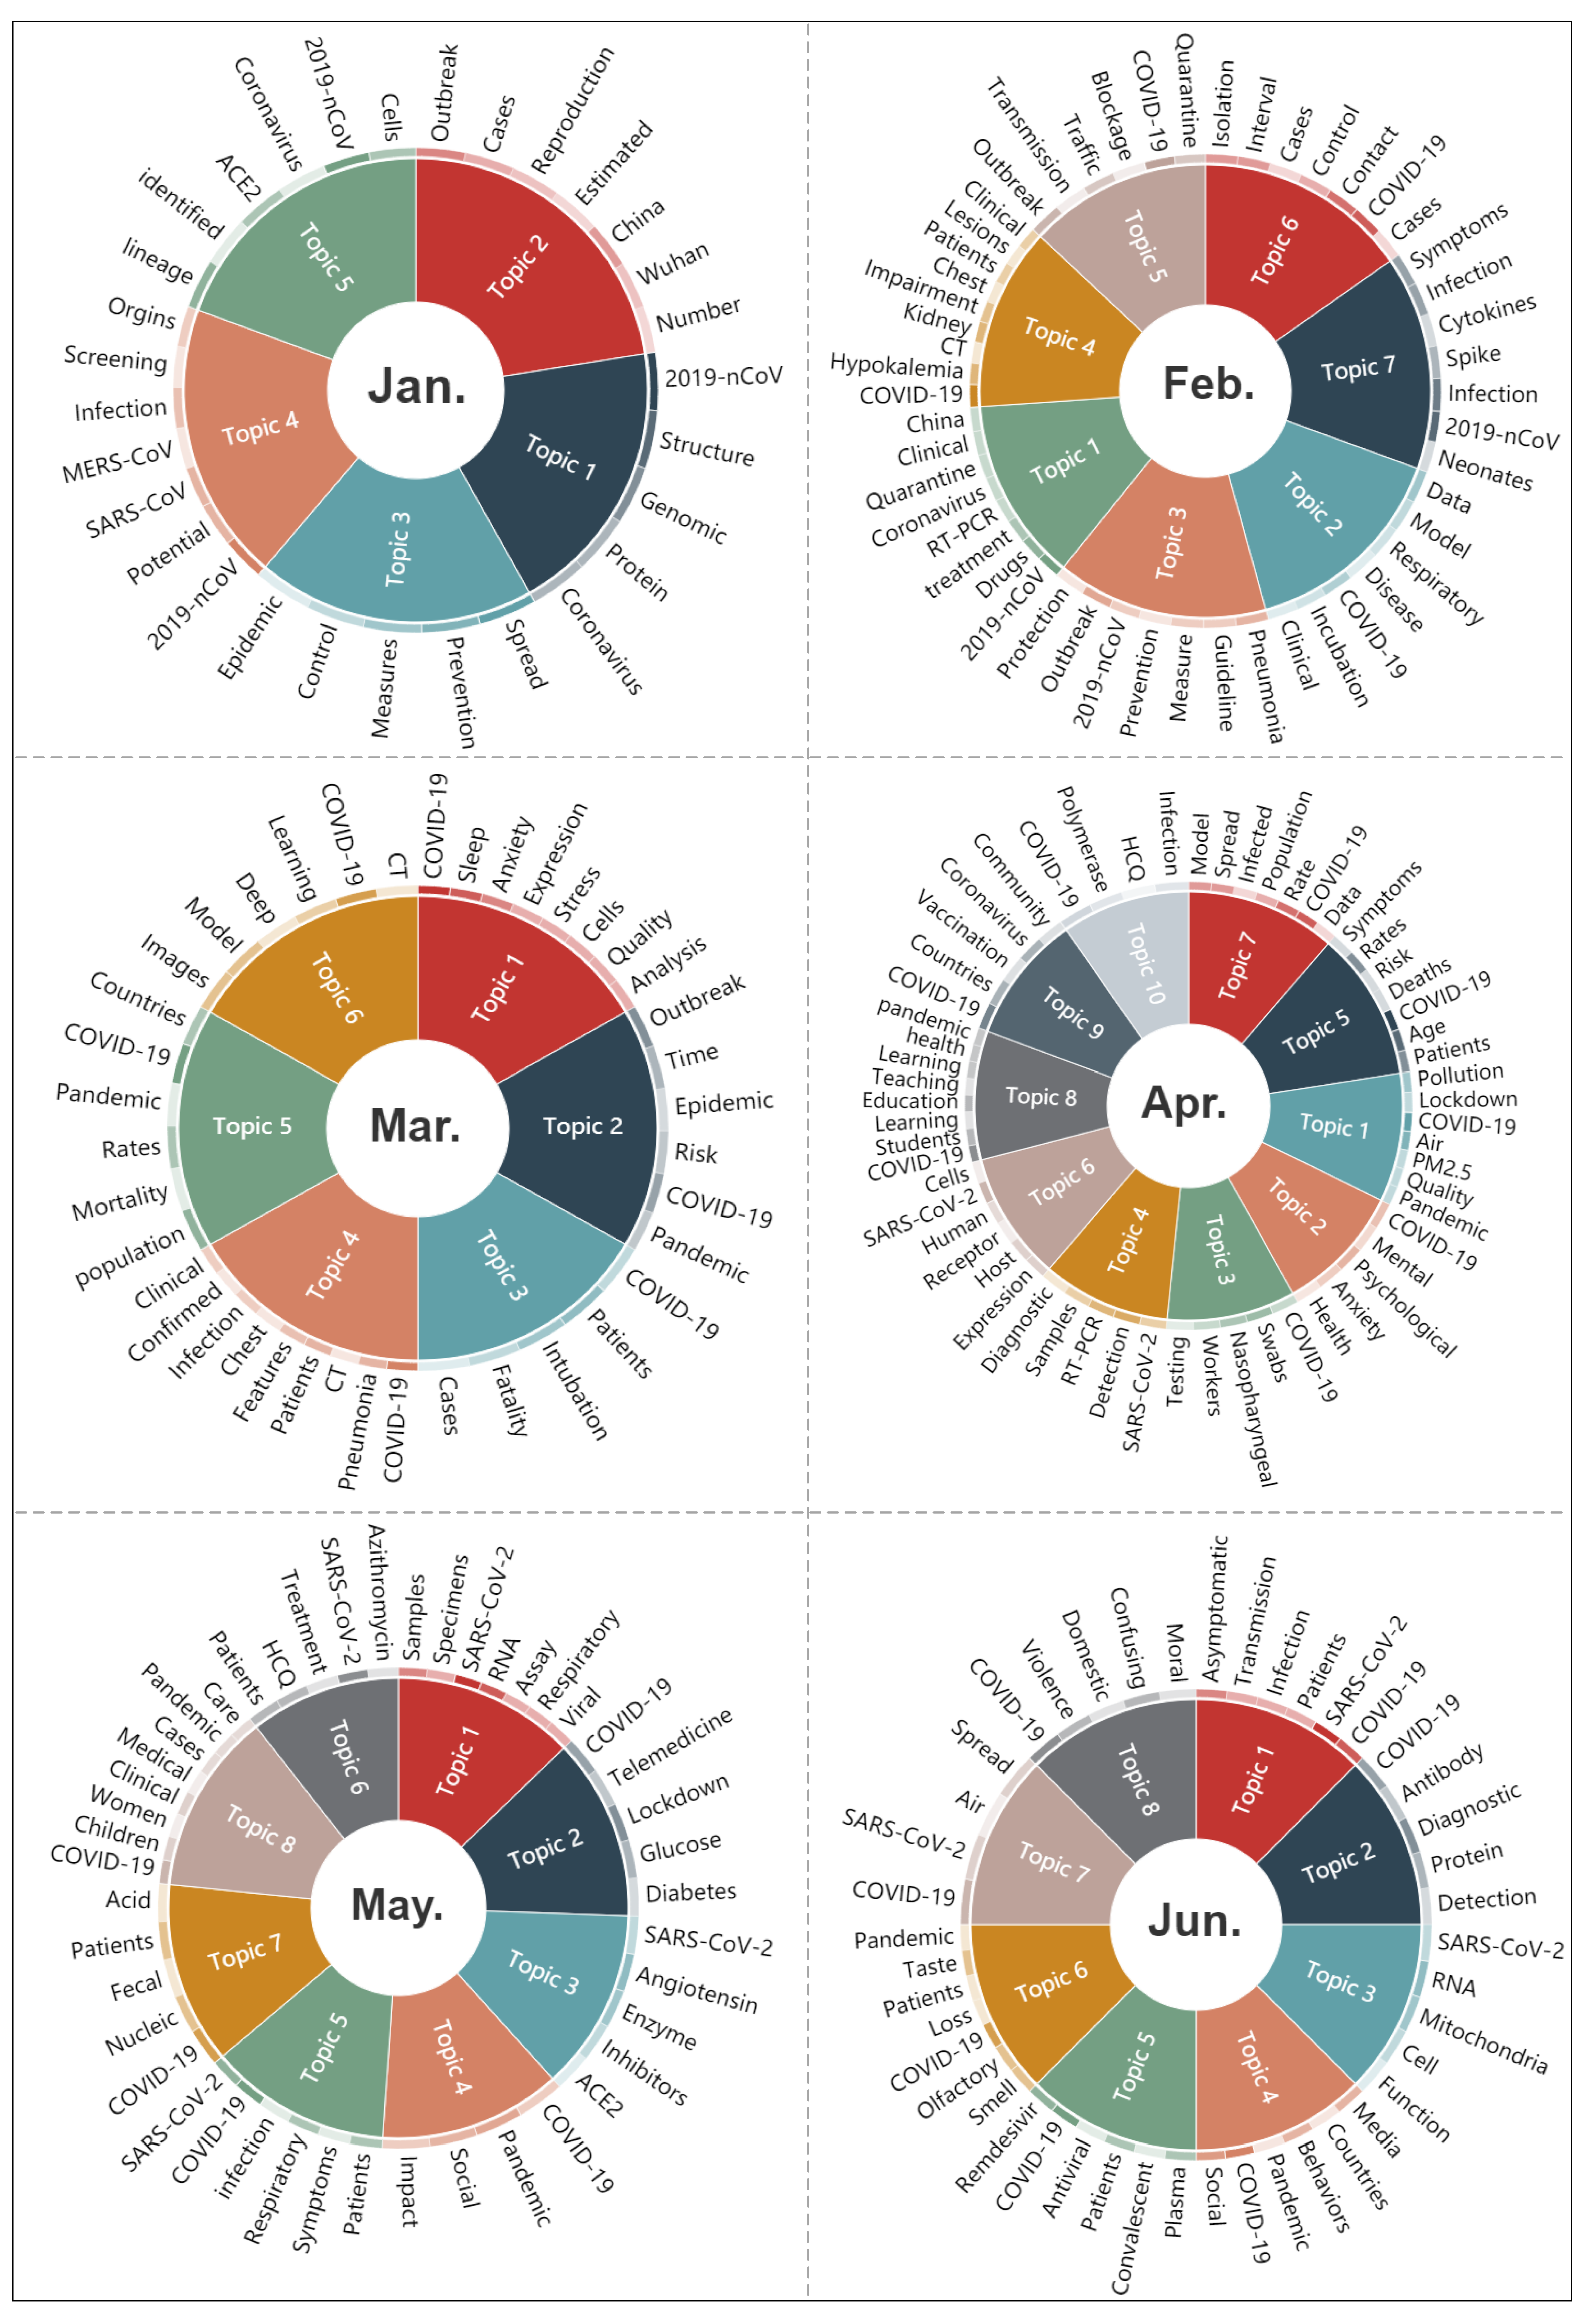
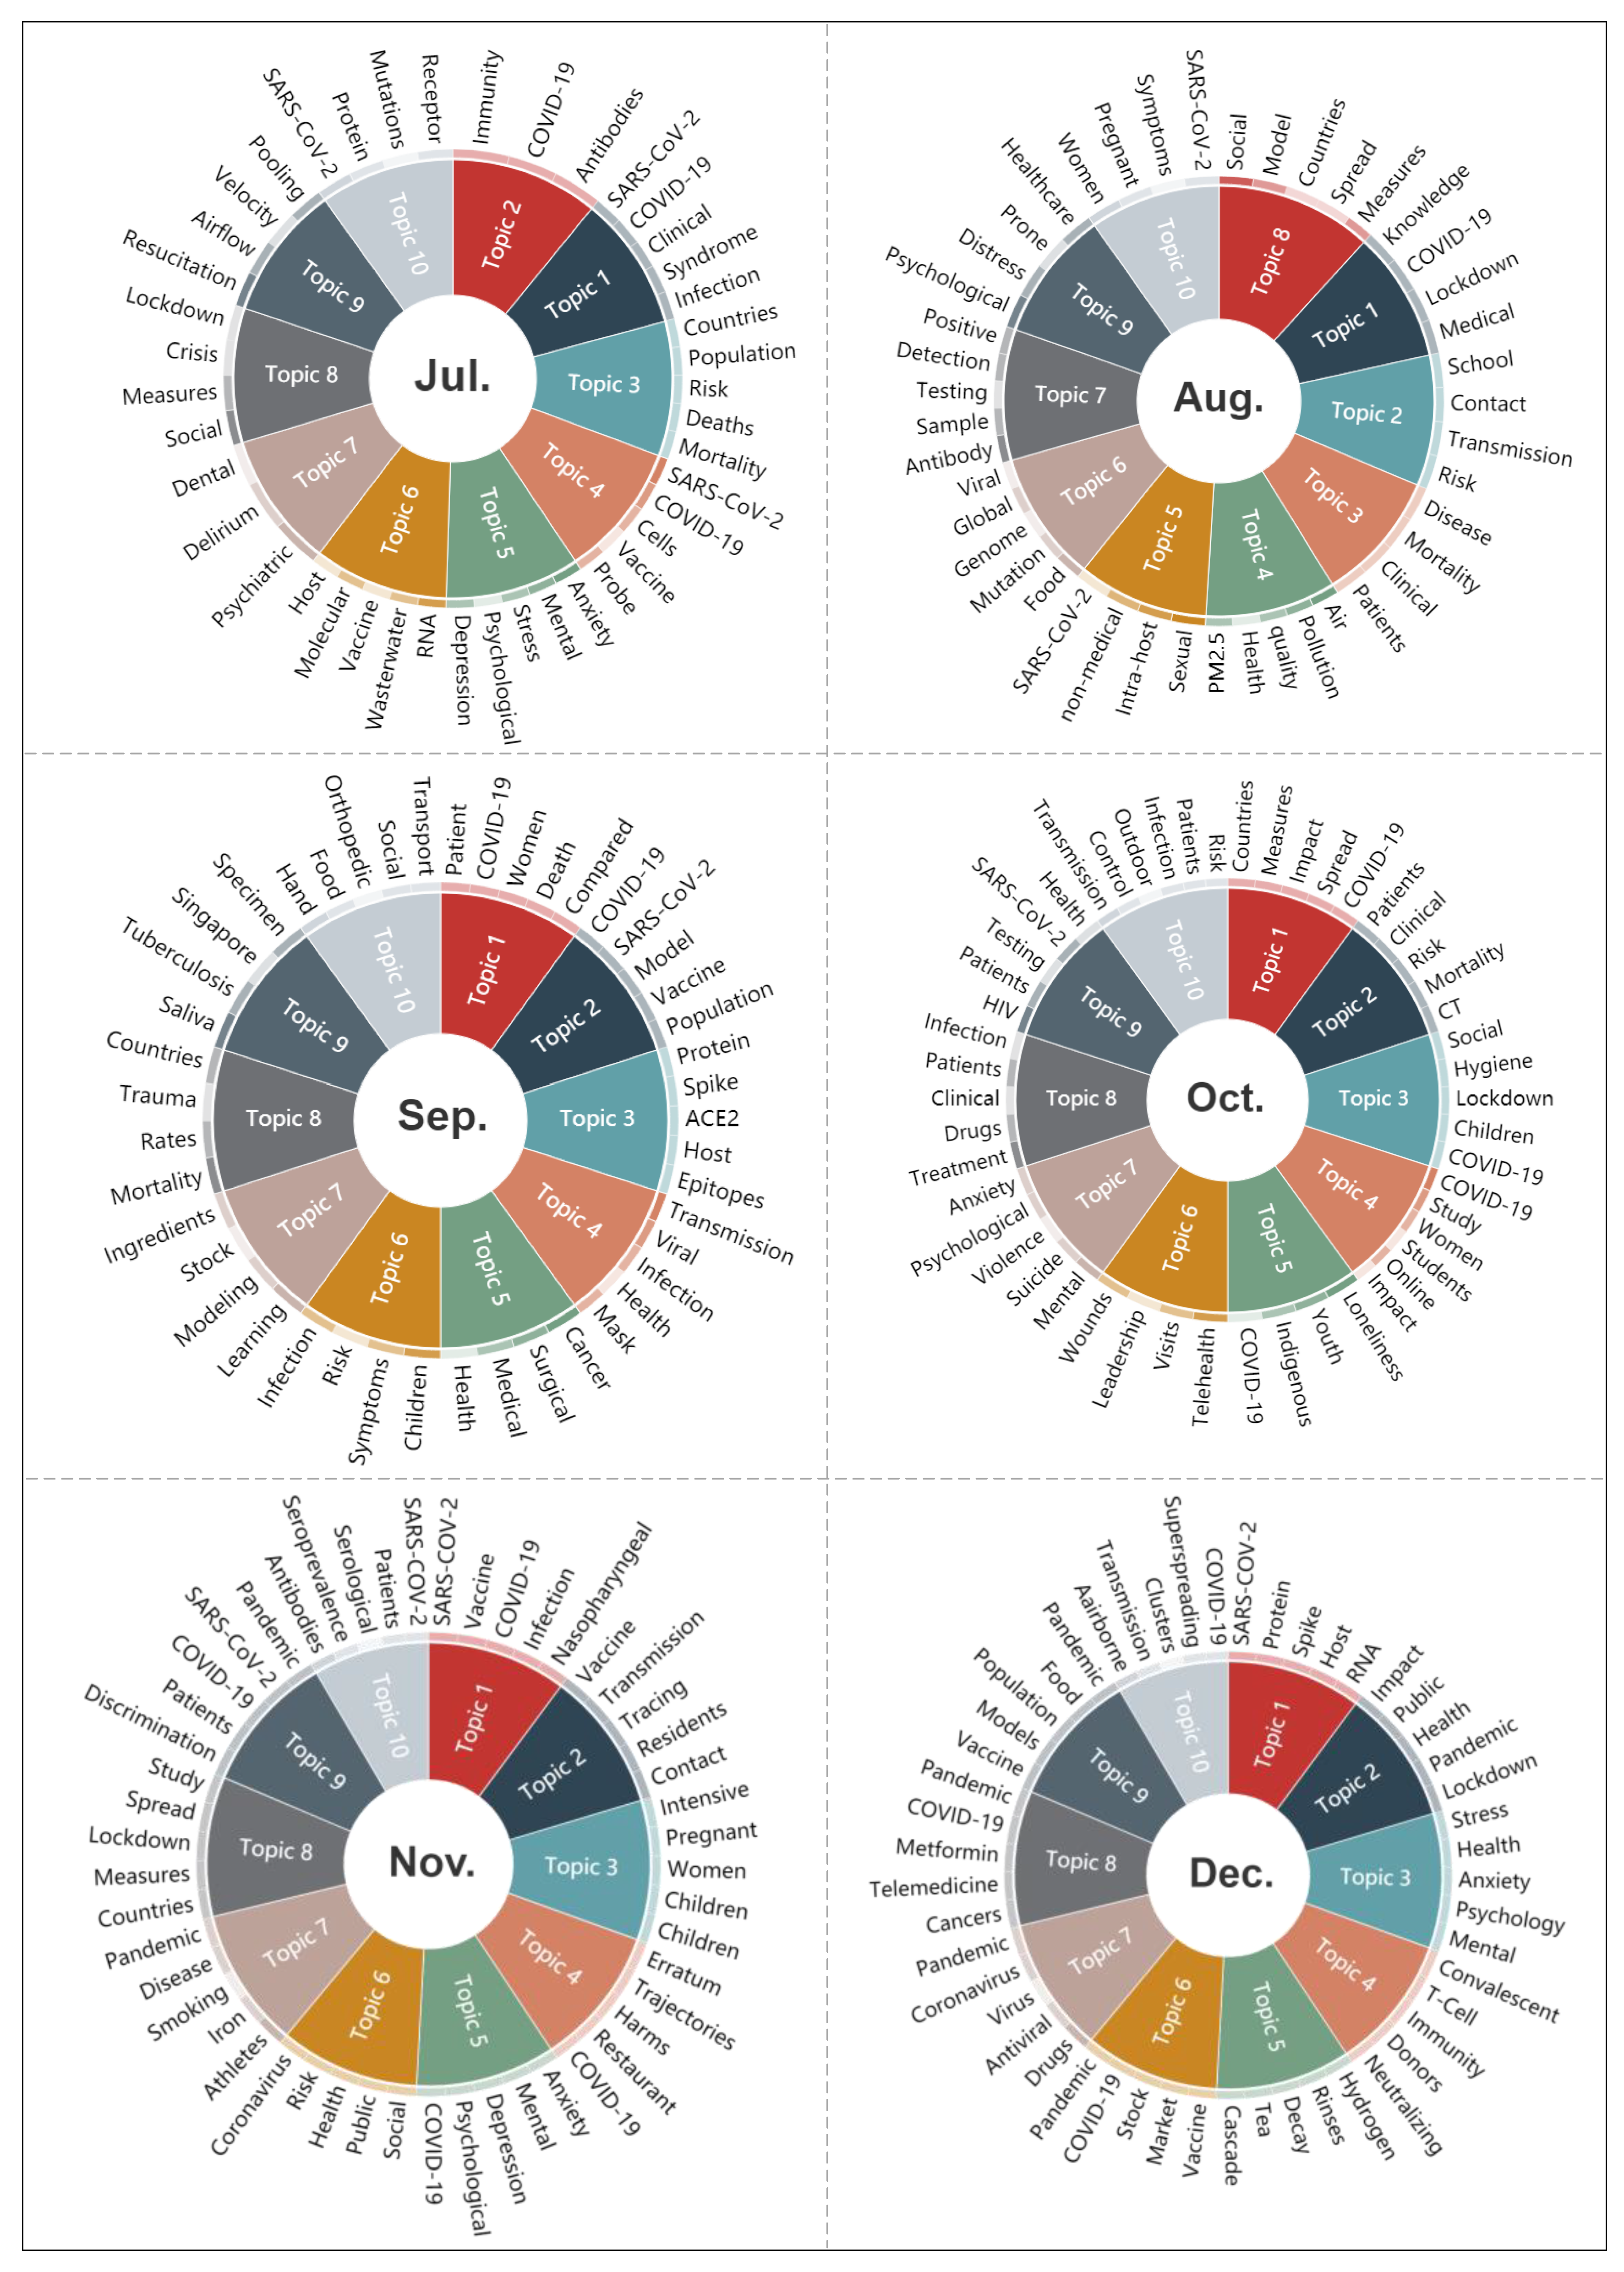
Figure 8 shows the topics and the corresponding vocabularies extracted from the titles and abstracts of papers by month using the LDA topic model. As can be seen, the circles for each month are divided into different numbers of segments with different colors according to the number of extracted topics. The text outside the circles refers to the extracted vocabularies corresponding to each topic. For example, when using the LDA model, the parameter for the number of topics in January was assigned to five (which can be seen in Section 2.2.3), and the text of the titles and abstracts of the papers in January is summarized into five topics using LDA model. Therefore, the circle for January was also divided into five segments, and the corresponding vocabularies are listed outside the circle. Note that due to the limited space, only some of the topics and vocabularies are listed. For example, the LDA model outputs 20 topics for April, but only 10 of them are shown in the figure. From this figure, we can clearly observe the change in the research hotpots with the development of pandemic. At the beginning of this emergency, COVID-19 was unknown to the scientists; thus, the research mainly focused on the exploration of the origin, lineage, and genomic structure of this virus in January. From February, the number of confirmed cases increased gradually, and in order to control and stabilize the epidemic and to save infected patients, scientists began to not only analyze the epidemic status, and discuss guidelines and measures for the prevention and control of the epidemic such as traffic blockage and quarantine, but they also started to study the clinical characteristics, therapeutic method, and drug recommendations. A global pandemic was declared by the WHO in March. In the next four months, in addition to some common medical-related studies, such as the diagnosis and identification of this disease, pathogenesis and drug reactions, asymptomatic patients, vaccine research and development, and the therapeutic effects of existing drugs, some studies in other fields derived from COVID-19 started to become the research focus, such as social media behavior, air quality, mental health, violent conflicts, telemedicine, social problems, etc. The research topics from July 2020 to February 2021 are basically the same as those of the previous months, the difference is that since November last year, a few topics have appeared more frequently, such as related research on vaccine and mental health. Therefore, generally, the research topics changed greatly from January to April, almost covering the majority of all topics during the full 14 months. Since May, the topic changes have been very small.
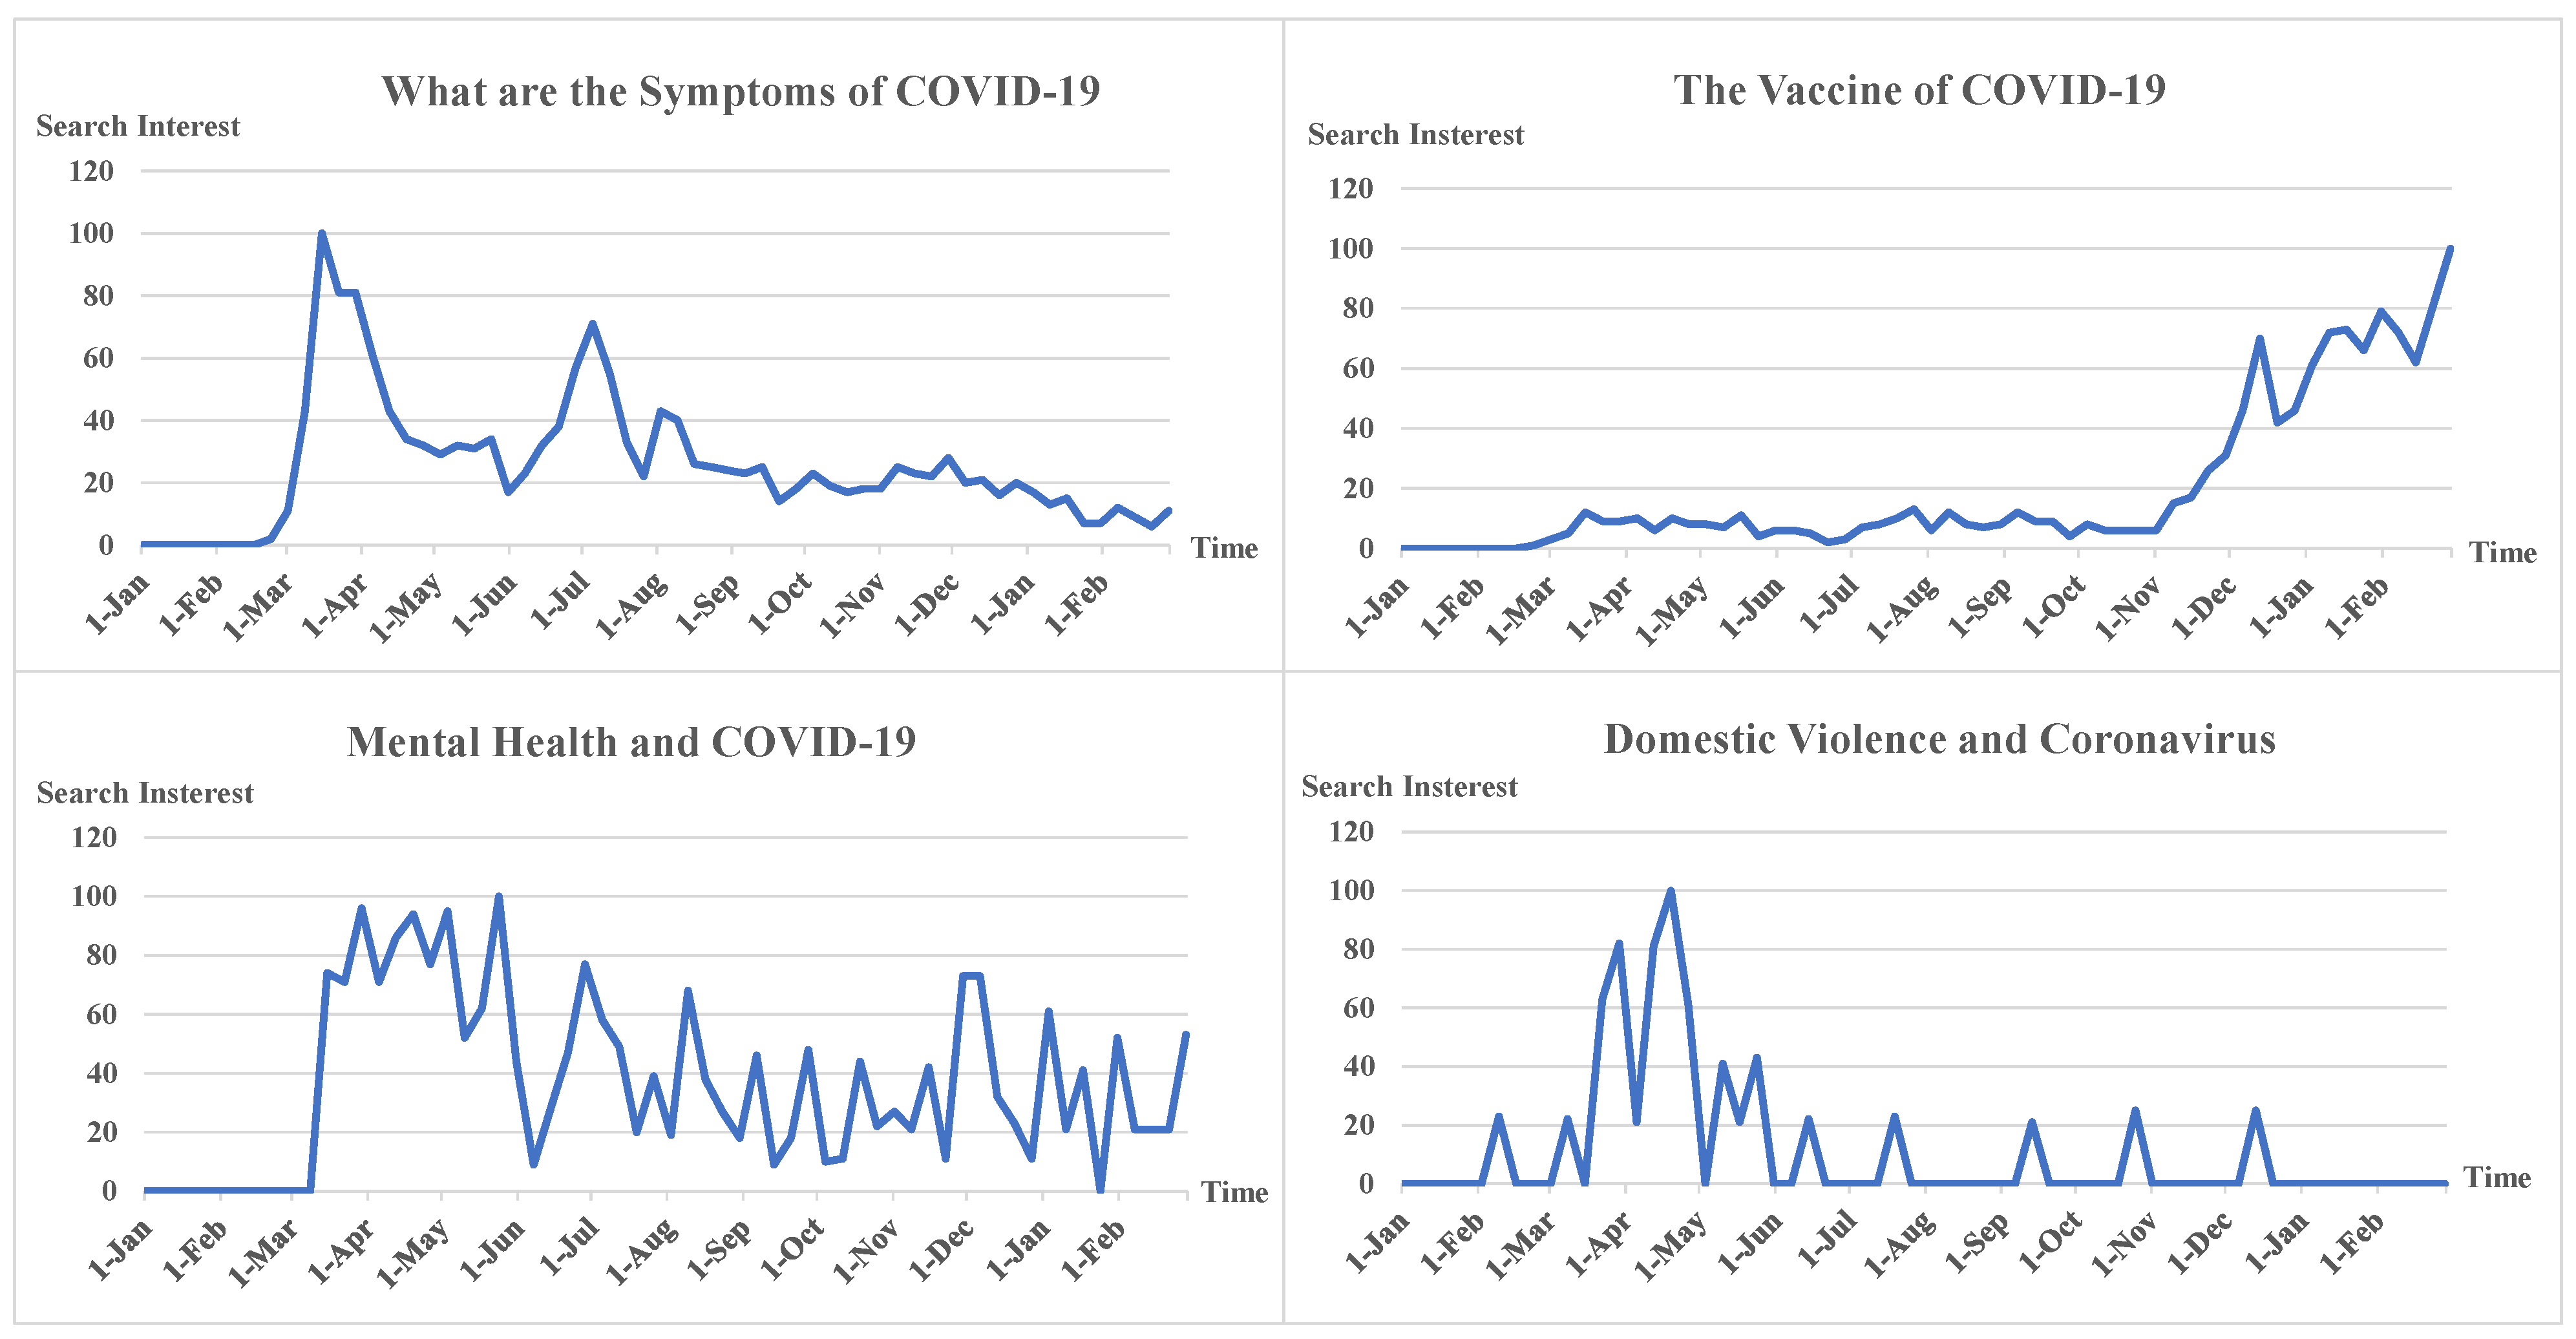
In addition, from Google trends, we obtained the tendency of some popular topics related to COVID-19 within 14 months, such as “what are the symptoms of COVID-19” (topic 1), “vaccine of COVID-19” (topic 2), “domestic violence and coronavirus” (topic 3), and “mental health and COVID-19” (topic 4), which have been shown in Figure 9. By comparison, we can find that the search interest of topic 1 was high in the first six months of the COVID-19 emergency and then lapsed. The search interest of topic 2 was low in the early stage of the emergency of COVID-19 and increased significantly since November. The development trend of these two topics is basically consistent with the research evolution of COVID-19. The search interests of topic 3 and topic 4 began with this pandemic. Although in the following months it declined, it did not fade out completely. It can be seen that there may be a certain number of mental health and domestic violence cases in the real-world, proving the above-mentioned finding that more papers related to mental health and domestic violence were published in the later stage of the COVID-19 pandemic. This further reveals the importance of paying attention to mental health and violence events during the COVID-19 pandemic.
3.4.2. Spatial Analysis of the Topics
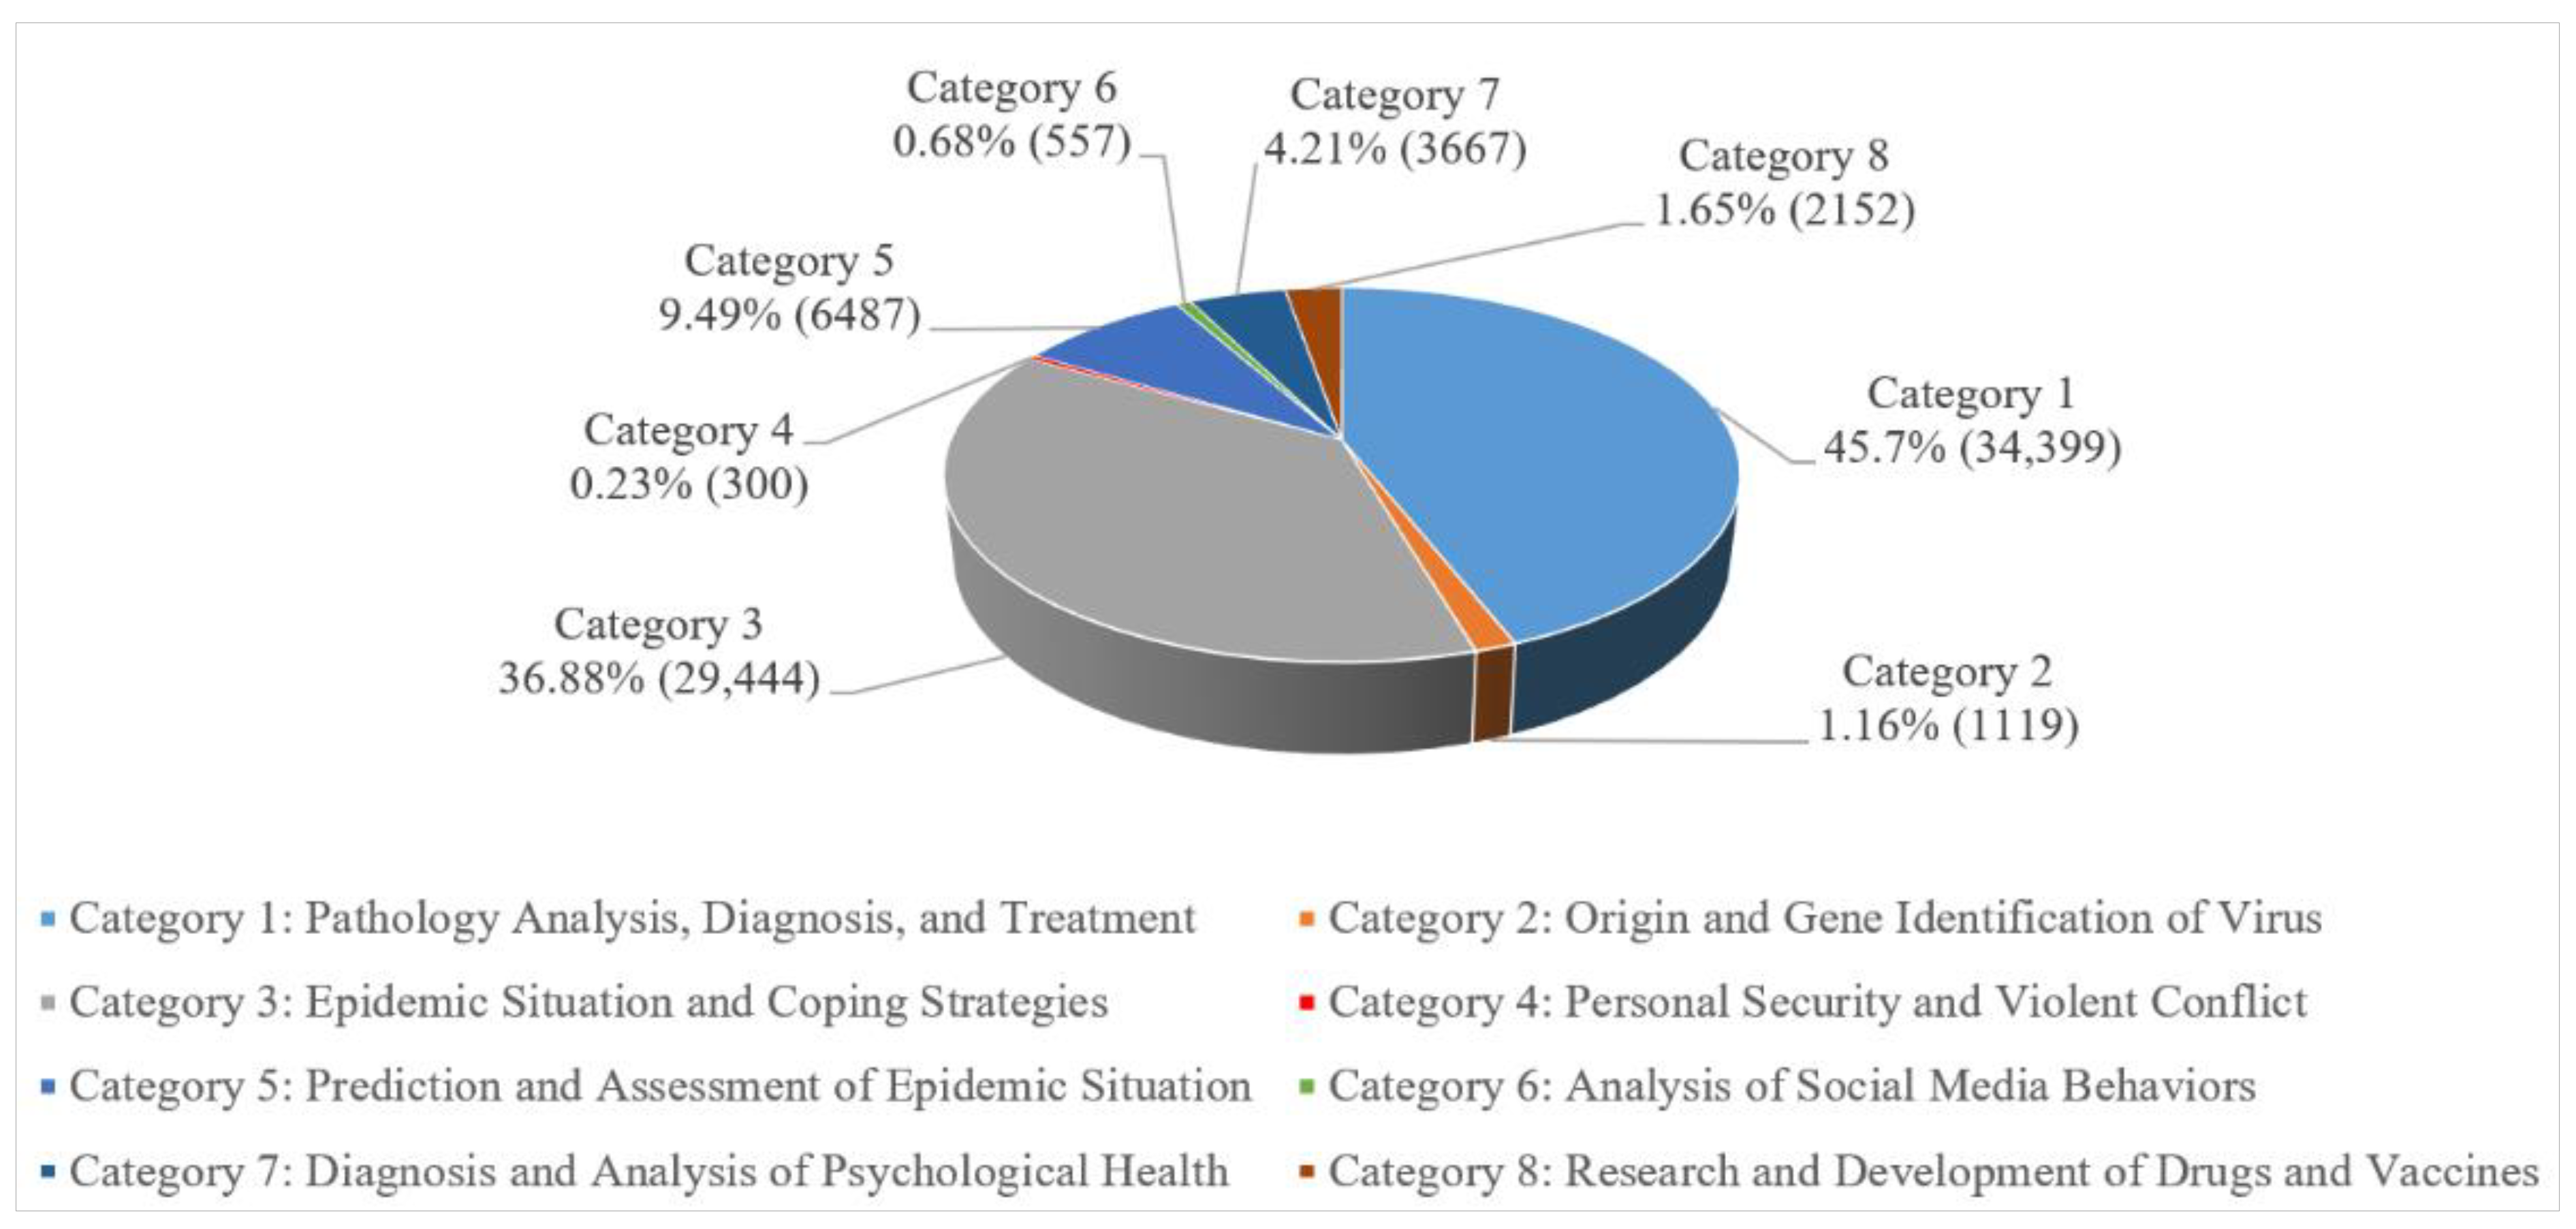
According to the extracted topic vocabularies, we defined eight categories: pathology analysis, diagnosis, and treatment (category 1); origin and gene identification of virus (category 2); epidemic situation and coping strategies (category 3); personal security and violent conflict (category 4); prediction and assessment of epidemic situation (category 5); analysis of social media behaviors (category 6); diagnosis and analysis of psychological health (category 7); and research and development of drugs and vaccines (category 8). With the trained random forests model by the labeled data, papers were classified into the predefined categories. Figure 10 shows the number and the proportions of each category of papers, and Figure 11 presents the spatial distributions of the number of authors that participated in each topic, among the number of participants for each topic is 127,686, 4602, 89,695, 756, 18,217, 1436, 12,904, and 7187, respectively.
As can be seen, the total number of papers belonging to categories 1, 3, and 5 accounted for over 90% of all of the papers, and these three categories also have the largest spatial distribution compared to the other categories. This indicates that these categories of research topic drew the most attention from scientists all over the world. This is understandable from a practical point of view as these topics are most closely related to the actual epidemic. Before vaccination of the general public, pathological analysis, treatment of patients, epidemic prevention, and control measures will still be of the upmost concern, and related publications will continue to be the most useful studies in the fight against the pandemic. The spatial distribution of categories 2 and 8 was also very wide. This may be because these two categories are more effective ways to block the spread of this virus [30,31]. The first way is to determine the origin of this virus and to block it from the source, which requires the studies within category 2. The second way is to study and develop drugs or vaccines against this virus, which is the research focus of category 8. Categories 4 and 7 concern two types of studies derived from the COVID-19 pandemic, which have attracted the attention of the scientists from various countries for two possible reasons. First, due to the severity of the epidemic, many people have to stay at home for a long time, which may lead to depression, irritability, and even serious psychological problems, potentially resulting in domestic violence. Second, first-line medical staff is the group closest to COVID-19, which may also cause psychological problems due to higher risk of infection, such as fear and anxiety. These two issues not only affect the prevention and control effect of pandemic, but may also lead to a threat to social stability if ignored during the pandemic. In addition, although the number of papers in category 6 is very small, and its spatial coverage was also small, social media (such as Twitter, Facebook, and Weibo) provides a valuable platform for the public to receive updates pertaining to the pandemic and to freely express their opinions. Social media can also sometimes provide very important information for epidemic prevention and control. Therefore, category 6 is also worthy of attention. From the perspective of country (Figure 11), the United States, Brazil, China, Australia, and some European countries participated in the studies of each category, which shows that these countries have stronger research capabilities.
4. Discussion
In this study, we proposed and implemented a method for extracting topic and spatial information, and analyzed the research evolution, but there are some limitations. From a methodological point of view, first, although the precision of extracting spatial information (country name) from institutional information is relatively high, there are still some errors. One main type of error is due to incorrectly matching with the gazetteer when the same or similar toponyms exist in more than one country. For example, “University of Oxford” is the name of an institution where “Oxford” is a toponym, but “Oxford” can be matched with multiple toponyms belonging to different countries in the gazetteer of GAMD, such as the United Kingdom, the United States, and New Zealand. We will try to solve this problem using the techniques of toponym resolution, which can help resolve the ambiguity of place names, thereby improving the performance of spatial information extraction. Second, topic extraction can be improved from some perspectives. For example, we may need to include the full text of papers to increase the size of the used corpus, thereby ensuring the extracted topics completely reflect the key idea of the papers, or try to introduce more advanced models, such as word embedding-based topic models and the parallelism technique, so as to improve the accuracy and the efficiency of topic extraction. Third, medical papers account for a large proportion of all the papers in the used dataset. However, we are not experts in the medical field, and we do not exactly understand the knowledge in this field. This may lead to some problems in the subjective classification of the extracted topics in this paper, such as this classification may be too general. We may need to refer to the existing classification standards of medical disciplines or ask for help from medical experts to make a more detailed classification.
From the viewpoint of data analysis, the pandemic situations can be affected by multiple factors, such as the prevention and control measures taken, the degree of population concentration, the level of regional economic development, and the regional climate. Research evolution is also closely related to many factors, such as educational level and economic development level. These factors may further affect the correlation between the development of the pandemic and the studies related to COVID-19. Therefore, we need to further explore the temporal and spatial correlations by considering more factors. For example, instead of analyzing the temporal and spatial correlations simply using the number of papers and the number of confirmed cases, we can compute more measures, such as the normalized value of those numbers based on the population of each country. This may lead to different correlation results. Second, in this paper, we only counted the number of co-authors of each paper by country, which contributes to the analysis of the attention of scientists around the world to COVID-19. We can further assign different weights for co-authors according to the order of authorship in a paper and then analyze the scientific research contributions of different countries in fighting COVID-19.
5. Conclusions
In this study, we first proposed and implemented a method for extracting topic and spatial information from papers related to COVID-19, then comprehensive analyzed the research evolution in response to COVID-19 based on the extracted information and made the following conclusions.
From the temporal perspective, in the three months after the emergency of COVID-19, the number of published papers showed an obvious growth trend, and it showed a relatively stable cyclical trend in the later period, which is basically consistent with the development of COVID-19. In terms of the spatial view, most of the authors who participated in related research are concentrated in the United States, China, Italy, the United Kingdom, Spain, India, and France. At the same time, with the continuous spread of COVID-19 throughout the world, the distribution of the number of authors has gradually been expended, indicating the number of authors is positively correlated with the severity of COVID-19 at spatial scale. From the perspective of topic, the studies related to COVID-19 could be divided into eight categories. At the early stage of COVID-19 emergency, the related research mainly focused on the origin and gene identification of the virus. After the emergency of the pandemic was announced, some derivative studies were added, such as diagnosis and analysis of psychological health, personal security, and violent conflict. These two categories are very important for improving prevention and control capabilities, which is suggested to pay more attention to these research topics. As some categories are most closely related to the control and prevention of the epidemic, such as pathology analysis, diagnosis, and treatment; epidemic situation and coping strategies; and prediction and assessment of epidemic situation. Therefore, in the most of time periods, the majority of studies focused on these three categories. These findings can not only help to fully understand how research is evolving in response to COVID-19, but can also provide an important reference for the scientific community to identify more problems that need to be solved.
In the follow-up work, we will use more advanced techniques to solve the existing problems in our method, such as the disambiguation of toponyms, topic extraction with higher accuracy and efficiency, and finer-grained topic classification. Moreover, we will add new datasets, so as to further explore the relationship between the related research evolution and the pandemic.
Author Contributions
Weirong Li conceived the idea of this study, designed, and conducted the experiment; made the data analysis; and prepared the draft for this paper. Kai Su and Yunqiang Zhu refined the idea and made a further analysis for the results. Jie Yang, Jia Song, Lang Qian and Shu Wang provided some technical support for the methodology implementation. All authors participated in the revision of the manuscript. All authors have read and agreed to the published version of the manuscript.
Funding
This work was supported by the Strategic Priority Research Program of the Chinese Academy of Sciences (grant number XDA23100100) and the National Natural Science Foundation of China (grant numbers 42050101, 41771430, and 41631177).
Data Availability Statement
The datasets used in this paper can be obtained at the following links: https://www.semanticscholar.org/cord19, https://covid19.who.int/table, and http://trends.google.com (accessed on 10 March 2021).
Conflicts of Interest
The authors declare no conflict of interest.
References
- WHO. Coronavirus Disease (COVID-19) Dashboard. 2020. Available online: https://covid19.who.int/ (accessed on 1 March 2021).
- Zhang, Y.; Chen, M.; Liu, L. A Review on Text Mining. In Proceedings of the 2015 6th IEEE International Conference on Software Engineering and Service Science (ICSESS), Beijing, China, 23–25 September 2015; IEEE: New York, NY, USA, 2015; pp. 681–685. [Google Scholar]
- Tan, A.-H. Text mining: The state of the art and challenges. In Proceedings of the Pakdd Workshop on Knowledge Disocovery from Advanced Databases, Beijing, China, 26–28 April 1999. [Google Scholar]
- Wang, Z.; Ye, X.; Tsou, M.H. Spatial, temporal, and content analysis of Twitter for wildfire hazards. Nat. Hazards 2016, 83, 523–540. [Google Scholar] [CrossRef]
- Yin, J.; Lampert, A.; Cameron, M.; Robinson, B.; Power, R. Using Social Media to Enhance Emergency Situation Awareness. IEEE Intell. Syst. 2012, 27, 52–59. [Google Scholar] [CrossRef]
- Blanford, J.I.; Bernhardt, J.; Savelyev, A.; Wong-Parodi, G.; Carleton, A.M.; Titley, D.W.; MacEachren, A.M. Tweeting and tornadoes. In Proceedings of the 11th International ISCRAM Conference, University Park, PA, USA, 18–21 May 2014; pp. 319–323. [Google Scholar]
- Fung, I.C.-H.; Fu, K.-W.; Ying, Y.; Schaible, B.J.; Hao, Y.; Chan, C.-H.; Tse, Z.T.-H. Chinese social media reaction to the MERS-CoV and avian influenza A(H7N9) outbreaks. Infect. Dis. Poverty 2013, 2, 31. [Google Scholar] [CrossRef] [PubMed] [Green Version]
- Chew, C.; Eysenbach, G. Pandemics in the Age of Twitter: Content Analysis of Tweets during the 2009 H1N1 Outbreak. PLoS ONE 2010, 5, e14118. [Google Scholar] [CrossRef] [PubMed]
- Cvetojevic, S.; Hochmair, H.H. Analyzing the spread of tweets in response to Paris attacks. Comput. Environ. Urban Syst. 2018, 71, 14–26. [Google Scholar] [CrossRef]
- Blei, D.M.; Ng, A.Y.; Jordan, M.I. Latent Dirichlet Allocation. J. Mach. Learn. Res. 2003, 3, 993–1022. [Google Scholar]
- Han, X.; Wang, J.; Zhang, M.; Wang, X. Using Social Media to Mine and Analyze Public Opinion Related to COVID-19 in China. Int. J. Environ. Res. Public Health 2020, 17, 2788. [Google Scholar] [CrossRef] [Green Version]
- Ye, X.; Li, S.; Yang, X.; Qin, C. Use of Social Media for the Detection and Analysis of Infectious Diseases in China. ISPRS Int. J. Geo Inf. 2016, 5, 156. [Google Scholar] [CrossRef] [Green Version]
- Liu, Q.; Zheng, Z.; Zheng, J.; Chen, Q.; Liu, G.; Chen, S.; Chu, B.; Zhu, H.; Akinwunmi, B.; Huang, J.; et al. Health Communication Through News Media During the Early Stage of the COVID-19 Outbreak in China: A Digital Topic Modeling Approach. J. Med. Internet Res. 2020, 22, e19118. [Google Scholar] [CrossRef]
- Ebadi, A.; Xi, P.; Tremblay, S.; Spencer, B.; Pall, R.; Wong, A. Understanding the temporal evolution of COVID-19 research through machine learning and natural language processing. Scientometrics 2021, 126, 725–739. [Google Scholar] [CrossRef] [PubMed]
- Älgå, A.; Eriksson, O.; Nordberg, M. Analysis of Scientific Publications During the Early Phase of the COVID-19 Pandemic: Topic Modeling Study. J. Med. Internet Res. 2020, 22, e21559. [Google Scholar] [CrossRef] [PubMed]
- Zhang, Y.; Cai, X.; Fry, C.V.; Wu, M.; Wagner, C. Topic Evolution, Disruption and Resilience in Early COVID-19 Research. SSRN Electron. J. 2020, 10. [Google Scholar] [CrossRef]
- Fan, M.H.; Chen, M.Y.; Liao, E.C. A deep learning approach for financial market prediction: Utilization of Google trends and keywords. Granul. Comput. 2021, 6. [Google Scholar] [CrossRef]
- Wu, G.-C.; Tao, S.-S.; Zhao, C.-N.; Mao, Y.-M.; Wu, Q.; Dan, Y.-L.; Pan, H.-F. Correction: Leveraging Google Trends to investigate the global public interest in rheumatoid arthritis. Rheumatol. Int. 2019, 39, 1445. [Google Scholar] [CrossRef] [Green Version]
- Ayyoubzadeh, S.M.; Zahedi, H.; Ahmadi, M.; Kalhori, S.R.N. Predicting COVID-19 incidence using Google Trends and data mining techniques: A pilot study in Iran (Preprint). JMIR Public Health 2020, 6. [Google Scholar] [CrossRef]
- Ngoc, H.N.; Kriengsinyos, W. Impacts of COVID-19 Pandemic and Its Lockdown on Global Eating Behavior: A Google Trends Analysis. Preprints 2020. [Google Scholar] [CrossRef]
- Activewizards. Comparison of Top 6 Python NLP Libraries. 2018. Available online: https://www.kdnuggets.com/2018/07/comparison-top-6-python-nlp-libraries.html (accessed on 1 March 2021).
- Breiman, L. Random forest. Mach. Learn. 2001, 45, 5–32. [Google Scholar] [CrossRef] [Green Version]
- Pal, M. Random forest classifier for remote sensing classification. Int. J. Remote. Sens. 2005, 26, 217–222. [Google Scholar] [CrossRef]
- Dong, Y.; Du, B.; Zhang, L. Target Detection Based on Random Forest Metric Learning. IEEE J. Sel. Top. Appl. Earth Obs. Remote Sens. 2015, 8, 1830–1838. [Google Scholar] [CrossRef]
- Islam, M.Z.; Liu, J.; Li, J.; Liu, L.; Kang, W. A Semantics Aware Random Forest for Text Classification. In Proceedings of the 28th ACM International Conference, Beijing, China, 3–7 November 2019. [Google Scholar]
- Griffiths, T.L.; Steyvers, M. Finding scientific topics. Proc. Natl. Acad. Sci. USA 2004, 101, 5228–5235. [Google Scholar] [CrossRef] [Green Version]
- Buda, A.; Jarynowski, A. Life Time of Correlations and Its Applications; ABRASCO—Associação Brasileira de Saúde Coletiva: Rio de Janeiro, Brazil, 2010; Volume 1. [Google Scholar]
- Kendall, M. A New Measure of Rank Correlation. Biometrika 1938, 30, 81–89. [Google Scholar] [CrossRef]
- Baezayates, R.; Ribeironeto, B. Modern Information Retrieval; ACM Press: New York, NY, USA, 1999. [Google Scholar]
- Sujin, L.; Trang, N.M. Recent Advances of Vaccine Adjuvants for Infectious Diseases. Immune Netw. 2015, 15, 51–57. [Google Scholar] [CrossRef] [Green Version]
- Hayashi, T.; Yaegashi, N.; Konishi, I. COVID-19 era, Preventive effect of no going out against co-infection of the seasonal influenza virus and SARS-CoV-2. Medrxiv 2020. [Google Scholar] [CrossRef]
Figure 1.
The process of extracting spatial information.

Figure 2.
The process of topic extraction and classification.

Figure 3.
The curves of the comparison between the cumulative number of confirmed cases and the cumulative number of papers. The mark of * in this figure denotes year of 2021.
Figure 3.
The curves of the comparison between the cumulative number of confirmed cases and the cumulative number of papers. The mark of * in this figure denotes year of 2021.

Figure 4.
The curves of the comparison between the number of new confirmed cases and the number of new published papers at the monthly level. The mark of * in this figure denotes year of 2021.
Figure 4.
The curves of the comparison between the number of new confirmed cases and the number of new published papers at the monthly level. The mark of * in this figure denotes year of 2021.

Figure 5.
The curve of the comparison between the number of new confirmed cases and the number of new published papers at the daily level.
Figure 5.
The curve of the comparison between the number of new confirmed cases and the number of new published papers at the daily level.

Figure 6.
The spatial distributions of (a) the cumulative number of authors and (b) the cumulative number of confirmed cases.
Figure 6.
The spatial distributions of (a) the cumulative number of authors and (b) the cumulative number of confirmed cases.

Figure 7.
The comparison of the spatial distributions at the monthly level: (a) the number of authors and (b) the number of confirmed cases.
Figure 7.
The comparison of the spatial distributions at the monthly level: (a) the number of authors and (b) the number of confirmed cases.


Figure 8.
The extracted topics from the papers by month (due to the limited space, only some of the topics and vocabularies are listed). The mark of * in this figure denotes year of 2021.
Figure 8.
The extracted topics from the papers by month (due to the limited space, only some of the topics and vocabularies are listed). The mark of * in this figure denotes year of 2021.


Figure 9.
The curve of the search interest changing over time in Google Trends.

Figure 10.
The pie chart of proportions of each category of papers.

Figure 11.
The spatial distribution of the number of authors that participated in each topic.


Table 1.
The performance of the spatial information extraction.
| Metrics | Calculation Result | |||
|---|---|---|---|---|
| P | 5599 | 167 | 401 | 97.1% |
| R | 93.3% | |||
| F1 | 95.2% |
Table 2.
The performance of the topic classification.
| Metrics | Calculation Result | |||
|---|---|---|---|---|
| P | 4883 | 1117 | 1117 | 81.3% |
| R | 81.3% | |||
| F1 | 81.3% |
Table 3.
Correlation between the cumulative number of confirmed cases and the cumulative number of papers.
Table 3.
Correlation between the cumulative number of confirmed cases and the cumulative number of papers.
| Variables | Rs | p | |
|---|---|---|---|
| The cumulative number of confirmed cases | The cumulative number of papers | 1 | 0 |
Table 4.
Correlation between the number of new confirmed cases and the number of new published papers at the monthly level.
Table 4.
Correlation between the number of new confirmed cases and the number of new published papers at the monthly level.
| Variables | RS | p | |
|---|---|---|---|
| The number of new confirmed case | The number of new published paper | 0.89 | 2.5 × 10⁻⁵ |
Table 5.
Correlation between the number of new confirmed cases and the number of new published papers at the daily level.
Table 5.
Correlation between the number of new confirmed cases and the number of new published papers at the daily level.
| Variables | RS | p | |
|---|---|---|---|
| The number of new confirmed cases | The number of new published papers | 0.67 | 2.17 × 10−57 |
Table 6.
Correlation between the cumulative number of confirmed cases and the cumulative number of authors by country.
Table 6.
Correlation between the cumulative number of confirmed cases and the cumulative number of authors by country.
| Variables | RS | p | |
|---|---|---|---|
| The cumulative number of confirmed case | The cumulative number of authors | 0.76 | 1.52 × 10−43 |
Table 7.
The cumulative number (>500) of authors by country.
| Country | Author | Country | Author | Country | Author |
|---|---|---|---|---|---|
| United States | 58,146 | South Korea | 2475 | Chile | 1017 |
| China | 29,011 | Belgium | 2191 | Colombia | 978 |
| Italy | 18,348 | Singapore | 1974 | Poland | 899 |
| United Kingdom | 17,880 | Israel | 1810 | Argentina | 898 |
| Spain | 11,214 | Pakistan | 1787 | Indonesia | 879 |
| India | 11,132 | Mexico | 1774 | Malaysia | 871 |
| France | 11,130 | Egypt | 1705 | Qatar | 758 |
| Germany | 8811 | New Zealand | 1684 | United Arab Emirates | 697 |
| Canada | 7906 | Greece | 1641 | Norway | 675 |
| Japan | 7078 | Sweden | 1485 | Peru | 637 |
| Brazil | 6434 | Austria | 1412 | Nigeria | 616 |
| Australia | 5513 | Portugal | 1328 | Thailand | 581 |
| Iran | 4917 | South Africa | 1276 | Jamaica | 579 |
| Netherlands | 3231 | Denmark | 1268 | Vietnam | 563 |
| Turkey | 3193 | Ireland | 1251 | Romania | 520 |
| Switzerland | 3149 | Bangladesh | 1202 | - | <500 |
| Saudi Arabia | 2763 | Russia | 1038 | - | - |
Publisher’s Note: MDPI stays neutral with regard to jurisdictional claims in published maps and institutional affiliations. |
© 2021 by the authors. Licensee MDPI, Basel, Switzerland. This article is an open access article distributed under the terms and conditions of the Creative Commons Attribution (CC BY) license (https://creativecommons.org/licenses/by/4.0/).
Share and Cite
MDPI and ACS Style
Li, W.; Sun, K.; Zhu, Y.; Song, J.; Yang, J.; Qian, L.; Wang, S. Analyzing the Research Evolution in Response to COVID-19. ISPRS Int. J. Geo-Inf. 2021, 10, 237. https://doi.org/10.3390/ijgi10040237
AMA Style
Li W, Sun K, Zhu Y, Song J, Yang J, Qian L, Wang S. Analyzing the Research Evolution in Response to COVID-19. ISPRS International Journal of Geo-Information. 2021; 10(4):237. https://doi.org/10.3390/ijgi10040237
Chicago/Turabian StyleLi, Weirong, Kai Sun, Yunqiang Zhu, Jia Song, Jie Yang, Lang Qian, and Shu Wang. 2021. "Analyzing the Research Evolution in Response to COVID-19" ISPRS International Journal of Geo-Information 10, no. 4: 237. https://doi.org/10.3390/ijgi10040237
Note that from the first issue of 2016, this journal uses article numbers instead of page numbers. See further details here.