
The Intra-EU Value Chain: An Approach to Its Economic Dimension and Environmental Impact


ICEDE Research Group, Departamento de Economía Aplicada, Universidade de Santiago de Compostela, Praza do Obradoiro, 0, 15705 Santiago de Compostela, A Coruña, Spain
*
Author to whom correspondence should be addressed.
Economies 2021, 9(2), 54; https://doi.org/10.3390/economies9020054
Submission received: 20 February 2021
/
Revised: 26 March 2021
/
Accepted: 31 March 2021
/
Published: 7 April 2021
Abstract
:This paper aims to analyze the economic dimension and environmental impact of intra-EU value-added generation linked to global value chains (GVCs) through input-output analysis. For this purpose, information has been collected from TiVA (Trade in Value Added, OECD) and Eora databases for the years 2005 and 2015. From an economic perspective, the results point to a strengthening of the value-added generated within Factory Europe. From an environmental perspective, all EU28 members have reduced their exports-related impacts in intensity-emissions terms, but not all of them in the same degree. An approach to the environmental Kuznets curve (EKC) has also been carried out through a panel data model. The results show a positive impact of the participation in intra-EU value chain (Factory Europe) on CO2 emissions per capita. Further, an inverted U-shaped curve for CO2 emissions is found for the period 2005–15. In this sense, European economies with lower development levels (many Eastern and Southern countries) seem to be still on the rising segment of the curve, while the more developed ones seem to be on the decreasing segment. These results highlight the need to design global monitoring and prevention mechanisms to tackle growing environmental challenges and the need to incorporate specific actions associated with the GVCs activity.
1. Introduction
Throughout the world, society is increasingly aware of environmental problems and the need to adopt changes leading to a more sustainable way of life. In response to this need, governments have implemented various measures to address environmental issues. On a global scale, the United Nations agreed in 2015 on a plan to progress towards 17 sustainable development goals (SDGs), under the 2030 Agenda for Sustainable Development. In this respect, the environmental dimension is present in several of these SDG targets.
Furthermore, the European Union (EU) is promoting the so-called circular economy (CE) strategy with the aim of minimising the generation of waste and making the best use of the available resources. In fact, since 2015 various CE measures have been proposed and implemented. However, none of them mentions the impact of international fragmentation of production on the environment despite the relevance of production linkages within the so-called Factory Europe, especially between EU members. Indeed, it is noteworthy that in the EU integration process intra-regional trade flows have always been much more intense than the extra-regional ones.
Concerning international economy, the role of global value chains (GVCs) is particularly relevant as a way of organising production processes, not only by fragmenting them into different stages, but also by locating these stages in different countries. However, as Baldwin (2006, 2012) suggests, the term “global” is relative since many of these value chains tend to have a strong regional orientation.
According to this author, there are three large commercial regions in the World, namely Factory Europe, Factory Asia, and Factory America. Among these, Factory Europe is the most intensive in terms of intra-regional trade. In this regard, EU enlargements have usually been accompanied not only by an intensification of intra-EU trade but also by processes of intra-EU industrial relocation, as in the last 15 years with the Central and Eastern European Countries (CEECs) (Fritsch and Matthes 2017). It should be noted that while extra-EU exports of goods and services accounted for more than 14% of global exports in 2019, intra-EU exports accounted for more than 17% (Data extracted from the World Trade Organization database).
Furthermore, participation in GVC also generates innovation processes due to the need of being competitive in international markets. A potential innovation pathway related to GVCs is the so-called environmental upgrading, which is defined as any improvement implemented by a firm that reduces its emissions and energy consumption.
Therefore, it is necessary to include the environmental effects of intra-EU value creation processes related to GVCs participation in policies oriented to the promotion of the CE. This would allow a better assessment of these programmes and the consideration of measures to reduce the impact of trade on the environment. In this sense, the input–output (IO) methodology is useful for analyzing the environmental impact of trade.
The aim of this paper is to analyze the economic dimension and environmental impact of the intra-EU value-added linked to GVCs by using an IO approach (value-added trade perspective). This approach focuses on the intra-EU value chain linked to both extra-EU and intra-EU exports. In this respect, the main research subject is twofold. Firstly, to analyze the changes in the EU28 fragmentation of production, with a special focus on the Central and Eastern European enlargement. Here, the underlying hypothesis concerns the economic dimension and the evolution of the intra-EU value chain. In this sense, the paper aims to test whether this regional value chain has strengthened in the analyzed period (2005–15), when the integration of Eastern European countries took place.
Secondly, the paper aims to analyze the environmental impact associated with the intra-EU value-added creation processes along the regional value chain (Factory Europe). Here, the underlying hypothesis concerns the differences between the economic dimension (economic development; value-added exports) and environmental impact (CO2 emissions) of the intra-EU value chain participation of European countries. In this respect, the paper aims to verify the existence of asymmetries between these two perspectives in view of some theoretical approaches, providing new insights and evidence to the economy-environment link.
In this sense, the main novelty of this paper is to bring a double perspective to the study of the environmental impact of intra-EU trade flows. First, it focuses on value-added flows linked to the intra-EU fragmentation of production through the analysis of forward GVC participation. Second, it addresses the analysis of emissions associated with intra-regional flows in an advanced context of economic integration.
In order to address these issues, an analysis of intra-EU value-added generation from a GVC approach (forward GVC participation) is carried out using IO methodology with environmental extension for the years 2005 and 2015. The selection of the year 2005 is justified by the fact that most CEECs joined the EU from 2004 onwards. In addition, a panel data estimation is performed in order to verify the fulfilment of the environmental Kuznets curve hypothesis. The statistical information used comes from Eora26 database, a multiregional IO (MRIO) model that includes 186 countries and 26 homogeneous sectors for all of them. Moreover, TiVA (Trade in Value Added, and Organization for Economic Co-operation and Development (OECD)) database is used to address specific trade issues in terms of value-added. Data collected at the World Bank (population, and GDP deflator) have also been used.
The paper is structured as follows: Section 2 introduces the main theoretical aspects related to GVCs and its environmental impact. Section 3 presents the methodology framework employed in this paper, based on IO analysis. Section 4 presents and discusses the main results. Finally, Section 5 offers some conclusions and possible future research.
2. Literature Review
Early work on the analysis of international flows and the environment was characterized by static analyses of the impact of trade on the environment as well as the impact of environmental policies on trade performance. This approach has led to uncertain and divergent results. In this line, some authors have found that the adoption of environmental protection policies worsens trade performance due to competitiveness losses. According to these findings, there seems to be a trade-off between trade and environmental gains (Siebert 1974, 1977). For example, the recent study by Fang et al. (2019) finds that China’s regions with tighter environmental regulations have reduced their export dynamism.
However, other proposals show opposite results by using alternative assumptions. For example, Pethig (1976) notes that specialization in emission-intensive goods can result in welfare losses and that the adoption of environmental protection measures can lead to strengthening a country comparative advantage. In turn, Stavropoulos et al. (2018) find an inverted U-shaped relationship between the rigidity of environmental regulation and industrial competitiveness, suggesting that the linkage between environmental regulation and trade performance is complex and non-linear.
Ansari and Khan (2021) analyze the impact of trade openness on environmental quality (in terms of the ecological footprint) in a set of Asian countries between 1991 and 2016. The authors attempt to differentiate the three classic effects considered in the trade-environment binomial: scale, technical and composition effects. On the one hand, the results verify that the scale effect, referred to the volume of trade, deteriorates environmental quality. On the other hand, the technical and composition effects, referred to the production technology used, and the products manufactured, respectively, reduce environmental deterioration. These results are in line with the work of Antweiler et al. (2001) and Chou and Wang (2020), among others.
Later theories such as the pollution haven hypothesis (PHH) or the environmental Kuznets curve (EKC) became increasingly relevant. On the one hand, the PHH establishes that in the presence of international disparities in environmental regulations and in the presence of free movement of capitals, industries affected by tight environmental regulation will relocate their environmentally harmful activities to countries with softer environmental standards. As with the early work on the trade–environment nexus, some authors found evidence that holds this hypothesis (Low and Yeats 1992; Lucas et al. 1992), while others pointed out that international differences in environmental regulation are not determinant to relocation (Dean 1992; Grossman and Krueger 1991).
Despite these discrepancies, PHH is still the subject of much recent research. Some of these studies verify the fulfilment of this hypothesis under certain conditions or for specific sectors that are particularly sensitive to environmental regulations, such as electronic equipment (Copeland and Taylor 2004; Kellenberg 2009).
Regardless of whether the offshoring decision is based on less restrictive environmental regulation, the overall impact on the environment is the one stated by the PHH (Guzel and Okumus 2020; Zhao et al. 2020). Manufacturing tasks generally tend to relocate to developing countries, which at the same time tend to have lower environmental constraints than developed countries. As a result, new producers are unlikely to adopt the same environmental and eco-design practices applied in the country of origin.
The environmental damage resulting from trade is particularly relevant in those activities that are extremely fragmented and organized through the so-called GVCs, extensive international networks that involve the participation of several agents located in different countries for the manufacture of a product (Arndt and Kierzkowski 2001; Gereffi 2005, 2014). These large production networks involve large movements of goods, increasing the environmental impact of trade in two ways: production in countries with weaker environmental regulation (environmentally harmful production) and increasing flows of international transport, which involve emissions and materials use.
On the other hand, the EKC states that as a country develops its impact on the environment increases up to a certain level of GDP per capita, from which further development will reduce environmental degradation. As with the PHH, some studies verify (Jalil and Mahmud 2009) while others are less conclusive about the fulfilment of the EKC (Ahmed et al. 2016; Destek et al. 2018; Kleemann and Abdulai 2013).
It should be noted that not all production relocation processes take place from developed countries to Asia or other developing areas. The integration of Eastern European economies into the EU since 2004 has favored the relocation of certain activities from the Central European economies to the new Member States. However, this relocation has taken place more as outsourcing processes than through the establishment of subsidiaries (Marin 2006). Moreover, according to Geishecker (2006), most of the tasks initially offshored to Eastern Europe are labor-intensive, although more service-related tasks have also started to be relocated (Sass and Fifekova 2011).
The work by Mandras and Salotti (2020) analyzes the potential effects of the eventual integration of the Balkan countries into the EU from an economic point of view. These authors find that integration has positive effects, but uneven across sectors. Particularly noteworthy is the potential outcome derived from participation in GVCs achieved through integration into the Union. This integration would mainly benefit participation in the regional chain of Factory Europe. However, these authors do not address issues arising from the possible relocation of production processes as a consequence of this integration.
According to the PHH, since the early years of Eastern European economies’ integration into the EU to the harmonization of their environmental standards (Despite the number of member countries, there have been no relevant cases of non-compliance concerning European environmental regulation. According to Börzel and Buzogány (2019), the success in the harmonization of environmental legislation is mainly due to two factors. On the one hand, to the strategy broadly followed by European institutions to ensure compliance with the European common regulation. On the other hand, environmental policy is not particularly rigorous at the EU level and seeks to modify the legislation of each member state to avoid intra-EU irregularities), it could be expected a worse environmental performance of these countries compared to the rest of the EU. At the same time, according to the EKC, their trade integration into the EU should favor higher growth rates among Eastern European countries. Assuming that due to their low development within the EU context they are still in the rising section of the EKC, an increase in emissions generated by these countries may be expected as a result of their integration into the EU.
In this sense, the work by Pablo-Romero et al. (2017) finds an inverted U-shaped curve—as established by the EKC—for the transport sector, which accounts for around a quarter of total emissions. Furthermore, these authors also state that the inflexion point has not yet been reached. The study by Leitão and Balogh (2020), focused on the agricultural sector, also finds that the higher growth and productivity rates in the sector lead to more environmental concerns. The work by Al-Mulali et al. (2015) obtains interesting results by finding a positive relationship between GDP growth and CO2 emissions, while finding a relationship of opposite sign between trade openness and emissions. However, if a higher degree of trade openness induces higher increases in GDP, following this rationale international trade would generate an increase in emissions through increases in GDP.
Shahbaz et al. (2019) estimate the fulfilment of the EKC hypothesis in Vietnam. First, they verify that factors such as energy consumption, economic structure, FDI and urbanization positively influence CO2 evolution. Regarding EKC compliance, the study is non-deterministic, finding an N-shaped evolution in long-term projections of CO2 emissions as a function of economic growth. The authors conclude that, since economic growth causes an increase in CO2 emissions, the adoption of clean technologies should be considered by the government as a preventive policy measure.
Regarding the Eastern European economies, there is a lack of literature analyzing whether this region has become a sort of pollution haven within the EU. From this scarce literature it is not possible to draw an unequivocal conclusion on this issue. For example, Martínez-Zarzoso et al. (2017) attempts to analyze the relationship between the level of stringency of environmental regulation and intra-EU trade flows, their results hardly support the PHH.
However, other studies point to opposite conclusions. In this sense, Bagayev and Lochard (2017) find that as EU member states advance in environmental regulation, they also increase their imports of emission-intensive goods from both, Asia and emerging European countries. These authors also highlight the intensive use of fossil fuels in these regions: more restrictive environmental regulation in some territories appears to generate greater environmental impacts in others, hindering environmental improvement on a global scale. This result raises questions about the need for global coordination mechanisms to effectively achieve a sustainable future.
The research conducted by Tsagkari et al. (2018) analyzes the link between the rapid economic growth of the Polish country following its trade opening and European integration process and the environmental effects linked to these processes. Their results point out to a significant increase in CO2 emissions directly linked to the processes of integration and trade liberalization.
Ho and Iyke (2019) analyze the relationship between trade openness and its effects on CO2 emissions for a set of Central and Eastern European countries. Their results are consistent with the EKC since they find a negative relationship between emissions and trade openness—which is linked to economic growth—in the long term. These authors also point out that there is a limit to the reduction of environmental impacts from trade openness and therefore, beyond a certain point, the positive effects could be reversed.
This paper aims to contribute to fill the gap in the literature by analyzing the environmental impact of intra-EU production linkages in a context of economic integration and international fragmentation of production. In this sense, it seeks to answer the research question of whether the integration of EU economies, especially in the case of Eastern European countries, has led to changes in the environmental impact (measured in CO2 emissions) of their intra-EU linkages (measured in trade in value-added).
3. Data, Methods, and Model Specification
The IO framework introduced by Leontief (1937, 1951) allows the analysis of the intersectoral relations of an economy. Currently, there are some IO projects oriented to the analysis of international trade, especially useful for analyzing trade in value-added, of great utility in the GVC framework. The IO tables developed for this purpose include not only intersectoral linkages within an economy, but also those of each domestic sector with each foreign sector. These analytical tools are generally entitled MRIO models (Lenzen et al. 2012, 2013; Timmer et al. 2015).
The data for this paper were collected from two open-access sources. On the one hand, information concerning the value-added generation at the intra-EU level was obtained from TiVA database developed by the OECD. The specific information for the analysis of production chains was obtained by operating on the basis of the “forward participation in GVCs” indicator for the European level (This indicator provides the value-added that has been generated in an EU28 country (country A) and subsequently transformed and exported by another member country (country B) to another EU or non-EU country (country C), expressed as a percentage of total gross exports by country A. This is a measure of the complex production linkages within the EU28 regional value chain. The product of this indicator by the total gross exports results in the forward participation as an export flow).
On the other hand, the data for the environmental analysis of intra-EU production linkages comes from the MRIO database Eora26—an open access database for researchers. Eora26 provides a set of harmonized MRIO tables for 190 countries and 26 sectors for the period 1990–2015. There is a set of satellite accounts accompanying the economic accounts, which provide information on sectoral emissions for each economy. In this work, CO2 emissions have been selected due to the information availability for all European countries. In accordance with statistical availability, the period selected for the analysis is from 2005 to 2015—the last year available in Eora.
In the following, the mathematical procedure for the calculation of the forward participation from the MRIO framework, measured not as a percentage, but as an export flow of value-added, is presented. The procedure for the transformation of export flows measured in monetary terms into trade flows measured in CO2 emissions is also provided. As the analysis is carried out at a country level, the sectoral dimension is excluded in the formulation.
For a set of countries, is defined as the intermediate transactions matrix, as the final demand matrix, and as the total output vector. The basic IO entities are as follows:
where is a unity vector used to perform the row or column sums required (In case a row-wise sum is required, will be of dimension while in case a column-wise sum is required, will be of dimension). represents the technical production coefficients matrix and is a matrix whose diagonal contains the elements of the total output vector; the remaining elements are null—all elements with a circumflex accent represent the diagonalization of the original vector. Finally, represents the Leontief inverse matrix and the identity matrix.
Following Koopman et al. (2014), it is possible to obtain the total output by breaking down each element according to where it is actually absorbed:
where is a total output matrix of dimension whose diagonal elements represent the total output generated in the economy of reference and absorbed in the same economy. The non-diagonal elements represent international trade. Let be the matrix modified so that the diagonal elements have been removed. Each non-diagonal element of represents the gross exports from one country to another. A country’s total gross exports, are defined as the row sum of .
In order to obtain the forward participation measured as an export flow of value-added it is first required to obtain the value-added coefficients, from the technical production coefficient matrix.
where is a vector composed of “ones”. The product of the value-added coefficients by the total output gives the value added generated by each economy, which is equivalent to GDP. The forward participation in the GVCs of value-added generated within the EU28 and subsequently exported by any member country to any country in the world, , is obtained as follows:
In the expression 5, represents the inverse Leontief matrix modified so that it only includes the external interrelations of the EU28 member countries. To obtain the forward share in terms of emissions, the vector of total CO2 emissions, is used as a starting point. Emission intensity, , is defined as the ratio of CO2 emissions to total output:
The variable provides information on the CO2 emissions emitted in units of mass for each monetary unit produced. In this regard, this variable is used in the same way as an output multiplier. Therefore, to obtain the emissions linked to domestic value-added exports, , it needs to proceed as follows:
where is the element-wise product between the vectors and , being its diagonalization.
In addition to the descriptive analysis, in order to achieve robust results, an econometric model is proposed to test the EKC hypothesis, using country-level panel data for EU28 member states from 2005 to 2015. The proposed model specification is as follows:
where the subscripts “i” and “t” refer to the cross-section (countries) and time-period (years) units, respectively; ln(CO2) is the dependent variable and refers to the natural logarithm of CO2 emissions per capita; GDP is the real GDP per capita, GDP2 its square, and DVAFP is the domestic value added per capita oriented to forward participation in the intra EU value chain (Factory Europe).
According to the EKC hypothesis, the sign of β1 parameter is expected to be positive, as CO2 emissions should increase with the production level proxied by real GDP per capita; also, the sign of β2 parameter is expected to be negative. If the hypothesis is verified, higher income countries should have a better environmental performance (measured by CO2 emissions per capita) than the lower income ones.
The turning point can be obtained as a derivative of expression (8) with respect to GDP and equating the derivative to 0.
It should be noted that, unlike other empirical models that analyze the relationship between economic development and CO2 emissions, a variable related to the forward participation in intra-EU value chain have been included to test the influence of intra-EU production linkages over CO2 emissions. In this sense, and in line with the PHH, the relocation of activities within Factory Europe may be leading to an increase in CO2 emissions per capita of the countries involved. Therefore, the sign of β3 parameter is expected to be positive, since CO2 emissions should be increasing as countries, many of them Eastern European, increase their participation in the intra-EU value chain.
Data used have been collected in the databases listed above (TiVA, Eora26). Table 1 shows the main statistics of the variables included in the regression.
Regarding the model estimation, the use of the Pooled Ordinary Least Squares (POLS) method by a log-level equation is used to avoid multicollinearity problems, therefore a unit change in the independent variables is expected to change de dependent variable by 100 · βj percent. The model estimation results using GRETL software are presented and discussed in Section 4.2.
4. Results and Discussion
4.1. Descriptive Analysis: Facts and Trends
Based on the formulation and data indicated in the methodological section (Section 3), the changes in intra-EU production linkages by country are analyzed, considering the value-added generated and exported in the European regional value chain. In this respect, first, a comparison is made between forward participation rate in 2005 and 2015, corresponding with the stage of integration of the CEECs into the EU.
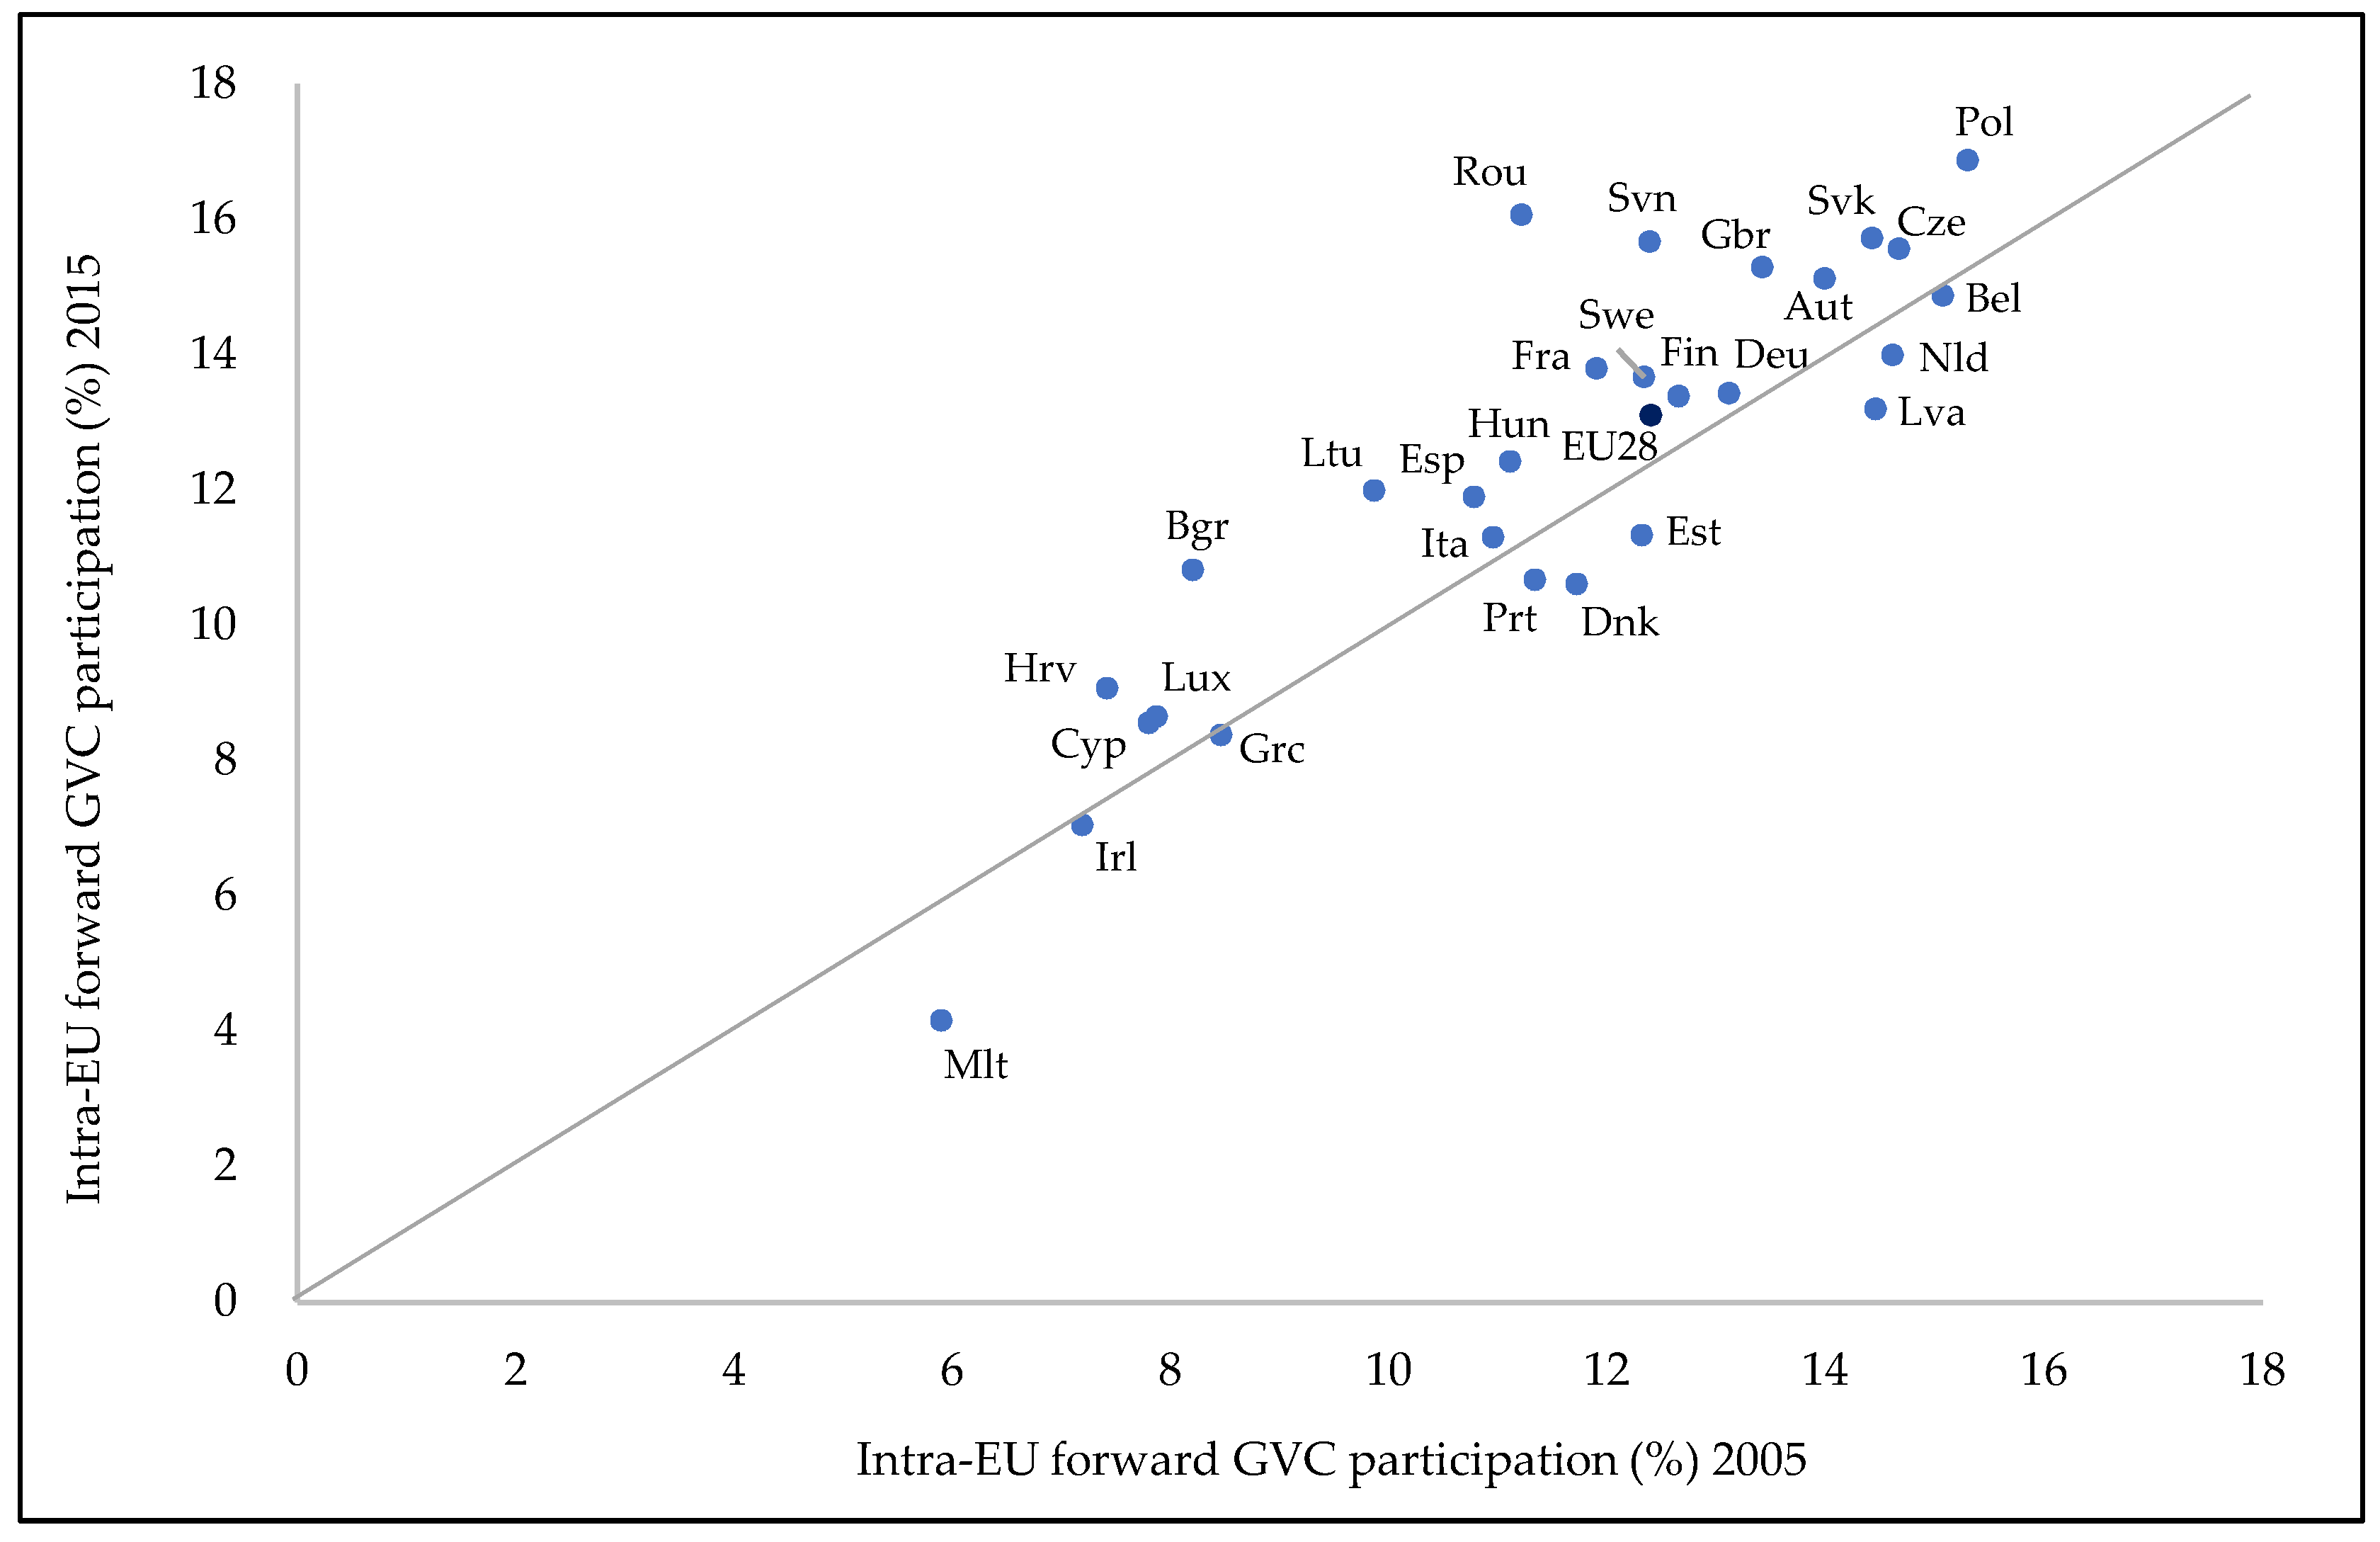
As can be seen in Figure 1, most EU countries have increased their level of forward participation in GVCs throughout intra-EU production linkages as a percentage of their total gross exports (extra and intra-EU exports) between 2005 and 2015. Moreover, it is important to note that intra-EU exports account in many cases for 60–70% of member states’ external trade.
In this sense, it is possible to establish that a large part of the external activity of EU countries is organized through regional value chains, and not only in the form of global chains, in the so-called Factory Europe. From Figure 1 it can be seen that intra-EU value creation processes have strengthened over the period under analysis. There are other two important regions where intra-regional trade stands out: Factory Asia and Factory America. The existence of these areas of high intra-regional trade intensity implies, in terms of exports-related emissions, that most of the direct environmental effects of foreign trade remain within the region where the trade flows originate.
In this case, Factory Europe stands out the other two factories (Asia and America), showing a share of intra-regional exports above 50% of total EU28 exports, as can be seen in Figure 2.
Although the share of intra-European trade has declined over time, it still accounts for more than half of the international trade of most member countries. Furthermore, it should be noted that, despite the increasing insertion of European exports in international markets, intra-EU value creation has deepened, increasing the internal production chains of the Factory Europe, as already pointed out in Figure 1.
Before analyzing the environmental impact of trade in value added from domestic sources, it is worth analyzing the changes in the emissions intensity of the member states in the period considered. Emissions intensity is the ratio between the volume of emissions and total output, which results in tonnes of CO2 per thousand dollars of total output (Figure 3).
Figure 3 shows some discrepancies in the evolution of emissions intensity. In particular, countries with a higher initial emissions intensity also show a higher percentage reduction over time. These countries are mainly represented by the Eastern European economies. For the other member states, the reduction in emissions intensity is less relevant.
Behind the initial discrepancy in emissions intensity and its evolution over time lies the integration of the above-mentioned economies into the EU. The integration process requires the harmonization of regulations, including, to some extent, environmental issues. The adoption of European environmental standards significantly contributes to the reduction of the emission intensity in Eastern European economies.
In this sense, these results show a reduction in the disparities between member countries in terms of CO2 emissions linked to international trade. However, this indicator does not allow to observe the extent to which Eastern European countries have attracted the most polluting tasks of Factory Europe.
Moreover, it is possible to analyze the comparative evolution of emissions per capita and GDP per capita, as Figure 4 shows. Although the verification of the EKC is not the focus of this paper, this comparison can provide new insights on this relationship.
According to Figure 4, most European economies have decreased their GDP per capita (constant prices) while reducing their emissions per capita (third quadrant). However, the integration of the Eastern economies has not led all EU countries to behave in the same way. For example, Estonia, Latvia, and Lithuania have simultaneously increased both variables (first quadrant).
Most of the European countries (17) are in the third quadrant, which reduce both emissions per capita and GDP per capita simultaneously. In this regard, the countries in the fourth quadrant show an evolution apparently in line with the decreasing section of the EKC, while the economies in the quadrant 1 still seem to be in the rising section of the curve. This trend can be interpreted as a sign that these economies have reached the turning point foreseen in the EKC, at least as far as CO2 emissions are concerned.
It should be noted however that this result needs to be validated over time as more up-to-date data become available. It should be stressed in this regard that many countries were still under the effects of the 2008 financial crisis in 2015 (especially those in the third quadrant).
A reduction in the disparities of the member states in relation to the European average (especially the catching-up of economies below the European average) is generally considered as a positive result. However, when it comes to emissions, convergence towards the average should not be considered beneficial if it is not accompanied by an equally significant increase in per capita income.
In this regard, it is also worth noting the different position of the Eastern European economies compared to the EU average in terms of income and emissions in 2015 compared to 2005. In both 2005 and 2015, all Eastern European countries—except for Poland—were below the EU average in terms of income per capita. Although Eastern European countries have approached their income per capita to the European average (except for Romania), EU integration have increased Eastern European economies’ emissions per capita levels above the European average.
Focusing on the intra-EU production linkages, Figure 5 shows the evolution of the domestic value-added of EU economies oriented to forward participation per capita in GVCs, expressed in thousands of dollars per capita, and the same variable expressed in tonnes of CO2 emissions per capita in the period 2005–15.
From this figure, it can be observed that, to a greater or lesser extent, all EU members have increased their forward participation in GVCs. In other words, they all have contributed to the strengthening of value generation within Factory Europe. In this sense, integration into the common market has enabled and fostered trade relations between member states. Even though this is an expected result regarding the evolution of this variable, it is nonetheless relevant.
However, not all member states have a similar evolution in terms of emissions linked to the increasing forward participation of EU economies. Some countries, especially Eastern European economies, show a significant increase in their emissions, although they are also the countries that have increased the most their value-added generation.
Nonetheless, the direct relationship shown by both variations reveals that, in general, the strengthening of the intra-EU fragmentation of production process is associated with a growing impact on the volume of emissions. As Figure 5 shows, this is particularly significant for the Eastern European countries. The work conducted by Tsagkari et al. (2018) shows similar results for the specific case of the Polish economy, where CO2 emissions increased significantly since its integration into the EU.
Moreover, Duan et al. (2021) suggest that economies with higher per capita income tend to offshore the most harmful tasks of the production chain to lower income countries, giving rise to the so-called “global pollution chains”. As a result, richer economies tend to import more emission-intensive goods. In the context of GVC trade, these pollution chains can be particularly complex: a country can be simultaneously a net exporter and a net importer of emissions depending on the income level of each trading partner.
In addition, the work by Zhao and Liu (2020) points to the existence of pollution havens in developing economies. It should be noted that these authors focus their analysis on emissions intensity and therefore their results are generally biased by the general trend of this variable. Consequently, all countries tend to reduce their emissions intensity, especially developing economies, because of their previous higher levels.
Regarding disparities, understood as the gap with respect to the European average, these are narrowing in terms of exports measured in emissions. However, in this case it does not imply a positive outcome: while some countries reduce their environmental impact resulting from trade linked to intra-EU production linkages, others increase it within the same region. The first group consists of the more advanced EU economies while the second group consists of the more recently integrated countries—although, there are some exceptions, such as Romania, Slovakia, Slovenia, and the Czech Republic. As these countries are increasing their income per capita levels, they are also increasing their impact on the environment.
In this regard, the work by Mosconi et al. (2020) argues the need to consider spatial effects in environmental analysis to adjust the necessary policies to the specific features of each territory. According to these authors, spatial factors, together with temporal, sectoral and institutional ones, are key determinants in explaining the environmental degradation caused by economic activity. To achieve this goal, it is necessary to rethink the way data is collected at regional level. In this sense, some problems may arise from the methods currently used for data collection, which follow administrative criteria that do not always meet the local and regional economic structure.
4.2. Econometric Analysis
In order to provide robustness to the analysis, a panel data model as described in Equation (8) (Section 3) was estimated as multivariate regression using POLS (Pooled Ordinary Least Squares). The main results of the regression are shown in Table 2.
The estimation results allow the verification of the EKC as the parameter β1 < 0 and parameter β2 > 0. Therefore, this estimation verifies the existence of an inverted U-shaped curve at least for the case of CO2 emissions in the period 2005–15 among EU28 countries. Applying the expression (9) it is obtained that the turning point of the estimated EKC is located at a real GDP per capita level of 29,364.94 US dollars. According to this result, a higher development level leads to a decrease in CO2 emissions per capita in the EU. This finding is in line with other works focusing on Europe, which generally find evidence of compliance with the EKC (Atici 2009; Dogan and Inglesi-Lotz 2020).
According to these results, the Eastern European economies, as well as Greece, Spain, Portugal, Malta, and Cyprus, were still on the rising segment of the curve, while the other European economies were on the decreasing segment. The real GDP per capita averages for the period analyzed for each EU28 member country can be found in Table A2 in Appendix A.
As mentioned in Section 3, an additional variable (DVAFP) has been included with the aim of contrasting the influence of the participation in the production chains of Factory Europe (intra-EU value chain). The regression results show that the variable is significant, and its coefficient is positive. These findings mean that a greater participation in GVCs originating in Europe has a positive influence on CO2 emissions per capita, which is consistent with other works such as the carried out by Ho and Iyke (2019).
Moreover, these model estimation results, together with the descriptive results shown in Figure 1 and especially in Figure 5, provide certain indications of compliance with the PHH. In this regard, participation in GVCs is found significant, with some Eastern European Countries showing simultaneously the largest increases in both the GVC participation and emissions associated with exports linked to these production linkages.
5. Conclusions
The aim of this paper was to analyze the economic dimension and the environmental impact (approximated by CO2 emissions) of the intra-EU fragmentation of production process in the framework of the so-called Factory Europe. For this purpose, the intra-EU forward participation in the GVCs was taken as a reference for the analysis, based on trade in value-added data for the years 2005 and 2015.
The adoption of this perspective regarding the joint (intra-EU) participation of EU28 countries in GVCs is a novelty in the analysis of the environmental impact of international flows. Moreover, this approach contributes to a better understanding of the external insertion pattern (trade and production) of economies in the European integration context.
A first conclusion of interest concerns the participation of European economies in GVCs. On the one hand, the results show the intensification of the value generation process within Factory Europe. On the other hand, it is a result that takes place in a context of growing importance of extra-EU exports. In this sense, both trends are not contradictory, but rather reveal that the progress in the external opening of the EU28 is taking place through a deepening of intra-regional fragmentation of production (intra-EU value chain).
In CO2 emission-intensity terms, a generalized reduction is found in all EU countries. However, a similar evolution is not found when analyzing the emissions generated by each Member Country linked to its value-added exports within the intra-EU value chain.
The study has also allowed an analytical approach to the compliance of the EKC hypothesis in the European context. The estimation results are in line with the EKC hypothesis by finding an inverted U-shaped curve. In this sense, Eastern European countries together with Spain, Greece, Portugal, Malta, and Cyprus were on the rising segment of the curve, at least in terms of CO2 emissions in the period 2005–15. The other European countries in the sample are on the decreasing segment of the curve. In any case, this result needs to be verified as more extensive and updated information becomes available.
Another outstanding result refers to the existence of a direct relationship between the increase in intra-EU forward participation and the increase in emissions linked to these value-added flows. The estimation results verify the positive effect that participation in GVCs originating in Factory Europe has on CO2 emissions per capita. This result is particularly relevant in Eastern European economies since they are the ones that have recently increased their degree of insertion in these chains to a greater extent. In general, this direct relationship of a dynamic nature leads to the conclusion that the current configuration and progress of the intra-EU value chain entails a growing impact on the emissions volume, hindering the achievement of sustainability as a global challenge.
Based on the conducted analysis, it is necessary to rethink the current European production model in what has become to be known as Factory Europe, in the form of an intra-EU value chain. In this sense, policies oriented towards the objective of sustainability and the application of CE measures must also incorporate a supranational approach that introduces the perspective of GVCs. It is therefore becoming increasingly urgent and necessary to incorporate sustainability criteria into a model of international insertion that is based exclusively on the technical efficiency and economic profitability of value generation processes.
In this sense, the European Commission has recently published a working document proposing to lead the way towards a global CE. It points to the need to create global partnerships to move towards a CE on a global scale (European Commission 2020). The report highlights the importance of global value chains in today’s world. Therefore, it highlights the need to involve global suppliers in order to achieve the circularity objectives on an international level.
This study is a first step in the analysis of the environmental impacts linked to the GVCs of Factory Europe. Still, further research is needed. One of the main issues is to address the impacts linked to international freight transport. Although transport flows are particularly intense in GVC trade, most trade and environmental impact studies only consider emissions from production. Therefore, the development of a holistic approach involving both perspectives is of particular interest.
Another interesting line of research is the analysis of the sectoral patterns of industry relocation in Factory Europe resulting from integration processes. This analysis would allow the verification of pollution havens through the analysis of FDI flows and changes in the sectoral composition of trade within the EU.
Author Contributions
Conceptualization, Ó.R.-M. and H.C.-R.; methodology, H.C.-R.; formal analysis, Ó.R.-M. and H.C.-R.; investigation, Ó.R.-M. and H.C.-R.; writing—original draft preparation, Ó.R.-M. and H.C.-R.; writing—review and editing, Ó.R.-M. and H.C.-R.; project administration, Ó.R.-M. All authors have read and agreed to the published version of the manuscript.
Funding
This research was funded by the Agencia Estatal de Investigación of the Spanish Government in the framework of the research project “The European Strategy for Circular Economy: Prospective Juridic Analysis and Changes in the Global Value Chains” (Ref. ECO2017-87142-C2-1-R), from the European Regional Development Fund (ERFD) and the Xunta de Galicia (Ref. ED431C 2018/23). The authors would also like to thank the Consellería de Cultura, Educación e Ordenación Universitaria of the Xunta de Galicia for the support given in the accomplishment of this study through the pre-doctoral grant programme (ED481A-2019/108).
Data Availability Statement
Data related to international trade in value-added are freely available in the OECD’s Trade in Value Added (TiVA) database at https://www.oecd.org/sti/ind/measuring-trade-in-value-added.htm. Data related to CO2 emissions can be found in Eora26 database (free access for researchers logging in with an institutional account) at https://worldmrio.com/eora26/. Data for the calculation of the variables in per capita and deflated terms were obtained from the World Bank.
Acknowledgments
The authors would like to thank the editor and the two anonymous reviewers for their constructive comments that improved the quality of the paper.
Conflicts of Interest
The authors declare no conflict of interest. In addition, the funders had no role in the design of the study; in the collection, analyses, or interpretation of data; in the writing of the manuscript, or in the decision to publish the results.
Appendix A

Table A1.
Country codes list.
| Code | Country | Code | Country |
|---|---|---|---|
| Aut | Austria | Ita | Italy |
| Bel | Belgium | Lva | Latvia |
| Bgr | Bulgaria | Ltu | Lithuania |
| Hrv | Croatia | Mlt | Malta |
| Cyp | Cyprus | Nld | Netherlands |
| Cze | Czech Republic | Pol | Poland |
| Dnk | Denmark | Prt | Portugal |
| Est | Estonia | Rou | Romania |
| Fin | Finland | Svk | Slovak Republic |
| Fra | France | Svn | Slovenia |
| Deu | Germany | Esp | Spain |
| Grc | Greece | Swe | Sweden |
| Hun | Hungary | Gbr | United Kingdom |
| Irl | Ireland | Lux | Luxembourg |
Table A2.
Real GDP per capita average (2005–15). EU28 countries.
| Bulgaria | 4550.38 | Italy | 30,511.20 |
| Romania | 5102.32 | France | 35,200.31 |
| Latvia | 8738.41 | United Kingdom | 36,807.17 |
| Lithuania | 9603.30 | Germany | 37,607.41 |
| Poland | 9871.97 | Belgium | 38,349.06 |
| Hungary | 10,149.03 | Finland | 39,306.37 |
| Croatia | 10,454.75 | Austria | 40,174.19 |
| Estonia | 11,208.11 | Netherlands | 43,964.55 |
| Slovak Republic | 14,069.00 | Sweden | 45,105.27 |
| Czech Republic | 16,778.94 | Denmark | 48,213.35 |
| Malta | 17,396.40 | Ireland | 50,551.18 |
| Cyprus | 18,200.51 | Luxembourg | 83,165.15 |
| Portugal | 18,448.51 | ||
| Slovenia | 19,061.29 | ||
| Greece | 20,855.73 | ||
| Spain | 26,219.48 |
Note: The environmental Kuznets curve (EKC) turning point level was estimated at a real GDP per capita of 29,264.94 US dollars. Source: Own elaboration based on TiVA, Eora26 and the World Bank.
References
- Ahmed, Ali, Gazi Salah Uddin, and Kazi Sohag. 2016. Biomass Energy, Technological Progress and the Environmental Kuznets Curve: Evidence from Selected European Countries. Biomass and Bioenergy 90: 202–208. [Google Scholar] [CrossRef]
- Al-Mulali, Usama, Ilhan Ozturk, and Hooi Hooi Lean. 2015. The Influence of Economic Growth, Urbanization, Trade Openness, Financial Development, and Renewable Energy on Pollution in Europe. Natural Hazards 79: 621–44. [Google Scholar] [CrossRef]
- Ansari, Mohd Arshad, and N. A. Khan. 2021. Decomposing the Trade-Environment Nexus for High Income, Upper and Lower Middle Income Countries: What Do the Composition, Scale, and Technique Effect Indicate? Ecological Indicators 121: 107122. [Google Scholar] [CrossRef]
- Antweiler, Werner, Brian R. Copeland, and M. Scott Taylor. 2001. Is Free Trade Good for the Environment? American Economic Review 91: 877–908. [Google Scholar] [CrossRef] [Green Version]
- Arndt, Sven W., and Henryk Kierzkowski. 2001. Fragmentation: New Production Patterns in the World Economy. Oxford: Oxford University Press. [Google Scholar]
- Atici, Cemal. 2009. Carbon Emissions in Central and Eastern Europe: Environmental Kuznets Curve and Implications for Sustainable Development. Sustainable Development 17: 155–60. [Google Scholar] [CrossRef]
- Bagayev, Igor, and Julie Lochard. 2017. EU Air Pollution Regulation: A Breath of Fresh Air for Eastern European Polluting Industries? Journal of Environmental Economics and Management 83: 145–63. [Google Scholar] [CrossRef]
- Baldwin, Richard. 2006. Multilateralising Regionalism: Spaghetti Bowls as Building Blocs on the Path to Global Free Trade. The World Economy 29: 1451–518. [Google Scholar] [CrossRef] [Green Version]
- Baldwin, Richard. 2012. Global Supply Chains: Why They Emerged, Why They Matter, and Where They Are Going. CEPR Discussion Papers DP9103. Washington, DC: Center for Economic and Policy Research (CEPR). [Google Scholar]
- Börzel, Tanja A., and Aron Buzogány. 2019. Compliance with EU Environmental Law. The Iceberg Is Melting. Environmental Politics 28: 315–41. [Google Scholar] [CrossRef]
- Chou, Haifeng, and Qi Wang. 2020. Empirical Study on the Environmental Effect of Global Value Chains: Based on Scale, Technique and Composition Effects. Paper presented at 2020 International Conference on social and Human Sciences (ICSHS 2020), Camberra, Australia, March 7–8. [Google Scholar]
- Copeland, Brian R., and M. Scott Taylor. 2004. Trade, Growth, and the Environment. Journal of Economic Literature 42: 7–71. [Google Scholar] [CrossRef]
- Dean, Judith M. 1992. Trade and the Environment: A Survey of the Literature. WPS966. Washington, DC: The World Bank. [Google Scholar]
- Destek, Mehmet Akif, Recep Ulucak, and Eyup Dogan. 2018. Analyzing the Environmental Kuznets Curve for the EU Countries: The Role of Ecological Footprint. Environmental Science and Pollution Research 25: 29387–96. [Google Scholar] [CrossRef] [PubMed]
- Dogan, Eyup, and Roula Inglesi-Lotz. 2020. The Impact of Economic Structure to the Environmental Kuznets Curve (EKC) Hypothesis: Evidence from European Countries. Environmental Science and Pollution Research 27: 12717–24. [Google Scholar] [CrossRef]
- Duan, Yuwan, Ting Ji, and Tuotuo Yu. 2021. Reassessing Pollution Haven Effect in Global Value Chains. Journal of Cleaner Production 284: 124705. [Google Scholar] [CrossRef]
- European Commission. 2020. Leading the Way to a Global Circular Economy: State of Play and Outlook. SWD (2020) 100 final. Luxembourg: Publications Office of the EU. [Google Scholar]
- Fang, Jiayu, Cenjie Liu, and Chao Gao. 2019. The Impact of Environmental Regulation on Firm Exports: Evidence from Environmental Information Disclosure Policy in China. Environmental Science and Pollution Research 26: 37101–13. [Google Scholar] [CrossRef]
- Fritsch, Manuel, and Jürgen Matthes. 2017. Factory Europe and Its Ties in Global Value Chains. GED Focus Paper. Cologne: Bertelsmann Stiftung. [Google Scholar]
- Geishecker, Ingo. 2006. Does Outsourcing to Central and Eastern Europe Really Threaten Manual Workers’ Jobs in Germany? The World Economy 29: 559–83. [Google Scholar] [CrossRef] [Green Version]
- Gereffi, Gary. 2005. The Global Economy: Organization, Governance, and Development. The Handbook of Economic Sociology 2: 160–82. [Google Scholar]
- Gereffi, Gary. 2014. Global Value Chains in a Post-Washington Consensus World. Review of International Political Economy 21: 9–37. [Google Scholar] [CrossRef]
- Grossman, Gene M., and Alan B. Krueger. 1991. Environmental Impacts of a North American Free Trade Agreement. NBER Working Papers 3914. Cambridge: National Bureau of Economic Research, Inc. [Google Scholar]
- Guzel, Arif Eser, and İlyas Okumus. 2020. Revisiting the Pollution Haven Hypothesis in ASEAN-5 Countries: New Insights from Panel Data Analysis. Environmental Science and Pollution Research 27: 18157–67. [Google Scholar] [CrossRef] [PubMed]
- Ho, Sin-Yu, and Bernard Njindan Iyke. 2019. Trade Openness and Carbon Emissions: Evidence from Central and Eastern European Countries. Review of Economics 70: 41–67. [Google Scholar] [CrossRef]
- Jalil, Abdul, and Syed F. Mahmud. 2009. Environment Kuznets Curve for CO2 Emissions: A Cointegration Analysis for China. Energy Policy 37: 5167–72. [Google Scholar] [CrossRef] [Green Version]
- Kellenberg, Derek K. 2009. An Empirical Investigation of the Pollution Haven Effect with Strategic Environment and Trade Policy. Journal of International Economics 78: 242–55. [Google Scholar] [CrossRef]
- Kleemann, Linda, and Awudu Abdulai. 2013. The Impact of Trade and Economic Growth on the Environment: Revisiting the Cross-Country Evidence. Journal of International Development 25: 180–205. [Google Scholar] [CrossRef] [Green Version]
- Koopman, Robert, Zhi Wang, and Shang-Jin Wei. 2014. Tracing Value-Added and Double Counting in Gross Exports. The American Economic Review 104: 459–94. [Google Scholar] [CrossRef] [Green Version]
- Leitão, Nuno Carlos, and Jeremiás Máté Balogh. 2020. The Impact of Intra-Industry Trade on Carbon Dioxide Emissions: The Case of the European Union. Agricultural Economics 66: 203–14. [Google Scholar] [CrossRef]
- Lenzen, Manfred, Keiichiro Kanemoto, Daniel Moran, and Arne Geschke. 2012. Mapping the Structure of the World Economy. Environmental Science & Technology 46: 8374–81. [Google Scholar] [CrossRef]
- Lenzen, Manfred, Daniel Moran, Keiichiro Kanemoto, and Arne Geschke. 2013. Building Eora: A Global Multi-Region Input–Output Database at High Country and Sector Resolution. Economic Systems Research 25: 20–49. [Google Scholar] [CrossRef]
- Leontief, Wassily W. 1937. Interrelation of Prices, Output, Savings, and Investment. The Review of Economics and Statistics 19: 109–32. [Google Scholar] [CrossRef]
- Leontief, Wassily. 1951. The Structure of American Economy, 1919–39: An Empirical Application of Equilibrium Analysis. New York: Oxford University Press. [Google Scholar]
- Low, Patrick, and A. Yeats. 1992. Do “Dirty” Industries Migrate? In International Trade and the Environment. Edited by Patrick Low. World Bank Discussion Papers 159. Washington, DC: World Bank, pp. 89–103. [Google Scholar]
- Lucas, Robert E. B., David R. Wheeler, and Hemamala Hettige. 1992. Economic Development, Environmental Regulation, and the International Migration of Toxic Industrial Pollution: 1960–88. WPS1062. Washington, DC: The World Bank. [Google Scholar]
- Mandras, Giovanni, and Simone Salotti. 2020. An Input–Output Analysis of Sectoral Specialization and Trade Integration of the Western Balkans Economies. Economies 8: 93. [Google Scholar] [CrossRef]
- Marin, Dalia. 2006. A New International Division of Labor in Europe: Outsourcing and Offshoring to Eastern Europe. Journal of the European Economic Association 4: 612–22. [Google Scholar] [CrossRef] [Green Version]
- Martínez-Zarzoso, Inmaculada, Martina Vidovic, and Anca M. Voicu. 2017. Are the Central East European Countries Pollution Havens? The Journal of Environment & Development 26: 25–50. [Google Scholar] [CrossRef] [Green Version]
- Mosconi, Enrico Maria, Andrea Colantoni, Filippo Gambella, Eva Cudlinová, Luca Salvati, and Jesús Rodrigo-Comino. 2020. Revisiting the Environmental Kuznets Curve: The Spatial Interaction between Economy and Territory. Economies 8: 74. [Google Scholar] [CrossRef]
- Pablo-Romero, Maria Pablo, Luís Cruz, and Eduardo Barata. 2017. Testing the Transport Energy-Environmental Kuznets Curve Hypothesis in the EU27 Countries. Energy Economics 62: 257–69. [Google Scholar] [CrossRef]
- Pethig, Rüdiger. 1976. Pollution, Welfare, and Environmental Policy in the Theory of Comparative Advantage. Journal of Environmental Economics and Management 2: 160–69. [Google Scholar] [CrossRef]
- Sass, Magdolna, and Martina Fifekova. 2011. Offshoring and Outsourcing Business Services to Central and Eastern Europe: Some Empirical and Conceptual Considerations. European Planning Studies 19: 1593–609. [Google Scholar] [CrossRef]
- Shahbaz, Muhammad, Ilham Haouas, and Thi Hong Van Hoang. 2019. Economic Growth and Environmental Degradation in Vietnam: Is the Environmental Kuznets Curve a Complete Picture? Emerging Markets Review 38: 197–218. [Google Scholar] [CrossRef]
- Siebert, Horst. 1974. Environmental Protection and International Specialization. Review of World Economics 110: 494–508. [Google Scholar] [CrossRef] [Green Version]
- Siebert, Horst. 1977. Environmental Quality and the Gains from Trade. Kyklos 30: 657–73. [Google Scholar] [CrossRef]
- Stavropoulos, Spyridon, Ronald Wall, and Yuanze Xu. 2018. Environmental Regulations and Industrial Competitiveness: Evidence from China. Applied Economics 50: 1378–94. [Google Scholar] [CrossRef] [Green Version]
- Timmer, Marcel P., Erik Dietzenbacher, Bart Los, Robert Stehrer, and Gaaitzen J. de Vries. 2015. An Illustrated User Guide to the World Input–Output Database: The Case of Global Automotive Production. Review of International Economics 23: 575–605. [Google Scholar] [CrossRef]
- Tsagkari, Marula, Alexis Gaona, Juan-Felipe Gonzalez, and Jaakko Järvinen. 2018. The Evolution of Carbon Dioxide Emissions Embodied in International Trade in Poland: An Input-Output Approach. Environmental & Socio-Economic Studies 6: 36–43. [Google Scholar] [CrossRef] [Green Version]
- Zhao, Guomei, and Cenjie Liu. 2020. Carbon Emission Intensity Embodied in Trade and Its Driving Factors from the Perspective of Global Value Chain. Environmental Science and Pollution Research. [Google Scholar] [CrossRef]
- Zhao, Xiaomeng, Chuanjiang Liu, Chuanwang Sun, and Mian Yang. 2020. Does Stringent Environmental Regulation Lead to a Carbon Haven Effect? Evidence from Carbon-Intensive Industries in China. Energy Economics 86: 104631. [Google Scholar] [CrossRef]
Figure 1.
Intra-EU forward global value chains (GVC) participation as a percentage of total gross exports. EU28 countries. 2005 and 2015 See Appendix A for country codes list. Source: Own elaboration based on TiVA.
Figure 1.
Intra-EU forward global value chains (GVC) participation as a percentage of total gross exports. EU28 countries. 2005 and 2015 See Appendix A for country codes list. Source: Own elaboration based on TiVA.

Figure 2.
EU28 exports (extra and intra) and intra-EU forward participation. 2005 and 2015 (The value data are in millions of US$, the percentage data are calculated out of the total EU28 exports). Source: Own elaboration based on TiVA.
Figure 2.
EU28 exports (extra and intra) and intra-EU forward participation. 2005 and 2015 (The value data are in millions of US$, the percentage data are calculated out of the total EU28 exports). Source: Own elaboration based on TiVA.

Figure 3.
Emissions intensity (tonnes of CO2 per thousand dollars) of EU28 countries. 2005 and 2015. Source: Own elaboration based on TiVA and Eora26.
Figure 3.
Emissions intensity (tonnes of CO2 per thousand dollars) of EU28 countries. 2005 and 2015. Source: Own elaboration based on TiVA and Eora26.

Figure 4.
Evolution of GDP per capita (constant 2005 US$) and CO2 emissions in EU28 countries, 2005–15. See Appendix A for country codes list. Source: Own elaboration based on TiVA, Eora26 and the World Bank.
Figure 4.
Evolution of GDP per capita (constant 2005 US$) and CO2 emissions in EU28 countries, 2005–15. See Appendix A for country codes list. Source: Own elaboration based on TiVA, Eora26 and the World Bank.

Figure 5.
Evolution of domestic value-added per capita oriented to intra-EU forward participation in GVC (intra-EU DVAFP pc, US$) and CO2 emissions per capita related (intra-EU DVAFP pc, CO2) in EU28 countries, 2005–15. See Appendix A for country codes list. Source: Own elaboration based on TiVA, Eora26 and the World Bank.

Table 1.
Summary statistics of the variables.
| Variable | Mean | Median | S.D. | Min | Max |
|---|---|---|---|---|---|
| Ln(CO2) | 2.03 | 2.03 | 0.396 | 1.31 | 3.33 |
| GDP | 2.68 × 10⁴ | 2.04 × 10⁴ | 1.80 × 10⁴ | 3.52 × 10³ | 9.62 × 10⁴ |
| GDP2 | 1.04 × 10⁹ | 4.18 × 10⁸ | 1.41 × 10⁹ | 1.24 × 10⁷ | 9.26 × 10⁹ |
| DVAFP | 1.78 × 10³ | 1.08 × 10³ | 2.31 × 10³ | 123 | 1.50 × 10⁴ |
Note: “Ln(CO2)” refers to the CO2 emissions per capita (in log), “GDP” refers to the real GDP per capita, and “DVAFP” refers to the domestic value-added per capita oriented to intra-EU forward participation in GVC. Source: Own elaboration based on Trade in Value Added (TiVA), Eora26, and the World Bank.
Table 2.
Model estimation results of Pooled Ordinary Least Squares (POLS).
| Dependent Variable: ln(CO2) | ||
|---|---|---|
| Coefficient | p-Value | |
| β0 | 1.64987 (0.05258) *** | <0.0001 |
| GDP | 1.3081 × 10⁻⁵ (3.2043 × 10⁻⁶) *** | <0.0001 |
| GDP2 | −2.235 × 10⁻¹⁰ (6.8409 × 10⁻¹¹) *** | 0.0012 |
| DVAFP | 0.00014 (2.5485 × 10⁻⁵) *** | <0.0001 |
| R2 | 0.41 | |
| N. of observations | 308 | |
| N. of countries | 28 | |
| Period | 2005–2015 | |
Note: The terms in brackets correspond to the standard error. Signs “***” imply significance at 0.01. Source: Own elaboration based on TiVA, Eora26 and the World Bank.
Publisher’s Note: MDPI stays neutral with regard to jurisdictional claims in published maps and institutional affiliations. |
© 2021 by the authors. Licensee MDPI, Basel, Switzerland. This article is an open access article distributed under the terms and conditions of the Creative Commons Attribution (CC BY) license (https://creativecommons.org/licenses/by/4.0/).
Share and Cite
MDPI and ACS Style
Rodil-Marzábal, Ó.; Campos-Romero, H. The Intra-EU Value Chain: An Approach to Its Economic Dimension and Environmental Impact. Economies 2021, 9, 54. https://doi.org/10.3390/economies9020054
AMA Style
Rodil-Marzábal Ó, Campos-Romero H. The Intra-EU Value Chain: An Approach to Its Economic Dimension and Environmental Impact. Economies. 2021; 9(2):54. https://doi.org/10.3390/economies9020054
Chicago/Turabian StyleRodil-Marzábal, Óscar, and Hugo Campos-Romero. 2021. "The Intra-EU Value Chain: An Approach to Its Economic Dimension and Environmental Impact" Economies 9, no. 2: 54. https://doi.org/10.3390/economies9020054
Note that from the first issue of 2016, this journal uses article numbers instead of page numbers. See further details here.