
Simulating Agroforestry Adoption in Rural Indonesia: The Potential of Trees on Farms for Livelihoods and Environment


1
Institute for Environmental Economics and World Trade, Leibniz University of Hannover, Königsworther Platz 1, 30167 Hannover, Germany
2
Centre For International Forestry Research, Jalan CIFOR, Situ Gede, Bogor Barat, Bogor 16115, Jawa Barat, Indonesia
*
Author to whom correspondence should be addressed.
Land 2021, 10(4), 385; https://doi.org/10.3390/land10040385
Submission received: 15 March 2021
/
Revised: 30 March 2021
/
Accepted: 31 March 2021
/
Published: 7 April 2021
(This article belongs to the Special Issue Ecosystem Services, Sustainable Rural Development and Protected Areas)
Abstract
:In recent years, agroforestry has gained increasing attention as an option to simultaneously alleviate poverty, provide ecological benefits, and mitigate climate change. The present study simulates small-scale farmers’ agroforestry adoption decisions to investigate the consequences for livelihoods and the environment over time. To explore the interdependencies between agroforestry adoption, livelihoods, and the environment, an agent-based model adjusted to a case study area in rural Indonesia was implemented. Thereby, the model compares different scenarios, including a climate change scenario. The agroforestry system under investigation consists of an illipe (Shorea stenoptera) rubber (Hevea brasiliensis) mix, which are both locally valued tree species. The simulations reveal that farmers who adopt agroforestry diversify their livelihood portfolio while increasing income. Additionally, the model predicts environmental benefits: enhanced biodiversity and higher carbon sequestration in the landscape. The benefits of agroforestry for livelihoods and nature gain particular importance in the climate change scenario. The results therefore provide policy-makers and practitioners with insights into the dynamic economic and environmental advantages of promoting agroforestry.
1. Introduction
Agriculture is an ubiquitous interaction between humans and the environment and affects more natural resources than any other human activity [1,2]. As the world’s population grows, the agricultural sector experiences increasing pressure to produce higher quantities of food [3,4,5,6]. As a response to the rising demand for food, agriculture is intensified, which can result in soil quality deterioration, and expanded to forest landscapes [7,8,9]. The consequent deforestation causes loss of biodiversity and regulating ecosystem functions, and thereby aggravates the vulnerability of ecological systems [10,11]. Furthermore, climate change exacerbates this ecological vulnerability and threatens agricultural productivity due to rising temperatures, drought-related stress, and changes in precipitation patterns [12,13]. Hence, producing food for a growing population while combating climate change at the same time poses a major challenge for agriculture and requires sustainable agricultural practices such as organic farming, sustainable intensification, agroecology, and nature-inclusive agriculture [14,15,16,17].
Another sustainable agricultural practice is agroforestry [18]. The Food and Agriculture Organization (FAO) defines agroforestry as the “use of trees and shrubs as part of an agricultural system” [19]. Agroforestry presents a promising approach to protect agricultural production and enhance farmers’ resilience to climate risks, especially in tropical regions, because it offers numerous economic and environmental benefits [6,12,20,21,22]. As a mixed tree-crop practice, agroforestry provides ecosystem services such as generation of food and non-food products, regulation of nutrient and hydrological cycles, prevention of soil erosion, and carbon sequestration [23,24,25,26,27]. The emerging benefits of agroforestry affect the small-scale level up to regional and even global scales [28]. As a result, synergies between ecosystem service provision and income opportunities make agroforestry systems a powerful solution to simultaneously counteract deforestation, protect livelihoods, alleviate poverty, and mitigate climate change [28,29,30,31]. Yet, despite the diverse benefits highlighted by research, in many regions agroforestry adoption by small-scale farmers remains low [32].
A number of studies have investigated the determinants leading to agroforestry adoption in developing countries. According to the literature, socio-economic household characteristics such as gender, education, household size, wealth, and farm size influence adoption [33,34,35]. Famers’ risk aversion and time preference also impact implementation [36,37,38]. Further determinants include topography [39], biophysical factors like soil fertility [40], and country-specific effects [41], which indicates the importance of institutions who provide extension services and access to information and materials [42,43,44]. Subsequent to agroforestry adoption by farmers, further studies have contributed to the literature by investigating tree, soil, and crop interactions either through agroforestry experiments on-farm and on-station [45,46] or via simulations [26,47] showing either competitive, complementary, or balanced interaction between trees and crops. Complementing purely econometric or biophysical studies, a few applications combine behavioral and ecological aspects of agroforestry adoption. Addressing both individual decision making and environmental aspects, Magcale-Macandog et al. (2007) implemented the companion modelling approach to investigate the effects of market information, neighbors, and the establishment of a tree seedling nursery on agroforestry adoption in the Philippines [48]. Villamor et al. (2013) applied the land-use dynamic simulator for spatial-temporal simulations of coupled human-landscape systems to examine the effectiveness of payments for ecosystem services to keep rubber agroforests from conversion into monoculture plantations in Indonesia [49]. In contrast, Smajgl et al. (2015) use agent-based simulations to assess outcomes of payment for ecosystem services to encourage conversion of rubber monoculture to rubber agroforestry in China [50]. Suwarno et al. (2018) developed an agent-based model to explore how different forest moratorium policies impact land-use decisions and resulting area under agroforestry in Indonesia [51]. Overall, many studies point out the high potential for sustainable development related to trees on farms, but the majority of these studies employ econometric approaches or focus on biophysical processes. Research taking the dynamic interplay between individual adoption decisions and their environment or larger temporal and spatial scales into account remains limited. Yet medium- and long-term research integrating ecological and behavioral components to investigate the synergies and trade-offs of agroforestry adoption over time is essential for sustainable land management [18,41,52,53].
To contribute to a better understanding of environmental and economic interrelations of agroforestry systems, this study provides a simulation model of agroforestry adoption that links behavioral and environmental system dynamics under climate change. Specifically, the model investigates: (1) small-scale farmers’ agroforestry adoption decisions; (2) their consequences for livelihoods; and (3) their effects on biodiversity and carbon sequestration over time and space. The model aims to support policy-makers and practitioners to assess the potential of agroforestry as an option to strengthen local livelihoods and simultaneously mitigate climate change. As a decision support tool, the model is designed to raise awareness and motivate policy makers to provide supporting measures to increase agroforestry adoption. The research is adjusted to a case study in rural West Kalimantan, Borneo, Indonesia. The study area is located within a corridor between two national parks, which are considered biodiversity-hotspots [54]. In this remote region, traditional jungle rubber systems and rice in shifting cultivation prevails. However, the government promotes the transition to rubber monoculture, creating pressure on the traditional way of life of the indigenous communities. At the same time, the threat of land use change due to encroachment of rubber and oil palm monocultures has been highlighted for years (see for example [55,56,57,58]). According to calculations by Barnes et al. (2014), the transition to rubber and oil palm monocultures has serious consequences for biodiversity and ecosystem functioning [56]. In addition to agricultural intensification and expansion, the loss of forest and native species, as well as climate change, aggravate the local farmers’ vulnerability [59,60,61]. Thus, timely interventions are needed to support preferred local livelihoods and increasing income at the same time. Therefore, the present analysis focuses on agroforestry systems combining illipe nut (Shorea stenoptera Burk) and rubber (Hevea brasiliensis (Willd. ex A.Juss.) Müll.Arg.) trees [62]. Whereas rubber plants are widely established in the area, cultivation of illipe nut trees in these agroforestry systems poses a noteworthy addition to the local agricultural systems in West Kalimantan [63,64]. The tengkawang tree (Shorea stenoptera) of the Dipterocarpaceae family, which the International Union for Conservation of Nature has listed as near threatened and which occurs naturally in that area, offers the potential to generate cash income (selling raw nuts or oil extracted from them) and provides various ecosystems services such as biomass accumulation and carbon sequestration [62,65]. Additionally, the high forest canopy cover connects forest habitats and thereby enables movement of local flagship species such as the orangutan [66,67,68]. Thus, illipe rubber agroforests gain particular appeal in the study area to conserve biological diversity, but also to mitigate and adapt to the mentioned challenges prevailing in the area. To explicitly model the decision-making process of small-scale farming households and connect human and ecological dynamics over larger spatial and temporal scales, we developed an agent-based model (ABM). The implemented ABM compares different scenarios. The first scenario describes the agricultural practices prevalent in the study area, which focus on rice cultivation in swidden agricultural systems and jungle rubber cultivation, without any intervention (business as usual (BAU) scenario). The BAU scenario is compared to a scenario where illipe nut trees and rubber are developed into agroforestry as an innovative alternative that offers potential for additional income and livelihood diversification. Furthermore, a climate change scenario with a rise in temperature of 1.5 °C was simulated consistent with the climate targets according to the Paris Climate Agreement, which is expected under the Representative Concentration Pathway 2.6 [69,70]. The simulations demonstrate that farmers who decide to adopt agroforestry increase their income while diversifying their livelihood portfolio. Additionally, the model predicts higher biodiversity levels and improved carbon sequestration in the landscape as a consequence of agroforestry adoption. The benefits of agroforestry for livelihoods and nature will gain particular importance if temperatures rise.
2. Materials and Methods
2.1. Study Site
The research is based on a case study in Kapuas Hulu regency, West Kalimantan, Indonesia (Figure 1). Batang Lupar district in Kapuas Hulu was selected as a study site because it represents a landscape that is still traditionally managed, and its Leboyan River watershed directly impacts the Danau Sentarum National Park wetlands. Located in close proximity to the equator, the regional climate exhibits equatorial characteristics with high amounts of rainfall throughout the year (average of 4154 mm per year) and a mean temperature of 27.2 °C [71]. Due to the diverse forest types and their roles for the hydrology of the Kapuas River basin, the Danau Sentarum National Park (south) and Betung Kerihun National Park (north of the study area) were established [63,72].
The inhabitants consist in large part of Dayak ethnic groups in the hilly interior, whose livelihoods are traditionally swidden agriculture systems, and Malay along the rivers and in the wetlands, who live mainly on fisheries [73]. Like elsewhere in Southeast Asia, rice plays a central element for local livelihoods as a subsistence crop, and the Dayak traditionally practice slash and burn cyclic agriculture to grow rice [74]. Rubber was first introduced in Borneo at the beginning of the 20th century and was adopted rapidly by farmers [75]. For generating cash income and as a safety net, rubber remains very popular in the study area [63,76]. Despite a positive trend in recent years, low education levels and poor infrastructure persist in the area, and with a Human Development Index of 67.65 in 2019 the study area belongs to the less developed provinces in Indonesia [63,72,73,77]. Given the traditionally close link to agriculture, the challenged livelihood situation, and the location in the buffer zone between two national parks, agroforestry systems pose a promising approach to create economic development and protect natural resources in Kapuas Hulu [63,78].
2.2. Data
Within Batang Lupar district, ten settlements consisting of at least ten households were randomly chosen for the study. Within each settlement, all households were selected for the survey, comprising a total sample of 139 households interviewed, out of which one had to be excluded from the analysis due to missing data. The socioeconomic survey took place in the period from May until September 2014. The interview contained segments on demographics, assets, financials, food security, agricultural activities, use of natural resources, and social networks, amongst other [72]. Furthermore, remote sensing data for the year 2014 and data describing the landscape collected using an unmanned aerial vehicle (UAV) for the years 2016 and 2017 were collected [72]. Ecological indicators to estimate biodiversity and carbon sequestration include tree species biomass, and species richness and Fisher’s alpha, which is a logarithmic series model to describe the number of species and the number of individuals within those species independent of sample size, for trees and bird species richness [72,79]. The data collection was based on equally-stratified sampling of the vegetation units in the study area. To investigate tree biodiversity, plots (20 m × 20 m) were laid out, recording trees with Ø ≥ 5 cm for each vegetation type. The bird survey, which took place in November and December 2016, included point count recordings and mist net monitoring [72]. Further details regarding data collection and calculation of the biodiversity and carbon indicators can be found in Laumonier et al. (2020).
2.3. Agent-Based Model
An agent-based model was adjusted to the case study area. The following section, which describes the model, follows the Overview, Design concepts, Details (ODD) protocol [80,81,82]. The model was implemented using NetLogo 6.1.1 [83].
Purpose
The Simulating Agroforestry Adoption in Rural Indonesia (SAFARI) model is used to explore the adoption of illipe rubber agroforestry systems by farming households in a case study region in rural Indonesia. Thereby, the ABM simulates the interdependencies of agroforestry systems and local livelihoods, income, land use, biodiversity, and carbon sequestration. The model contrasts development paths without agroforestry (BAU), corresponding to prevalent practices in the study area, to a scenario that introduces an illipe nut tree (Shorea spp.) mix with rubber in an agroforestry system (IRA scenario) as an alternative. It aims to support policymakers to assess the potential of IRA over larger temporal and spatial scales.
State variables and scales
The SAFARI model comprises two agent types: farming households and landscape patches. The farming households are the primary decision-making units in the model. They are characterized by state variables indicating their location, household size and resulting energy requirement, labor force, and further variables related to their agricultural activities as displayed in Table 1. Livelihood indicators show whether the households engaged in rice or jungle rubber farming, agroforestry cultivation, and illipe processing. The variable food-insecure indicates whether a household has failed to meet its minimal energy requirement. Income indicates household wealth. Decision making follows a bounded rationality approach including a satisficing heuristic based on if-then-else statements.
Landscape patches, the other agent type, represent the spatial environment of the model. They describe the land use and resulting vegetation cover as Table 2 presents. Based on patch class, vegetation, fallow age, and the resulting fertility are derived. Fertility is used as an input to calculate yields. Associated to the specific uses, patch variables indicate carbon sequestration and biodiversity indicators, namely tree species richness, tree Fisher’s alpha, tree density and basal area, as well as bird richness. The agents are parameterized according to survey and GIS data as well as ecological indicators. One patch agent represents an area of 100 × 100 m resulting in a total area of about 28 × 44 km covered.
Process overview and scheduling
The model proceeds in annual time steps, and simulations were run for 60 years, with 40 repetitions for each scenario. Within each time step, six modules are processed in the order corresponding to Figure 2. Within each module, the agents conduct the respective processes in a random order.
Design concepts
Basic principles: Given the limited cognitive abilities of humans, farming households are assumed to follow a satisficing approach based on the concept of bounded rationality [84,85]. The landscape patches follow transition rules and are impacted by the farmers’ land use decisions.
Emergence: Livelihood decisions determine land use, which in turn influences the development of land cover and future livelihood decisions. Thus, landscape dynamics emerge from the interaction between patches and farming households.
Adaptation: Farming households adapt by taking past agricultural decisions and their subsequent situation in the present into account when deciding about livelihoods to fulfill caloric requirements.
Fitness: Fitness-seeking is modelled as the objective to fulfil caloric needs as part of a satisficing procedure. As a secondary objective, households invest the excess labor to generate cash income.
Sensing: Farming households know their own characteristics such as household labor, agricultural activities, and so on. Furthermore, they are aware of the land use and which patch has been claimed by a household. Households also know about the labor requirements of each agricultural activity and market prices of the outputs.
Interaction: Interaction between households takes place indirectly through competition for land.
Stochasticity: Agents perform the procedures in random order. The location of claimed plots contains stochastic elements. The initialization procedure comprises random elements with respect to the location of farms, initial cultivation of rice and rubber, vegetation, fallow length, and hence fertility, whose initialization values are drawn from random distributions.
Observation: The main simulation outcomes computed every time step include livelihood choices, income generation, land cover, carbon sequestration, and biodiversity indicators. Regarding the latter, bird species richness and Fisher’s alpha for trees signify the respective biodiversity levels. Additional biodiversity indicators reflecting further aspects of biodiversity include tree density, basal area, and tree species richness.
Initialization
The farming households are initialized according to a household survey. Specifically, their original farm size, number of (cultivated and fallow) plots, labor force, and location are directly derived from the survey data and are thus household-specific. Locations of plots are assigned randomly, but within a certain radius that corresponds to maximum distances between households and plots derived from the survey. Cultivation of rice and jungle rubber is probabilistic with likelihoods corresponding to the share of households engaging as indicated in the survey (23% and 76%, respectively). Other land uses originate from GIS data. The setup of the biodiversity and carbon indicators is based on local data collection [86] as presented in Table 3. Fallow age is random and corresponds with vegetation. Fertility equals the fallow age.
Input
Data input is used for the initialization of the model; household survey data indicates household composition and energy requirements as described in Table 1. GIS data provide information to setup the landscape agents [86]. The input for the biodiversity indicators and carbon sequestration origins from data collection on site [72]. Further inputs used include costs and benefits of the livelihood activities. The labor inputs originate from Suyanto et al. (2009). Labor inputs for trees are adjusted to account for the duration until trees reach maturity; accordingly, rubber is assumed to require 52 labor days per person per hectare in the first year, 26 in the years 2–5, and 99 afterwards as input [87]. Illipe nut trees are assumed to require the same amount of labor input as rubber trees. However, after illipe nut trees mature at the age of eight, 99 labor days per person per hectare are only required every four years, when the illipe nut trees can be harvested. In the other years, 26 labor days per person per hectare are assumed to be required for maintenance. 20 labor days per person are assumed as input for illipe nuts processing. Whereas for rice a yield function following Jepsen et al. (2006) is used, annual outputs for rubber and illipe rubber system follow Winarni et al. (2017) and Wulan et al. (2006) [62,88,89]. Furthermore, rice is assumed to provide 1650 kcal per kg. The cost of 1 kg of rice is 10,000 IDR, and the price for rubber is 6500 IDR per kg according to the survey and Winarni et al. (2017) [62]. Illipe nuts cost 7000 IDR per kg [62,90]. Regarding processing, about 5 kg of raw illipe nuts yield up to 1 kg fat, which can be sold for about 100,000 IDR [91].
Submodels
Calculate energy requirements
As the first step of each simulation run, the households calculate their energy requirements based on the household size in adult equivalents [92]. For every adult equivalent, a minimum consumption corresponding to the average caloric consumption (1935 kcal per person per day) from Kalimantan in 2015 [93] as the aspired consumption threshold is assumed. During the same step, variables such as energy consumption are reset to zero.
Calculate expected harvest
Then, households estimate their expected harvest. Households may have engaged in agricultural cultivation in previous seasons and take the expected yields into consideration for their livelihood decisions in the current year. This includes rice from swidden fields in the second year as well as rubber and illipe nut yields. Thereby, mature illipe nut trees can be harvested only every four years, whereas rubber in the agroforestry systems can be harvested every year once the trees mature. Rice yields are calculated following a yield function of Jepsen et al. (2006) calibrated to the study region
with a = 783.7, b = 8.07, c = 0.52, and x = fertility [88]. During the second year of swidden agriculture, the rice yield is assumed to be 50% of first-year-yields. Because the farmers anticipate these yields, they plan accordingly and allocate labor to the respective harvesting activities, which is thus subtracted from the available labor force.
Livelihood decisions
Based on expected harvest, households make decisions about additional livelihood activities in the current period. Given the cost of searching and comparing alternative actions combined with limited cognitive and computational abilities of humans, a bounded rationality approach including a satisficing heuristic was applied to simulate farmer decision making [84,94]. A decision tree represents decision making as a series of if-then-else statements, as illustrated in Figure 3. The baseline scenario considers rice and jungle rubber, which are the main livelihood activities in the study area. The respective decisions depend on caloric needs and resource availability. Farming households prioritize to fulfill their caloric needs, which represents the aspiration threshold, through rice planting before engaging in market production of rubber [95,96]. If the households have claimed available plots, they choose to plant rice on the plot with the longest fallow age, which represents a preference for clearing secondary fallow over primary forest [97]. Only if no such plot exists, then the household decides to clear an unclaimed plot through slash and burn, located within a radius of six kilometers, to plant rice there. The household continues planting rice until the caloric needs are expected to be satisfied. The maximum area for clearing unclaimed areas is set to four hectares per period. Once the harvest meets the caloric requirements, the households check whether they have more labor available. If that is the case, they engage in rubber tapping and maintenance. If still more labor is available, they decide to plant additional jungle rubber as a cash crop. The maximum amount of rubber is restricted to 1.2 ha, in line with survey results.
Extending the baseline scenario, farmers have the option to additionally plant illipe trees mixed with rubber agroforestry on their plots on riverbanks as an option to generate cash income (Figure 4). First, they harvest illipe nuts if it is possible in that season. Then, consistent with the baseline scenario, households aim to fulfill caloric requirements through swidden agriculture on already claimed or newly cleared plots. When the expected yields suffice to ensure food security, rubber has been tapped, and more labor is available, the households check whether they have fallow plots in proximity to a river available. If they do not, they plant jungle rubber on another plot. If they do, they cultivate IRA on that plot. If still more labor is available to the household during an illipe nut harvesting season, they process the illipe nuts into fat.
Harvest
After household decisions are made, the households harvest their plots. As the illipe nut tree produces yield approximately every four years depending on weather conditions, illipe nut harvest is assumed to occur every four years for all trees simultaneously [98]. In contrast, rubber (jungle rubber or as part of IRA) can be harvested every year. The households accumulate the calories and cash income generated from their livelihood activities. If a household is not able to produce the required calories, it is marked as food insecure.
Update of variables and charting
Update of the farmers includes the number of farmers who chose the respective livelihoods, mean caloric consumptions, and income. Furthermore, number of plots claimed, fallow plots and plots cultivated, total farm size, and the share of plots with agroforestry are updated. Besides, the number of landscape agents with the various vegetation classes, mean biodiversity indicators of the patches, and carbon sequestered according to the land use are calculated.
Vegetation transition
As the last step of the modelling cycle, the vegetation classes undergo transition dependent on their fallow age and use according to the swidden agriculture cycle (Figure 5).
Before farmers can cultivate plots, they need to clear them through slash and burn activities. Rice planted on cleared (swidden) fields also provides yield in the second year after planting, when weeds grow on the fields as well. In the consecutive periods, the fields lay fallow to regenerate their fertility until the farmers decide to clear and cultivate them again. During that fallow period, plots transition from young fallow to old fallow to secondary forest unless they are cleared (Table 4). Also patches with forest vegetation can be cleared for rice cultivation through slash-and-burning.
To represent the fertility and vegetation on the swidden fields, fallow age, vegetation, and fertility increase by one during every time step except when the plot is cleared. In that case, fallow age and vegetation are reset to zero. Only fertility, whose maximum value is restricted to 12, is not reset until the harvest is completed because it is needed to calculate the yield since fertility improves output. For vegetation, a maximum of 30 is assumed. With increasing fallow length and change in vegetation, the biodiversity indicators are also modified, corresponding to the respective land use as indicated in Table 3. Lastly, rubber trees exceeding the age of 25 are assumed to die and be replaced. Illipe trees can reach the age of 99 years, which is longer than the simulated time span and thus is not considered in this context.
Climate change scenario
Extending the model, a climate change scenario (CCS) was introduced. This scenario simulates a pathway consistent with the climate goals of the Paris Climate Agreement to restrict temperature rise to 1.5 °C above preindustrial levels [70]. This stringent mitigation scenario corresponds to the temperature change expected under Projected Concentration Pathway 2.6 [69]. In the model, the resulting change in temperatures is assumed to lead to decreases in rice yields of 12.6% [99].
Calibration
Regarding livelihood choices, the model parameters were adjusted according to the survey data. The spatial landscape is based on GIS data and ecological indicators collected in the study area. The calibration of the yield function is based on UAV data. As the UAV data comprises information for the several years, the first year was used for calibration, whereas the validation used the following period.
Verification and validation
Verification to assess the accuracy of the programmed model was carried out through a careful scan of the model code. Verification further included the testing of certain cases such as extreme points [100]. Validation to demonstrate the model’s consistency with the intended application was based on the indirect calibration approach [101]. First, patterns regarding the livelihood portfolio, e.g., rice and rubber cultivation, which the model aimed to reproduce, were defined. Then, the model modules including the decision-making processes and vegetation transition were developed according to stakeholder and expert opinions. Third, the empirical evidence on the livelihood patterns provided through the survey and UAV data was used to restrict the parameter space and initial conditions (see calibration). Besides, the decision rules were evaluated. Comparing the model outputs with collected land cover data demonstrates only minor deviations between simulated and observed data (land cover with rice and rubber patches around 1% and 5% deviation, respectively). The adjusted model was then used to derive further insights [101].
Data analysis
The analysis of simulation results includes the comparison of scenarios with and without IRA. Additionally, a climate change scenario is contrasted to a scenario without temperature rises. The scenarios were compared by applying t-tests using Stata 14.2 [102]. To check for robustness, Wilcoxon-Mann-Whitney-tests were also performed.
3. Results
The following chapter presents the descriptive findings of the survey and simulation results related to farmers’ adoption and income, land use change, and ecological indicators.
3.1. Descriptive Results
The subsequent section presents selected descriptive findings of the study area. In line with official statistics [103], the survey results show that high poverty, low education levels, subsistence farming (mainly rice), and rubber cultivation for cash income prevail in the study area.
About 36% of the household heads, who are predominantly male, are unable to read and write, and about 75% of household heads did not receive education after primary school. Most of the households have an acceptable food consumption score, about 24% fall into the category of borderline food security, and 1% suffer from poor food security. Regarding the household dietary diversity score, households on average reported a score of 13.40. The yearly household income of 9,503,805 IDR corresponds to approximately 690 US Dollars per year. The Progress out of Poverty Index of 82.73 denotes the likelihood of a household living on less than 2.50 US-Dollars per day. Income diversification is rather low, as the average Simpson index of income diversification of 0.25 shows with about 70% of the households relying on one income source exclusively. In that area, all households heavily depend on agriculture for their livelihood, as the high proportion of income from farming shows (Table 5).
On average, farmers claim 14.45 hectare of land distributed over approximately seven plots, out of which about one third are cultivated (Table 6). Nearly all of the plots are owned without an official title (98%). The majority of households (76%) engage in rubber cultivation. Livestock is not common in the area, as over 70% of the households report no livestock, and the average ownership amounts to 0.07 tropical livestock units.
3.2. Simulation Results
The following section presents the simulation results of the SAFARI model, which compares the business as usual and illipe rubber agroforestry scenario as well as the climate change scenario.
3.2.1. Agroforestry Adoption and Income Effects
One main simulation outcome is the farmers’ livelihood choice. The simulations demonstrate that hill rice farming plays an essential role for the population, as illustrated in Figure 6. Conforming with the decision-making heuristic, all farmers cultivate rice on fallow plots in the BAU scenario. However, if the opportunity to adopt IRA exists, only 88% of the farmers engage in rice cultivation as part of a swidden agricultural system, which poses a significant difference between the IRA and the BAU scenarios (p = 0.000). In addition to rice, rubber as a cash crop is an integral part of the rural farming livelihoods. Again, in line with the decision heuristic, all farmers engage in jungle rubber farming in the BAU scenario, but significantly fewer farmers (69%) plant jungle rubber in the IRA scenario (p = 0.000). With respect to agroforestry, the IRA scenario exhibits high adoption rates with 99.6% of the farmers implementing IRA to generate additional cash. Thereby, the majority of farmers reduce their labor input for rice and jungle rubber cultivation in favor of the illipe tree mixed with rubber type of agroforestry implementation. They still engage in swidden agriculture and agroforestry simultaneously to create diversified livelihood portfolios. Particularly, in the years before the first agroforestry harvest and in the periods when illipe nuts cannot be harvested, farmers increase their labor input for rice cultivation. According to the simulations, 27% of farmers who cultivate IRA process illipe nuts into fat in the years of harvest.
Based on the farmers’ livelihood decisions, the simulations reveal changes in rice consumption and cash income (Figure 7 and Figure 8). As IRA adopters reduce their labor input for rice cultivation, the calories available through rice cultivation decrease significantly from 2121 kcal available per person per day on average in the BAU scenario to 1009 kcal in the IRA scenario (p = 0.000). In contrast, cash income greatly increases in the IRA scenario compared with the BAU scenario (p = 0.000), enabling farmers to buy rice for example. Thereby, illipe nuts from agroforestry contribute to income to the largest extent with 84% and with a positive trend over time, as Figure 8 shows the development for the years 1–20, 21–40, and 41–60. The notable difference in incomes gives an indication about the potential of agroforestry to increase wealth and alleviate poverty. Generally, food insecurity is not a severe problem.
3.2.2. Land Use Changes
In accordance with the farmers’ livelihood choices, the land use and land cover shift. Subsequently, the area under illipe rubber agroforestry rises strongly in the IRA scenario up to 27.8% of the whole area (p = 0.000). In contrast, the area under jungle rubber cultivation is replaced and decreases from 5.5% in the BAU to less than 1% in the IRA scenario (p = 0.000). Also, the area under rice decreases significantly from 7.9% in the BAU scenario by more than half in the IRA scenario (p = 0.000). The changed land use in the IRA scenario allows the farmers to increase the fallow age of their swidden agriculture plots, which is reflected by the proportionally lower number of young fallow plots (p = 0.000) in the IRA scenario, but relatively higher number of old fallow plots (p = 0.000). The longer fallow periods in the agroforestry scenario affect plot fertility positively (p = 0.000), which in turn enhances rice yields. Secondary forest covers about 58.3% of the land in the BAU scenario and significantly decreases to 48.9% if agroforestry is introduced (p = 0.000). The area under natural forest cover amounts up to about 12.2% and does not differ significantly between the BAU and IRA scenarios (p = 0.9948). Figure 9 illustrates that the strongest change takes place shortly after introducing agroforestry, but also long-term effects can be expected.
3.2.3. Effects on Biodiversity Conservation and Carbon Sequestration
In addition to livelihood choices and land cover, the model simulates ecosystem changes. The simulations indicate that agroforestry provides a range of environmental benefits. Agroforestry adoption and the related changes of land use significantly improve biodiversity. Specifically, Fisher’s alpha increases by 18% (p = 0.000) in the IRA scenario, and bird richness rises by 4% (p = 0.000), as illustrated in Figure 10. Biodiversity is particularly high in native and secondary forests, but also agroforests maintain a comparatively high level of biological diversity. In contrast, biodiversity is rather low in rice plots. The results of tree species richness, tree density, and basal area confirm the results and are presented in the Appendix A.
In addition to biodiversity, the SAFARI model also simulates changes in aboveground biomass and hence carbon sequestered in the landscape. The results reveal that carbon fixed in the IRA scenario significantly exceeds the amount sequestered in the BAU scenario by 25% (p = 0.000) with a positive trend over the years as displayed in Figure 11. Land uses with high biomass and thus carbon sequestration potential include natural and secondary forests as well as agroforests, but jungle rubber plots also store a certain amount of carbon.
3.2.4. Climate Change Scenario
Complementing the baseline scenario with constant temperatures, the model further simulates a climate change scenario with a temperature rise of 1.5 °C. As a result of the increased temperatures and consequently reduced rice yields in the CCS, farmers adapt their livelihood choices. Whereas the total number of rice and jungle rubber farmers remains constant in the BAU scenario, farmers react by adjusting the extent to which they engage in these livelihoods. In the BAU scenario, farmers expand their rice production (p = 0.000) at the cost of jungle rubber cultivation, which consequently declines (p = 0.000), thus shifting their focus away from cash crops to subsistence agriculture as a response to climate change. Yet, the expansion of rice cultivation does not compensate for the yield reduction, and overall climate change results in less calories provided through rice cultivation in the BAU scenario (p = 0.000). When the option of agroforestry exists, the simulations indicate that farmers react to climate change by also increasing their rice production (p = 0.000), but do not fully compensate yield reduction lowering overall calorie availability from rice cultivation as well (p = 0.0013). Simultaneously, farmers expand the share of land under agroforestry (p = 0.0121) and slightly more farmers establish agroforestry systems (p = 0.7825). Consequently, income from cash crops is significantly higher in the IRA scenario compared with the BAU scenario under climate change (p = 0.000), implying that agroforest expansion poses a coping strategy towards climate change.
Rising temperatures and the resulting changes in livelihoods and land use also have environmental consequences. Biodiversity declines due to climate change and resulting livelihood decisions as shown by significant reductions in Fisher’s alpha for trees (BAU: p = 0.000; IRA: p = 0.0050) and bird richness (BAU: p = 0.0000; IRA p = 0.000). Although climate change affects biodiversity negatively, the simulations predict significantly higher biodiversity levels in the IRA scenario than in the BAU scenario (p = 0.000 for Fisher’s alpha, p = 0.000 for bird richness). Hence, adjusted livelihood choices due to climate change cause lower biodiversity, but agroforests play an important role in conserving biological diversity, especially under climate change. The other biodiversity indicators basal area, tree density, and tree species richness confirm the results that climate change reduces biodiversity due to land use changes in both scenarios, but less so in the agroforestry scenario. Carbon sequestration remains constant in the IRA scenario compared to the BAU scenario, despite rising temperatures (p = 0.9330). Appendix A contains illustrations of these results.
4. Discussion
The following section discusses the simulation results regarding adoption rates and income development, land use change, biodiversity conservation, and carbon sequestration.
4.1. Agroforestry Adopters Diversify and Increase Their Income
The simulation results demonstrate high IRA adoption rates amongst farmers. While combining it with jungle rubber and rice cultivation, farmers integrate illipe nut and rubber agroforestry into their livelihood portfolios. Although agroforestry has a higher net present value and cost benefit ratio than swidden agriculture [104], preserving shifting cultivation as an additional livelihood option offers certain advantages; traditional subsistence farming ensures access to the respective commodities and poses a strategy for protecting livelihoods from price fluctuations [87,105]. Besides, combining annual food crops such as rice with agroforestry can bridge the relatively long investment period associated with trees [96,106]. The simulations show that farmers rely on rice cultivation for consumption in the time before the first agroforestry harvest and, to some extent, in the periods when illipe nuts cannot be harvested. Furthermore, subsistence farmers who engage in agroforestry diversify their risk and thus enhance their resilience, as the climate change scenario also demonstrates [96].
The simulation results of the IRA scenario further indicate strong increases in cash income as a result of agroforestry adoption. Several studies highlight that financial outcomes are major benefits of agroforestry, motivating farmers to plant trees on their farms [41,43,107,108]. Agroforestry may even lift poor households out of the poverty cycle [43]. Other studies point out that agroforestry further impacts food security, either indirectly through increased income or directly through self-consumption [3,4,109]. As illipe nuts and rubber are cash crops, they provide additional income sources for rural farmers that can be utilized to improve food security, for example to overcome rice shortages [18,110]. However, illipe nut trees do not flower every year, which limits their income generation potential [98]. Yet, during harvest season, yields are abundant, and in non-harvest years, farmers can profit from the rubber planted in the agroforestry systems [62,98]. According to the simulation results, the positive income effect of agroforestry prevails over several decades and even increases in the long-term. Overall, synergies between rice farming and agroforestry in a diversified portfolio contribute to long-term livelihood improvement and poverty alleviation.
4.2. Illipe Rubber Agroforestry Replaces Jungle Rubber and Rice Cultivation and Thereby Impacts Deforestation
The simulation results regarding land use give an indication of how farmers’ agroforestry adoption transforms the landscape. According to the results, the area covered by agroforests significantly increases. In contrast, jungle rubber and rice farming become less popular as land uses in the IRA scenario. While agricultural activities and rice cultivation are significant drivers of tropical deforestation [9,61,111], agroforestry can offer high potential to reduce forest loss [3,23]. If agroforests are established on fallow land, as in our site, they rehabilitate formerly forested open land [112]. Furthermore, agroforestry adoption indirectly impacts deforestation because agroforestry adopters clear less land than purely swidden farmers [104]. Thus, although agroforests cover a relatively large share of the landscape, the simulations show that the native forest area remains constant under the IRA and BAU scenarios. Thereby, the results highlight the potential of agroforestry to significantly enhance livelihoods without causing forest loss.
4.3. Agroforestry Supports Biodiversity Conservation and Carbon Sequestration
With respect to biodiversity conservation, the model shows that agroforestry adoption improves tree and bird biodiversity levels. Our results confirm several studies which show that agroforestry protects biodiversity, as demonstrated by increased species richness [67,113], species diversity [2,27,108,114], or species density [20,115]. Thereby, biodiversity-supporting agroforests provide a high-quality habitat with stable conditions outside formally protected areas [96,116]. Some authors argue that biodiversity levels in tropical agroforests are comparable to native forest, although species composition differs [114,117]. However, our model suggests that the potential of agroforests to conserve biodiversity is limited as they cannot fully replace native forests and habitats [20]. The extent to which agroforestry systems conserve biodiversity possibly depends on their structural and floristic characteristics and connectivity to natural forests. Consequently, incorporating native forest trees with high canopy cover, such as the illipe nut tree, are favorable to maintain high bird species richness for example [67,114]. Although agroforests might not achieve the same level of species richness as forests and comprise distinguished species compositions, these systems nevertheless result in greater biodiversity compared with otherwise open land [67,116]. Accordingly, agroforestry implemented on former fallow land as in our site affects biodiversity positively. Agroforests also indirectly benefit biodiversity by reducing the need for conversion of forests into cropland [11,20,118]. Furthermore, by connecting areas of natural habitats, agroforestry plays a key role for biodiversity conservation in human-dominated landscapes [20,67,119]. In this way, agroforests ensure persistence and movement of wild species across landscapes, and hence gain special appeal in buffer zones or biological corridors such as the study area [20,67,116,117]. For example, agroforests in Batang Lupar district can contribute to biodiversity conservation through their canopy cover, which supports local orangutan species to move between the adjacent national parks [66,67,68].
Additional to biodiversity, agroforestry adoption enhances long-term carbon sequestration in the landscape according to the model findings. The simulation results comply with many studies which point out the high potential of agroforests to increase biomass and thereby accumulate carbon leading to long-term climate mitigation [24,27]. Whereas Abbas et al. (2017) find agroforestry to reach carbon levels comparable to natural forests, Matocha et al. (2012) conclude that agroforests fix less carbon than primary forests. However, compared with crop and grazing land use, whose carbon stocks are low, agroforestry systems retain much higher quantities of carbon in above and belowground biomass [24,112]. Consequently, similar to biodiversity conservation, net benefits of agroforestry may depend on the location [112]. Agroforests implemented within forests may cause degradation, but realize net benefits if cultivated on open land as an alternative to cropland, pasture, or fallow [112,120]. In addition to direct carbon sequestration, agroforestry poses an alternative to agriculture, which is the second largest source of anthropogenic greenhouse gas emissions [9,61,111]. Therefore, as agroforestry reduces the need for deforestation, shown by the changed land use and cover according to the simulations, it also indirectly contributes to carbon sequestration [24,120]. In sum, agroforestry poses a powerful pathway to conserve biodiversity and mitigate climate change through carbon accumulation [3,23,24].
4.4. Agroforestry as a Means to Adapt to and Mitigate Climate Change
The simulations of the climate change scenario indicate that rising temperatures endanger agricultural production and farmers’ wealth with negative impacts on ecosystem services. Several studies confirm that climate change is a significant and growing threat to livelihoods and particularly food security [13,121,122]. The simulation results further show that significantly higher incomes can be expected in the IRA scenario compared with the BAU scenario under climate change. These results conform with other studies’ findings that agroforests enhance the ability to adapt to market and climate shocks as diversification through trees helps to spread risk [18,96]. This result gains special importance for subsistence farmers in developing countries. These farmers are particularly vulnerable as they frequently lack assets and flexibility to cope with the impacts that climate change has on agricultural productivity [121,122,123]. Hence the findings stress the importance of agroforests like the illipe rubber mix as a safety net in the light of the ongoing climate change as they contribute to increased income, risk diversification, and resilience for small-scale farmers [18,96,106]
The simulations further demonstrate that climate change negatively affects biodiversity, but higher levels can be expected in the IRA scenario, which again underlines the role of agroforests in conserving biological diversity [67,113,115]. Besides, the positive effects agroforestry has on carbon sequestration make this agricultural practice an attractive tool for climate change mitigation [29,119,124]. Overall, by combining adaptation and mitigation measures, agroforestry poses a win-win-strategy for farmers and nature to address major local and global environmental challenges including climate change mitigation and poverty alleviation [6,23,29,120].
Although the model refers not only to the farm level, but also to the landscape level, the application is adjusted to a specific case study. However, in many regions of the world, context-specific agroforestry systems are being practiced or tested as a strategy for achieving the UN-Sustainable Development Goals across the world’s production landscapes [125]. Case studies show, for example, the positive impacts of agroforestry serving as safety nets for poor households [126], improving food security and income [127], providing habitat for endangered species in corridors between protected areas [128], guaranteeing ecosystem services such as erosion control [129], and conserving biodiversity [130]. Our case study adds to the literature by confirming these positive effects on humans and the environment in the long-run and under rising temperatures. In different contexts and eco-regions, trees on farms have different functions, and tree composition therefore has to be adapted to the specific problems to be addressed through integrating trees. Although the illipe rubber agroforestry system is specifically adjusted to the context of the case study and its promotion requires context-specific considerations, the general socio-economic implications for policy-makers apply to other comparable regions and countries as well.
4.5. ABM as a Tool for Combining Human Decision Making and Environmental Dynamics
The present application demonstrates that agent-based models are eligible tools to explore the complex and interlinked dynamics between environmental and human system components over larger spatial and temporal scales. Hereby, a main advantage of ABMs over other modelling techniques lies in the opportunity to explicitly model individual decision making [131]. In the SAFARI model, farmers make livelihood decisions, which impacts land cover and use. In turn, land use influences farmers’ decisions whether to engage in additional agricultural activities. By coupling human behavior with natural processes, ABMs can account for feedback and interdependencies between farmers and their environment in social-ecological systems [132]. Furthermore, the ABM connects characteristics and behaviors of individual agents to the system’s dynamics and structure [133]. For example, farmers’ decisions and interactions with the environment on the micro-level shape environmental process such as biodiversity changes as well as the emerging land use patterns on larger scales. Since ABMs do not impose assumptions on stationarity, linearity, and homogeneity, they can cover a range of potential system states, including unlikely, path-dependent, or emergent outcomes [134,135].
The present simulation, as well as the growing use of ABMs in policy in general, illustrate that ABMs can be advantageous instruments to assist intervention design. By creating a virtual setting to conduct experiments, ABMs can investigate and compare policy options, such as introducing and promoting IRA systems as an alternative to jungle rubber, and explore possible future development paths that can be anticipated under different states of the world, such as climate change scenarios, in a relatively cost-efficient way [133,136]. Accordingly, the SAFARI ABM allows the user to compare how agroforestry affects farmers’ livelihoods and the environment with and without climate change before actually commencing to promote the innovation. Additionally, the SAFARI simulates developments over the long-term (sixty years) and considers effects across the landscape. However, ABMs are not suitable to predict the future. Instead, they aim to identify possible and probable development paths and unwanted or unintended consequences [133,135]. The present analysis shows that introducing IRA likely leads to a favorable development path that enhances livelihoods and environmental outcomes. In this way, the present study demonstrates how ABMs complement existing research and contribute to understanding the potential of agroforestry to alleviate poverty, strengthen resilience, and mitigate climate change in order to support development practitioners in designing innovation interventions.
4.6. Limitations and Future Research
The analysis presented here has several limitations. Our study incorporates a decision heuristic accounting for food security, income generation, and resource availability, but further factors may play a role in farmers’ adoption decisions. Investment considerations and information availability can influence adoption [137,138]. Further determinants include socio-economic characteristics as well as behavioral and psychological factors such as risk attitude and time preference [139,140]. Because the present analysis only considers land and labor constraints, other potential barriers such as unavailability of further inputs such as seedlings are not taken into account. Required training to improve technical skills and inputs for agroforestry implementation are assumed to be provided and hence do not restrict adoption in our model. Furthermore, the support of stakeholder engagement to encourage change and correspondingly a preference of IRA systems over jungle rubber are assumed, but in reality, possible aversion to change and innovation might impose a barrier to adoption. As a consequence, the simulations might overestimate implementation until incentives are introduced to address the inhibiting factors, such as lack of credit and markets for inputs, and behavioral preferences such as risk aversion or a lack of willingness to innovate. The use of timber from the illipe nut trees is not considered in this application, but may play a role as a motivating factor to adopt agroforestry [141]. Additionally, functioning markets for illipe nuts and products are assumed to exist, but in practice marketing opportunities in the area are restricted through the remote location of the villages. For simplification, the baseline decision heuristic was restricted to the main livelihoods prevalent in the study area (rice and jungle rubber cultivation). Additionally, illipe nut harvest season is assumed to occur every four years, but may depend on weather conditions [142]. Due to a lack of data, it was not possible to include belowground biomass and further ecosystem services such as soil enrichment, water cycling, or air quality.
These limitations can stimulate further research. Different decision-making processes with additional livelihood options and accounting for behavioral aspects may be considered for further analysis. Future research should assess further ecosystem services and the interaction between them, and how biodiversity impacts ecosystem services. Assessing other aspects of climate change such as droughts and changing rainfall patterns applying empirically based simulation approaches will increase the understanding of the potential of agroforestry for climate change mitigation. Besides, the SAFARI model could be extended to explore additional policy options. In this context, demand for illipe nuts could be included in the model to explore different marketing strategies aiming at supporting local communities to realize economic profits while conserving biodiversity through agroforestry.
5. Conclusions
The present paper explores how agroforestry adoption affects famers’ livelihoods, land use, biodiversity, and carbon sequestration over time. To link behavioral and environmental dynamics and compare different scenarios, an empirical agent-based model was implemented and adjusted to a case study in rural Indonesia. By connecting individual farmer decisions with ecological processes, the ABM demonstrates that agroforestry maintains native forests while significantly improving livelihoods, hence realizing advantages on the household and landscape levels. The simulations show that when farmers decide to include illipe rubber agroforestry into their livelihood portfolios, they benefit from such adoption through diversified and increased incomes. These valuable livelihood improvements even intensify in the long-term. Moreover, the simulations confirm that agroforests significantly contribute to biodiversity conservation and carbon sequestration. Especially in the climate change scenario, agroforests gain importance due to strengthened farmers’ resilience as well as direct and indirect environmental benefits. Thus, the findings clearly indicate that, compared with the existing agricultural practices, adopting such agroforestry systems is advantageous for the small-scale farmers as well as the environment, and poses a valuable alternative to rubber and oil palm monoculture. The findings provide policy makers and development practitioners with insights into how the promotion of these agroforestry systems can support climate change mitigation and adaptation, biodiversity conservation, and poverty alleviation in developing countries in the long term. The simulation results also imply that policy-makers should consider several aspects when introducing IRA. Firstly, possible adoption barriers need to be removed, for example by providing inputs and trainings through extension services. Secondly, policy-makers should raise awareness of the economic and environmental benefits to stimulate demand for this agricultural practice. Another option to increase investment into agroforestry could be the financial compensation for environmentally friendly practices. Thirdly, attractive marketing opportunities are needed, possibly drawing upon international demand for illipe nuts for cosmetics or as substitutes to palm oil. Although the illipe rubber agroforestry system is adjusted to the Indonesian case study, the findings provide general socio-economic implications that are of interest for other comparable regions and countries, and indicate relevant upscaling possibilities.
Author Contributions
Conceptualization, B.N., E.W. and Y.L.; methodology, B.N.; software, B.N.; validation, B.N.; formal analysis, B.N.; investigation, B.N., Y.L. and T.S.; resources, Y.L., T.S.; data curation, B.N.; writing—original draft preparation, B.N.; writing—review and editing, E.W., Y.L. and T.S.; visualization, B.N.; supervision, E.W. and Y.L.; project administration, E.W. and Y.L.; funding acquisition, E.W. and Y.L. All authors have read and agreed to the published version of the manuscript.
Funding
This research was funded by the International Climate Initiative (IKI) of the Federal Ministry for the Environment, Nature Conservation, Building and Nuclear Safety (BMUB), grant number 18_IV_064_Global_A_Trees on Farms; the Center for International Forestry Research (CIFOR); the World Agroforestry (ICRAF) and the Consortium Research Program on Forests, Trees, and Agroforestry (CRP-FTA).
Acknowledgments
The publication of this article was funded by the Open Access Fund of the Leibniz University of Hannover.
Conflicts of Interest
The authors declare no conflict of interest. The funders had no role in the design of the study; in the collection, analyses, or interpretation of data; in the writing of the manuscript, or in the decision to publish the results.
Model Documentation
The model has been implemented in NetLogo [83]. The model is available at: https://www.comses.net/codebase-release/1fb6c49f-a4b3-4135-b25a-1d5534c1a7cf/.
Appendix A
Figure A1.
Simulation results: tree basal area over time.

Figure A2.
Simulation results: tree species richness over time.

Figure A3.
Simulation results: tree density over time.

Figure A4.
Simulation results: farmers’ livelihood choices in the baseline and climate change scenario.
Figure A4.
Simulation results: farmers’ livelihood choices in the baseline and climate change scenario.

Figure A5.
Simulation results: generated calories from rice cultivation in the baseline and climate change scenario.
Figure A5.
Simulation results: generated calories from rice cultivation in the baseline and climate change scenario.

Figure A6.
Simulation results: generated cash income in the baseline and climate change scenario.

Figure A7.
Simulation results: land cover in the baseline and climate change scenario.

Figure A8.
Simulation results: biodiversity levels of tree Fisher’s alpha and bird species richness in the baseline and climate change scenario.
Figure A8.
Simulation results: biodiversity levels of tree Fisher’s alpha and bird species richness in the baseline and climate change scenario.

References
- FAO. The State of the Food and Agriculture; FAO Agriculture Series No. 38; FAO: Rome, Italy, 2007. [Google Scholar]
- Barrios, E.; Valencia, V.; Jonsson, M.; Brauman, A.; Hairiah, K.; Mortimer, P.E.; Okubo, S. Contribution of trees to the conservation of biodiversity and ecosystem services in agricultural landscapes. Int. J. Biodivers. Sci. Ecosyst. Serv. Manag. 2018, 14, 1–16. [Google Scholar] [CrossRef] [Green Version]
- Garrity, D.P.; Akinnifesi, F.K.; Ajayi, O.C.; Weldesemayat, S.G.; Mowo, J.G.; Kalinganire, A.; Larwanou, M.; Bayala, J. Evergreen Agriculture: A robust approach to sustainable food security in Africa. Food Secur. 2010, 2, 197–214. [Google Scholar] [CrossRef]
- Waldron, A.; Garrity, D.; Malhi, Y.; Girardin, C.; Miller, D.C.; Seddon, N. Agroforestry Can Enhance Food Security While Meeting Other Sustainable Development Goals. Trop. Conserv. Sci. 2017, 10, 1–6. [Google Scholar] [CrossRef] [Green Version]
- FAO. The State of the World’s Forests 2018—Forest Pathways to Sustainable Development; FAO: Rome, Italy, 2018. [Google Scholar]
- Tschora, H.; Cherubini, F. Co-benefits and trade-offs of agroforestry for climate change mitigation and other sustainability goals in West Africa. Glob. Ecol. Conserv. 2020, 22. [Google Scholar] [CrossRef]
- Henders, S.; Ostwald, M.; Verendel, V.; Ibisch, P. Do national strategies under the UN biodiversity and climate conventions address agricultural commodity consumption as deforestation driver? Land Use Policy 2018, 70, 580–590. [Google Scholar] [CrossRef]
- Kopittke, P.M.; Menzies, N.W.; Wang, P.; McKenna, B.A.; Lombi, E. Soil and the intensification of agriculture for global food security. Environ. Int. 2019, 132. [Google Scholar] [CrossRef] [PubMed]
- Jayathilake, H.M.; Prescott, G.W.; Carrasco, L.R.; Rao, M.; Symes, W.S. Drivers of deforestation and degradation for 28 tropical conservation landscapes. Ambio 2020. [Google Scholar] [CrossRef] [PubMed]
- Ndayambaje, J.D.; Heijman, W.J.M.; Mohren, G.M.J. Household Determinants of Tree Planting on Farms in Rural Rwanda. Small-Scale For. 2012, 11, 477–508. [Google Scholar] [CrossRef]
- Paiva, P.F.P.R.; de Lourdes Pinheiro Ruivo, M.; da Silva Júnior, O.M.; de Nazaré Martins Maciel, M.; Braga, T.G.M.; de Andrade, M.M.N.; dos Santos Junior, P.C.; da Rocha, E.S.; de Freitas, T.P.M.; da Silva Leite, T.V.; et al. Deforestation in protect areas in the Amazon: A threat to biodiversity. Biodivers. Conserv. 2020, 29, 19–38. [Google Scholar] [CrossRef]
- Altieri, M.A.; Nicholls, C.I.; Henao, A.; Lana, M.A. Agroecology and the design of climate change-resilient farming systems. Agron. Sustain. Dev. 2015, 35, 869–890. [Google Scholar] [CrossRef] [Green Version]
- Wiebe, K.; Robinson, S.; Cattaneo, A. Climate Change, Agriculture and Food Security. Sustain. Food Agric. 2019, 55–74. [Google Scholar] [CrossRef]
- Salvini, G.; Ligtenberg, A.; van Paassen, A.; Bregt, A.K.; Avitabile, V.; Herold, M. REDD+ and climate smart agriculture in landscapes: A case study in Vietnam using companion modelling. J. Environ. Manag. 2016, 172, 58–70. [Google Scholar] [CrossRef] [PubMed]
- Feleke, S.; Cole, S.M.; Sekabira, H.; Djouaka, R.; Manyong, V. Circular Bioeconomy Research for Development in Sub-Saharan Africa: Innovations, Gaps, and Actions. Sustainability 2021, 13, 1926. [Google Scholar] [CrossRef]
- FAO. Agroecological and Other Innovative Approaches for Sustainable Agriculture and Food Systems that Enhance Food Security and Nutrition—A Report by the High Level Panel of Experts on Food Security and Nutrition of the Committee on World Food Security; FAO: Rome, Italy, 2019. [Google Scholar]
- Runhaar, H. Governing the transformation towards ‘nature-inclusive’ agriculture: Insights from the Netherlands. Int. J. Agric. Sustain. 2017, 15, 340–349. [Google Scholar] [CrossRef]
- Reed, J.; van Vianen, J.; Foli, S.; Clendenning, J.; Yang, K.; MacDonald, M.; Petrokofsky, G.; Padoch, C.; Sunderland, T. Trees for life: The ecosystem service contribution of trees to food production and livelihoods in the tropics. For. Policy Econ. 2017, 84, 62–71. [Google Scholar] [CrossRef]
- FAO. Advancing Agroforestry on the Policy Agenda: A Guide for Decision-Makers, by G. Buttoud, in Collaboration with O. Ajayi, G. Detlefsen, F. Place & E. Torquebiau; Agroforestry Working Paper No. 1; FAO: Rome, Italy, 2013. [Google Scholar]
- Schroth, G.; da Mota, M.d.S.S. Tropical Agroforestry. In Farming with Nature: The Science and Practice of Ecoagriculture; Scherr, S.J., McNeely, J.A., Eds.; Island Press: Washington, DC, USA; London, UK, 2007; pp. 101–118. [Google Scholar]
- Lasco, R.D.; Espaldon, M.L.O.; Habito, C.M.D. Smallholder farmers’ perceptions of climate change and the roles of trees and agroforestry in climate risk adaptation: Evidence from Bohol, Philippines. Agrofor. Syst. 2016, 90, 521–540. [Google Scholar] [CrossRef]
- FAO; ICRAF. Agroforestry and tenure; Forestry Working Paper No. 8; FAO: Rome, Italy, 2019. [Google Scholar]
- Casanova-Lugo, F.; Ramírez-Avilés, L.; Parsons, D.; Caamal-Maldonado, A.; Pineiro-Vázquez, A.; Díaz-Echeverría, V. Environmental services from tropical agroforestry systems. Ser. Ciencias For. Ambient. 2016, XXII, 269–284. [Google Scholar] [CrossRef]
- Abbas, F.; Hammad, H.M.; Fahad, S.; Cerdà, A.; Rizwan, M.; Farhad, W.; Ehsan, S.; Bakhat, H.F. Agroforestry: A sustainable environmental practice for carbon sequestration under the climate change scenarios—A review. Environ. Sci. Pollut. Res. 2017, 24, 11177–11191. [Google Scholar] [CrossRef]
- Hilbrand, A.; Borelli, S.; Conigliaro, M.; Olivier, A. Agroforestry for Landscape Restoration; FAO: Rome, Italy, 2017. [Google Scholar]
- Van Noordwijk, M.; Lusiana, B. WaNuLCAS, a model of water, nutrient and light capture in agroforestry systems. Agrofor. Syst. 1999, 43, 217–242. [Google Scholar] [CrossRef]
- Sari, R.R.; Saputra, D.D.; Hairiah, K.; Rozendaal, D.M.A.; Roshetko, J.M.; Noordwijk, M. Van Gendered species preferences link tree diversity and carbon stocks in Cacao agroforest in Southeast Sulawesi, Indonesia. Land 2020, 9, 108. [Google Scholar] [CrossRef] [Green Version]
- Newaj, R.; Chaturvedi, O.P.; Handa, A.K. Recent development in agroforestry research and its role in climate change adaptation and mitigation. Indian J. Agrofor. 2016, 18, 1–9. [Google Scholar]
- Verchot, L.V.; Van Noordwijk, M.; Kandji, S.; Tomich, T.; Ong, C.; Albrecht, A.; Mackensen, J.; Bantilan, C.; Anupama, K.V.; Palm, C. Climate change: Linking adaptation and mitigation through agroforestry. Mitig. Adapt. Strateg. Glob. Chang. 2007, 12, 901–918. [Google Scholar] [CrossRef] [Green Version]
- Lasco, R.D.; Delfino, R.J.P.; Catacutan, D.C.; Simelton, E.S.; Wilson, D.M. Climate risk adaptation by smallholder farmers: The roles of trees and agroforestry. Curr. Opin. Environ. Sustain. 2014, 6, 83–88. [Google Scholar] [CrossRef] [Green Version]
- Umar, S.; Yodo, S.; Alam, A.S.; Aslam, D.; Livawanti, L. Post-adoption of the candlenut agroforestry in Central Sulawesi, Indonesia. IOP Conf. Ser. Earth Environ. Sci. 2018, 196. [Google Scholar] [CrossRef]
- Do, H.; Luedeling, E.; Whitney, C. Decision analysis of agroforestry options reveals adoption risks for resource-poor farmers. Agron. Sustain. Dev. 2020, 40. [Google Scholar] [CrossRef]
- Ashraf, J.; Pandey, R.; de Jong, W.; Nagar, B. Factors Influencing Farmers’ Decisions to Plant Trees on Their Farms in Uttar Pradesh, India. Small-Scale For. 2015, 14, 301–313. [Google Scholar] [CrossRef]
- Gebru, B.M.; Wang, S.W.; Kim, S.J.; Lee, W.K. Socio-ecological niche and factors affecting agroforestry practice adoption in different agroecologies of southern Tigray, Ethiopia. Sustainability 2019, 11, 3729. [Google Scholar] [CrossRef] [Green Version]
- Sabastian, G.E.; Yumn, A.; Roshetko, J.M.; Manalu, P.; Martini, E.; Perdana, A. Adoption of silvicultural practices in smallholder timber and NTFPs production systems in Indonesia. Agrofor. Syst. 2019, 93, 607–620. [Google Scholar] [CrossRef]
- Mekonnen, A.; Damte, A. Private Trees as Household Assets and Determinants of Tree-Growing Behavior in Rural Ethiopia; EfD DP 11-14; JSTOR: New York, NY, USA, 2011. [Google Scholar]
- Amare, D.; Wondie, M.; Mekuria, W.; Darr, D. Agroforestry of Smallholder Farmers in Ethiopia: Practices and Benefits. Small-Scale For. 2019, 18, 39–56. [Google Scholar] [CrossRef]
- Zerihun, M.F.; Muchie, M.; Worku, Z. Determinants of agroforestry technology adoption in Eastern Cape Province, South Africa. Dev. Stud. Res. 2014, 1, 382–394. [Google Scholar] [CrossRef]
- Vallejo, M.; Ramírez, M.I.; Reyes-González, A.; López-Sánchez, J.G.; Casas, A. Agroforestry systems of the tehuacan-cuicatlan valley: Land use for biocultural diversity conservation. Land 2019, 8, 24. [Google Scholar] [CrossRef] [Green Version]
- Sood, K.K.; Mitchell, C.P. Identifying important biophysical and social determinants of on-farm tree growing in subsistence-based traditional agroforestry systems. Agrofor. Syst. 2009, 75, 175–187. [Google Scholar] [CrossRef]
- Miller, D.C.; Muñoz-Mora, J.C.; Christiaensen, L. Prevalence, economic contribution, and determinants of trees on farms across Sub-Saharan Africa. For. Policy Econ. 2017, 84, 47–61. [Google Scholar] [CrossRef] [Green Version]
- David, M.; Bernard, B.; Aringaniza, I. Determinants of agroforestry adoption as an adaptation means to drought among smallholder farmers in Nakasongola District, Central Uganda. African J. Agric. Res. 2017, 12, 2024–2035. [Google Scholar] [CrossRef] [Green Version]
- Pandit, B.H.; Nuberg, I.; Shrestha, K.K.; Cedamon, E.; Amatya, S.M.; Dhakal, B.; Neupane, R.P. Impacts of market-oriented agroforestry on farm income and food security: Insights from Kavre and Lamjung districts of Nepal. Agrofor. Syst. 2019, 93, 1593–1604. [Google Scholar] [CrossRef]
- Dinh, H.H.; Nguyen, T.T.; Hoang, V.N.; Wilson, C. Economic incentive and factors affecting tree planting of rural households: Evidence from the Central Highlands of Vietnam. J. For. Econ. 2017, 29, 14–24. [Google Scholar] [CrossRef]
- Nyaga, J.; Muthuri, C.W.; Barrios, E.; Öborn, I.; Sinclair, F.L. Enhancing maize productivity in agroforestry systems through managing competition: Lessons from smallholders’ farms, Rift valley, Kenya. Agrofor. Syst. 2019, 93, 715–730. [Google Scholar] [CrossRef]
- Do, V.H.; La, N.; Mulia, R.; Bergkvist, G.; Sigrun Dahlin, A.; Nguyen, V.T.; Pham, H.T.; Öborn, I. Fruit tree-based agroforestry systems for smallholder farmers in northwest vietnam—A quantitative and qualitative assessment. Land 2020, 9, 451. [Google Scholar] [CrossRef]
- Van der Werf, W.; Keesman, K.; Burgess, P.; Graves, A.; Pilbeam, D.; Incoll, L.D.; Metselaar, K.; Mayus, M.; Stappers, R.; van Keulen, H.; et al. Yield-SAFE: A parameter-sparse, process-based dynamic model for predicting resource capture, growth, and production in agroforestry systems. Ecol. Eng. 2007, 29, 419–433. [Google Scholar] [CrossRef] [Green Version]
- Magcale-Macandog, D.B.; Ani, P.A.B.; Delgado, M.M.; Campo, P. Modelling the Dynamics of Agroforestry Adoption in the Uplands of Southern Philippines Using Companion Modelling Approach. In Proceedings of the Improving the Triple Bottom Line Returns from Small-scale Forestry, Proceedings from an International Conference, Gatton, Australia, 18–21 June 2007; pp. 347–356. [Google Scholar]
- Villamor, G.B.; Djanibekov, U.; Le, Q.B.; Vlek, P.L.G. Modelling the socio-ecological system dynamics of rubber agroforests to design reward mechanisms for agro-biodiversity conservation. In Proceedings of the 20th International Congress on Modelling and Simulation, MODSIM 2013, Adelaide, Australia, 1–6 December 2013; pp. 1861–1867. [Google Scholar]
- Smajgl, A.; Xu, J.; Egan, S.; Yi, Z.F.; Ward, J.; Su, Y. Assessing the effectiveness of payments for ecosystem services fordiversifying rubber in Yunnan, China. Environ. Model. Softw. 2015, 69, 187–195. [Google Scholar] [CrossRef]
- Suwarno, A.; van Noordwijk, M.; Weikard, H.P.; Suyamto, D. Indonesia’s forest conversion moratorium assessed with an agent-based model of Land-Use Change and Ecosystem Services (LUCES). Mitig. Adapt. Strateg. Glob. Chang. 2018, 23, 211–229. [Google Scholar] [CrossRef] [Green Version]
- Rounsevell, M.D.A.; Robinson, D.T.; Murray-Rust, D. From actors to agents in socio-ecological systems models. Philos. Trans. R. Soc. B Biol. Sci. 2012, 367, 259–269. [Google Scholar] [CrossRef] [Green Version]
- Miller, D.C.; Ordoñez, P.J.; Brown, S.E.; Forrest, S.; Nava, N.J.; Hughes, K.; Baylis, K. The impacts of agroforestry on agricultural productivity, ecosystem services, and human well-being in low-and middle-income countries: An evidence and gap map. Campbell Syst. Rev. 2019, 16. [Google Scholar] [CrossRef] [Green Version]
- Widmann, P.; Tjiu, A.; Putera, M.H.; Wulffraat, S. Connecting Diversity. People and Nature of Labian-Leboyan Corridor in the Indonesian Heart of Borneo; WWF: Jakarta, Indonesia, 2012. [Google Scholar]
- Ocampo-Peñuela, N.; Garcia-Ulloa, J.; Kornecki, I.; Philipson, C.D.; Ghazoul, J. Impacts of Four Decades of Forest Loss on Vertebrate Functional Habitat on Borneo. Front. For. Glob. Chang. 2020, 3, 1–13. [Google Scholar] [CrossRef]
- Barnes, A.D.; Jochum, M.; Mumme, S.; Haneda, N.F.; Farajallah, A.; Widarto, T.H.; Brose, U. Consequences of tropical land use for multitrophic biodiversity and ecosystem functioning. Nat. Commun. 2014, 5, 1–7. [Google Scholar] [CrossRef]
- Purwanto, E.; Santoso, H.; Jelsma, I.; Widayati, A.; Nugroho, H.Y.S.H.; van Noordwijk, M. Agroforestry as policy option for forest-zone oil palm production in indonesia. Land 2020, 9, 531. [Google Scholar] [CrossRef]
- Jonas, H.; Abram, N.K.; Ancrenaz, M. Addressing the Impact of Large-Scale Oil Palm Plantations on Orangutan Conservation in Borneo; IIED: London, UK, 2017. [Google Scholar]
- Budiharta, S.; Meijaard, E. State of Kalimantan ’s biodiversity. In Development, Environment and the People of Kalimantan; Resosudarmo, B.P., Imansyah, M.H., Napitupulu, L., Eds.; Indonesian Regional Science Association (IRSA): Jakarta, Indonesia, 2017. [Google Scholar]
- WWF. Climate Change Scenarios and Risks; Heart of Borneo Programme WWF-Indonesia: Jakarta, Indonesia, 2016. [Google Scholar]
- Austin, K.G.; Schwantes, A.; Gu, Y.; Kasibhatla, P.S. What causes deforestation in Indonesia? Environ. Res. Lett. 2019, 14, 24007. [Google Scholar] [CrossRef]
- Winarni, B.; Lahjie, A.M.; Simarangkir, B.D.A.S.; Yusuf, S.; Ruslim, Y. Tengkawang cultivation model in community forest using agroforestry systems in West Kalimantan, Indonesia. Biodiversitas 2017, 18, 765–772. [Google Scholar] [CrossRef]
- Shantiko, B.; Fripp, E.; Taufiqoh, T.; Heri, T.; Laumonier, Y. Socio-Economic Considerations for Land-Use Planning; The Case of Kapuas Hulu, West Kalimantan; Center for International Forestry Research (CIFOR): Bogor, Indonesia, 2013. [Google Scholar]
- Dudot, C. Strengthening Community Based Forestry and Watershed Management: Socio-Economic Study of Tengkawang Value Chain, North of Danau Sentarum National Park, West Kalimantan. Master’s Thesis, Agroparistech, Montpellier, France, 2014. Unpublished. [Google Scholar]
- Randi, A.; Barstow, M.S.J.; Kusumadewi, Y. Shorea Stenoptera. The IUCN Red List of Threatened Species. e.T33623A125629727. Available online: https://dx.doi.org/10.2305/IUCN.UK.2019-3.RLTS.T33623A125629727.en (accessed on 25 March 2021).
- Prayogo, H.; Thohari, A.M.; Solihin, D.D.; Prasetyo, L.B.; Sugardjito, J. Habitat Suitability Modeling of Bornean Orangutan (Pongo pygmaeus pygmaeus) in Betung Kerihun National Park, Danau Sentarum and Corridor, West Kalimantan. JMHT 2014. [Google Scholar] [CrossRef]
- Haggar, J.; Pons, D.; Saenz, L.; Vides, M. Contribution of agroforestry systems to sustaining biodiversity in fragmented forest landscapes. Agric. Ecosyst. Environ. 2019, 283, 1–41. [Google Scholar] [CrossRef]
- Adriyanti, D.T.; Hardiwinoto, S.; Giesen, W.; van der Meer, P.; Coolen, Q.; Karyanto, O. Illipe Nut Plantation on Undrained Peatland; Mitigation of Climate Change in Agriculture Series 9; FAO: Rome, Italy, 2014. [Google Scholar]
- IPCC. Summary for Policymakers. In Global Warming of 1.5 °C. An IPCC Special Report on the Impacts of Global Warming of 1.5 °C above Pre-Industrial Levels and Related Global Greenhouse Gas Emission Pathways, in the Context of Strengthening the Global Response to the Threat of Climate Change; Masson-Delmotte, V., Zhai, P., Pörtner, H.O., Roberts, D., Skea, J., Shukla, P.R., Pirani, A., Moufouma-Okia, W., Péan, C., Pidcock, R., et al., Eds.; World Meteorological Organization: Geneva, Switzerland, 2018; p. 32. [Google Scholar]
- Lehner, F.; Coats, S.; Stocker, T.F.; Pendergrass, A.G.; Sanderson, B.M.; Raible, C.C.; Smerdon, J.E. Projected drought risk in 1.5 °C and 2 °C warmer climates. Geophys. Res. Lett. 2017, 44, 7419–7428. [Google Scholar] [CrossRef]
- Worldclim Global Climate Data. Available online: https://www.worldclim.org (accessed on 13 November 2019).
- Laumonier, Y.; Simamora, T.; Manurung, A.; Narulita, S.; Pribadi, U.; Simorangkir, A.; Kharisma, S.; Shantiko, B. Sentinel Landscapes initiative. FTA Work. Pap. 2020, 5, 1–74. [Google Scholar]
- Anandi, A.M.; Yuliani, E.L.; Moeliono, M.; Laumonier, Y.; Narulita, S. Kapuas Hulu: A background analysis to implementing integrated landscape approaches in Indonesia. In Operationalizing Integrated Landscape Approaches in the Tropics; Center for International Forestry Research (CIFOR): Bogor, Indonesia, 2020; pp. 176–204. [Google Scholar]
- Crevello, S. Dayak Land Use Systems and Indigenous Knowledge. J. Hum. Ecol. 2004, 16, 69–73. [Google Scholar] [CrossRef]
- De Jong, W. The Impact of Rubber on the Forest Landscape in Borneo. In Agricultural Technologies and Tropical Deforestation; Angelsen, A., Kaimowitz, D., Eds.; CABI Publishing: Wallingford/Oxford, UK, 2001; pp. 367–382. [Google Scholar]
- Leonald, L.; Rowland, D. Drivers and effects of agrarian change in Kapuas Hulu Regency, West Kalimantan, Indonesia. In Agrarian Change in Tropical Landscapes; Deakin, E.L., Kshatriya, M., Sunderland, T.C.H., Eds.; Center for International Forestry Research (CIFOR): Bogor, Indonesia, 2016; pp. 91–138. [Google Scholar]
- BPS Human Development Index by Province [New Method], 2010–2019. Available online: https://www.bps.go.id/dynamictable/2020/02/18/1772/indeks-pembangunan-manusia-menurut-provinsi-metode-baru-2010-2019.html (accessed on 25 January 2021).
- Murniati; Garrity, D.P.; Gintings, A.N. The contribution of agroforestry systems to reducing farmers’ dependence on the resources of adjacent national parks: A case study from Sumatra, Indonesia. Agrofor. Syst. 2001, 52, 171–184. [Google Scholar] [CrossRef]
- Fisher, R.; Corbet, A.; Williams, C. The relation between the number of species and the number of individuals in a random sample of an animal population. J. Anim. Ecol. 1943, 12, 42–58. [Google Scholar] [CrossRef]
- Grimm, V.; Railsback, S.F.; Vincenot, C.E.; Berger, U.; Gallagher, C.; Deangelis, D.L.; Edmonds, B.; Ge, J.; Giske, J.; Groeneveld, J.; et al. The ODD protocol for describing agent-based and other simulation models: A second update to improve clarity, replication, and structural realism. Jasss 2020, 23. [Google Scholar] [CrossRef] [Green Version]
- Grimm, V.; Berger, U.; DeAngelis, D.L.; Polhill, J.G.; Giske, J.; Railsback, S.F. The ODD protocol: A review and first update. Ecol. Modell. 2010, 221, 2760–2768. [Google Scholar] [CrossRef] [Green Version]
- Grimm, V.; Berger, U.; Bastiansen, F.; Eliassen, S.; Ginot, V.; Giske, J.; Goss-Custard, J.; Grand, T.; Heinz, S.K.; Huse, G.; et al. A standard protocol for describing individual-based and agent-based models. Ecol. Modell. 2006, 198, 115–126. [Google Scholar] [CrossRef]
- Wilensky, U. NetLogo; Center for Connected Learning and Computer-Based Modeling, Northwestern University: Evanston, IL, USA, 1999; Available online: http://ccl.northwestern.edu/netlogo/ (accessed on 15 March 2021).
- Gigerenzer, G.; Goldstein, D.G. Reasoning the Fast and Frugal Way: Models of Bounded Rationality. Psychol. Rev. 1996, 103, 650–669. [Google Scholar] [CrossRef] [Green Version]
- Schreinemachers, P.; Berger, T. Land use decisions in developing countries and their representation in multi-agent systems. J. Land Use Sci. 2006, 1, 29–44. [Google Scholar] [CrossRef]
- Laumonier, Y.; Hadi, D.P.; Pribadi, U.A.; Narulita, S. Kapuas Hulu Ecological Vegetation Map 1:50000; CIFOR: Bogor, Indonesia, 2020. [Google Scholar]
- Suyanto, N.K.; Sardi, I.; Buana, R.Y.; van Noordwijk, M. Analysis of Local Livelihoods From Past to Present in the Central Kalimantan Ex-Mega Rice Project Area; World Agroforestry Centre: Bogor, Indonesia, 2009. [Google Scholar]
- Jepsen, M.R.; Leisz, S.; Rasmussen, K.; Jakobsen, J.; Møller-Jensen, L.; Christiansen, L. Agent-based modelling of shifting cultivation field patterns, Vietnam. Int. J. Geogr. Inf. Sci. 2006, 20, 1067–1085. [Google Scholar] [CrossRef]
- Wulan, Y.C.; Budidarsono, S.; Joshi, L. Economic analysis of improved smallholder rubber agroforestry systems in West Kalimantan, Indonesia—Implications for rubber development. Sustain. Sloping Lands Watershed Manag. Conf. 2006, 431–444. [Google Scholar]
- Ko, R.; Lumangkun, A.; Wardenaar, E. Nilai Manfaat Tengkawang (Shorea spp.) Bagi Masyarakat Di Kecamatan Embaloh Hilir Kabupaten Kapuas Hulu Kalimantan Barat Value Benefits Tengkawang (Shorea spp.) For The Downstream In The District Embaloh Kapuas Hulu West Kalimantan. J. Hutan Lestari 2013, 1, 83–91. [Google Scholar]
- Maharani, R.; Fernandes, A.; Pujiarti, R. Comparison of Tengkawang fat processing and its effect on Tengkawang fat quality from Sahan and Nanga Yen villages, West Kalimantan, Indonesia. AIP Conf. Proc. 2016, 1744. [Google Scholar] [CrossRef] [Green Version]
- Chiputwa, B.; Spielman, D.J.; Qaim, M. Food standards, certification, and poverty among coffee farmers in Uganda. World Dev. 2015, 66, 400–412. [Google Scholar] [CrossRef] [Green Version]
- Indonesian Statistics Publications Daily Average Consumption of Calorie and Protein per Capita by Province, 2007–2019. Available online: https://www.bps.go.id/statictable/2014/09/08/951/rata-rata-konsumsi-kalori-dan-protein-per-kapita-per-hari-menurut-provinsi-2007-2019.html (accessed on 22 December 2020).
- Simon, H.A. Theories of Bounded Rationality. In Decision and Organization; McGuire, C.B., Radner, R., Eds.; Elsevier: Amsterdam, The Netherlands, 1972; pp. 161–176. [Google Scholar]
- Magliocca, N.R.; Brown, D.G.; Ellis, E.C. Exploring Agricultural Livelihood Transitions with an Agent-Based Virtual Laboratory: Global Forces to Local Decision-Making. PLoS ONE 2013, 8. [Google Scholar] [CrossRef] [PubMed] [Green Version]
- Wangpakapattanawong, P.; Finlayson, R.; Öborn, I. Agroforestry in Rice-Production Landscapes in Southeast Asia a Practical Manual; Wangpakapattanawong, P., Finlayson, R., Öborn, I., Roshetko, J.M., Sinclair, F., Shono, K., Borelli, S., Hillbrand, A., Conigliaro, M., Eds.; Food and Agriculture Organization of the United Nations Regional Office for Asia and the Pacific, Bangkok, Thailand & World Agroforestry Centre (ICRAF) Southeast Asia Regional Program: Bogor, Indonesia, 2017. [Google Scholar]
- Sorensen, K.W. Traditional Management of Dipterocarp Forests: Examples of Community Forestry By Indigenous Communities. In Dipterocarp Forest Ecosystems: Towards Sustainable Management; World Scientific: Singapore, 1996; pp. 335–353. [Google Scholar]
- Heri, V.; Bakara, D.O.; Hermanto; Mulyana, A.; Moeliono, M.; Yuliani, E.-L. Illipe nut as the glue for integrated watershed management: Experiences from the Labian-Leboyan watershed. CIFOR Info Br. 2020. [Google Scholar] [CrossRef]
- Yuliawan, T.; Handoko, I. The Effect of Temperature Rise to Rice Crop Yield in Indonesia uses Shierary Rice Model with Geographical Information System (GIS) Feature. Procedia Environ. Sci. 2016, 33, 214–220. [Google Scholar] [CrossRef] [Green Version]
- Cooley, P.; Solano, E. Agent-Based Model (ABM) Validation Considerations. In Proceedings of the SIMUL 2011, The Third International Conference on Advances in System Simulation, Barcelona, Spain, 23–29 October 2011; pp. 134–139. [Google Scholar]
- Windrum, P.; Fagiolo, G.; Moneta, A. Empirical validation of agent-based models: Alternatives and prospects. Jasss 2007, 10, 8. [Google Scholar]
- StataCorp Stata Statistical Software: Release 15 2015; StataCorp LLC: College Station, TX, USA, 2015.
- BPS-Statistics of Kapuas Hulu Regency. Kapuas Hulu Regional Statistic 2019; BPS-Statistics of Kapuas Hulu Regency: Putussibau, Indonesia, 2019. [Google Scholar]
- Rahman, S.A.; Jacobsen, J.B.; Healey, J.R.; Roshetko, J.M.; Sunderland, T. Finding alternatives to swidden agriculture: Does agroforestry improve livelihood options and reduce pressure on existing forest? Agrofor. Syst. 2017, 91, 185–199. [Google Scholar] [CrossRef] [Green Version]
- Sulistyawati, E.; Noble, I.R.; Roderick, M.L. A simulation model to study land use strategies in swidden agriculture systems. Agric. Syst. 2005, 85, 271–288. [Google Scholar] [CrossRef]
- Belsky, J. Household Food Security, Farm Trees, and Agroforestry: A Comparative Study in Indonesia and the Philippines. Hum. Organ. 1993, 52, 130–141. [Google Scholar] [CrossRef]
- Nguyen, M.P.; Vaast, P.; Pagella, T.; Sinclair, F. Local knowledge about ecosystem services provided by trees in coffee agroforestry practices in northwest Vietnam. Land 2020, 9, 1–27. [Google Scholar] [CrossRef]
- Córdova, R.; Hogarth, N.J.; Kanninen, M. Sustainability of smallholder livelihoods in the Ecuadorian highlands: A comparison of agroforestry and conventional agriculture systems in the indigenous territory of Kayambi People. Land 2018, 7, 45. [Google Scholar] [CrossRef] [Green Version]
- Rohadi, D.; Herawati, T. Agroforestry Research in Indonesia: Where To Go for the Next. World Congr. Agrofor. 2014. [Google Scholar] [CrossRef]
- Hemida, M.A.A.; Adam, Y.O. The Importance of Farm Trees in Rural Livelihoods in Eastern Galabat The Importance of Farm Trees in Rural Livelihoods in Eastern Galabat Locality, Sudan. Agric. For. J. 2019, 3, 81–88. [Google Scholar]
- Pendrill, F.; Persson, U.M.; Godar, J.; Kastner, T.; Moran, D.; Schmidt, S.; Wood, R. Agricultural and forestry trade drives large share of tropical deforestation emissions. Glob. Environ. Chang. 2019, 56, 1–10. [Google Scholar] [CrossRef]
- Martin, D.A.; Osen, K.; Grass, I.; Hölscher, D.; Tscharntke, T.; Wurz, A.; Kreft, H. Land-use history determines ecosystem services and conservation value in tropical agroforestry. Conserv. Lett. 2020, 13. [Google Scholar] [CrossRef]
- Warren-Thomas, E.; Nelson, L.; Juthong, W.; Bumrungsri, S.; Brattström, O.; Stroesser, L.; Chambon, B.; Penot, É.; Tongkaemkaew, U.; Edwards, D.P.; et al. Rubber agroforestry in Thailand provides some biodiversity benefits without reducing yields. J. Appl. Ecol. 2020, 57, 17–30. [Google Scholar] [CrossRef]
- Harvey, C.A.; González Villalobos, J.A. Agroforestry systems conserve species-rich but modified assemblages of tropical birds and bats. Biodivers. Conserv. 2007, 16, 2257–2292. [Google Scholar] [CrossRef]
- Udawatta, R.P.; Rankoth, L.M.; Jose, S. Agroforestry and biodiversity. Sustainability 2019, 11, 2879. [Google Scholar] [CrossRef] [Green Version]
- Bhagwat, S.A.; Willis, K.J.; Birks, H.J.B.; Whittaker, R.J. Agroforestry: A refuge for tropical biodiversity? Trends Ecol. Evol. 2008, 23, 261–267. [Google Scholar] [CrossRef]
- Tscharntke, T.; Clough, Y.; Bhagwat, S.A.; Buchori, D.; Faust, H.; Hertel, D.; Hölscher, D.; Juhrbandt, J.; Kessler, M.; Perfecto, I.; et al. Multifunctional shade-tree management in tropical agroforestry landscapes—A review. J. Appl. Ecol. 2011, 48, 619–629. [Google Scholar] [CrossRef] [Green Version]
- Verstegen, J.A.; van der Laan, C.; Dekker, S.C.; Faaij, A.P.C.; Santos, M.J. Recent and projected impacts of land use and land cover changes on carbon stocks and biodiversity in East Kalimantan, Indonesia. Ecol. Indic. 2019, 103, 563–575. [Google Scholar] [CrossRef]
- Middendorp, R.S.; Vanacker, V.; Lambin, E.F. Impacts of shaded agroforestry management on carbon sequestration, biodiversity and farmers income in cocoa production landscapes. Landsc. Ecol. 2018, 33, 1953–1974. [Google Scholar] [CrossRef]
- Matocha, J.; Schroth, G.; Hills, T.; Hole, D. Integrating Climate Change Adaptation and Mitigation Through Agroforestry and Ecosystem Conservation. In Agroforestry—The Future of Global Land Use, Advances in Agroforestry 9; Nair, P.K.R., Garrity, D., Eds.; Springer: Amsterdam, The Netherlands, 2012; pp. 105–126. ISBN 9789400746763. [Google Scholar]
- Takama, T.; Aldrian, E.; Kusumaningtyas, S.D.A.; Sulistya, W. Identified vulnerability contexts for a paddy production assessment with climate change in Bali, Indonesia. Clim. Dev. 2017, 9, 110–123. [Google Scholar] [CrossRef]
- Murniati, K.; Mutolib, A. The impact of climate change on the household food security of upland rice farmers in sidomulyo, lampung province, Indonesia. Biodiversitas 2020, 21, 3487–3493. [Google Scholar] [CrossRef]
- Measey, M. Indonesia: A Vulnerable Country in the Face of Climate Change. Glob. Major. E-J. 2010, 1, 31–45. [Google Scholar]
- Mulia, R.; Nguyen, D.D.; Nguyen, M.P.; Steward, P.; Pham, V.T.; Le, H.A.; Rosenstock, T.; Simelton, E. Enhancing Vietnam’s nationally determined contribution with mitigation targets for agroforestry: A technical and economic estimate. Land 2020, 9, 528. [Google Scholar] [CrossRef]
- Plieninger, T.; Muñoz-Rojas, J.; Buck, L.E.; Scherr, S.J. Agroforestry for sustainable landscape management. Sustain. Sci. 2020, 15, 1255–1266. [Google Scholar] [CrossRef]
- Ndoli, A.; Mukuralinda, A.; Schut, A.G.T.; Iiyama, M.; Ndayambaje, J.D.; Mowo, J.G.; Giller, K.E.; Baudron, F. On-farm trees are a safety net for the poorest households rather than a major contributor to food security in Rwanda. Food Secur. 2021. [Google Scholar] [CrossRef]
- Mekonnen, M.; Worku, T.; Yitaferu, B.; Cerdà, A.; Keesstra, S. Economics of agroforestry land use system, Upper Blue Nile Basin, northwest Ethiopia. Agrofor. Syst. 2021. [Google Scholar] [CrossRef]
- Yashmita, U.; Singh, M.; Kumar, A.; Sharma, M. Conservation of Wildlife Diversity in Agroforestry Systems in Eastern Himalayan Biodiversity Hotspot. Proc. Zool. Soc. 2021. [Google Scholar] [CrossRef]
- De Leijster, V.; Santos, M.J.; Wassen, M.W.; Camargo García, J.C.; Llorca Fernandez, I.; Verkuil, L.; Scheper, A.; Steenhuis, M.; Verweij, P.A. Ecosystem services trajectories in coffee agroforestry in Colombia over 40 years. Ecosyst. Serv. 2021, 48, 101246. [Google Scholar] [CrossRef]
- Dawson, I.K.; Guariguata, M.R.; Loo, J.; Weber, J.C.; Lengkeek, A.; Bush, D.; Cornelius, J.; Guarino, L.; Kindt, R.; Orwa, C.; et al. What is the relevance of smallholders’ agroforestry systems for conserving tropical tree species and genetic diversity in circa situm, in situ and ex situ settings? A review. Biodivers. Conserv. 2013, 22, 301–324. [Google Scholar] [CrossRef]
- Wilensky, U.; Rand, W. An Introduction to Agent-Based Modeling. Modeling Natural, Social, and Engineered Complex Systems with Netlogo; The MIT Press: Cambridge, UK, 2015. [Google Scholar]
- Villamor, G.B.; Van Noordwijk, M.; Troitzsch, K.G.; Vlek, P.L.G. Human decision making for empirical agent-based models: Construction and validation. Int. Congr. Environ. Model. Software. 2012, 1, 2529–2536. [Google Scholar]
- Ahrweiler, P. Agent-based simulation for science, technology, and innovation policy. Scientometrics 2017, 110, 391–415. [Google Scholar] [CrossRef]
- Dechesne, F.; Ghorbani, A.; Yorke-Smith, N. Introduction to the special issue on agent-based modelling for policy engineering. AI Soc. 2015, 30, 311–313. [Google Scholar] [CrossRef] [Green Version]
- Polhill, J.G.; Ge, J.; Hare, M.P.; Matthews, K.B.; Gimona, A.; Salt, D.; Yeluripati, J. Crossing the chasm: A ‘tube-map’ for agent-based social simulation of policy scenarios in spatially-distributed systems. Geoinformatica 2019, 23, 169–199. [Google Scholar] [CrossRef] [Green Version]
- Gilbert, N.; Ahrweiler, P.; Barbrook-Johnson, P.; Narasimhan, K.P.; Wilkinson, H. Computational modelling of public policy: Reflections on practice. Jasss 2018, 21. [Google Scholar] [CrossRef] [Green Version]
- Deressa, T.T.; Hassan, R.M.; Ringler, C.; Alemu, T.; Yesuf, M. Determinants of farmers’ choice of adaptation methods to climate change in the Nile Basin of Ethiopia. Glob. Environ. Chang. 2009, 19, 248–255. [Google Scholar] [CrossRef] [Green Version]
- Rogers, E.M. Diffusion of innovations, 3rd ed.; Free Press; Collier Macmillan: New York, NY, USA, 1983. [Google Scholar]
- Kahneman, D.; Tversky, A. Prospect Theory: An Analysis of Decision under Risk. Econoemtrica 1979, 47, 263–291. [Google Scholar] [CrossRef] [Green Version]
- Llewellyn, R.S.; Brown, B. Predicting Adoption of Innovations by Farmers: What is Different in Smallholder Agriculture? Appl. Econ. Perspect. Policy 2020, 42, 100–112. [Google Scholar] [CrossRef]
- Dessie, A.B.; Abtew, A.A.; Koye, A.D. Determinants of the production and commercial values of Eucalyptus woodlot products in Wogera District, Northern Ethiopia. Environ. Syst. Res. 2019, 8. [Google Scholar] [CrossRef] [Green Version]
- Project Completion Report PD 586/10 Rev.1 (F) Operational Strategies for the Conservation of Tengkawang Genetic Diversity and for Sustainable Livelihood of Indigenous People in Kalimantan; Dipterocarps Research Center-Forda, Ministry of Forestry: Samarinda, Indonesia, 2014.
Figure 1.
Study area. Source: own illustration based on Geographic Information System (GIS) data.

Figure 2.
Model description: process overview. Orange: household agent procedures, green: landscape agent procedures, blue: general procedures.
Figure 2.
Model description: process overview. Orange: household agent procedures, green: landscape agent procedures, blue: general procedures.

Figure 3.
Model description: livelihood decision tree (business as usual (BAU) scenario).

Figure 4.
Model description: livelihood decision tree (IRA scenario).

Figure 5.
Model description: landscape patches’ cycle of swidden agriculture.

Figure 6.
Simulation results: farmers’ livelihood choices.

Figure 7.
Simulation results: calories generated from rice cultivation over time.

Figure 8.
Simulation results: generated cash income over time.

Figure 9.
Simulation results: land cover trends over time.

Figure 10.
Simulation results: biodiversity levels of tree Fisher’s alpha and bird species richness.
Figure 10.
Simulation results: biodiversity levels of tree Fisher’s alpha and bird species richness.

Figure 11.
Simulation results: carbon sequestration in the landscape over time.


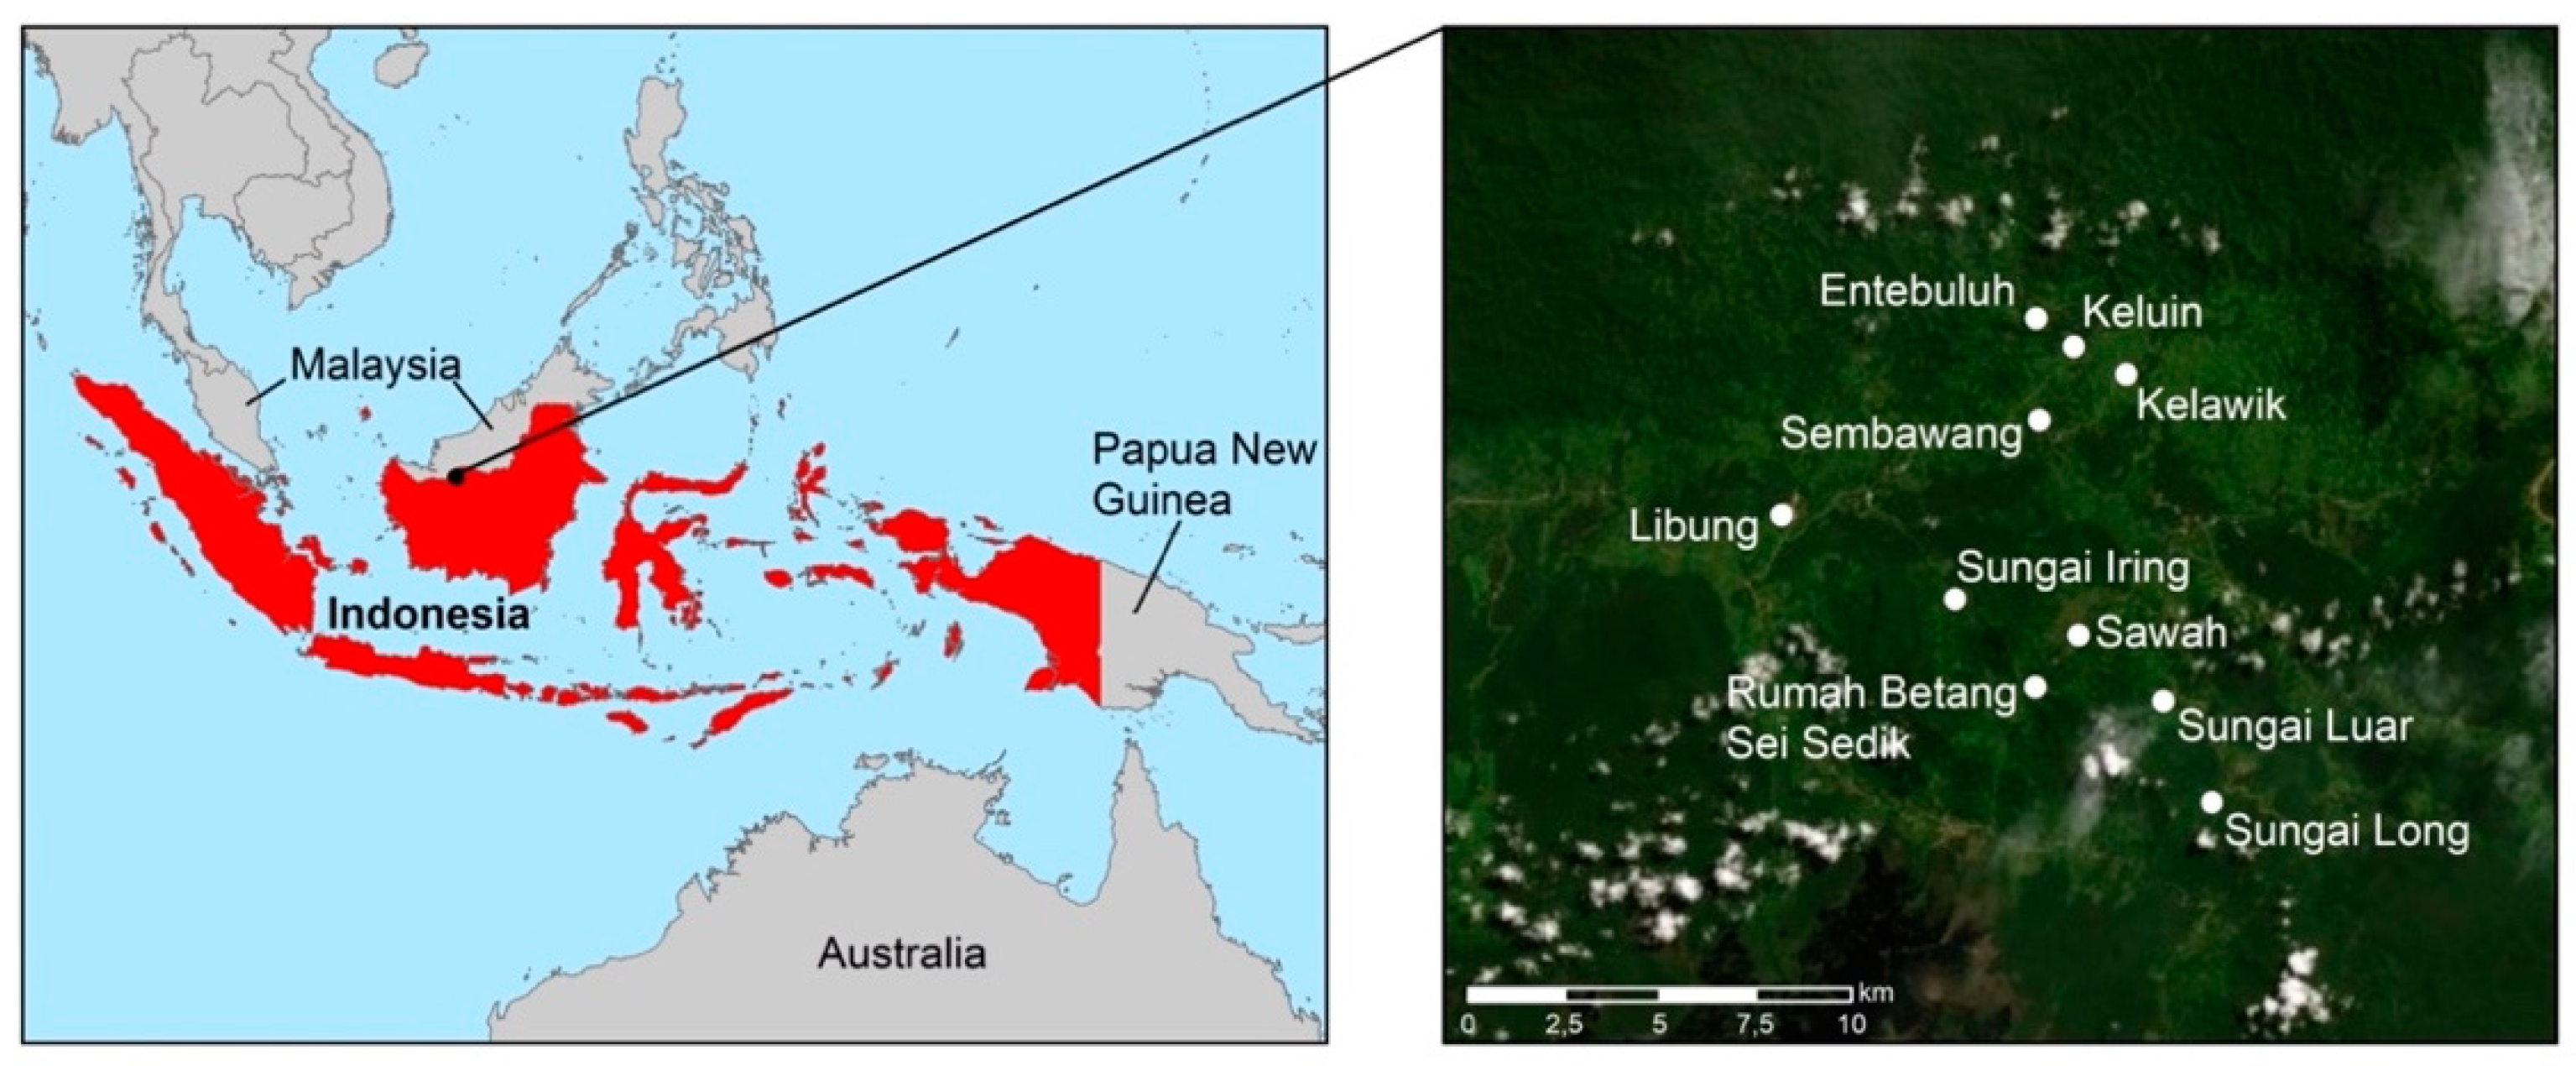
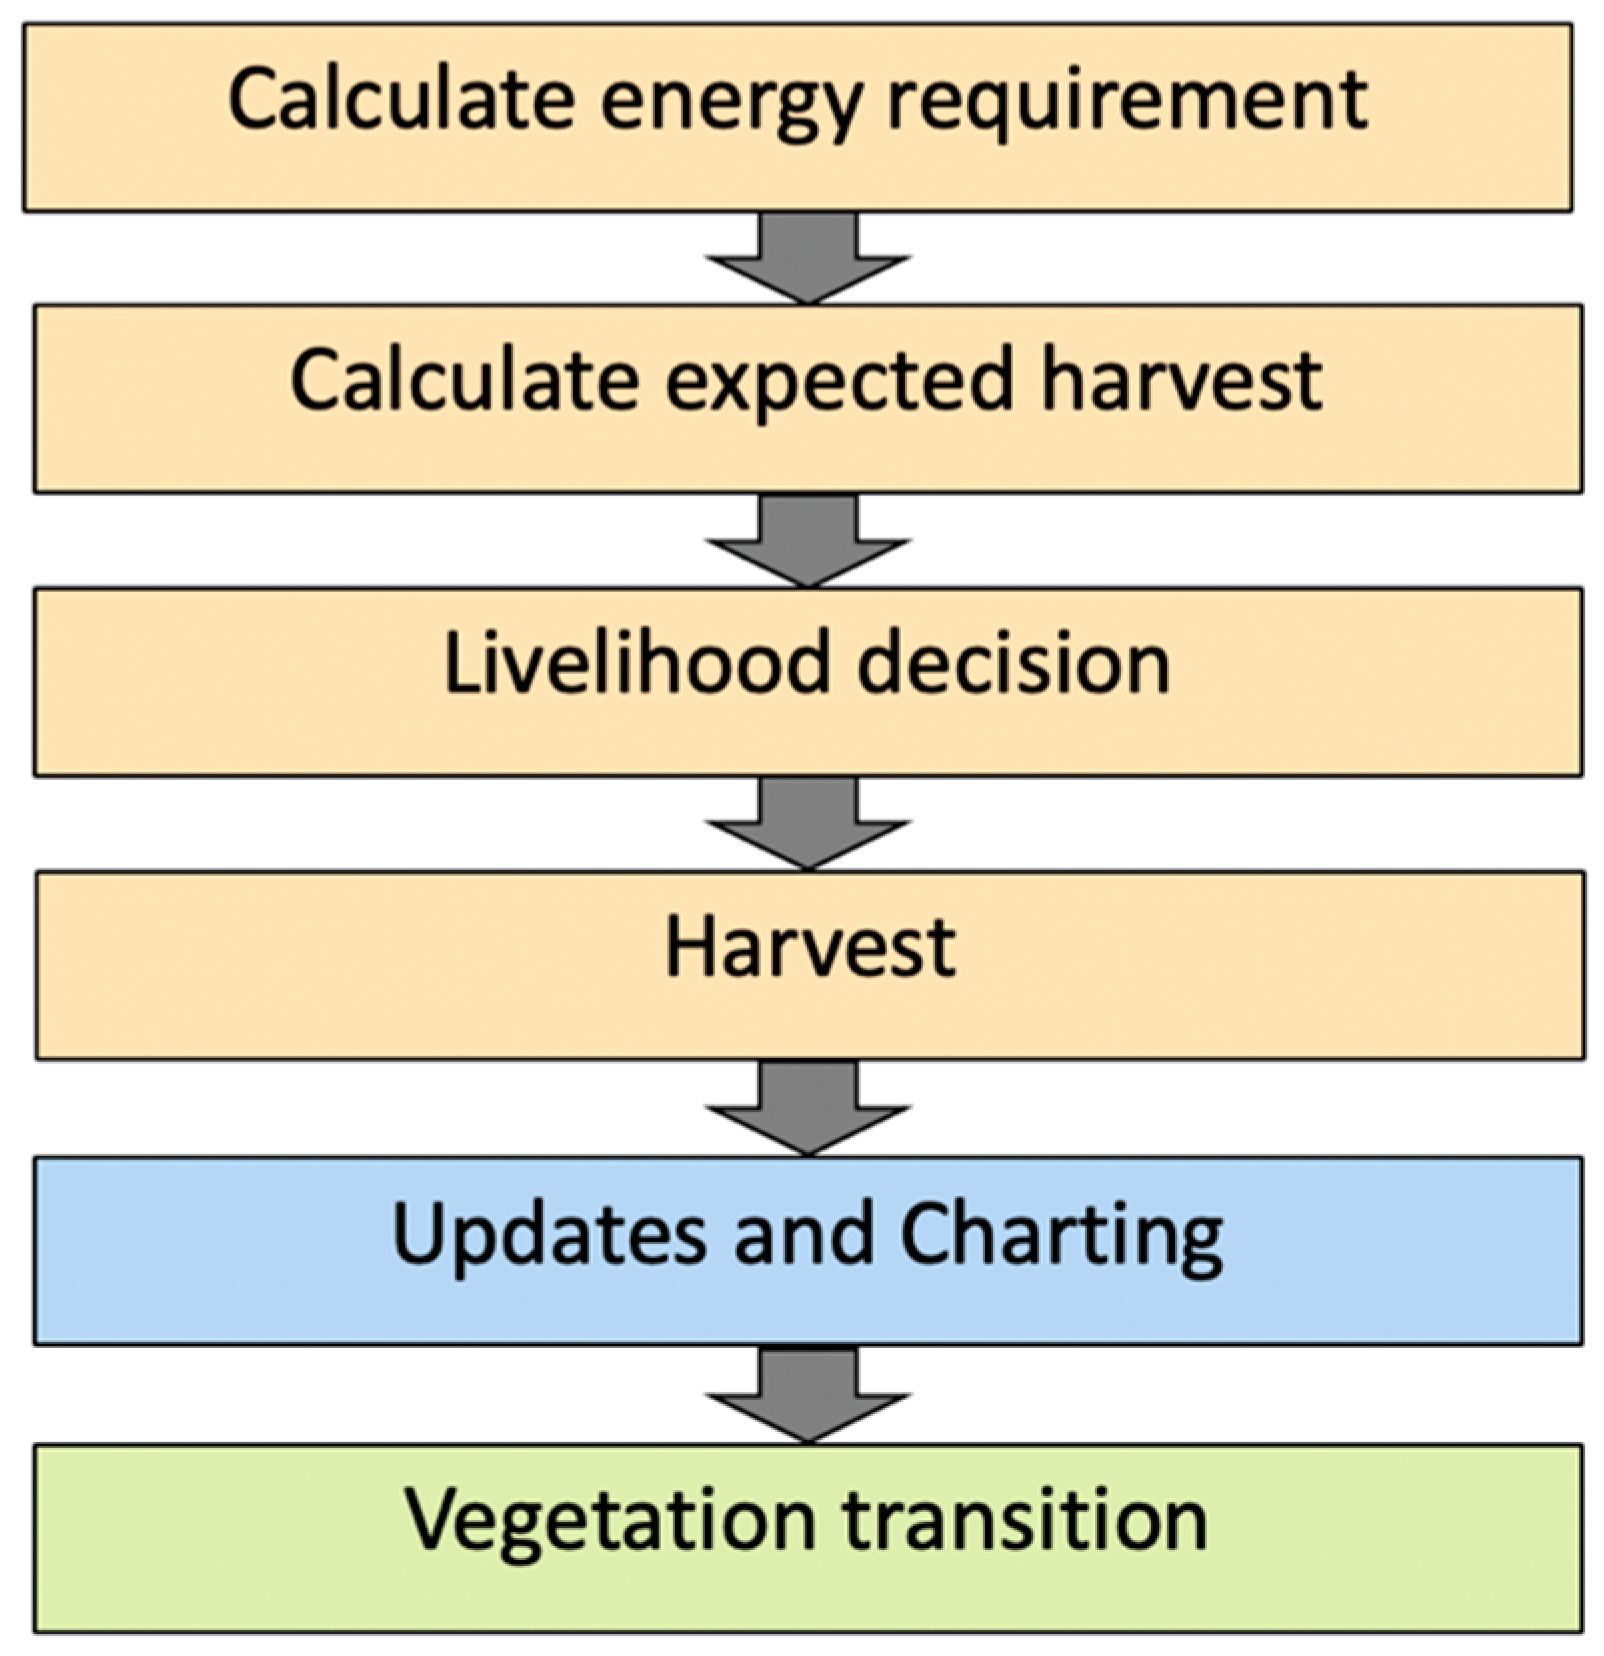
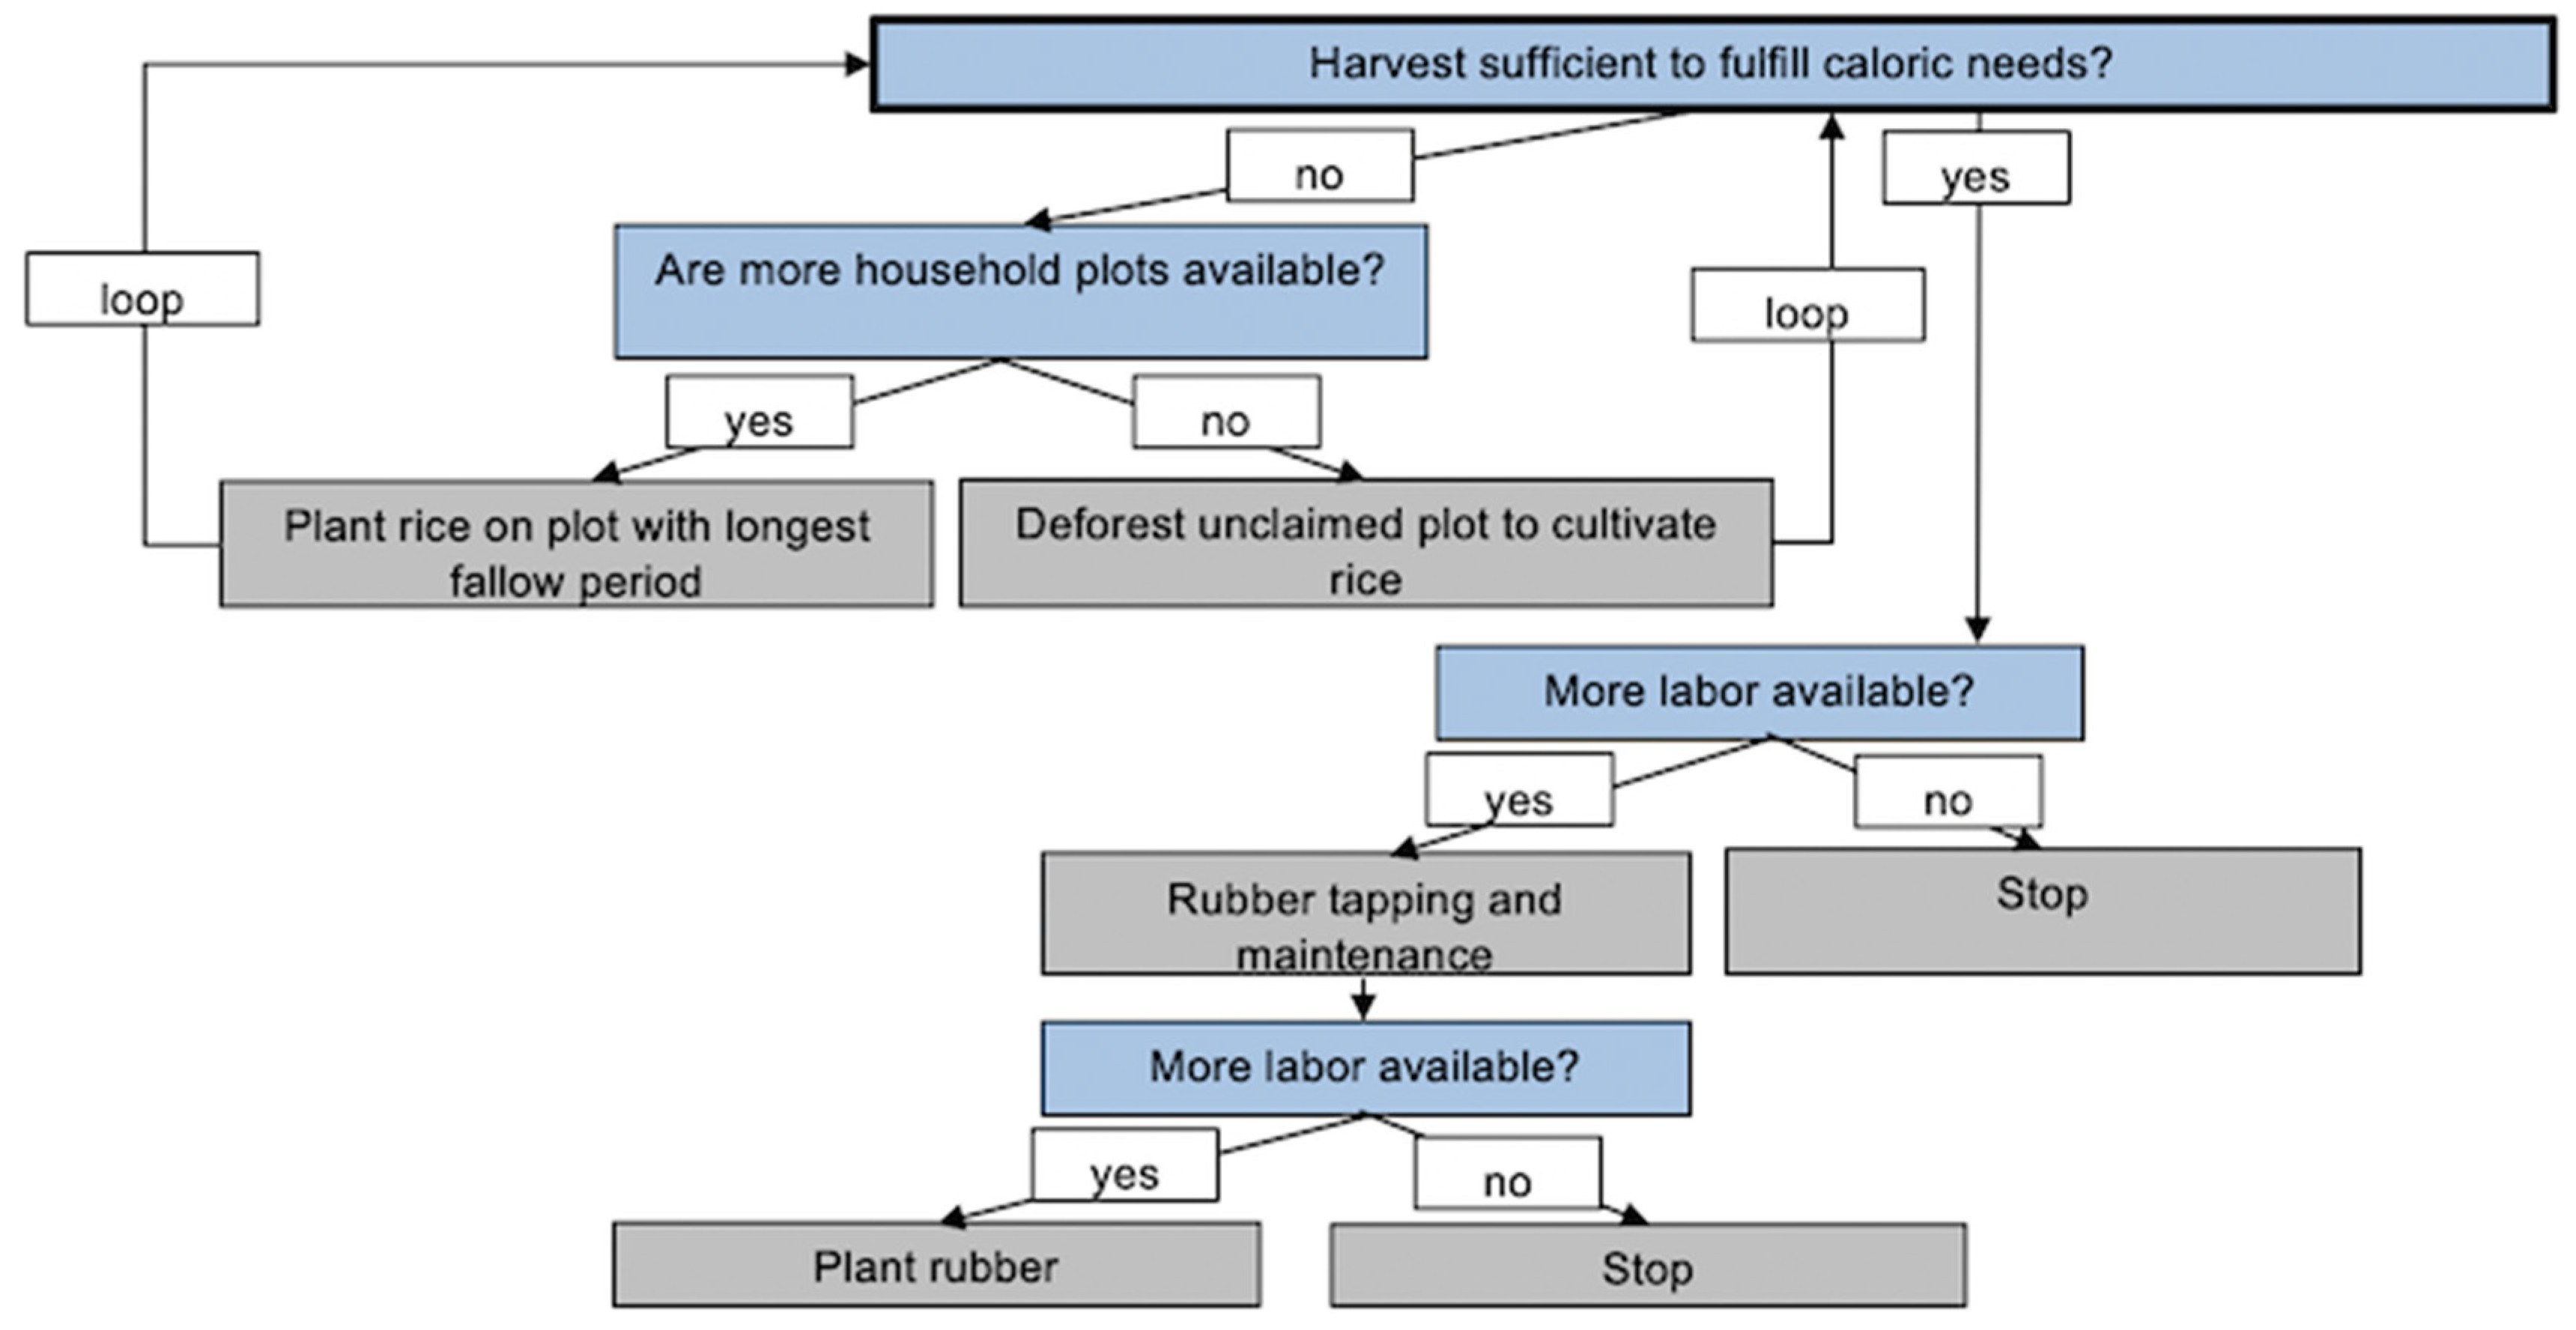
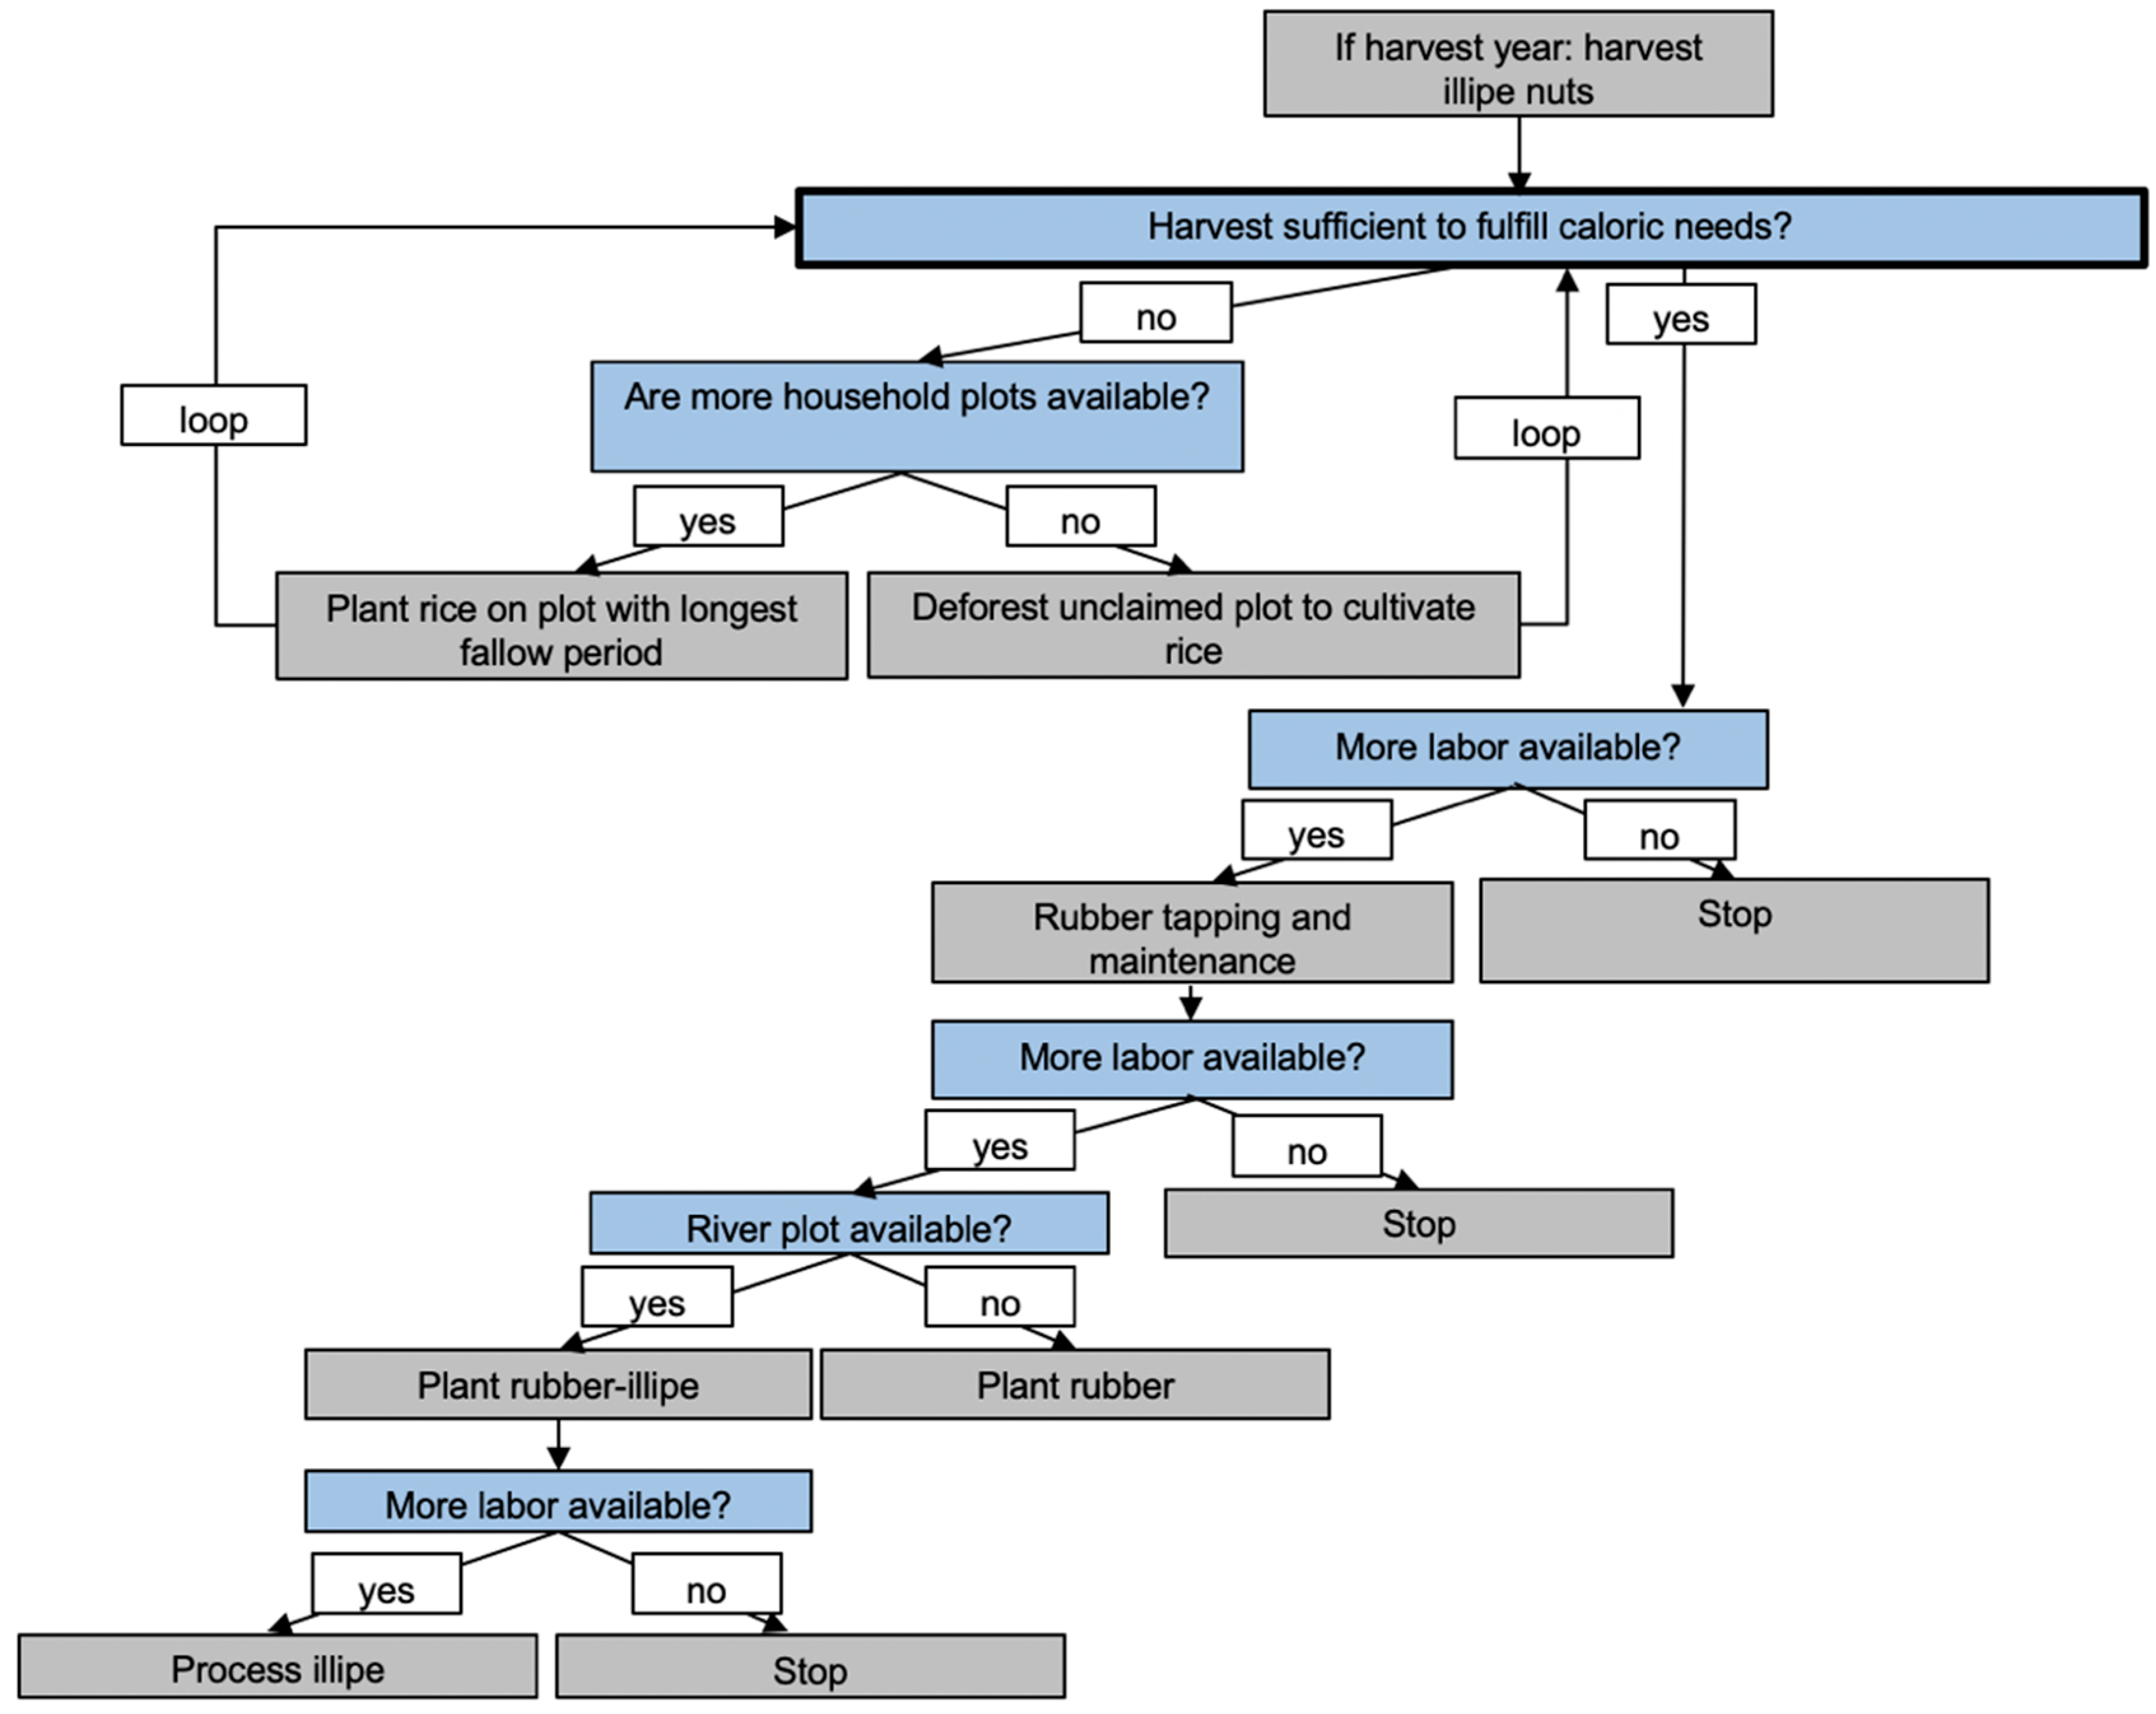
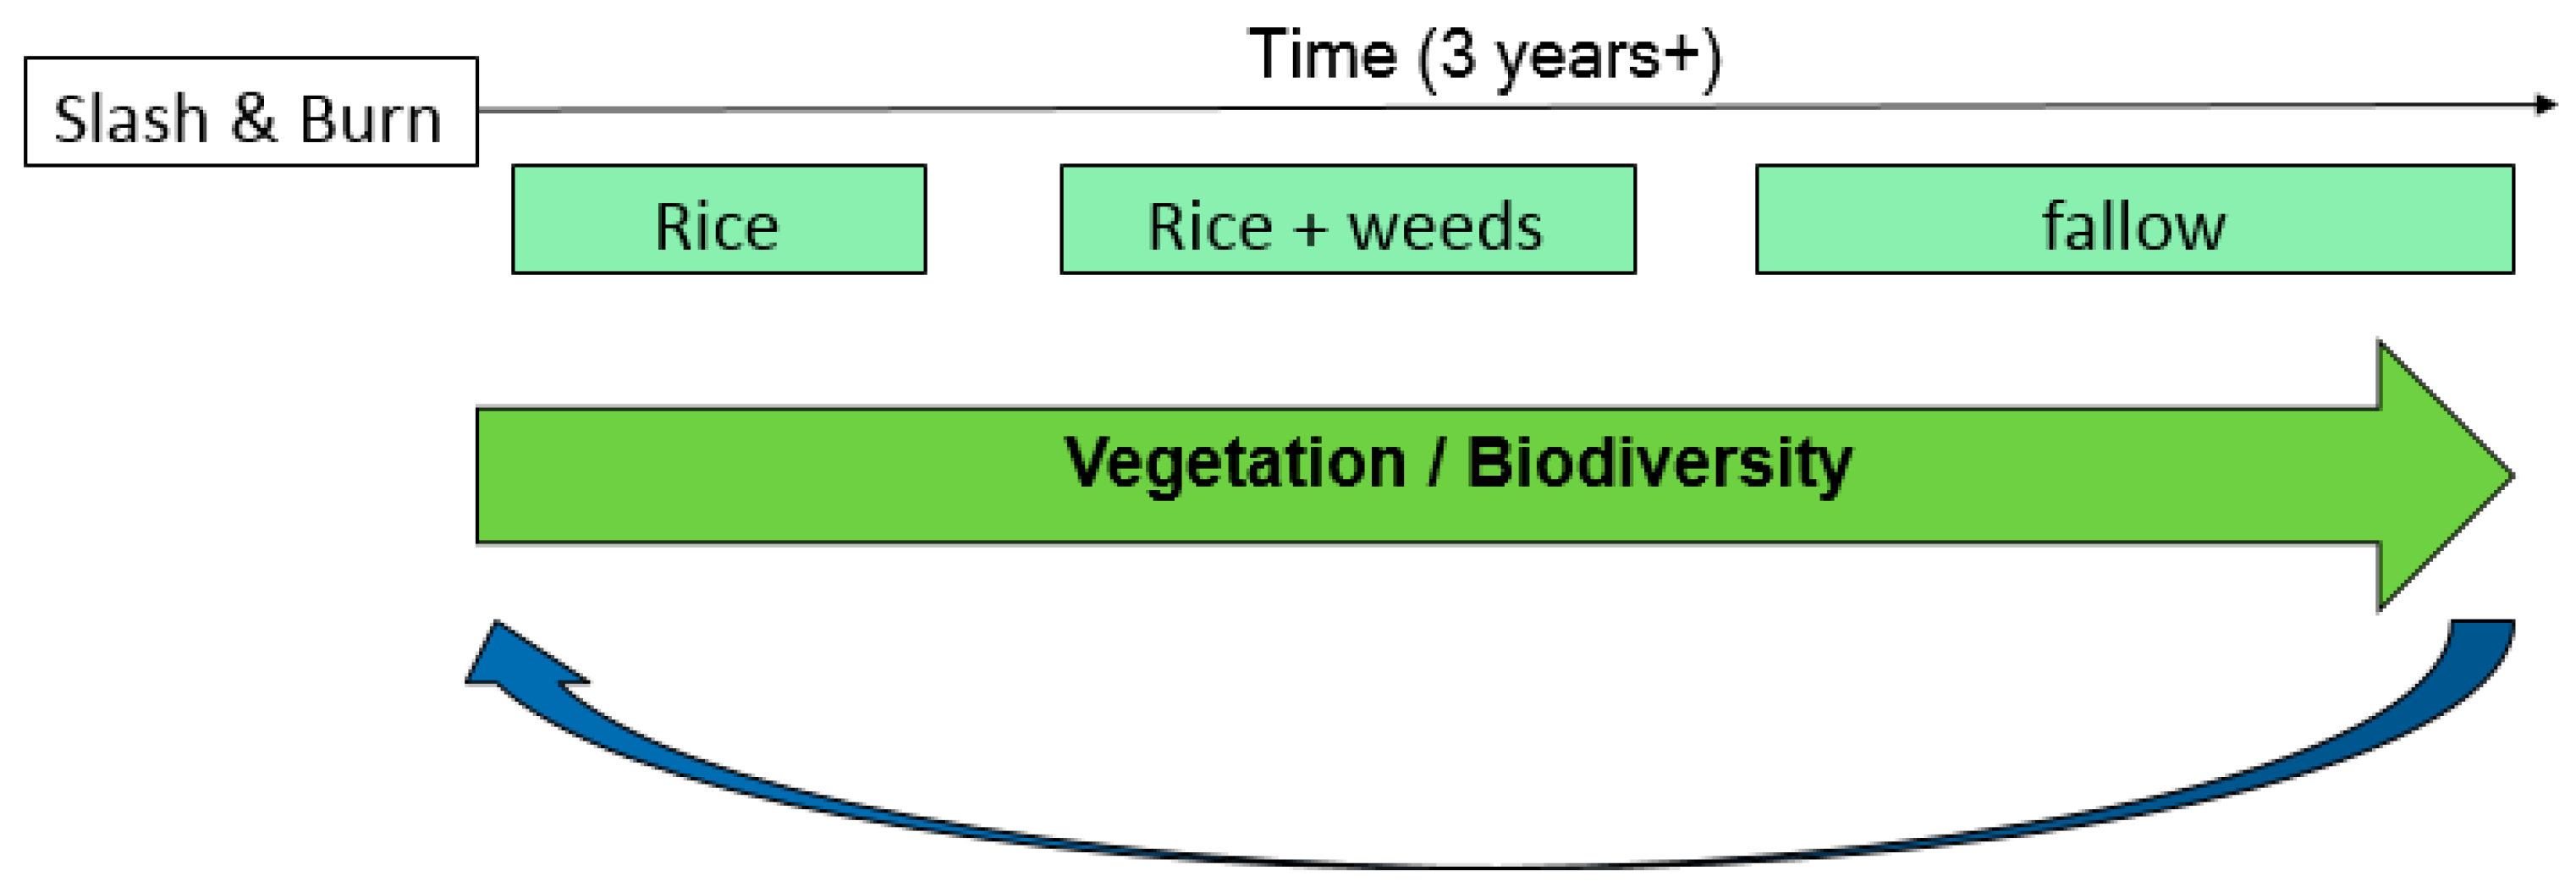
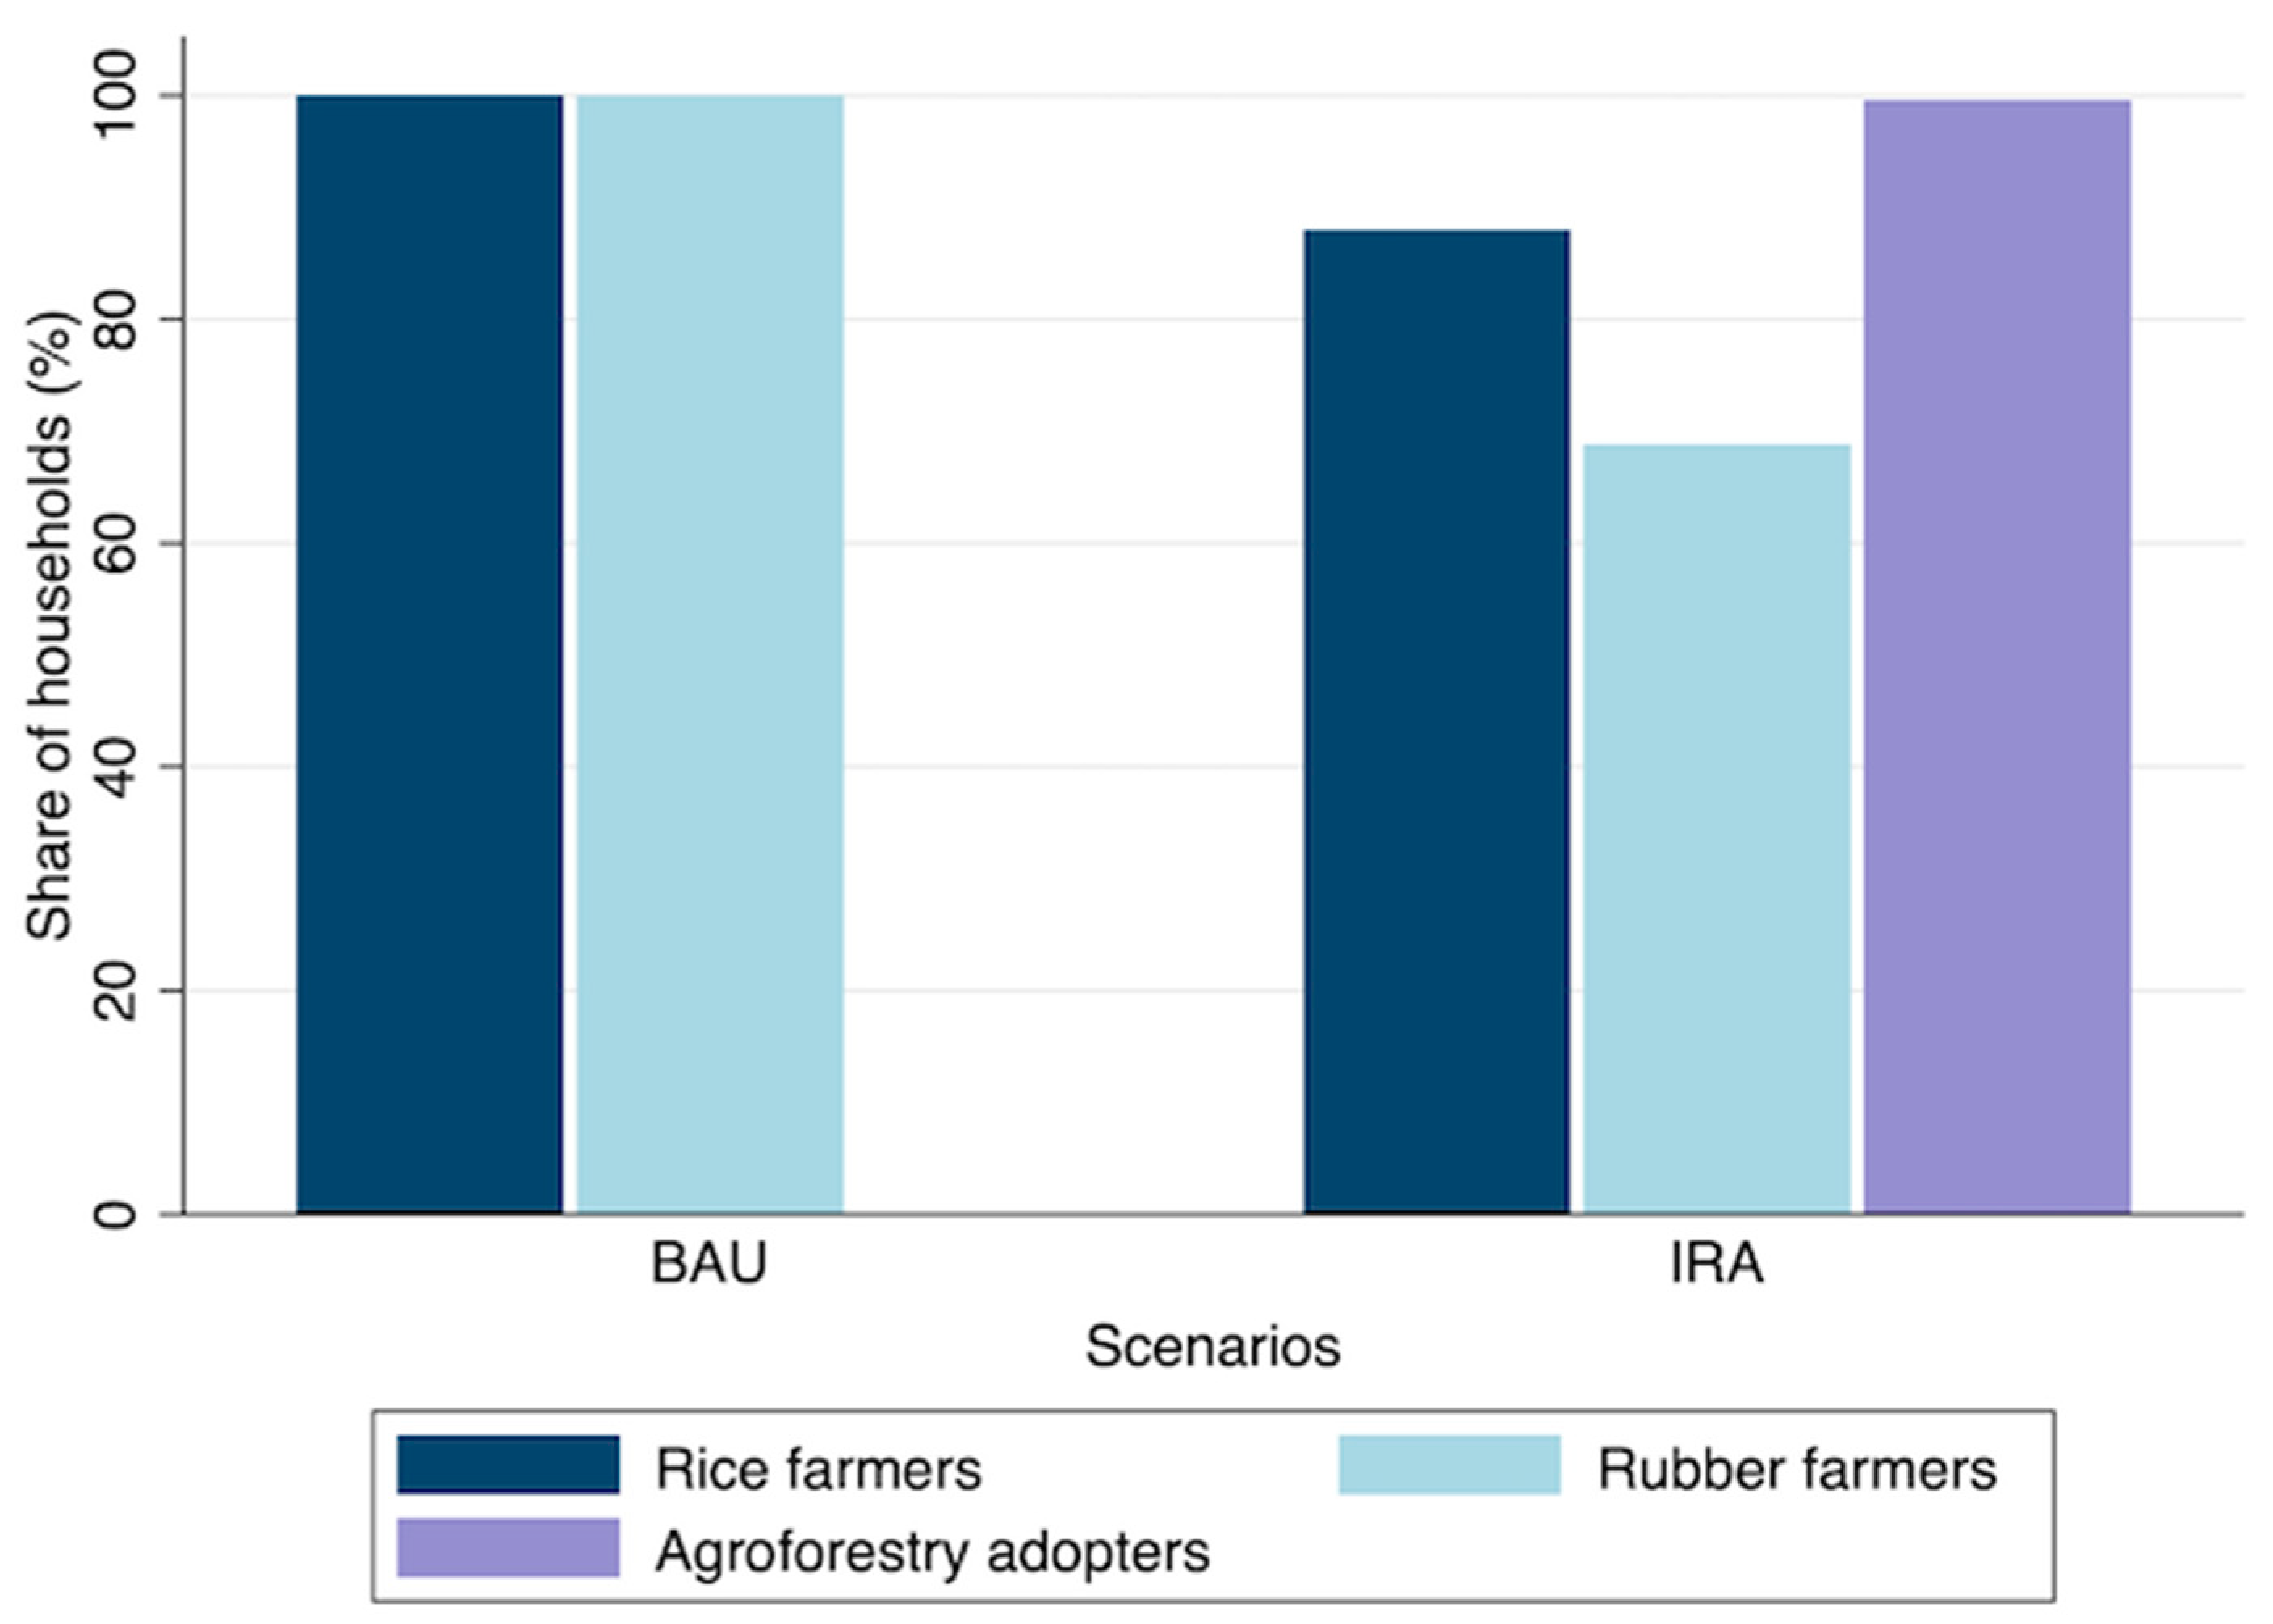
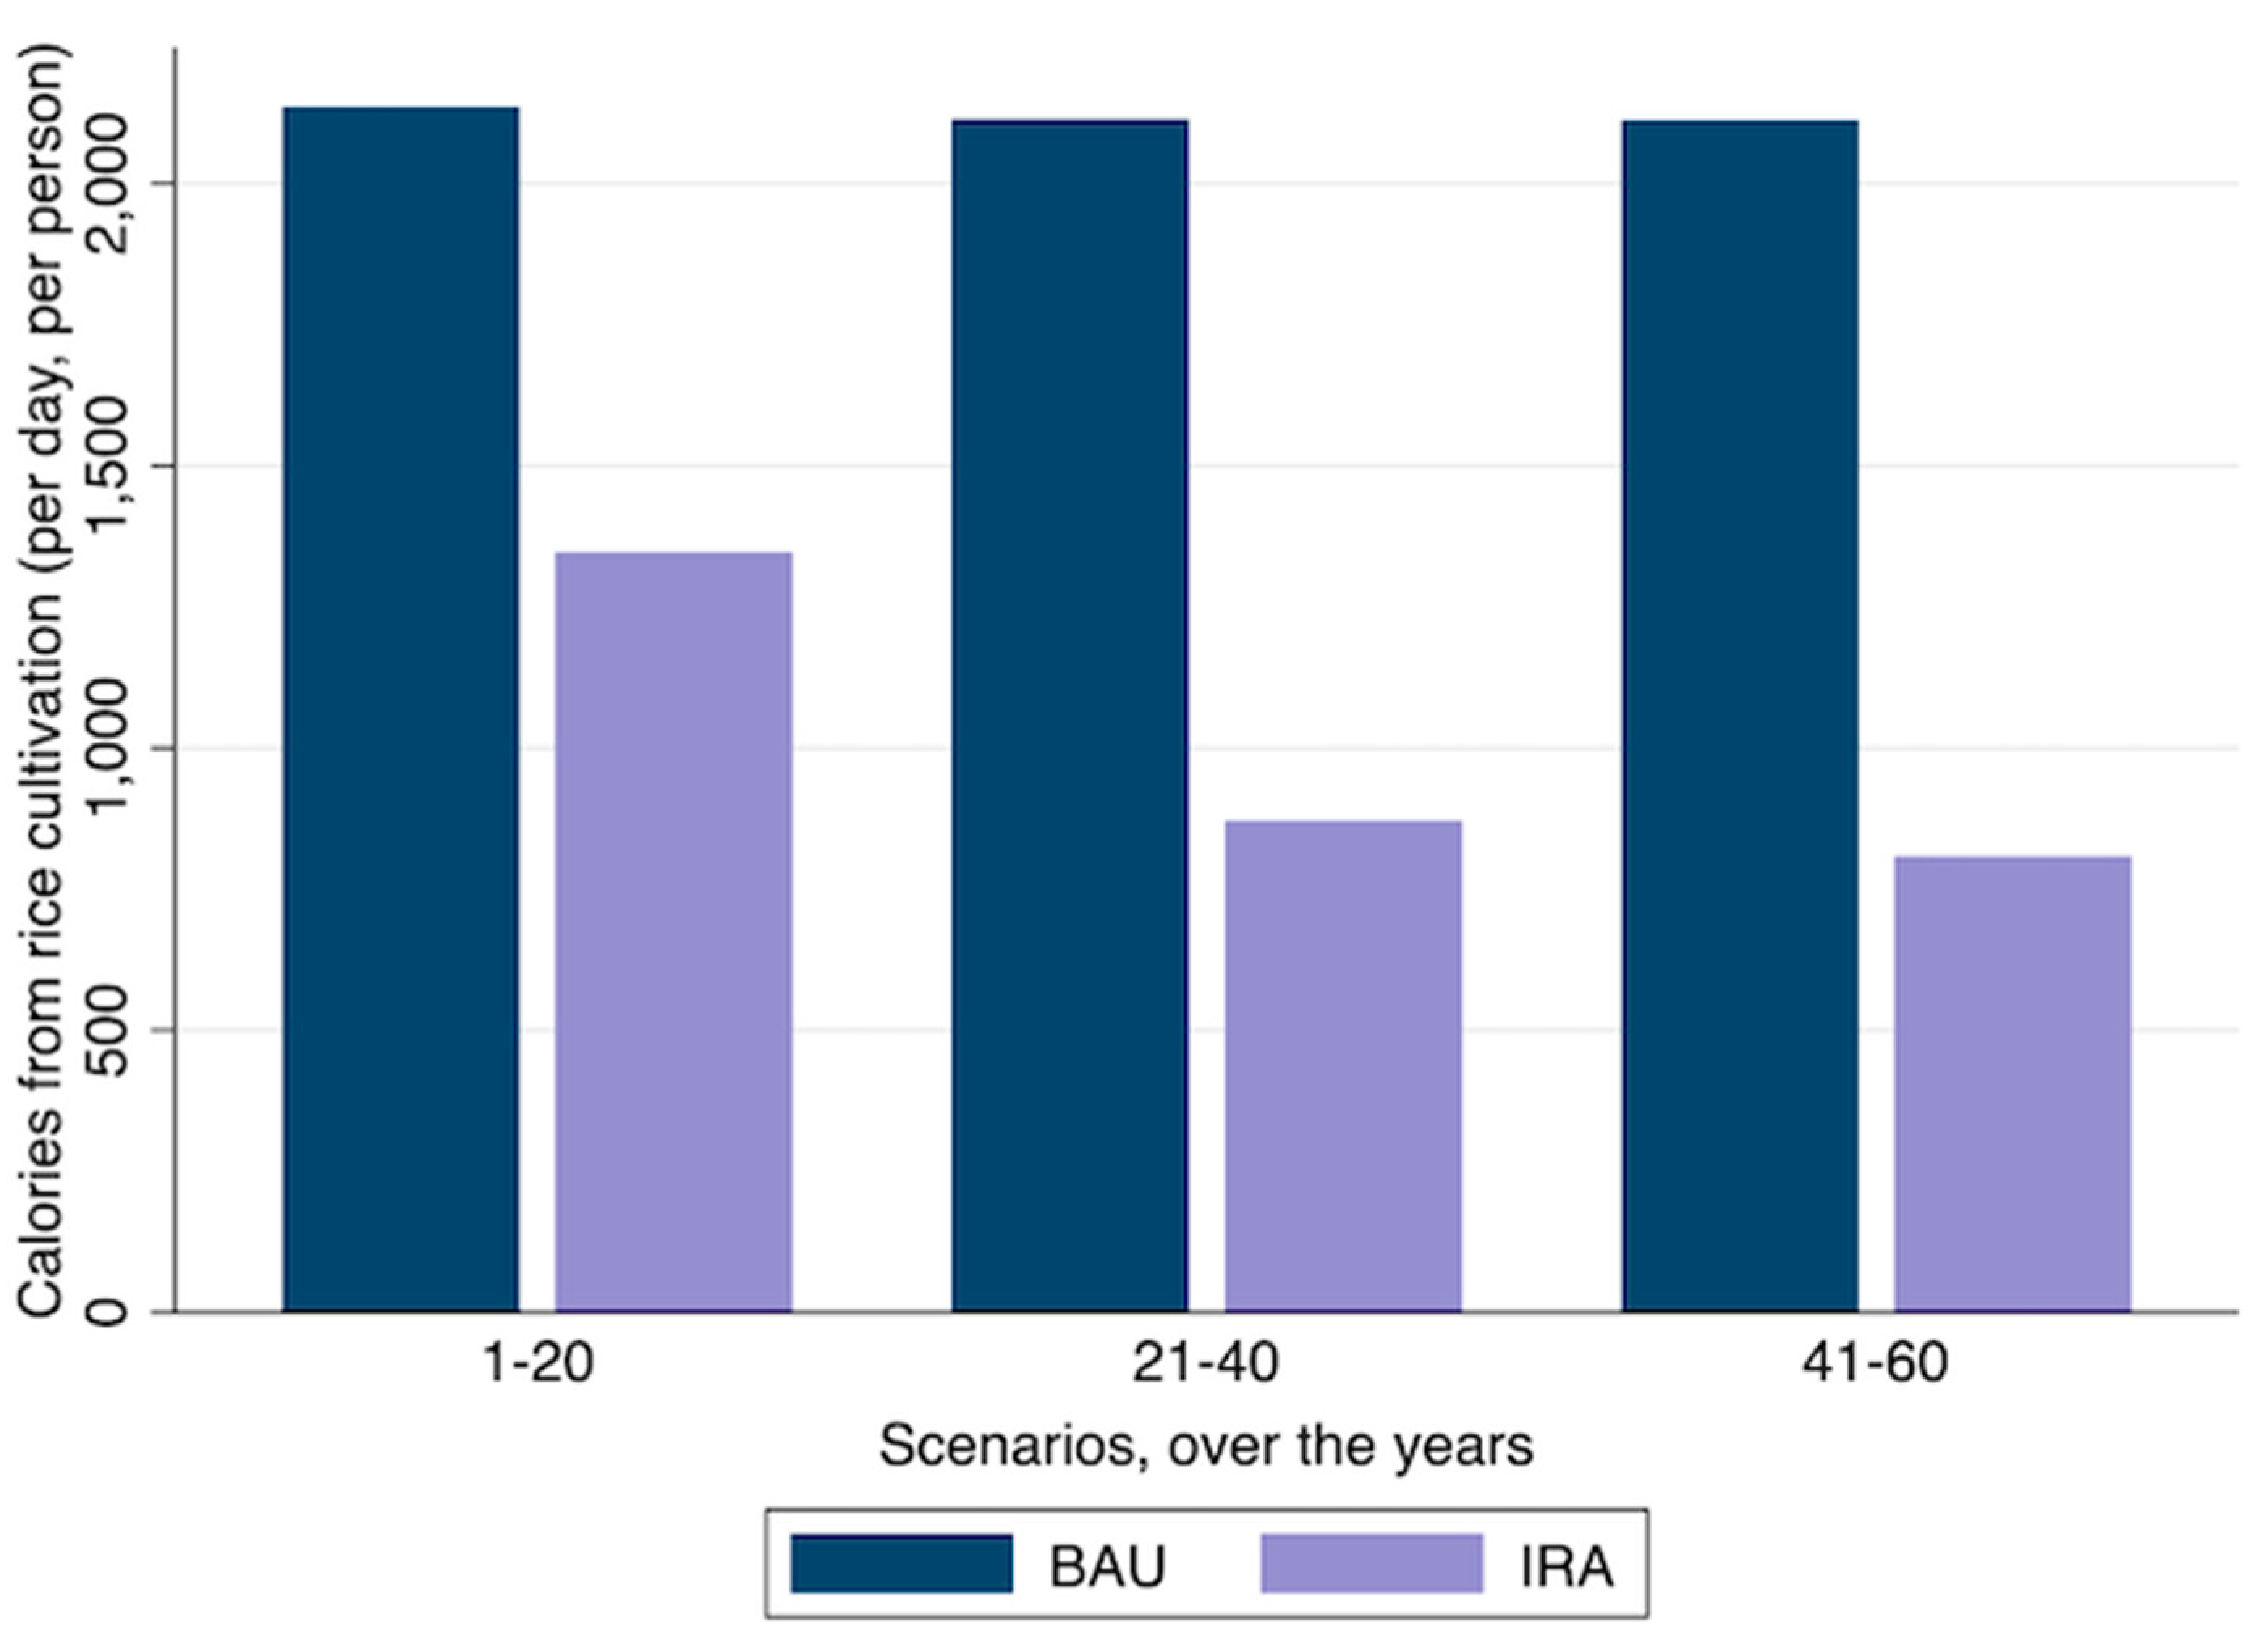
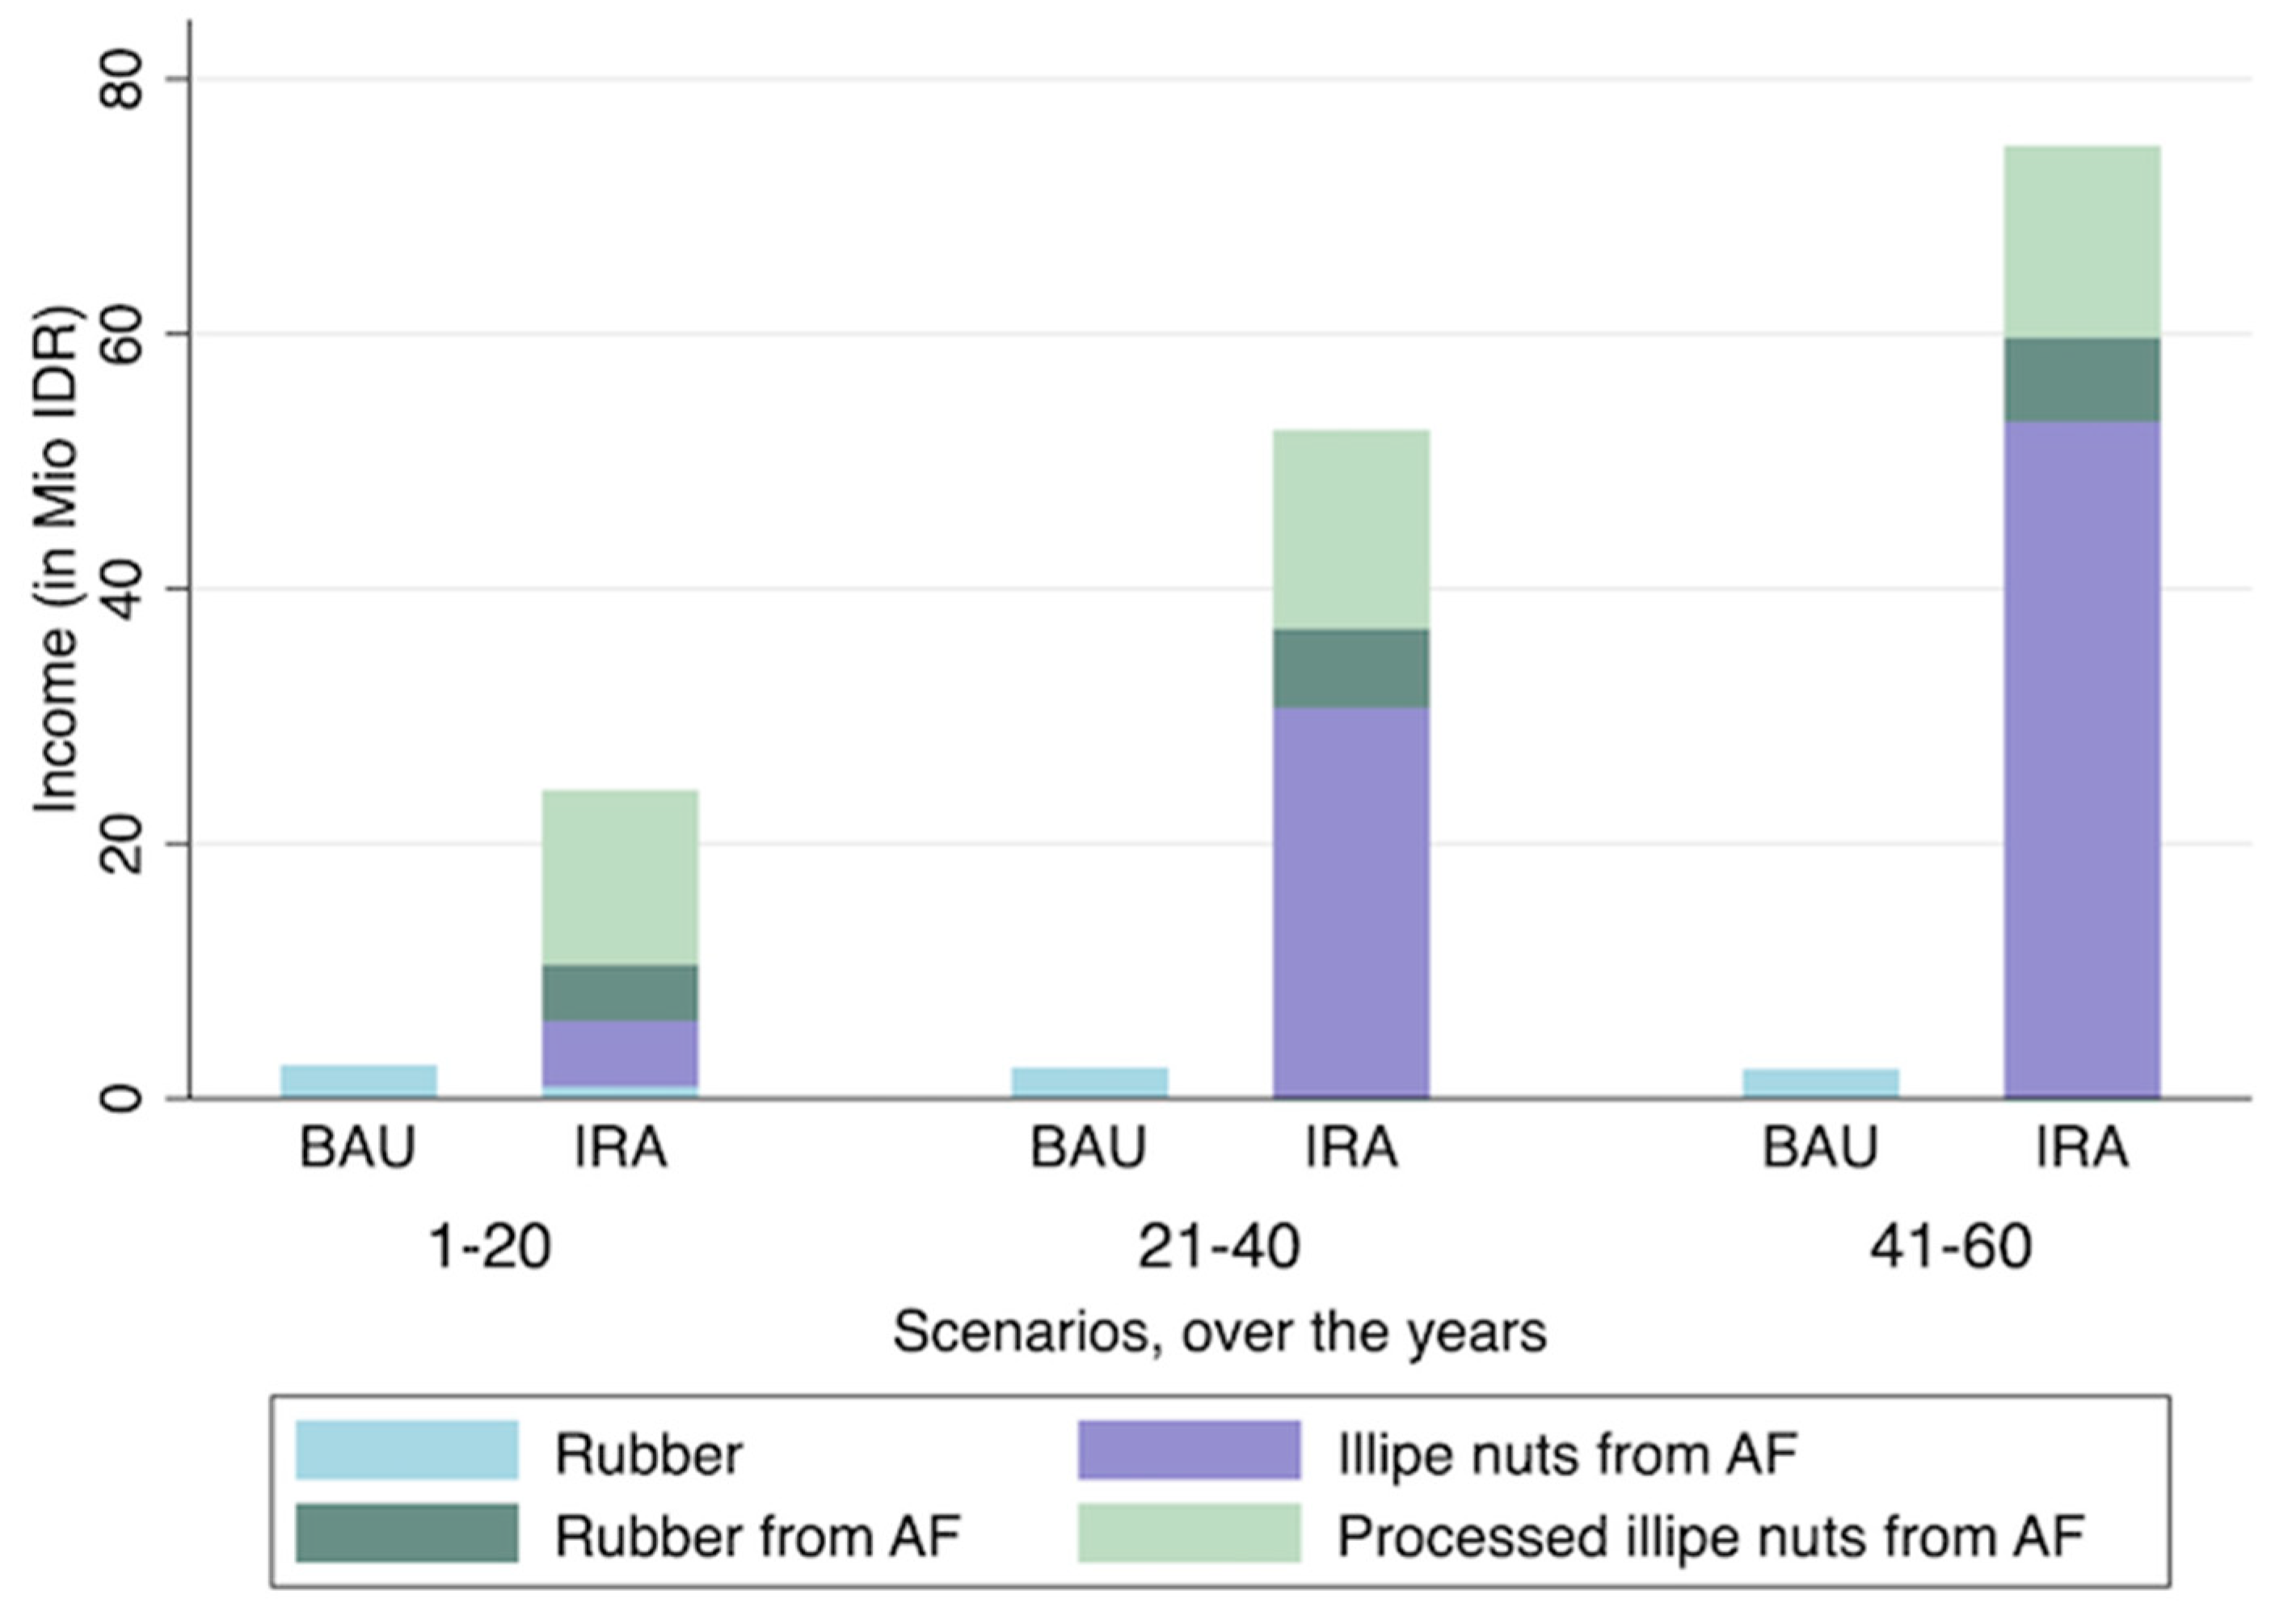
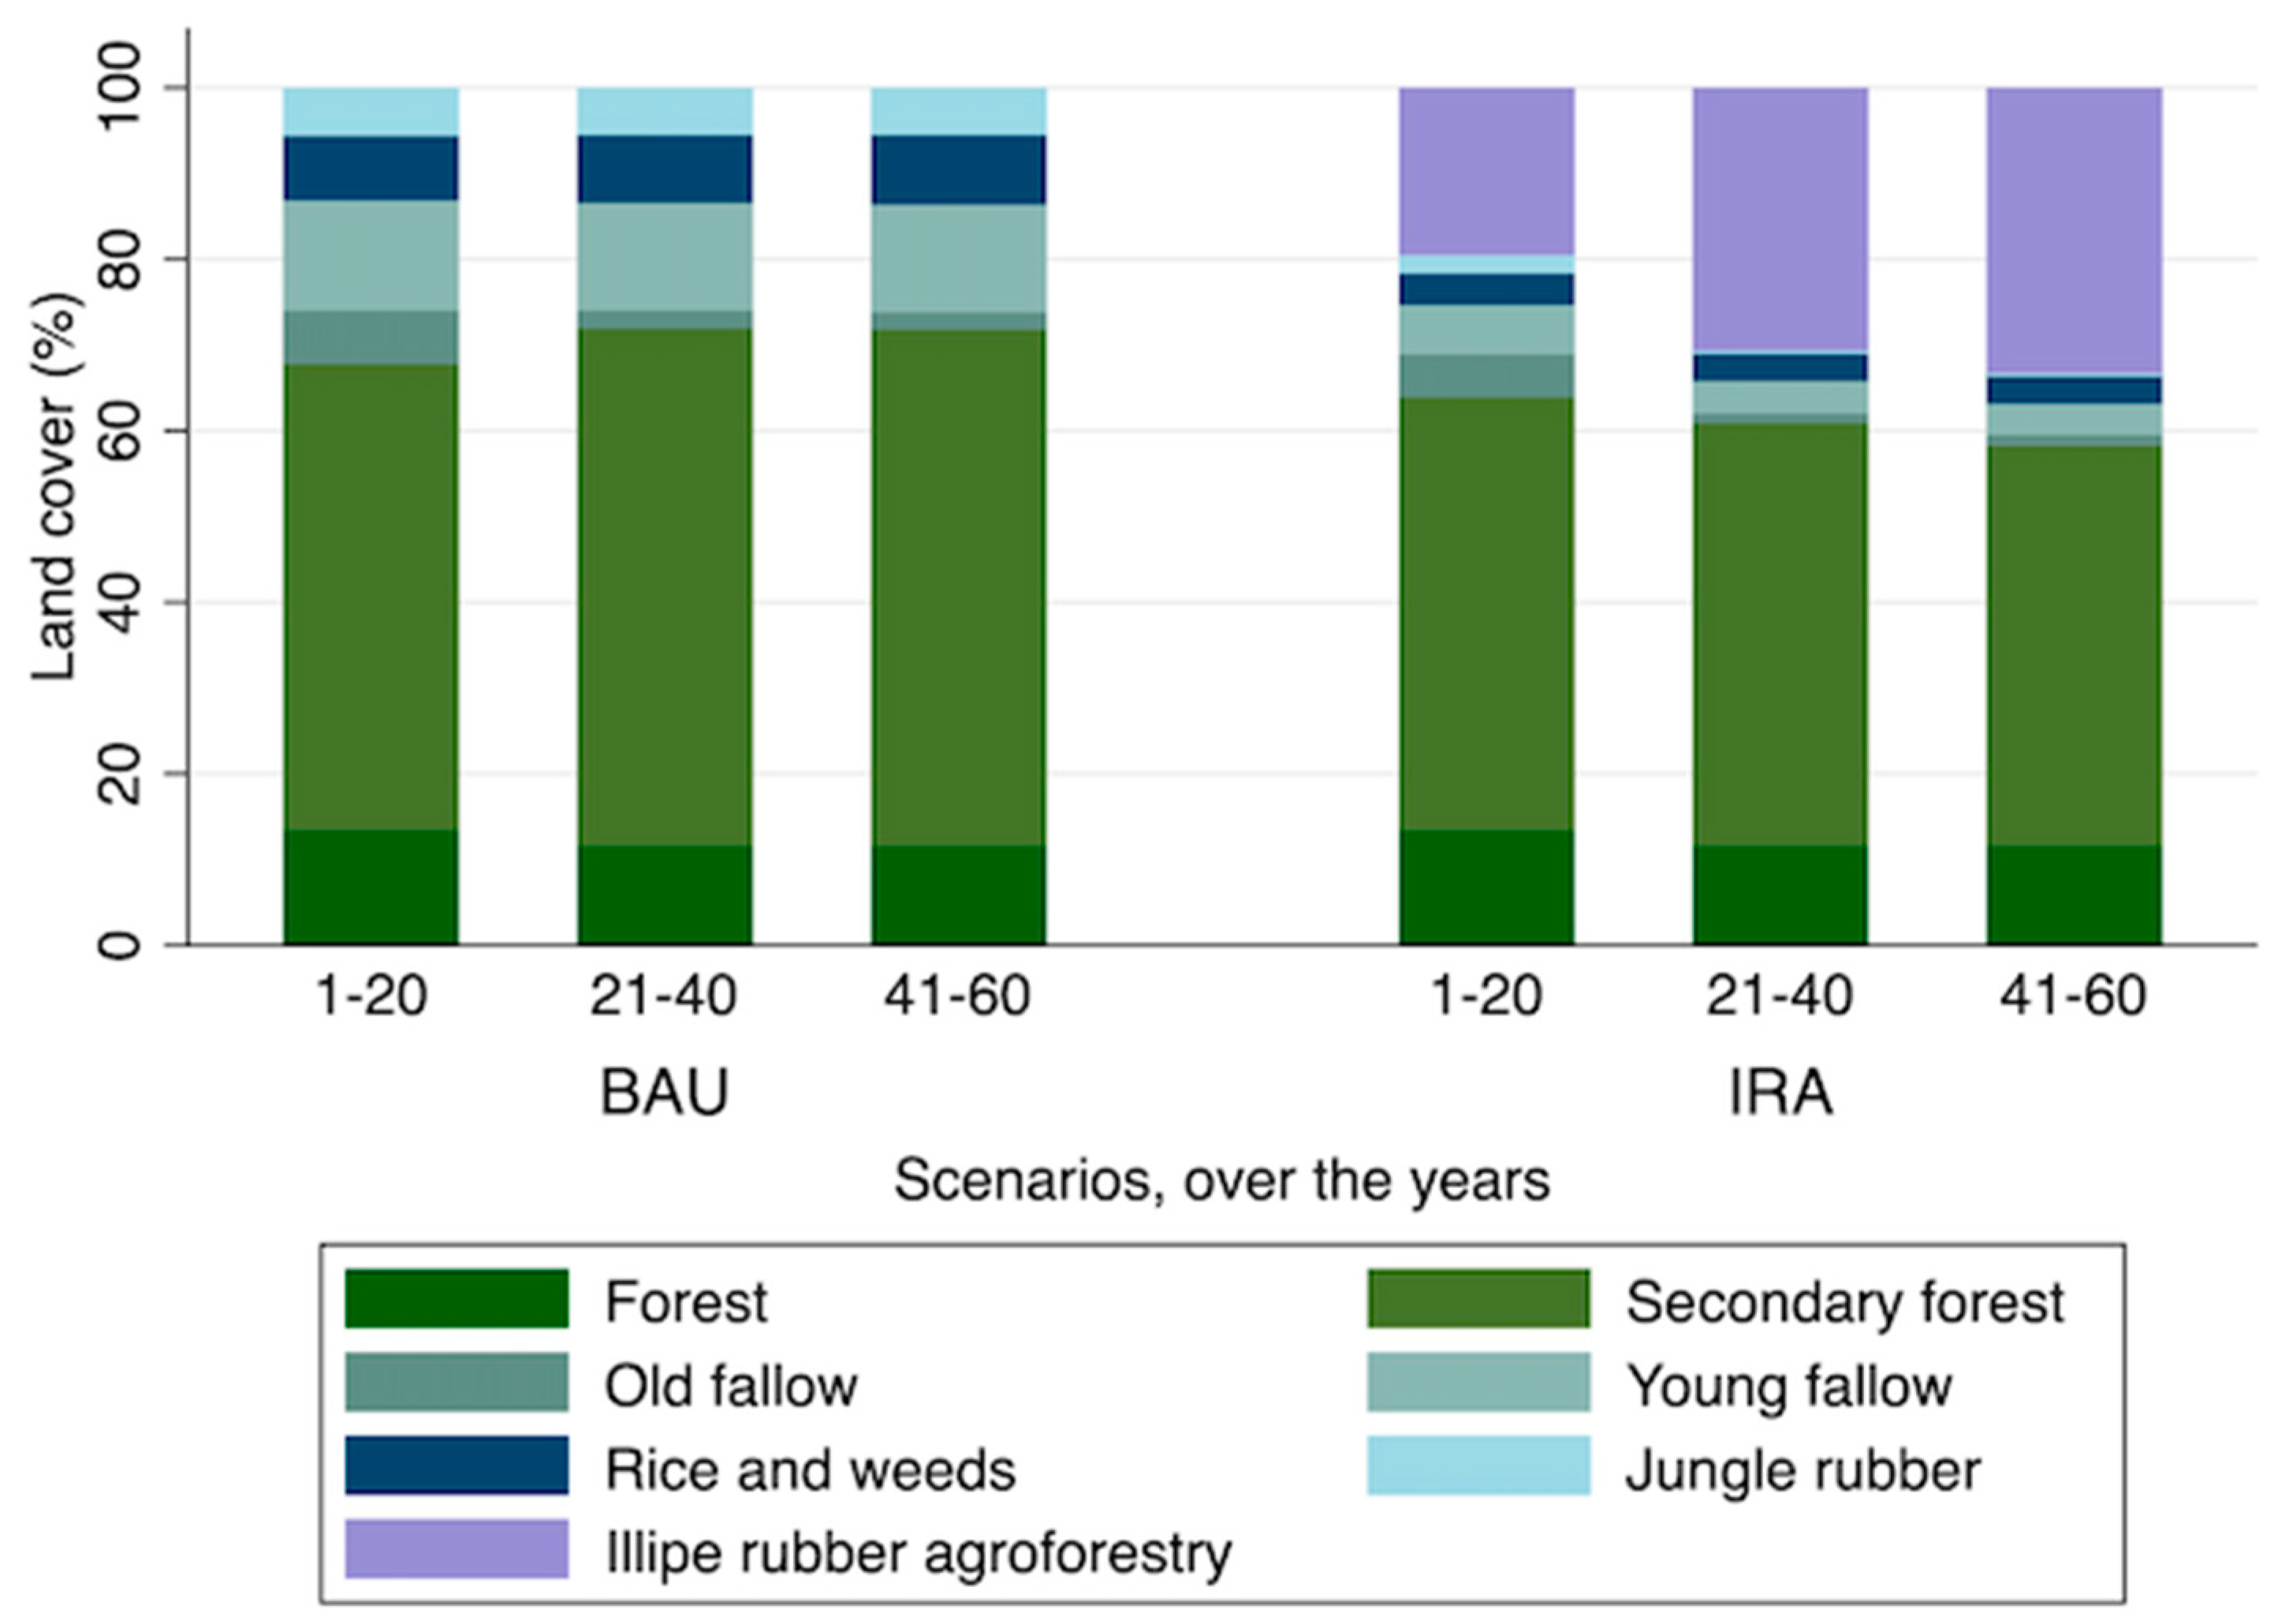
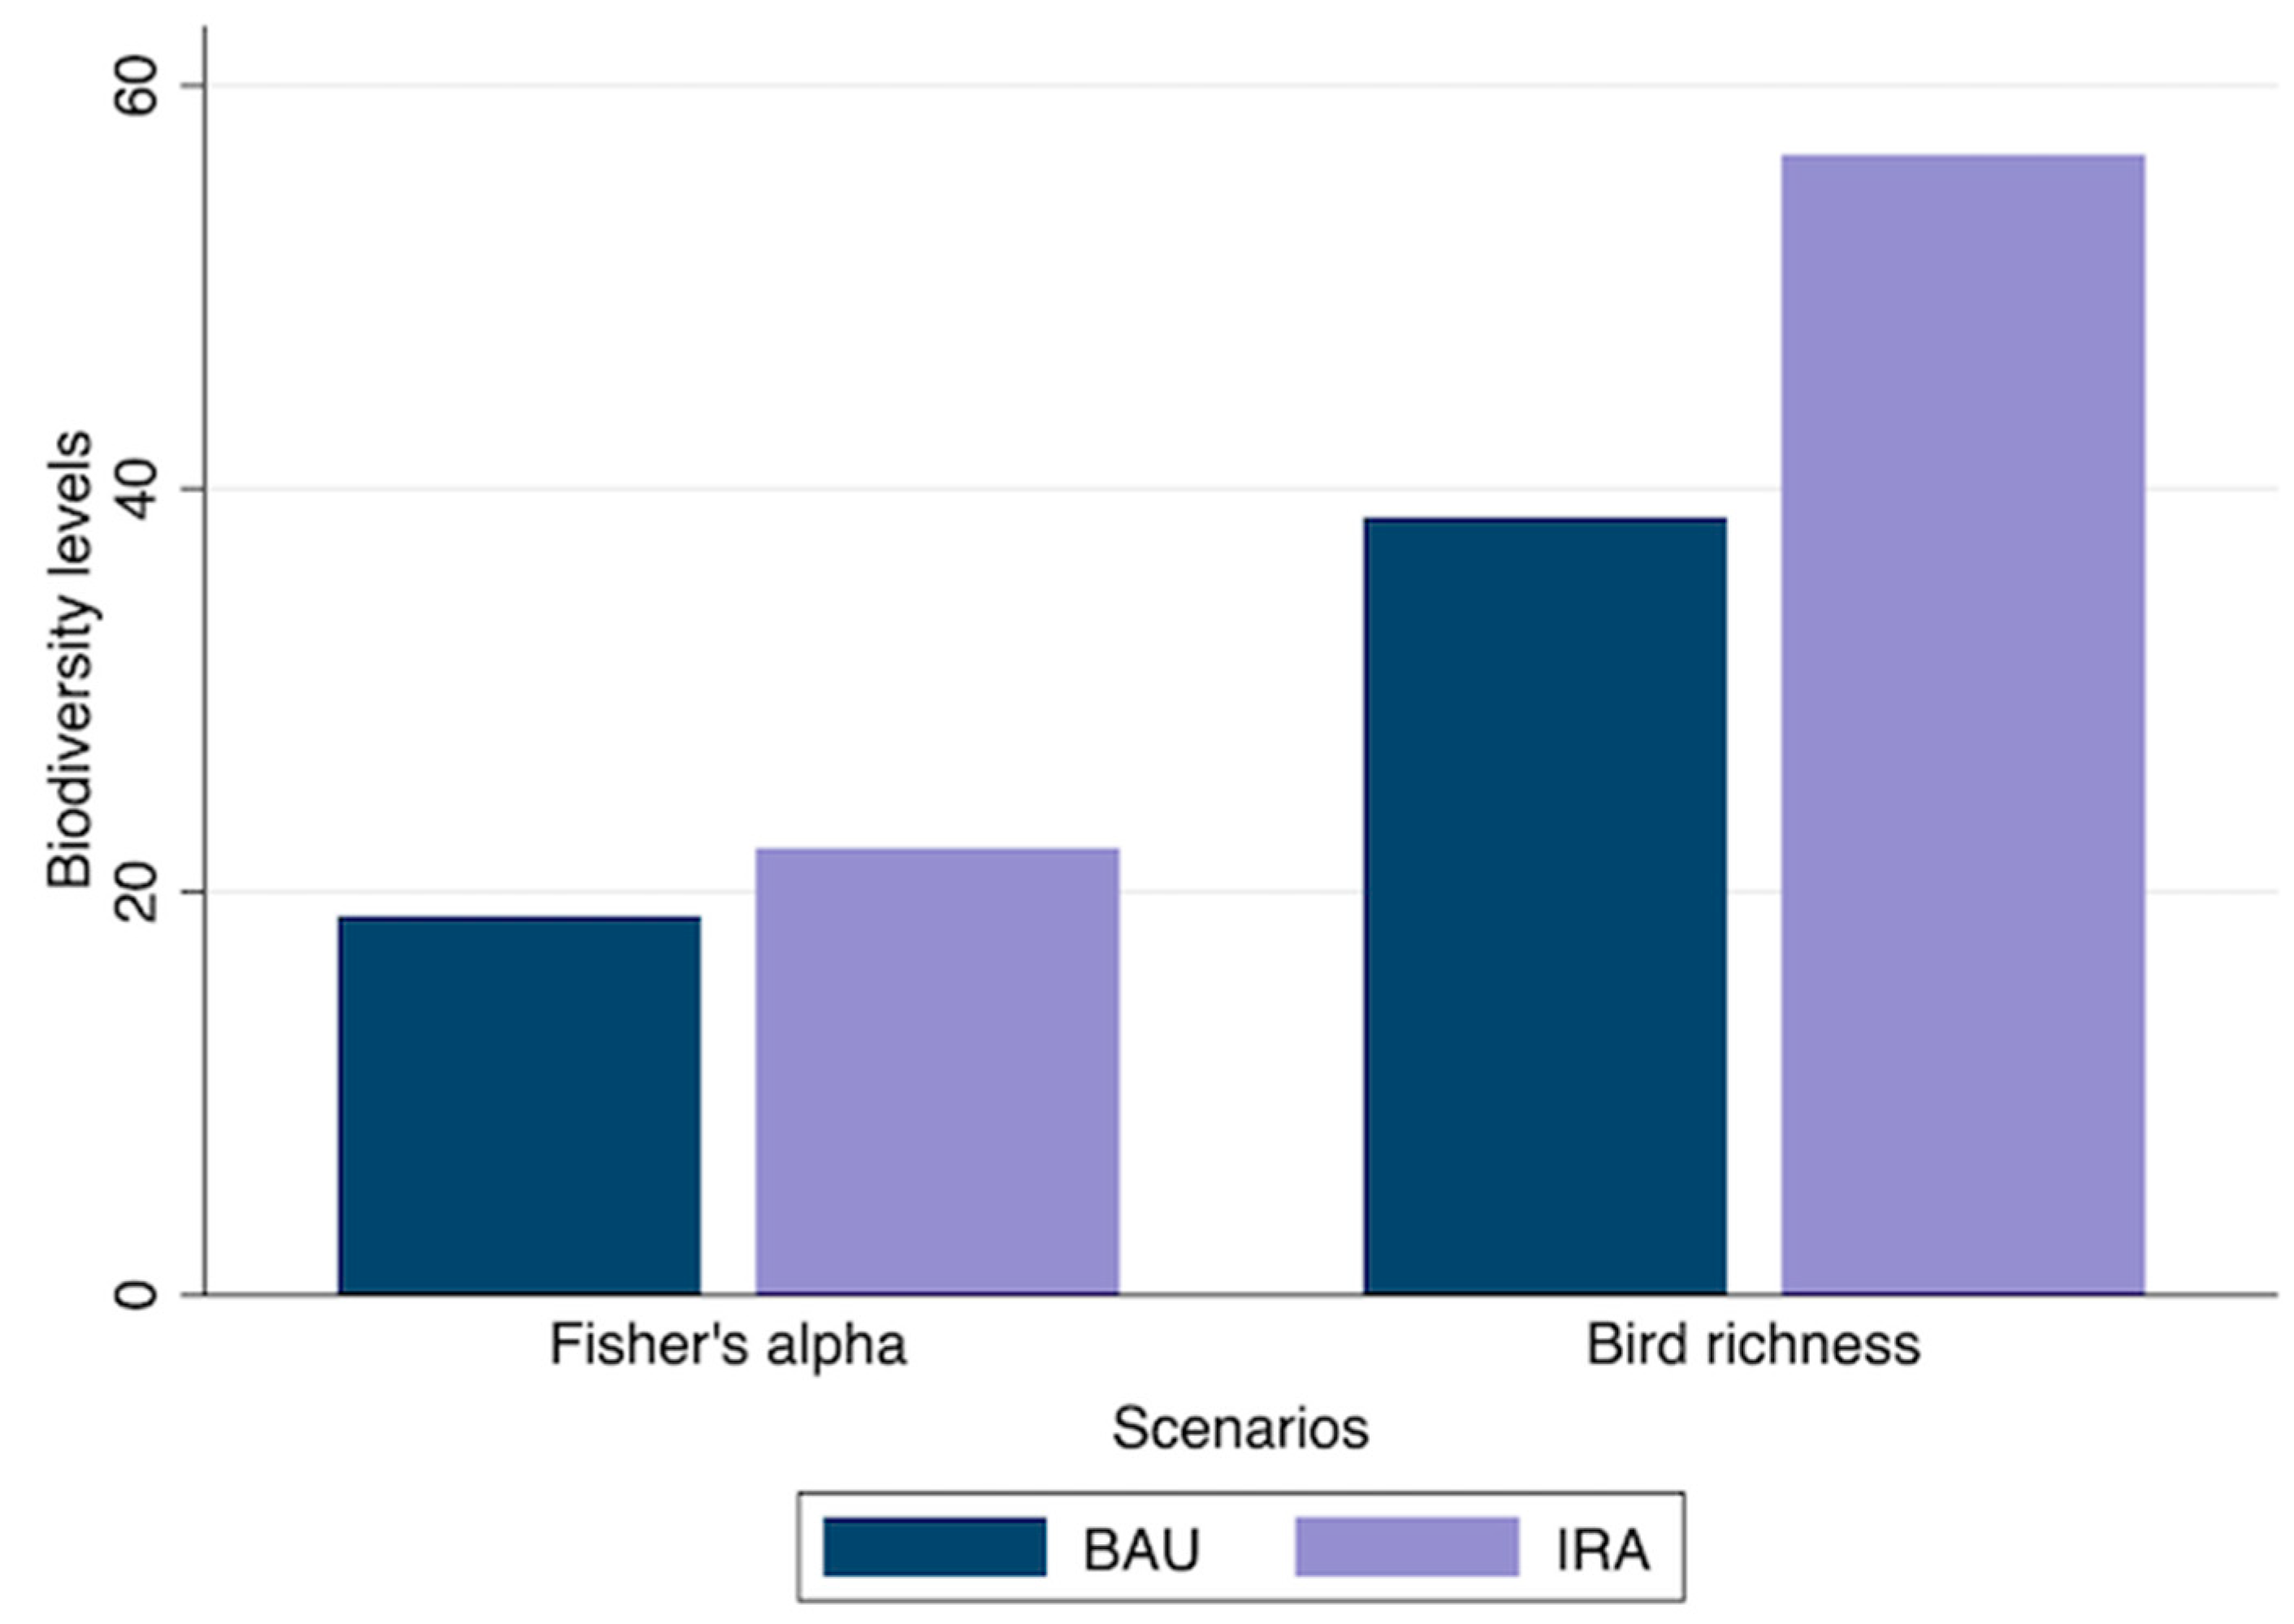
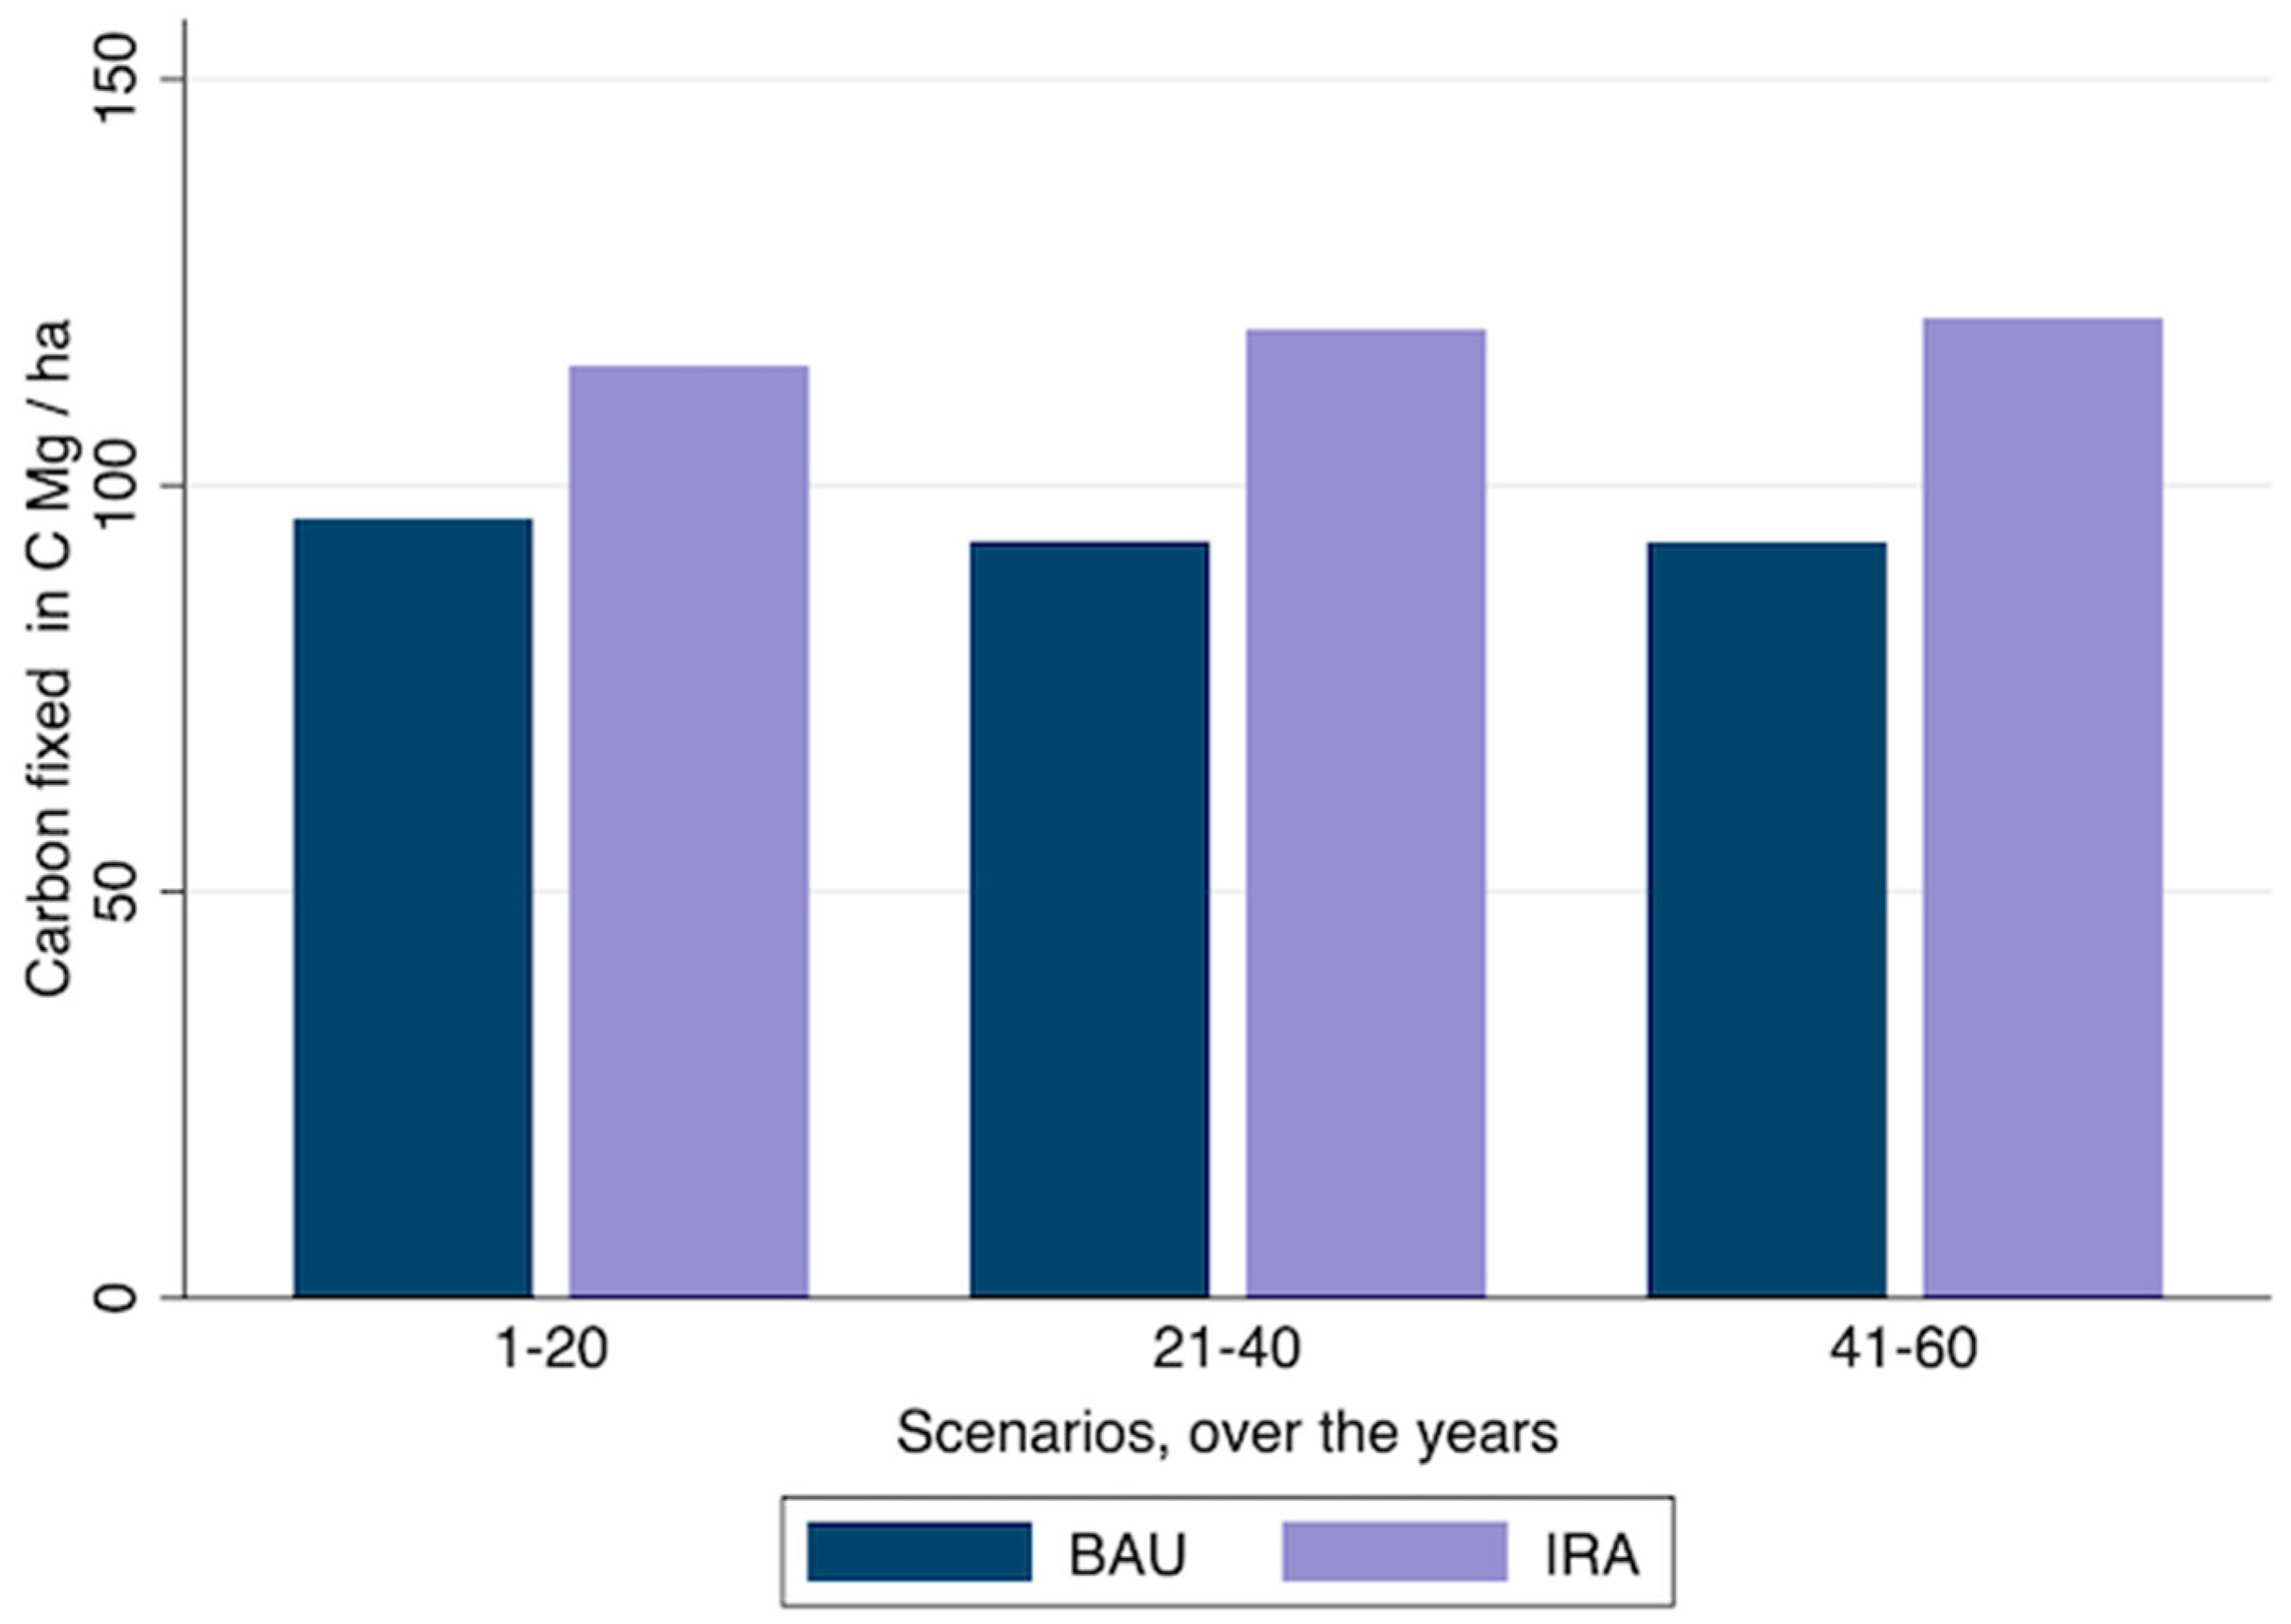
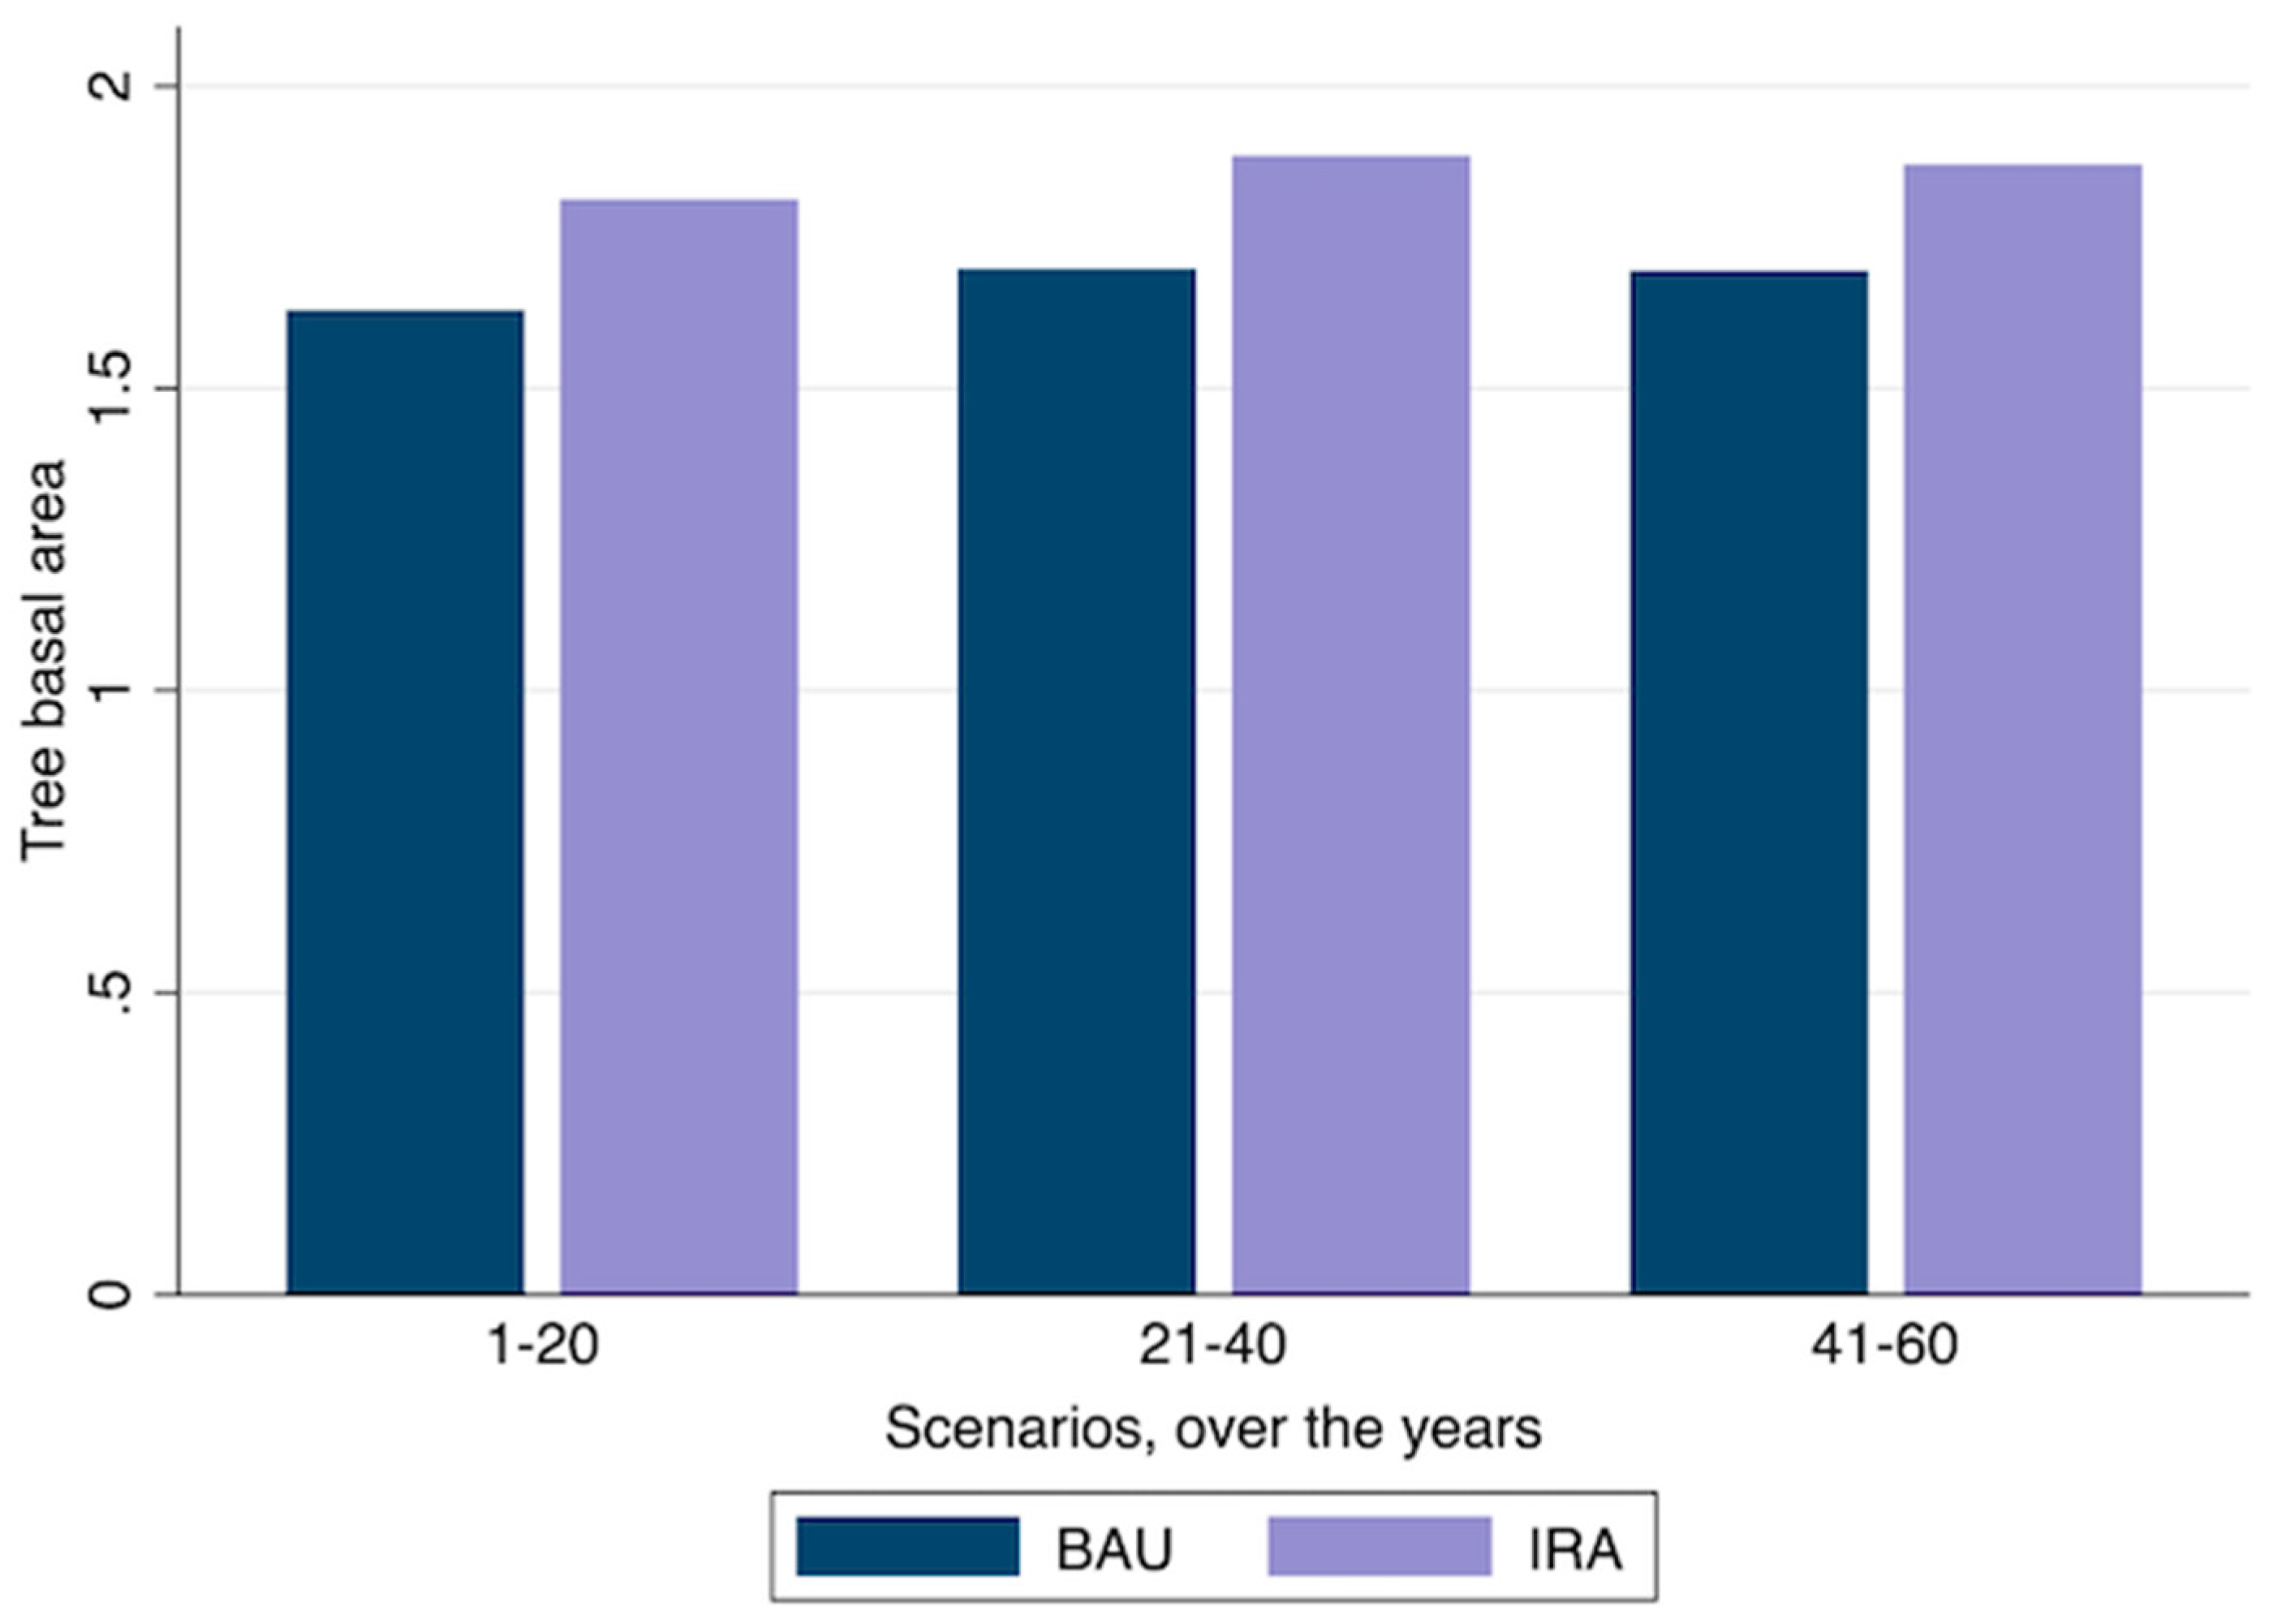
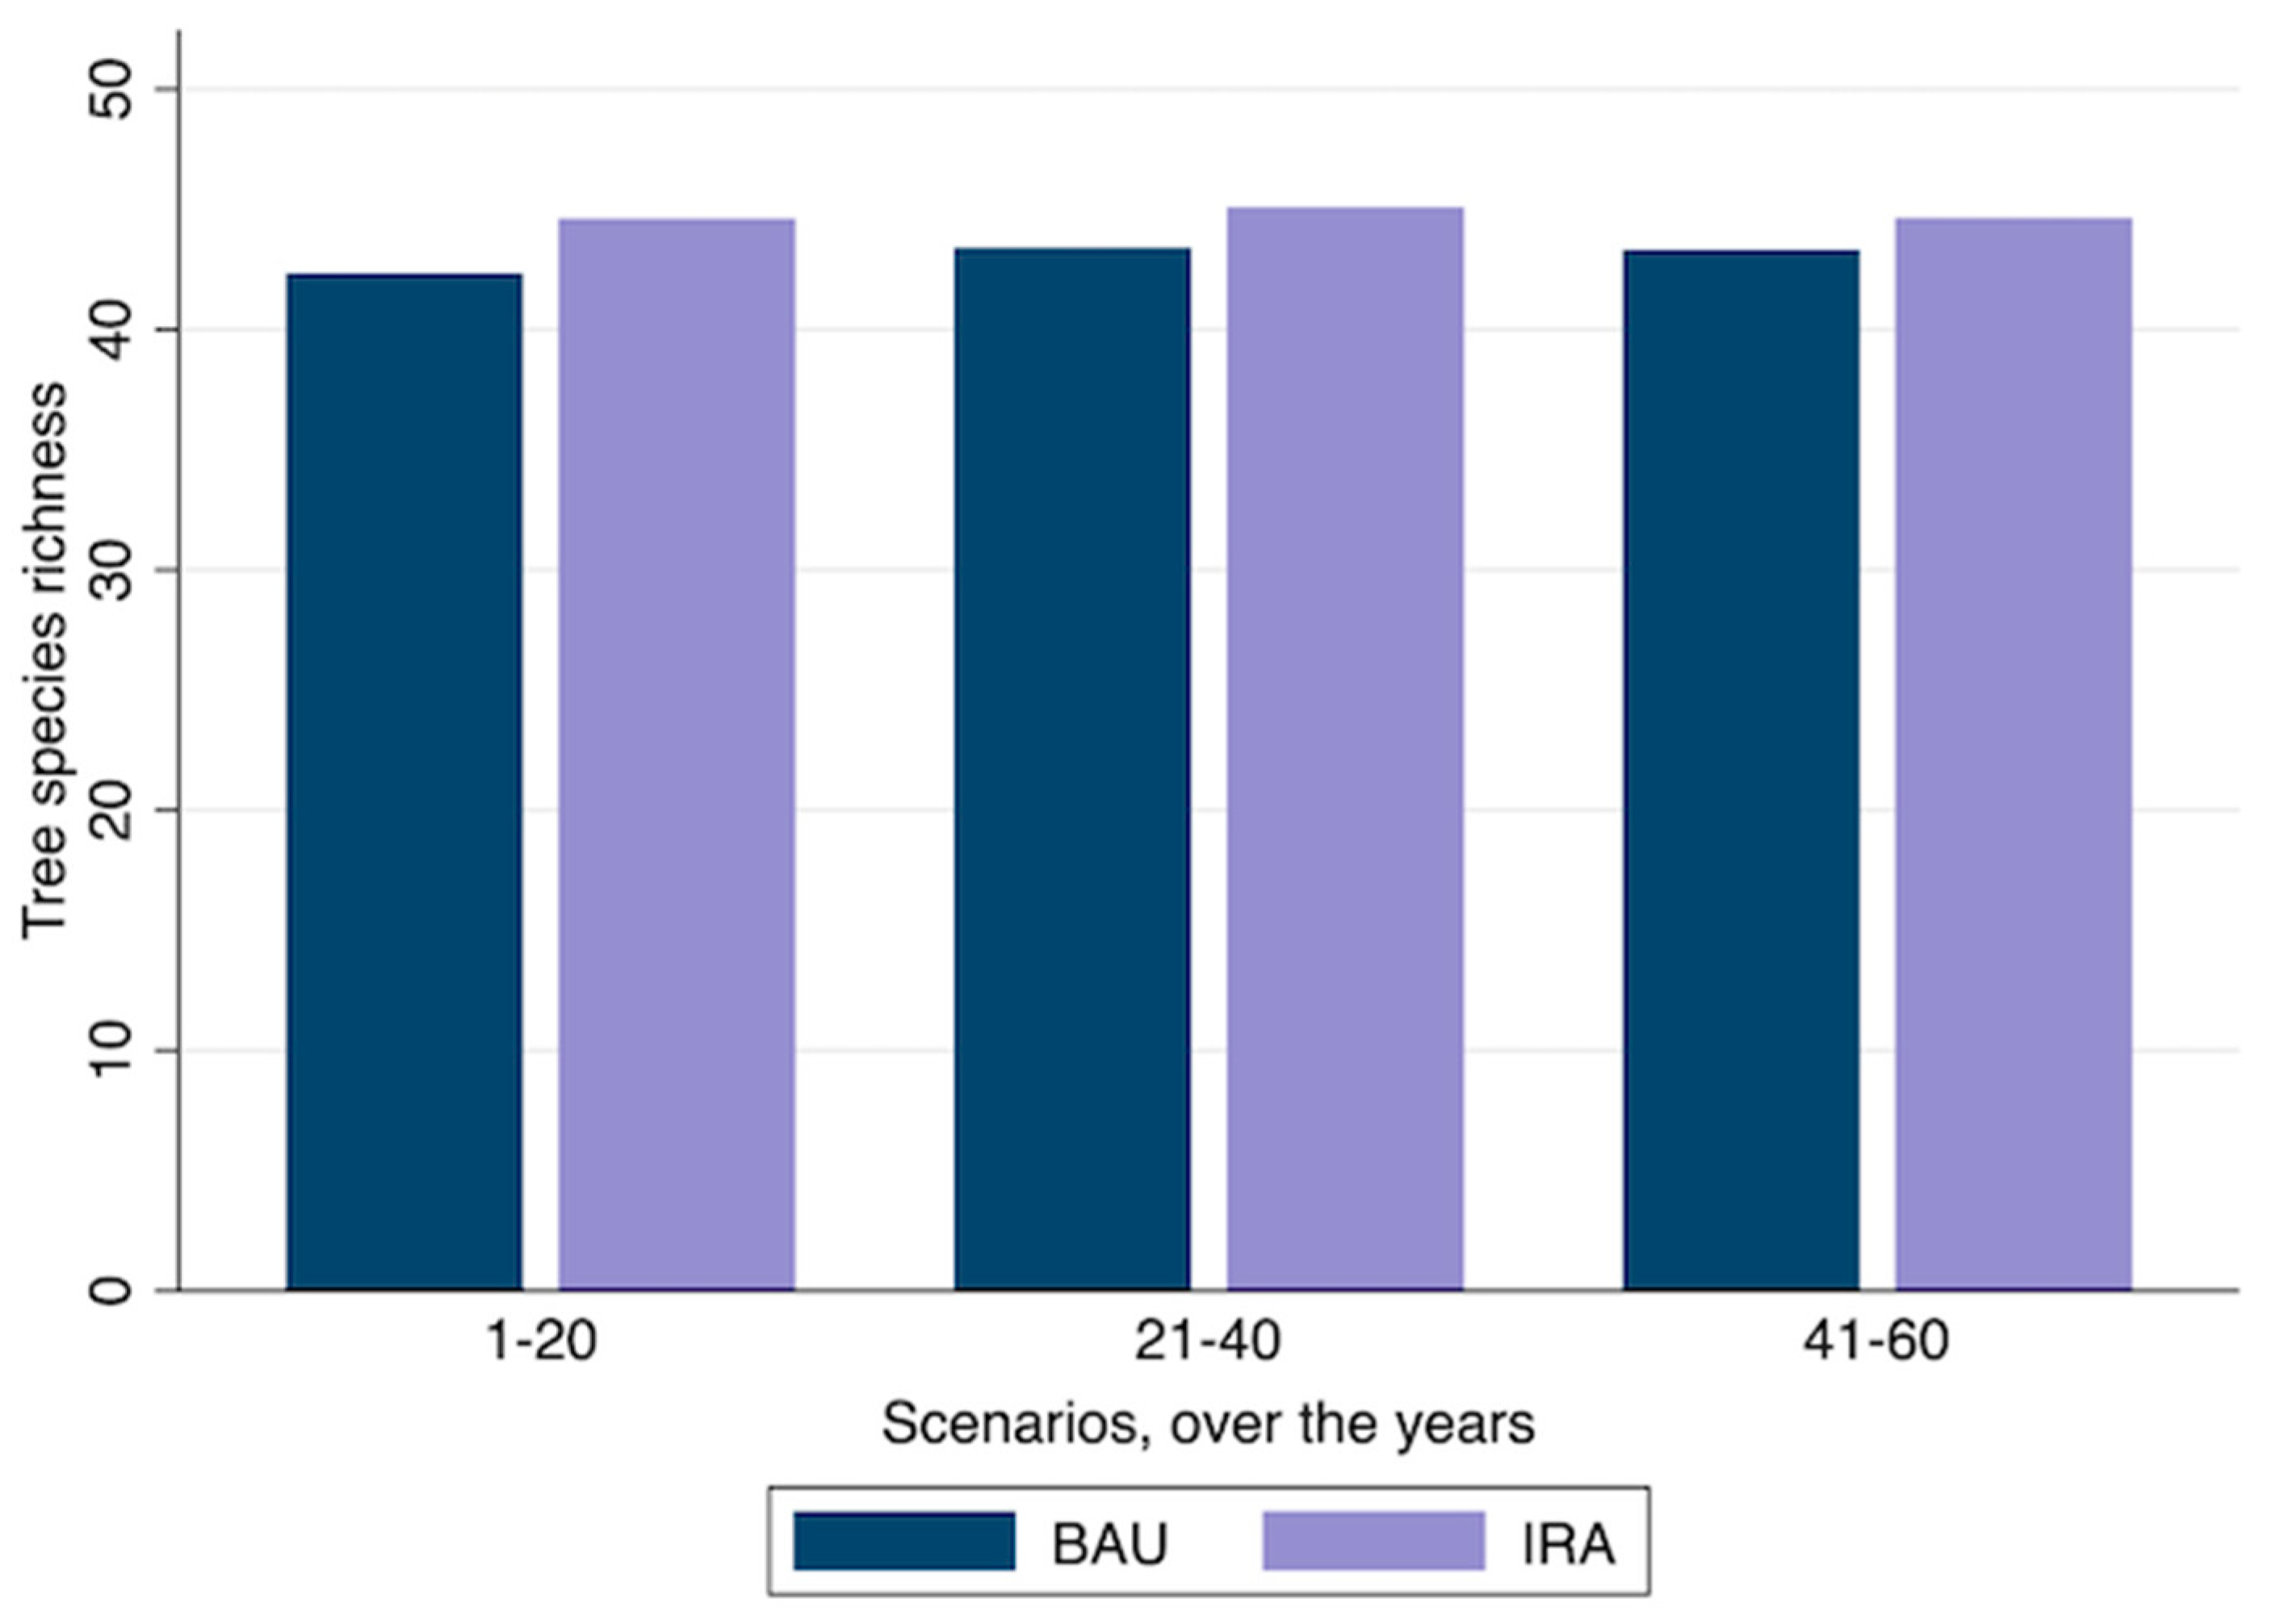
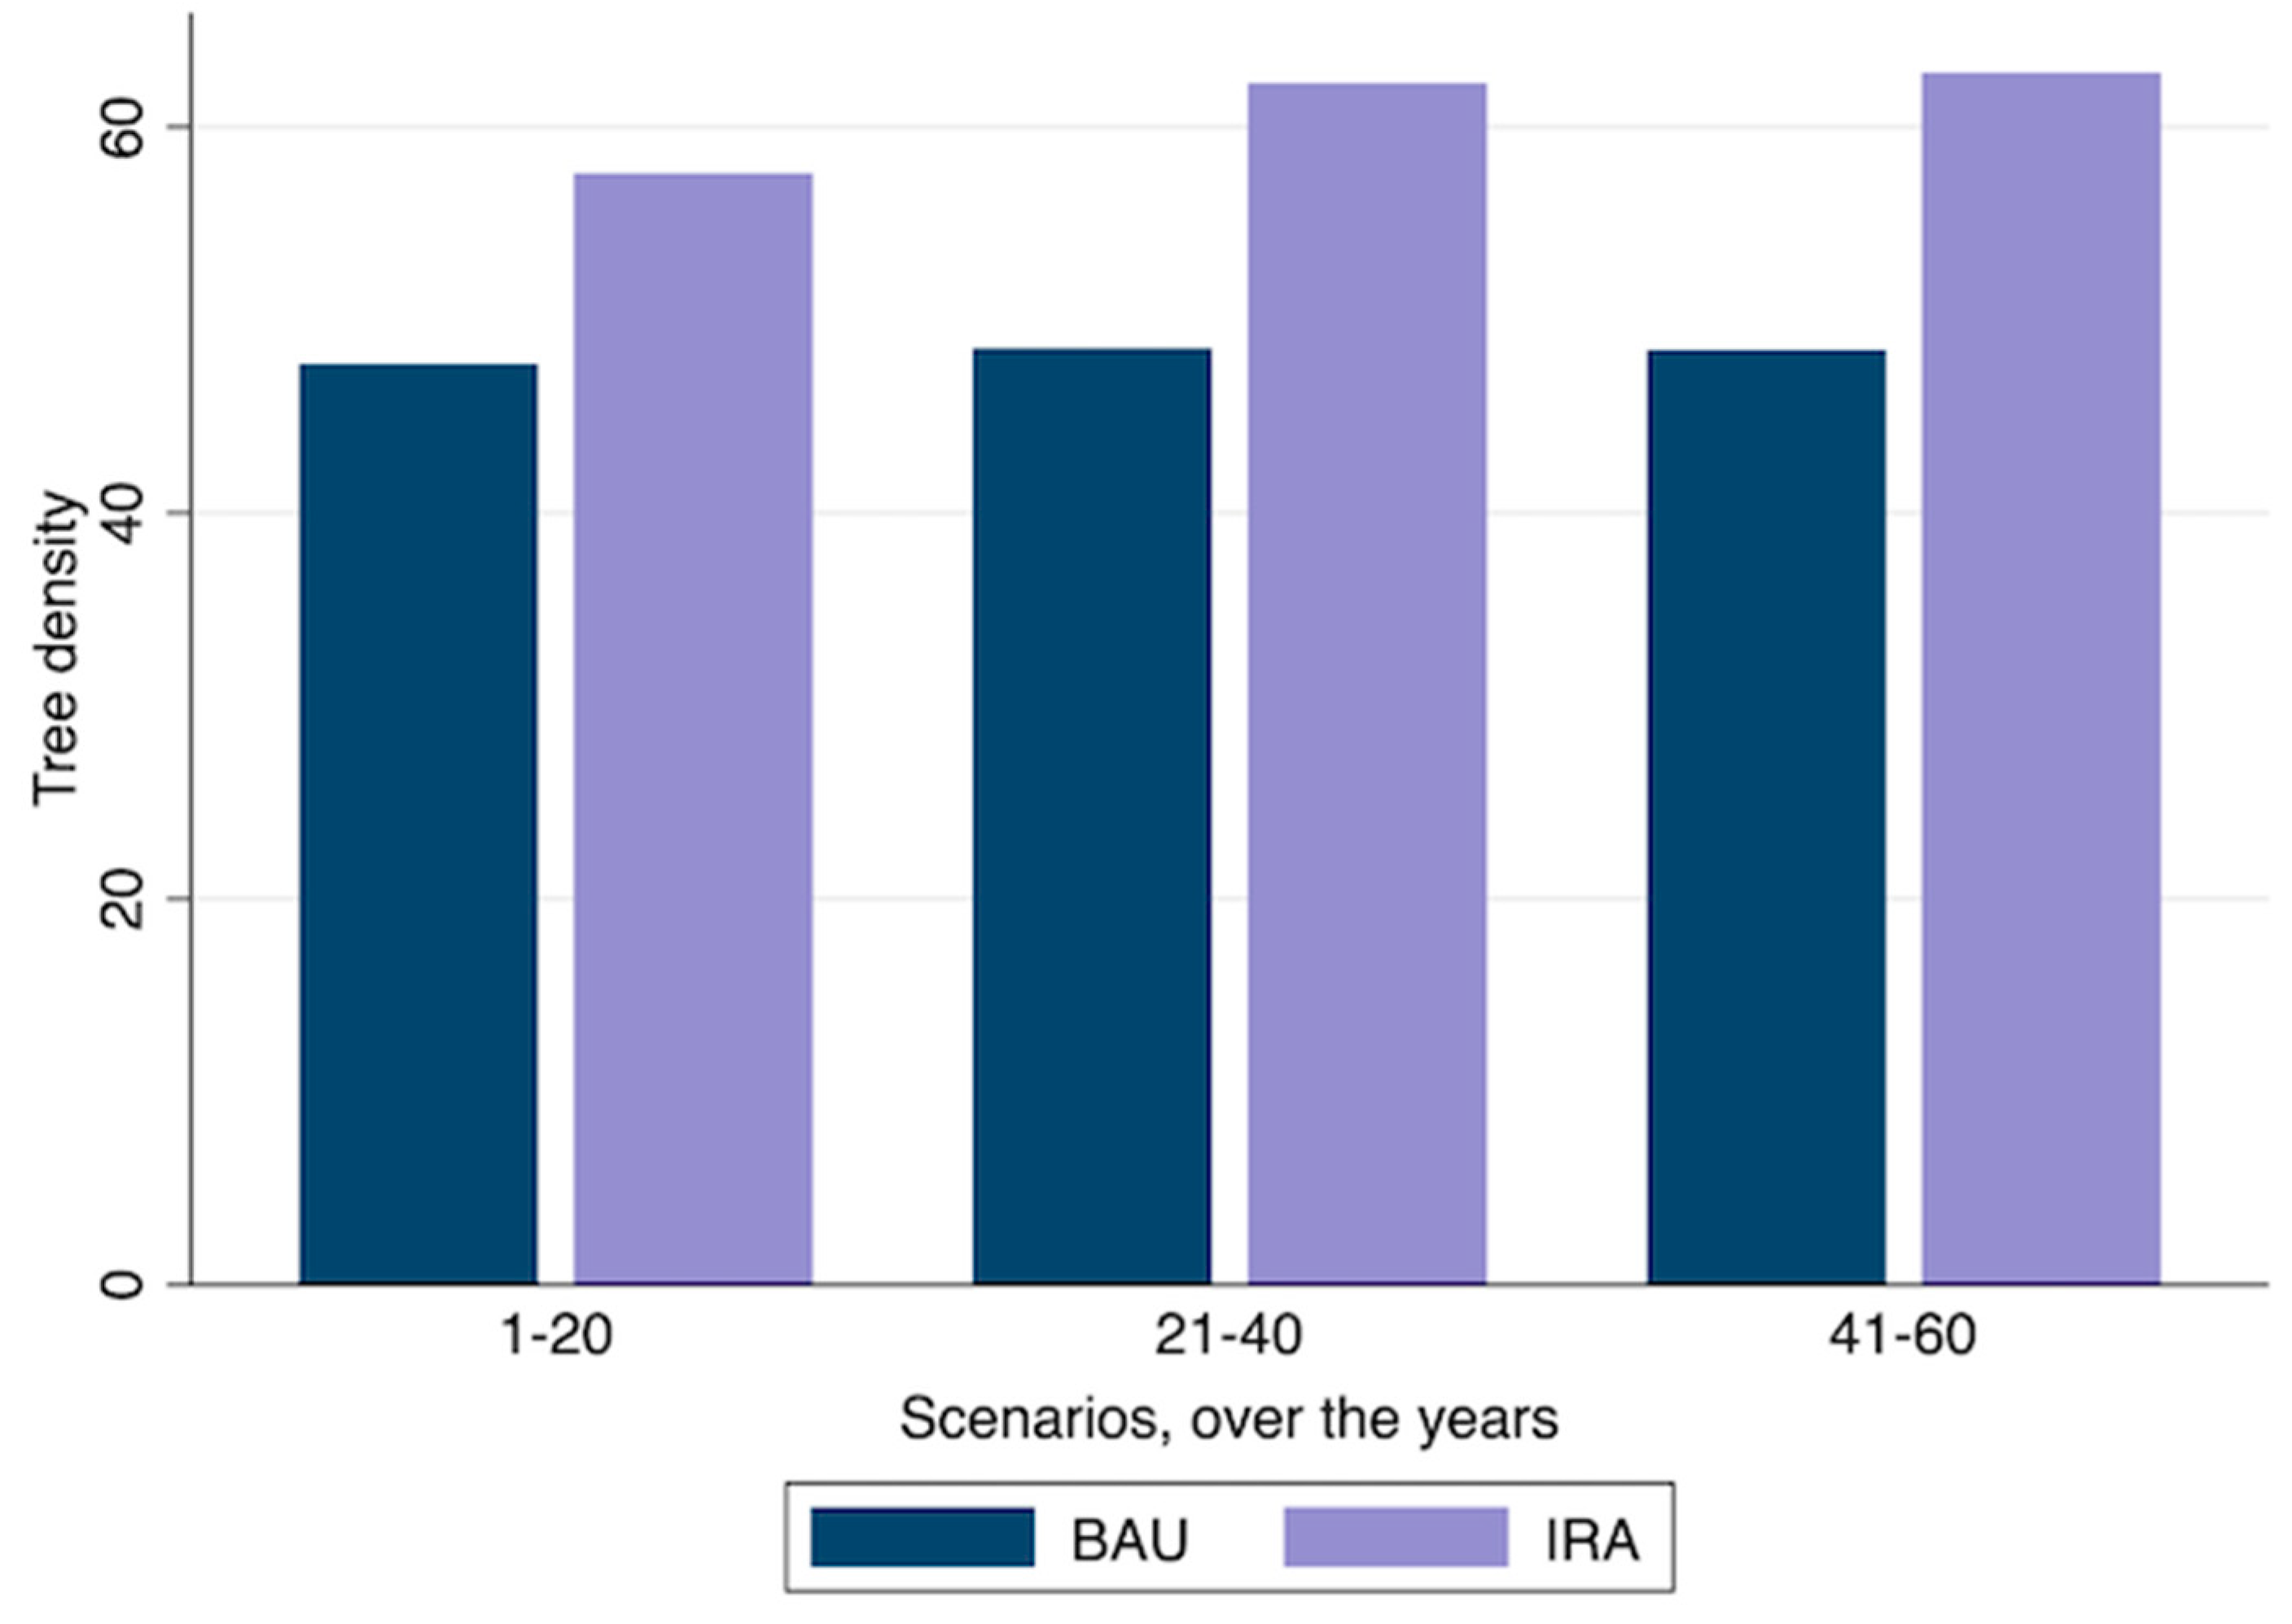
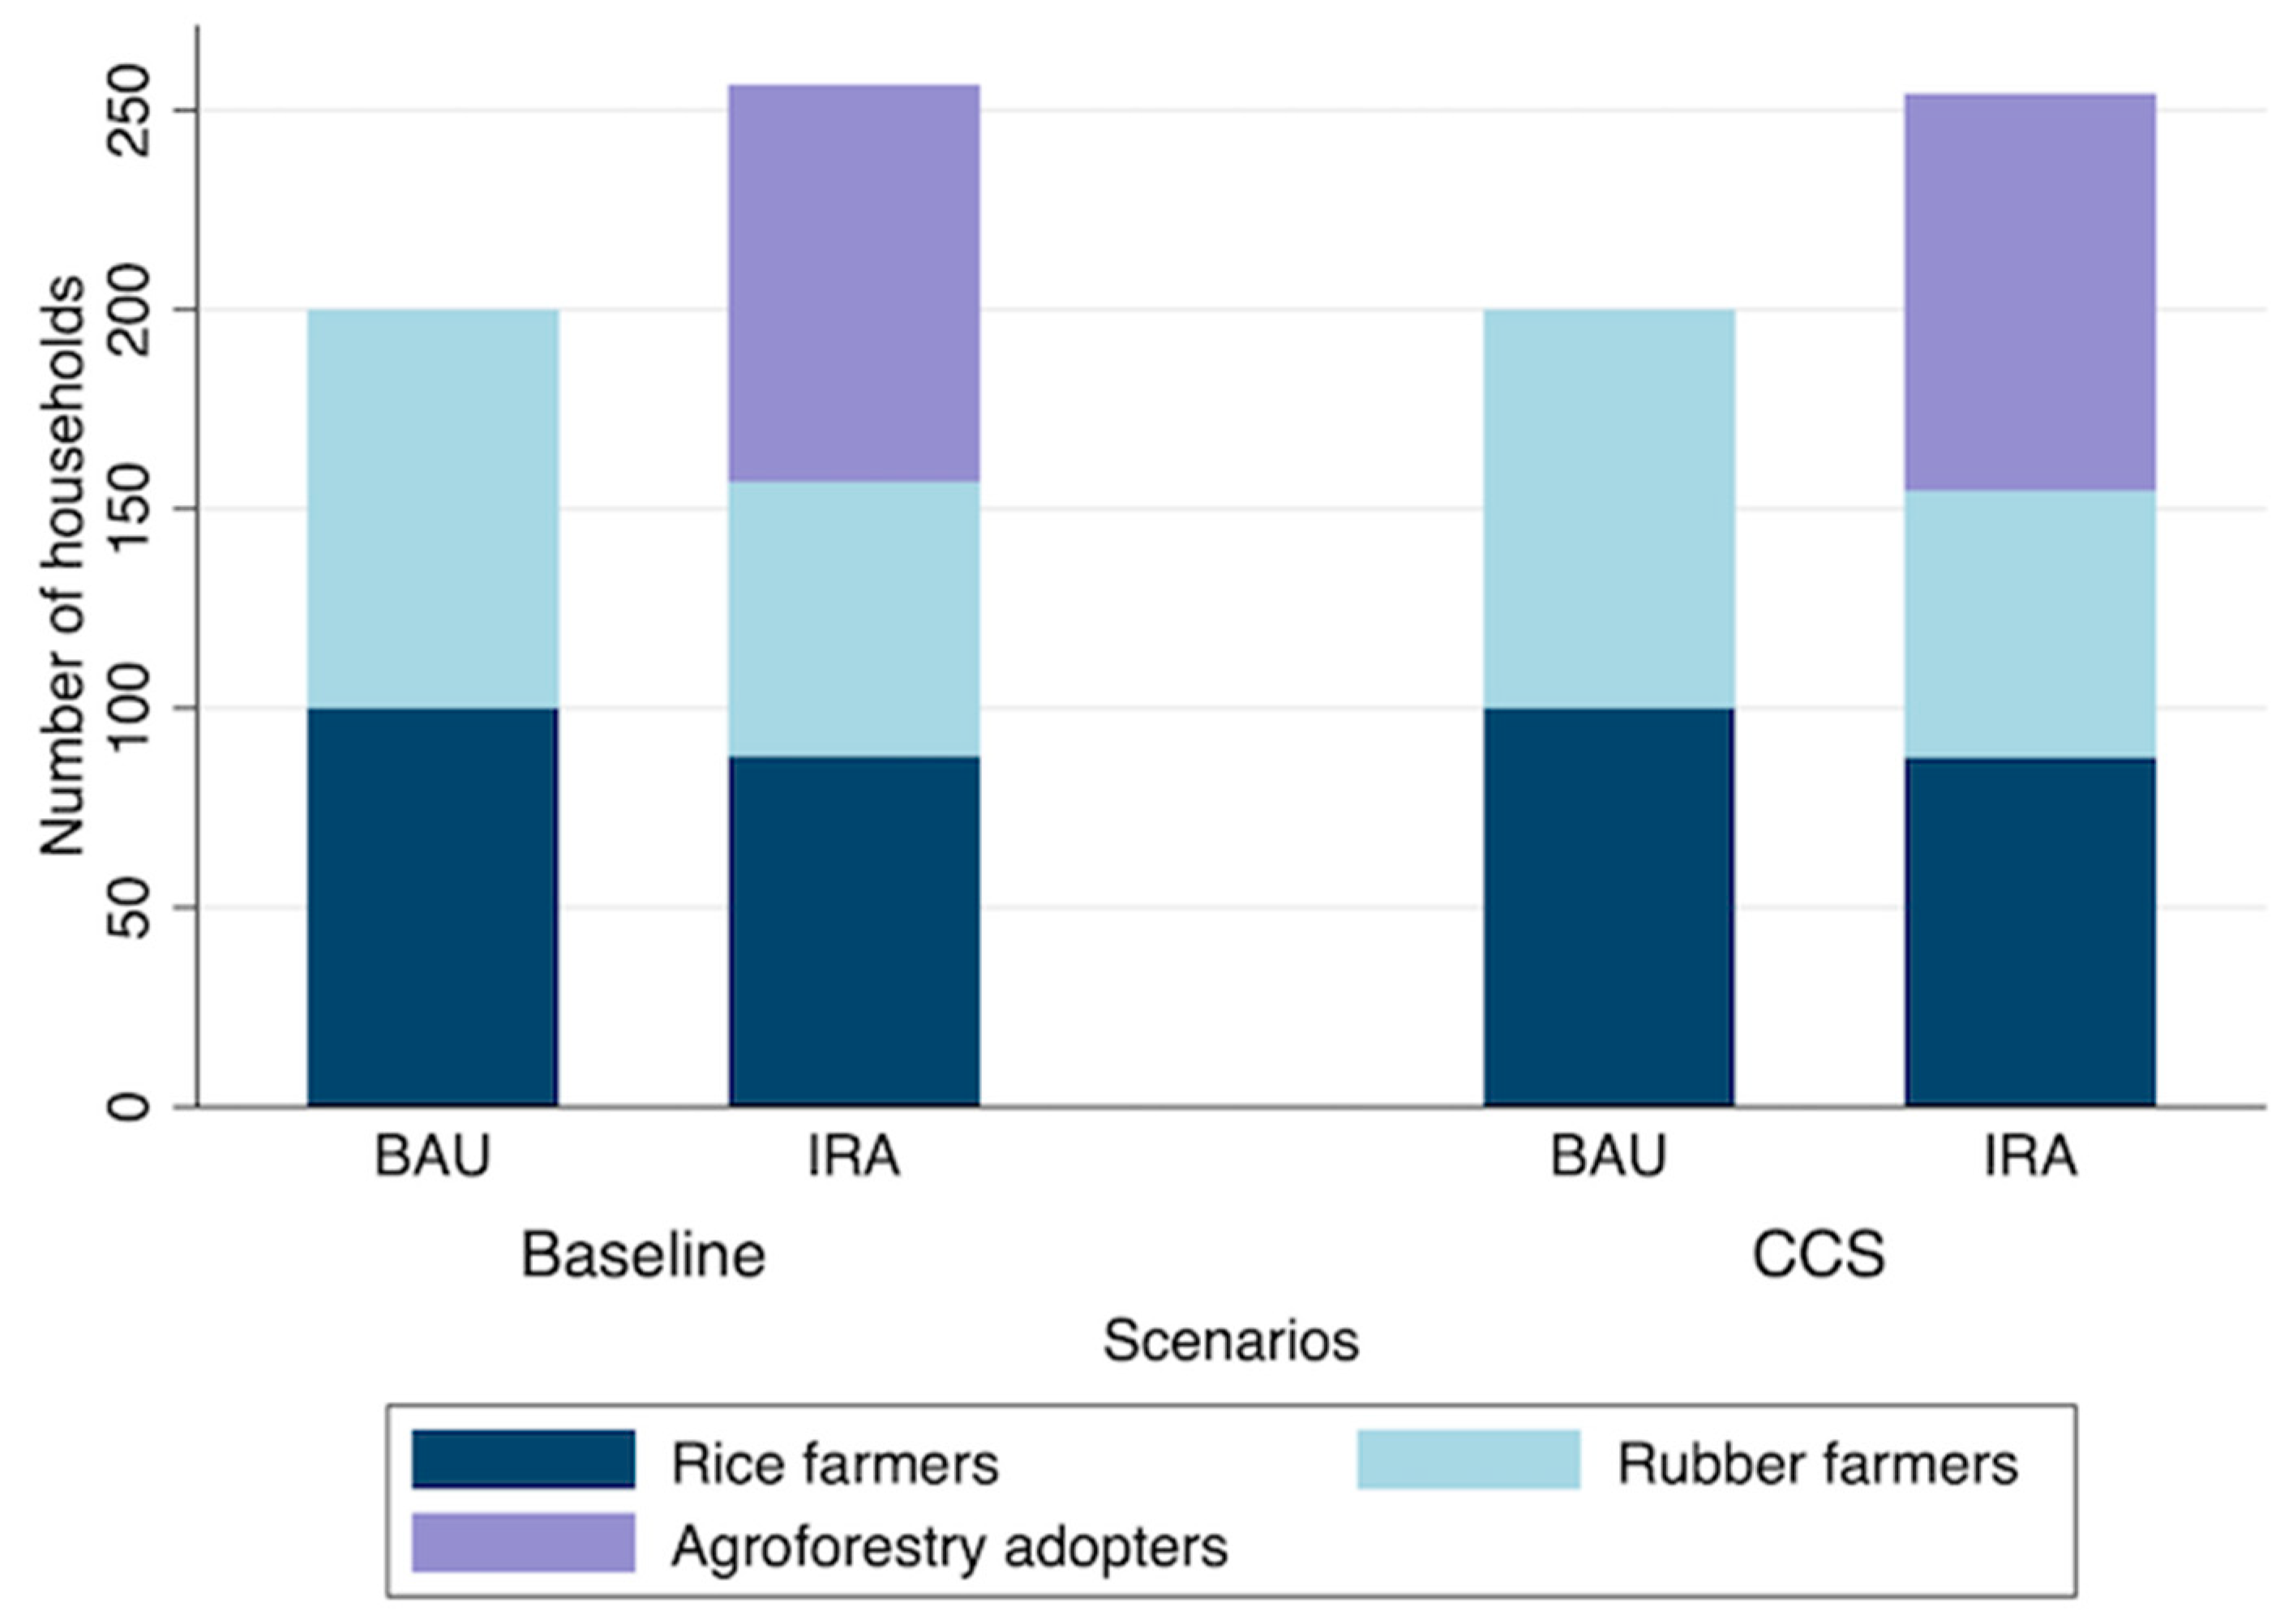
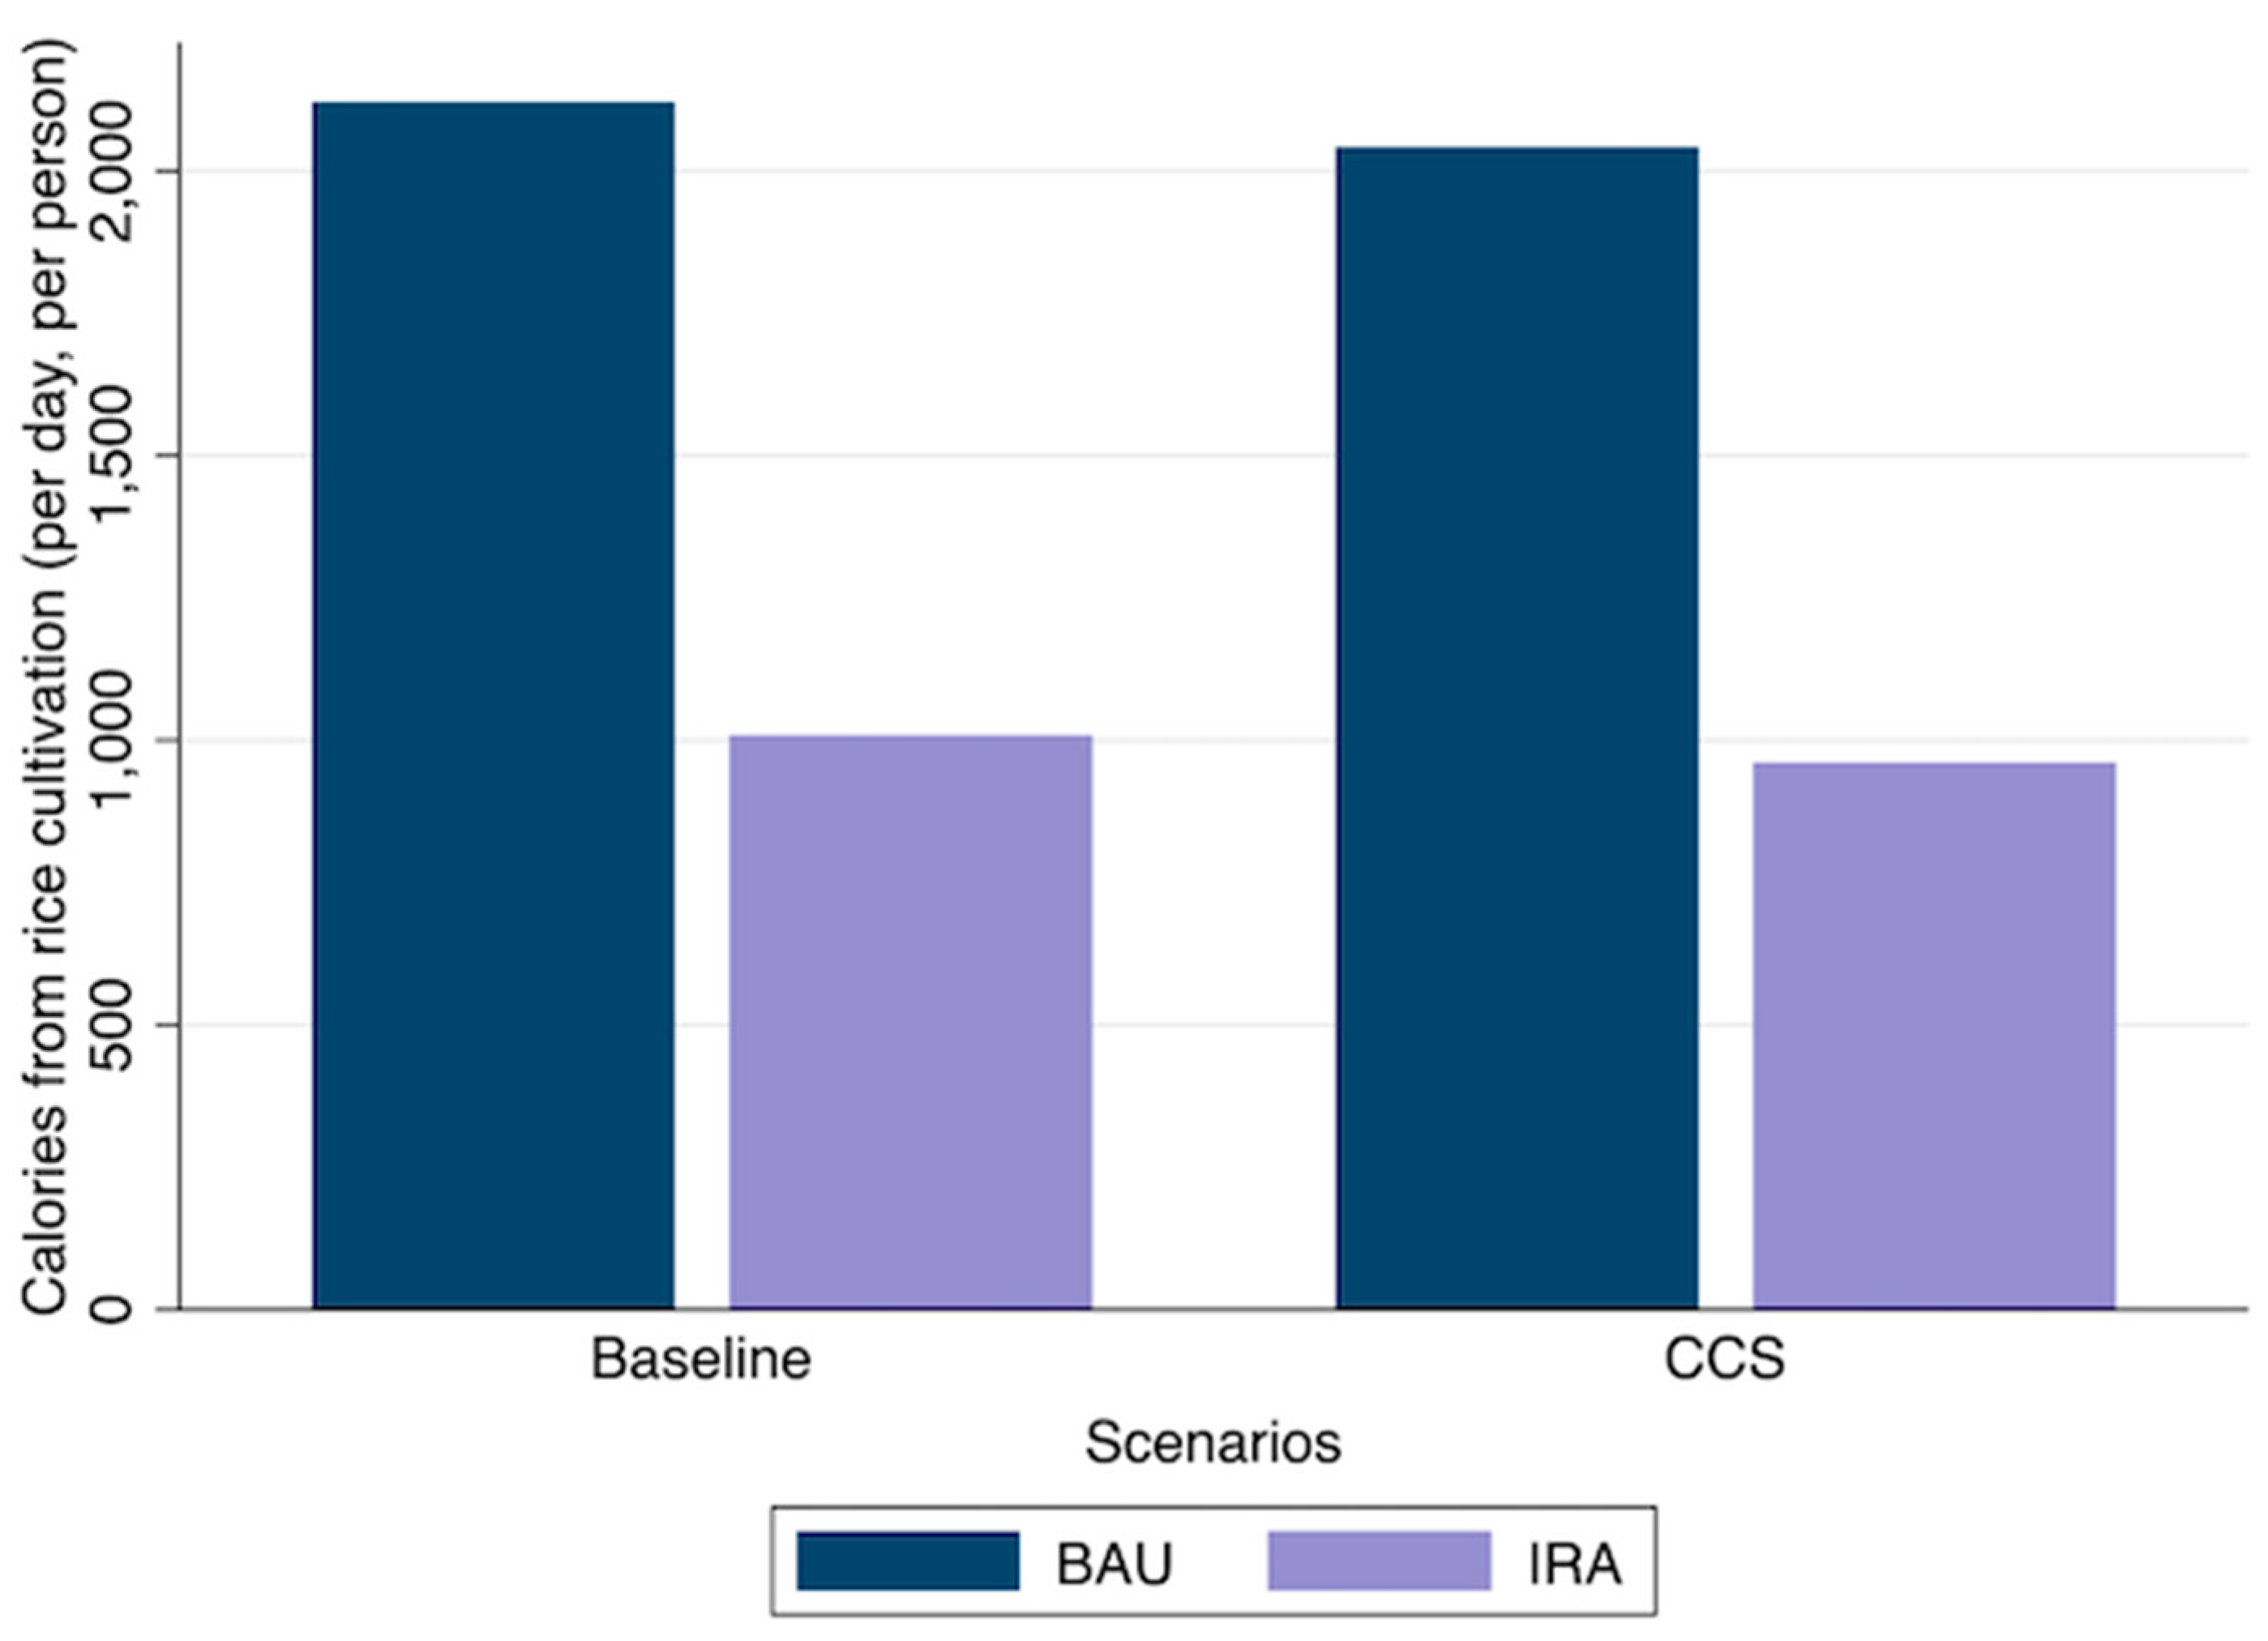
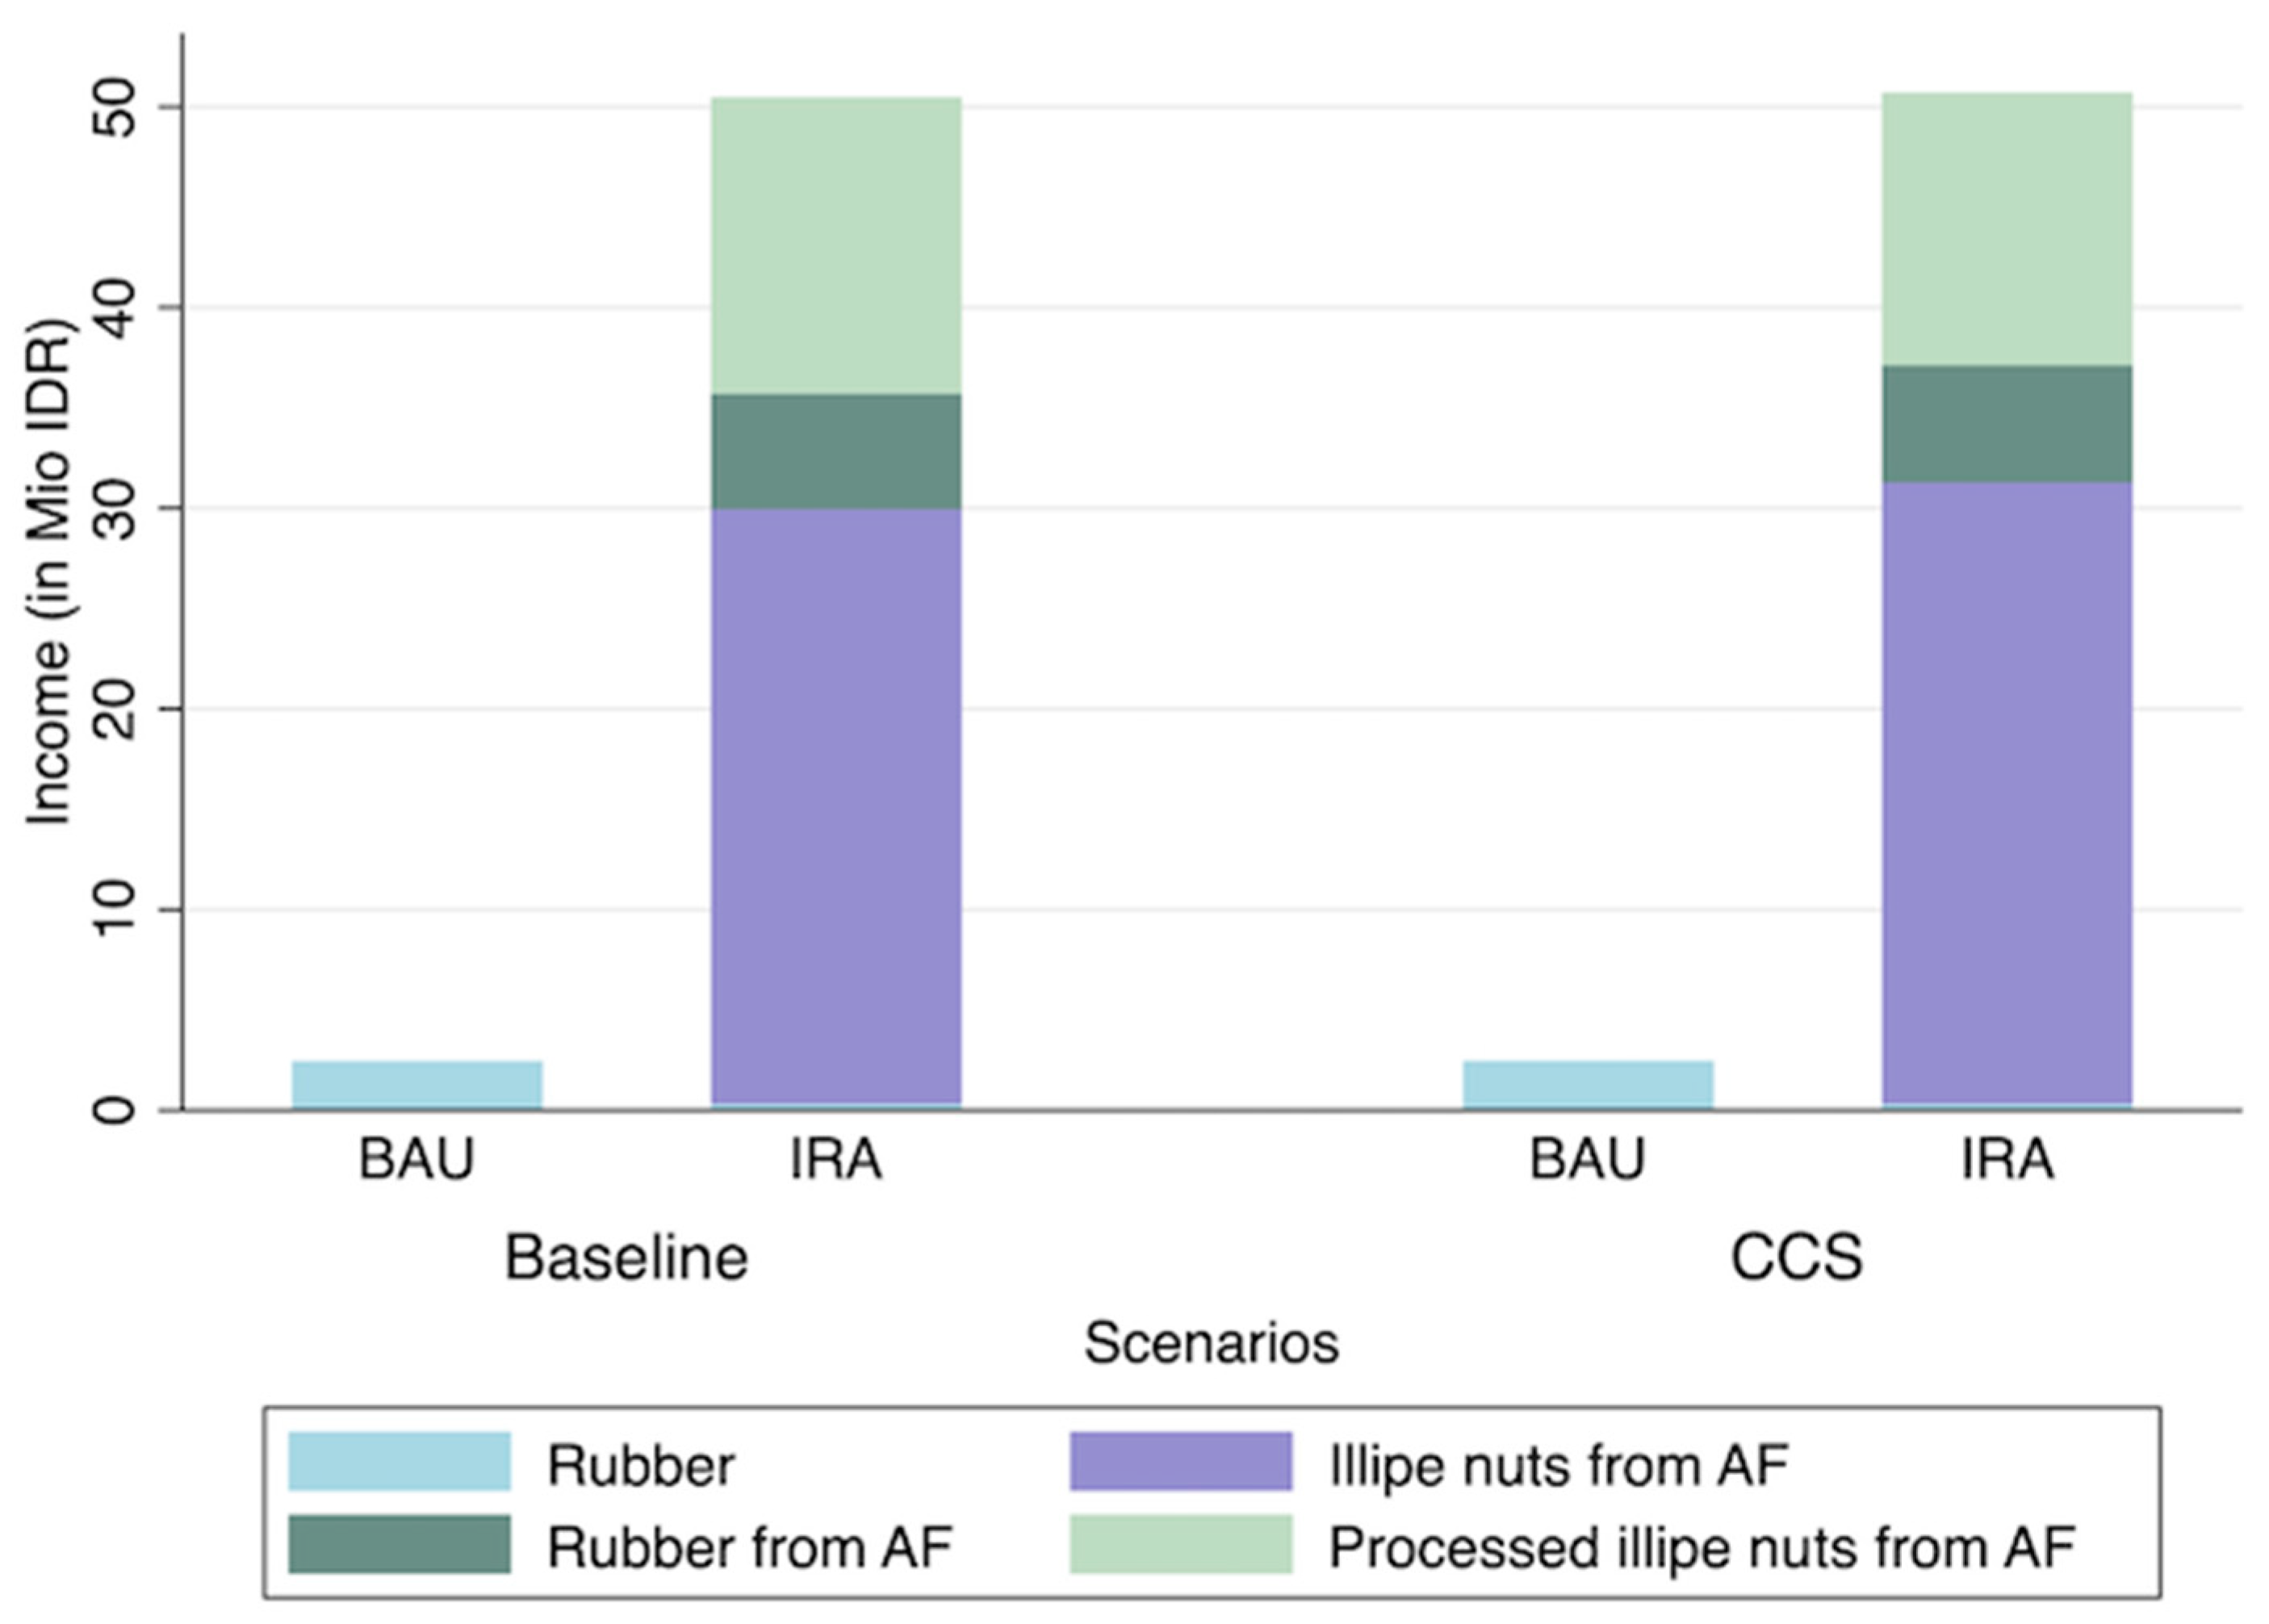
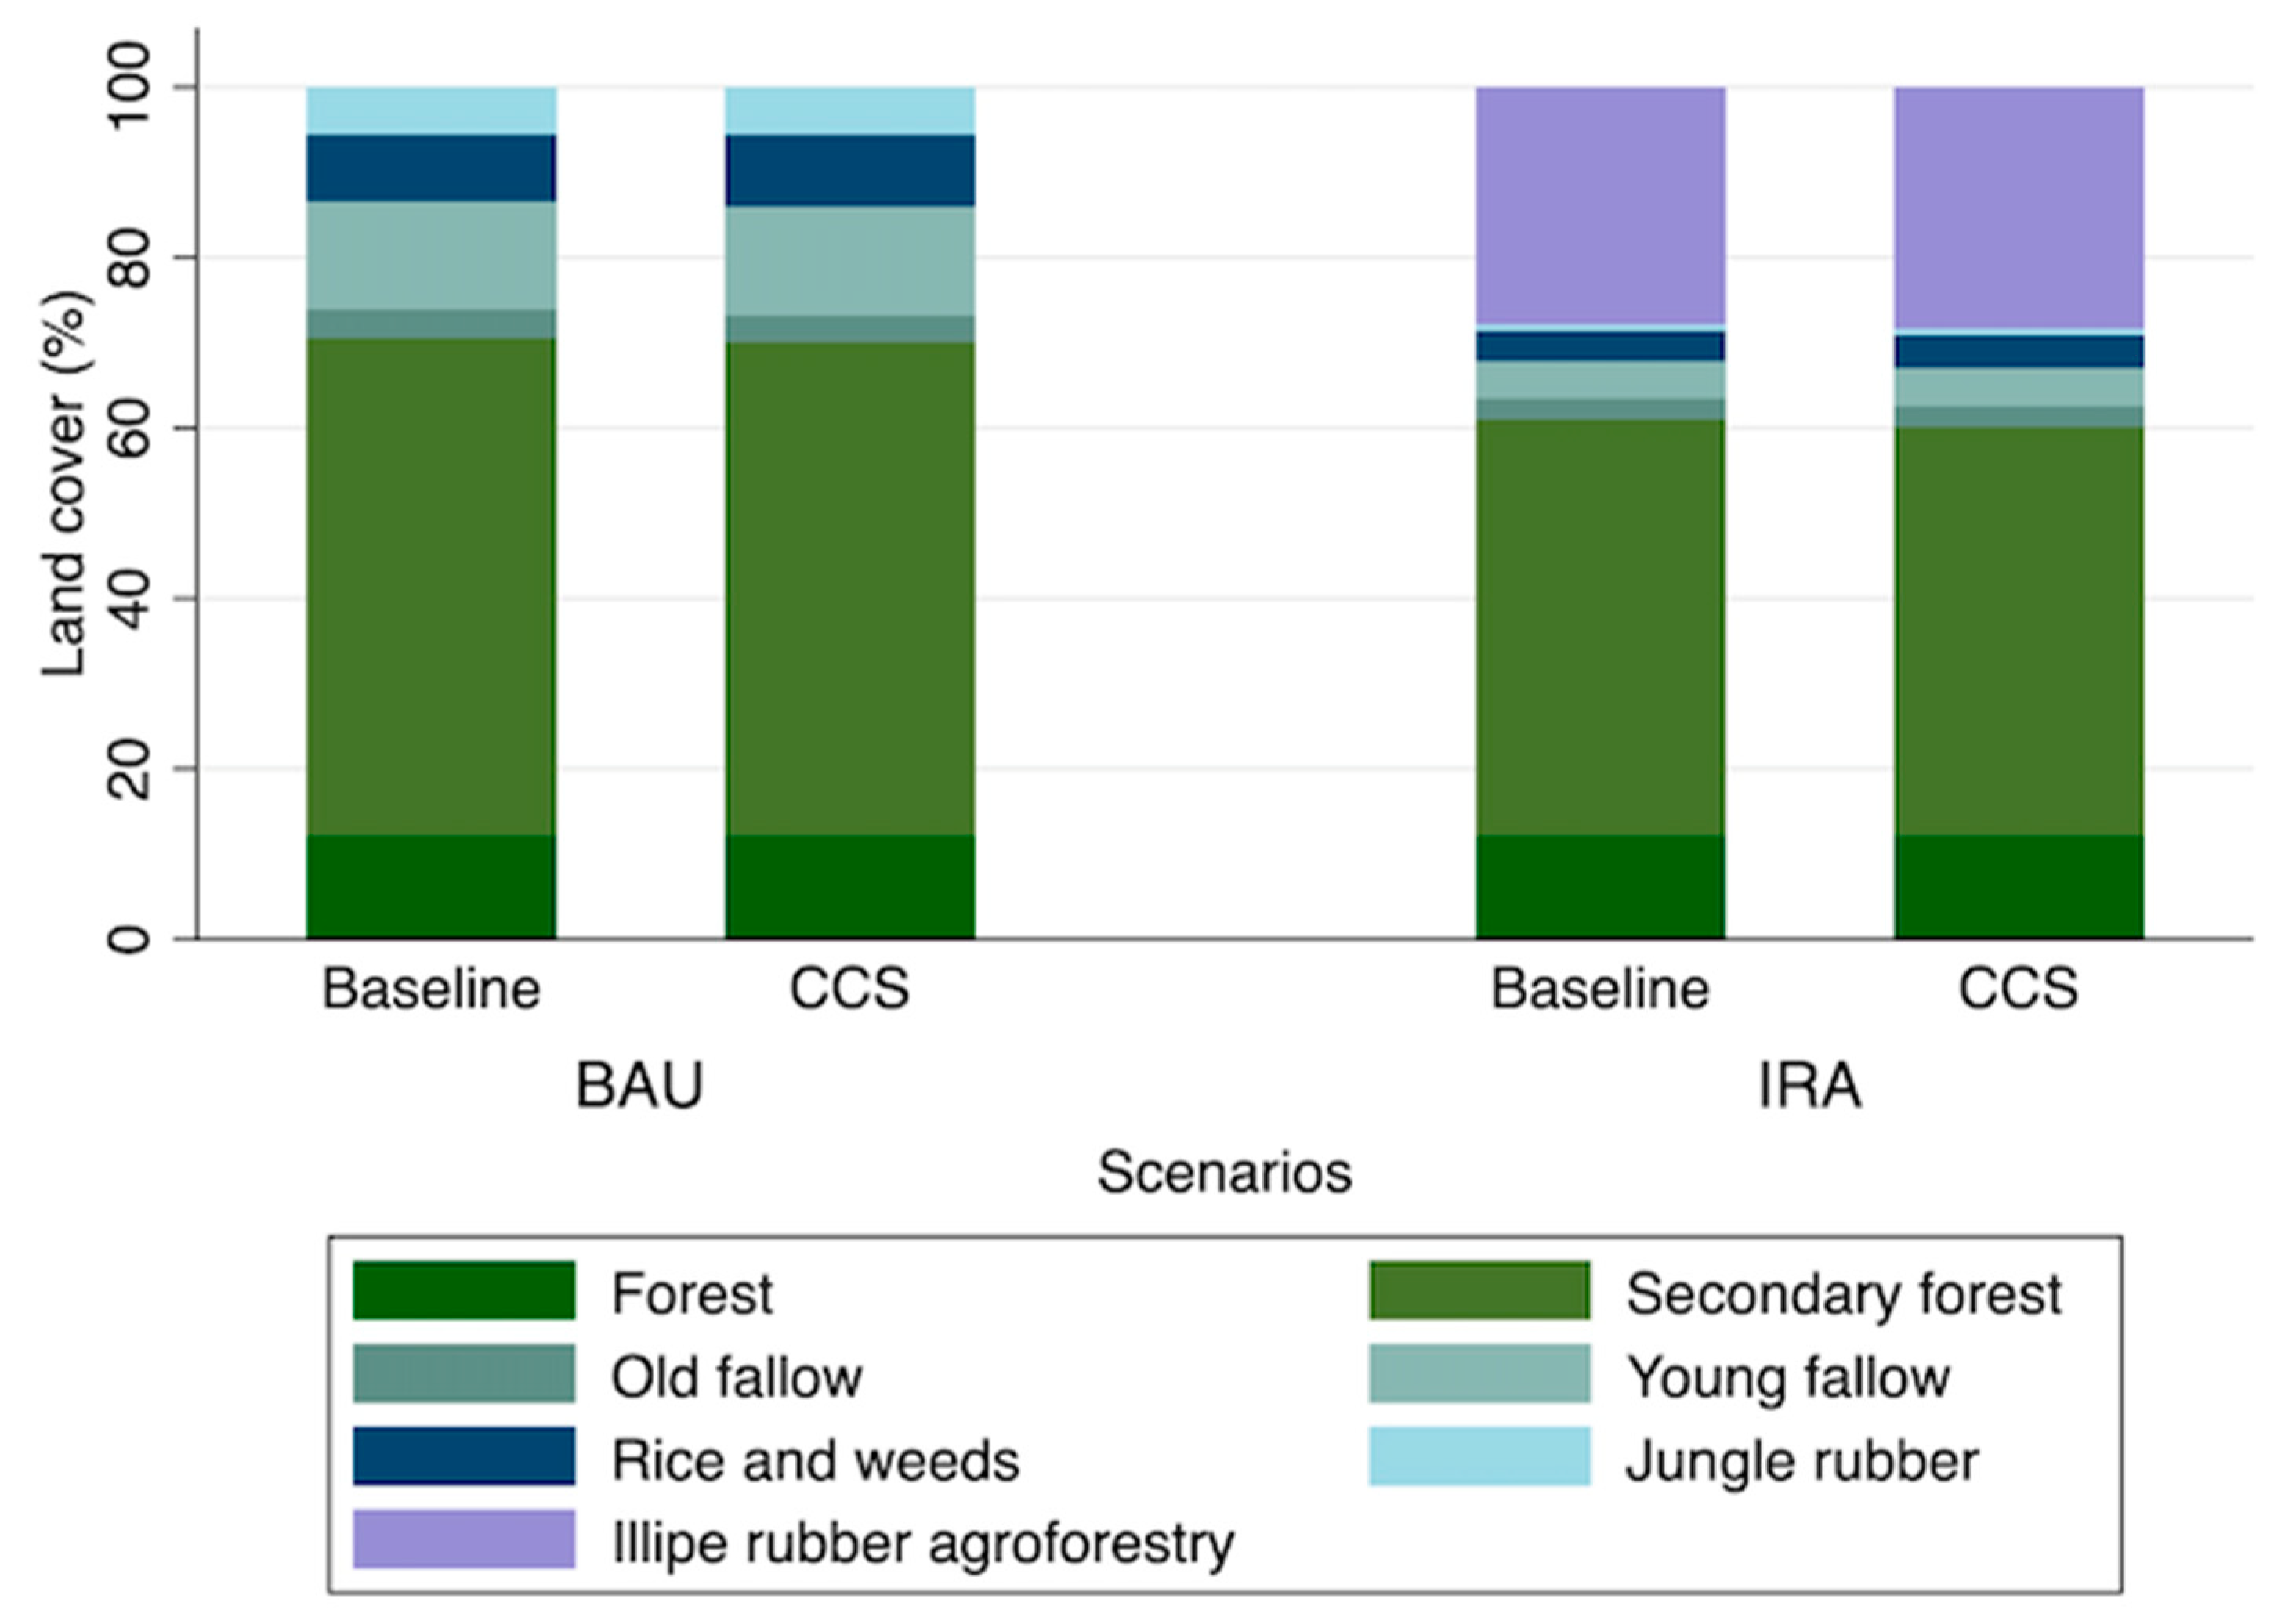
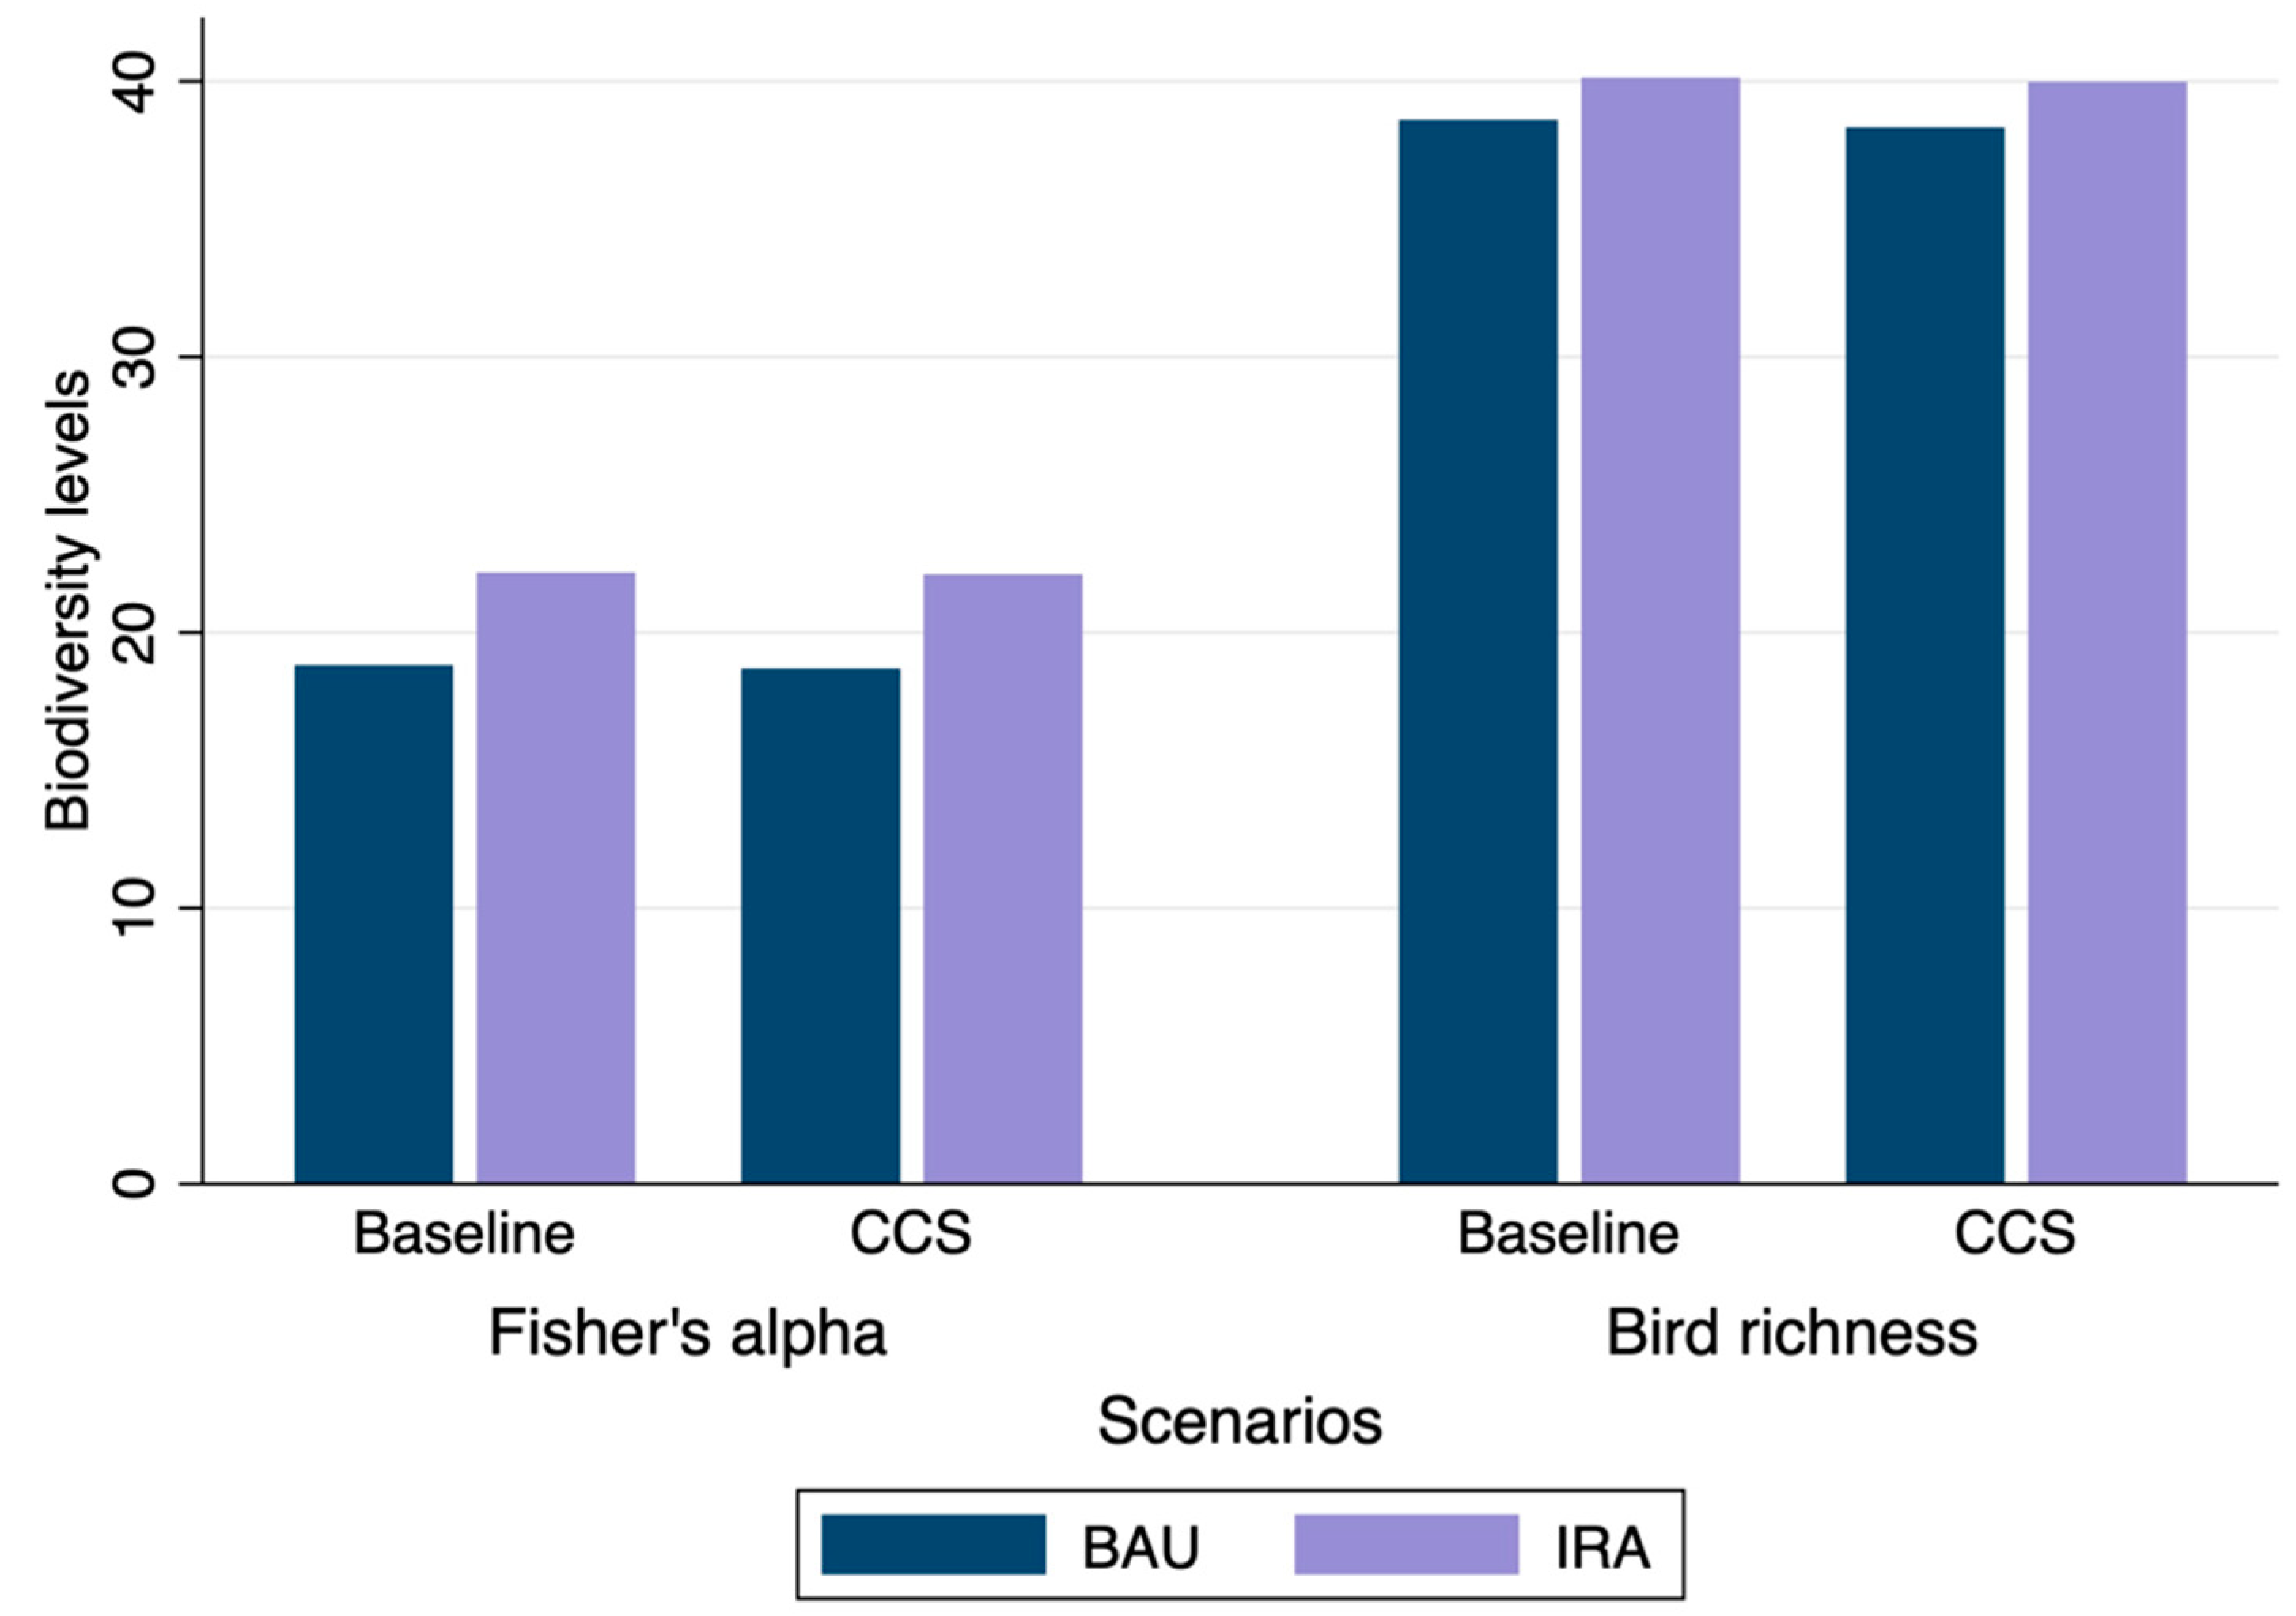
Table 1.
Model description: farmer agent variables.
| Variable | Description |
|---|---|
| HHID | Identifier of household |
| Initial-laborforce | Initial labor force, based on household size |
| Available-laborforce | Available labor force after livelihood decision, considers labor input for livelihoods chosen |
| Farmsize | Total farm size |
| NumberPlots | Number of plots |
| My-plots | Set of plots claimed by household |
| Plots_cultivated | Plots cultivated by household |
| Fallow_plots | Fallow plots claimed by household |
| Plots_rice | Number of plots with rice |
| Plots_rubber | Number of plots with jungle rubber |
| Plots_AF | Number of plots with agroforestry |
| RiceFarmer | 1 if household cultivates rice, 0 otherwise |
| RubberFarmer | 1 if household cultivates jungle rubber, 0 otherwise |
| IllipeFarmer | 1 if household cultivates agroforestry, 0 otherwise |
| Illipeprocessor | 1 if household processes illipe nuts, 0 otherwise |
| Illipeharvest | Illipe nuts harvested (in kg) |
| iEnergyRequirement | Auxiliary variable to calculate initial energy requirement of household |
| EnergyRequirement | Energy requirement of household |
| EnergyConsumption | Expected energy consumption resulting from agriculture cultivated in previous and current period |
| RiceConsumption | Expected energy consumption from rice |
| RubberIncome | Expected income from jungle rubber |
| IllipeAFIncome | Expected income from illipe nuts in agroforestry systems |
| RubberAFIncome | Expected income from rubber in agroforestry systems |
| AFincome | Expected total income from agroforestry |
| IllipeIncomeProcessed | Expected income from illipe nuts processed |
| aEnergyConsumption | Actual total energy consumption (total) |
| aRiceConsumption | Actual energy consumption from rice |
| aRubberIncome | Actual income from jungle rubber |
| aIllipeAFIncome | Actual income from illipe in agroforestry systems |
| aRubberAFIncome | Actual income from rubber in agroforestry systems |
| aAFIncome | Actual total income from agroforestry |
| aIllipeIncomeProcessed | Actual income from processed illipe |
| Income | Total income in Mio Indonesian rupiah (IDR) |
| Food-insecure | 1 if household did not meet energy requirements, 0 otherwise |
| Deficit | Caloric deficit |
Table 2.
Model description: landscape agent variables.
| Variable | Description |
|---|---|
| Owner | Household claiming ownership |
| Plotid | Plot identifier according to survey |
| Class | Land use class (natural forest, secondary forest, old fallow, young fallow, rice and weeds, rice, jungle rubber, illipe nut trees (Shorea spp.) mix with rubber in an agroforestry system (IRA) |
| Vegetation | Plot vegetation |
| Fallowlength | Indicates age of fallow |
| Fertility | Auxiliary variable to calculate yield |
| Yield | Rice yield, depends on fertility |
| Rubber | Indicates if rubber trees are planted on patch and age of trees |
| Illipe | Indicates if illipe nut trees are planted on patch and age of trees |
| Patch_alpha | Tree Fisher’s alpha |
| Patch_basal | Basal area |
| Patch_tree_richness | Tree richness |
| Patch_density | Tree density |
| Bird_richness | Species richness of birds |
| Biomass | Above-ground biomass in C Mg/patch |
| Vegetastipatch | Land cover according to GIS data |
| River | Indicates location of rivers |
| River-prox | Indicates patch proximity to a river |
| Nationalpark | Indicates location of national parks |
Table 3.
Model description: landscape agents’ setup.
| Vegetation Class | Setup |
|---|---|
| Natural forest | Vegetation: uniformly distributed between 20 and 40 |
| Basal area: 3.75 | |
| Tree Fisher’s alpha: 50.487 | |
| Tree density: 81 | |
| Tree richness: 91 | |
| Biomass: 36.7 | |
| Bird richness: 81a | |
| Secondary forest | Vegetation: uniformly distributed between 20 and 40 |
| Basal area: 3.53 | |
| Tree Fisher’s alpha: 35.3 | |
| Tree density: 96 | |
| Tree richness: 85 | |
| Biomass: 7.4335 | |
| Bird richness: 68 | |
| Old fallow | Vegetation: uniformly distributed between 10 and 20 |
| Basal area: 0.75 | |
| Tree Fisher’s alpha: 18.38 | |
| Tree density: 67.5 | |
| Tree richness: 39 | |
| Biomass: 0.8119 | |
| Bird richness: 69 | |
| Young fallow | Vegetation: uniformly distributed between 2 and 10 |
| Basal area: 0.25 | |
| Tree Fisher’s alpha: 10.91 | |
| Tree density: 48.5 | |
| Tree richness: 25 | |
| Biomass: 0.2 | |
| Bird richness: 57 | |
| Rice + weeds | Vegetation: 1 |
| Basal area: 0 | |
| Tree Fisher’s alpha: 0 | |
| Tree density: 0 | |
| Tree richness: 0 | |
| Biomass: 0 | |
| Bird richness: 1 | |
| Rice | Vegetation: 0 |
| Basal area: 0 | |
| Tree Fisher’s alpha: 0 | |
| Tree density: 0 | |
| Tree richness: 0 | |
| Biomass: 0 | |
| Bird richness: 1 | |
| Jungle rubber | Basal area: 2 |
| Tree Fisher’s alpha: 25.48 | |
| Tree density: 54.7 | |
| Tree richness: 69 | |
| Biomass: 9.8 | |
| Bird richness: 49 | |
| Illipe rubber agroforestry | Basal area: 2.7 |
| Tree Fisher’s alpha: 39.74 | |
| Tree density: 132 | |
| Tree richness 60 | |
| Biomass: 13 | |
| Bird richness: 60 |
Table 4.
Model description: vegetation class transition of landscape agents.
| Vegetation Class | Transition into |
|---|---|
| Rice | Rice + weeds |
| Rice + weeds | Young fallow (up to 10 years) |
| Young fallow | Old fallow (11–20 years) |
| Old fallow | Secondary forest (>20 years) |
Table 5.
Descriptive results: general household characteristics.
| Variable | Description |
|---|---|
| Household size | 4.55 (2.26) |
| Labor capacity | 3.66 (1.80) |
| Share of farm income (in %) | 74.59 (28.98) |
| Years of schooling of household head | 4.38 (4.10) |
| Age of household head | 46.85 (14.09) |
Note: Standard deviation in parentheses. n = 138.
Table 6.
Descriptive results: agricultural characteristics.
| Variable | Description |
|---|---|
| Average claimed land size (in hectare) | 14.45 (16.18) |
| Average number of plots claimed | 7.19 (4.82) |
| Average plot size (in hectare) | 1.93 (2.27) |
| Average distance to the house (in meters) | 2871.80 (3058.82) |
| Average number of plots cultivated | 2.41 (1.94) |
| Share of households cultivating rubber (in %) | 75.64 |
Note: Standard deviation in parentheses.
Publisher’s Note: MDPI stays neutral with regard to jurisdictional claims in published maps and institutional affiliations. |
© 2021 by the authors. Licensee MDPI, Basel, Switzerland. This article is an open access article distributed under the terms and conditions of the Creative Commons Attribution (CC BY) license (https://creativecommons.org/licenses/by/4.0/).
Share and Cite
MDPI and ACS Style
Nöldeke, B.; Winter, E.; Laumonier, Y.; Simamora, T. Simulating Agroforestry Adoption in Rural Indonesia: The Potential of Trees on Farms for Livelihoods and Environment. Land 2021, 10, 385. https://doi.org/10.3390/land10040385
AMA Style
Nöldeke B, Winter E, Laumonier Y, Simamora T. Simulating Agroforestry Adoption in Rural Indonesia: The Potential of Trees on Farms for Livelihoods and Environment. Land. 2021; 10(4):385. https://doi.org/10.3390/land10040385
Chicago/Turabian StyleNöldeke, Beatrice, Etti Winter, Yves Laumonier, and Trifosa Simamora. 2021. "Simulating Agroforestry Adoption in Rural Indonesia: The Potential of Trees on Farms for Livelihoods and Environment" Land 10, no. 4: 385. https://doi.org/10.3390/land10040385
Note that from the first issue of 2016, this journal uses article numbers instead of page numbers. See further details here.