
Properties of Passive Films Formed on Ferrite-Martensite and Ferrite-Pearlite Steel Microstructures


1
Department of Materials Science and Engineering, Delft University of Technology, Mekelweg 2, 2628 CD Delft, The Netherlands
2
Netherlands Organisation for Scientific Research, NWO, Van Vollenhovenlaan 659-661, 3527 JP Utrecht, The Netherlands
*
Author to whom correspondence should be addressed.
†
These authors contributed equally to this paper.
Metals 2021, 11(4), 594; https://doi.org/10.3390/met11040594
Submission received: 8 March 2021
/
Revised: 30 March 2021
/
Accepted: 1 April 2021
/
Published: 6 April 2021
(This article belongs to the Section Corrosion and Protection)
Abstract
:The effect of ferrite-pearlite and ferrite-martensite phase combinations on the passive layer properties of low carbon steel is investigated in a 0.1 M NaOH solution. Heat treatments were designed to obtain ferrite-pearlite and ferrite-martensite microstructures with similar ferrite volume fractions. Potentiostatic polarisation and electrochemical impedance spectroscopy (EIS) results demonstrated the lower barrier properties of passive films on ferrite-martensite microstructure compared to the ones formed on ferrite-pearlite microstructure. This was attributed to the higher donor density of the passive layer on ferrite-martensite samples, measured with Mott–Schottky analysis. This behaviour was explained by the complex microstructure morphology of the martensite phase that led to the formation of a more defective passive film.
1. Introduction
A wide range of industries such as aerospace, automotive, oil and gas employ high-strength steels due to their mechanical properties in efforts to reduce weight in structures and save energy in transportation applications. The exceptional mechanical properties of these steels (an advantageous combination of strength, ductility and plasticity) often result from a multi-phase microstructure created through a precise balance between kinetic processes and thermodynamics [1]. Pearlite and martensite, in combination with ferrite, are widely used in two-phase steels. The role of pearlite and martensite in combination with ferrite in two-phase steels on mechanical properties is understood relatively well [2,3]. However, their corrosion and passivity behaviour is not yet well understood [4,5]. This is mainly due to the complex interaction of the microstructural features—grain sizes, phase fractions, dislocation densities, crystallographic orientations, phase morphologies—dictating the properties of the passive layer of steels. Therefore, it is often difficult to isolate the effect of pearlite and martensite in combination with the ferrite on passive layer properties of two-phase steels. Moreover, corrosion and passivity behaviours are much less widely studied than mechanical behaviour.
It should be emphasised that the influence of pearlite and martensite in two-phase steel on the passive layer properties can only be determined with the localised experiments and/or model alloys. Fushimi et al. [4] compared the passive layer properties formed on ferrite and pearlite through nanoscopic localised techniques. They reported a higher passive current density and smaller ionic/electronic resistance for the pearlite structure and related this behaviour to the differences between conductivities and phase structures of FeCO3 and Fe2O3 in the layer. With well-controlled microstructures, Yanagisawa et al. [5] investigated the role of the martensite volume fraction of low-alloyed steels and model alloys that minimised the changes of the microstructural features other than martensite volume fraction. They reported that the barrier properties of passive film deteriorate with increasing martensite volume fraction of the substrate. Furthermore, a higher conductivity for the passive film formed on the martensite phase of the dual-phase steel was observed. These results were attributed to a higher fraction of Fe3O4 in the passive film formed on the martensite phase. Therefore, the passivity of the dual-phase ferrite-martensite steel is proposed to be controlled by the inferior passive properties of the martensite phase. However, controlled ferrite-martensite and ferrite-pearlite microstructures created through precise heat treatments of the same alloy composition and the resultant passive layer properties of the microstructures have not been previously investigated.
In this study, the effect of the presence of either pearlite or martensite with ferrite in two-phase steel on passive layer properties is investigated in 0.1 M NaOH solution. Two well-controlled distinct microstructures—ferrite-martensite and ferrite-pearlite—with the same ferrite volume fractions are employed, thus keeping the possible effects of other microstructural features constant. Samples are created through dilatometry and characterised by optical microscopy and SEM analysis. The contribution of the phase constituents on the development of passive films is analysed by potentiostatic polarisation, electrochemical impedance spectroscopy and capacitance measurements with Mott–Schottky analysis. Finally, the nature of the passive layers is discussed in light of microstructural features of the phases and passive layer properties.
2. Materials and Methods
2.1. Material
The chemical composition of the received steel sheet is presented in Table 1. As-received dual-phase steel sheets (provided by Tata Steel, IJmuiden, The Netherlands) of 2 mm thickness were used. The sheets were laser-cut to the dimensions of 5 mm × 10 mm coupons. The chemical composition of the samples was obtained through wavelength dispersive spectroscopy with an electron beam energy of 10 keV and a beam current of 100 nA in a JEOL JXA 8900R microscope (Peabody, MA, USA). The steel grade was chosen due to its low-alloyed chemical composition.
2.2. Microstructure Characterisation
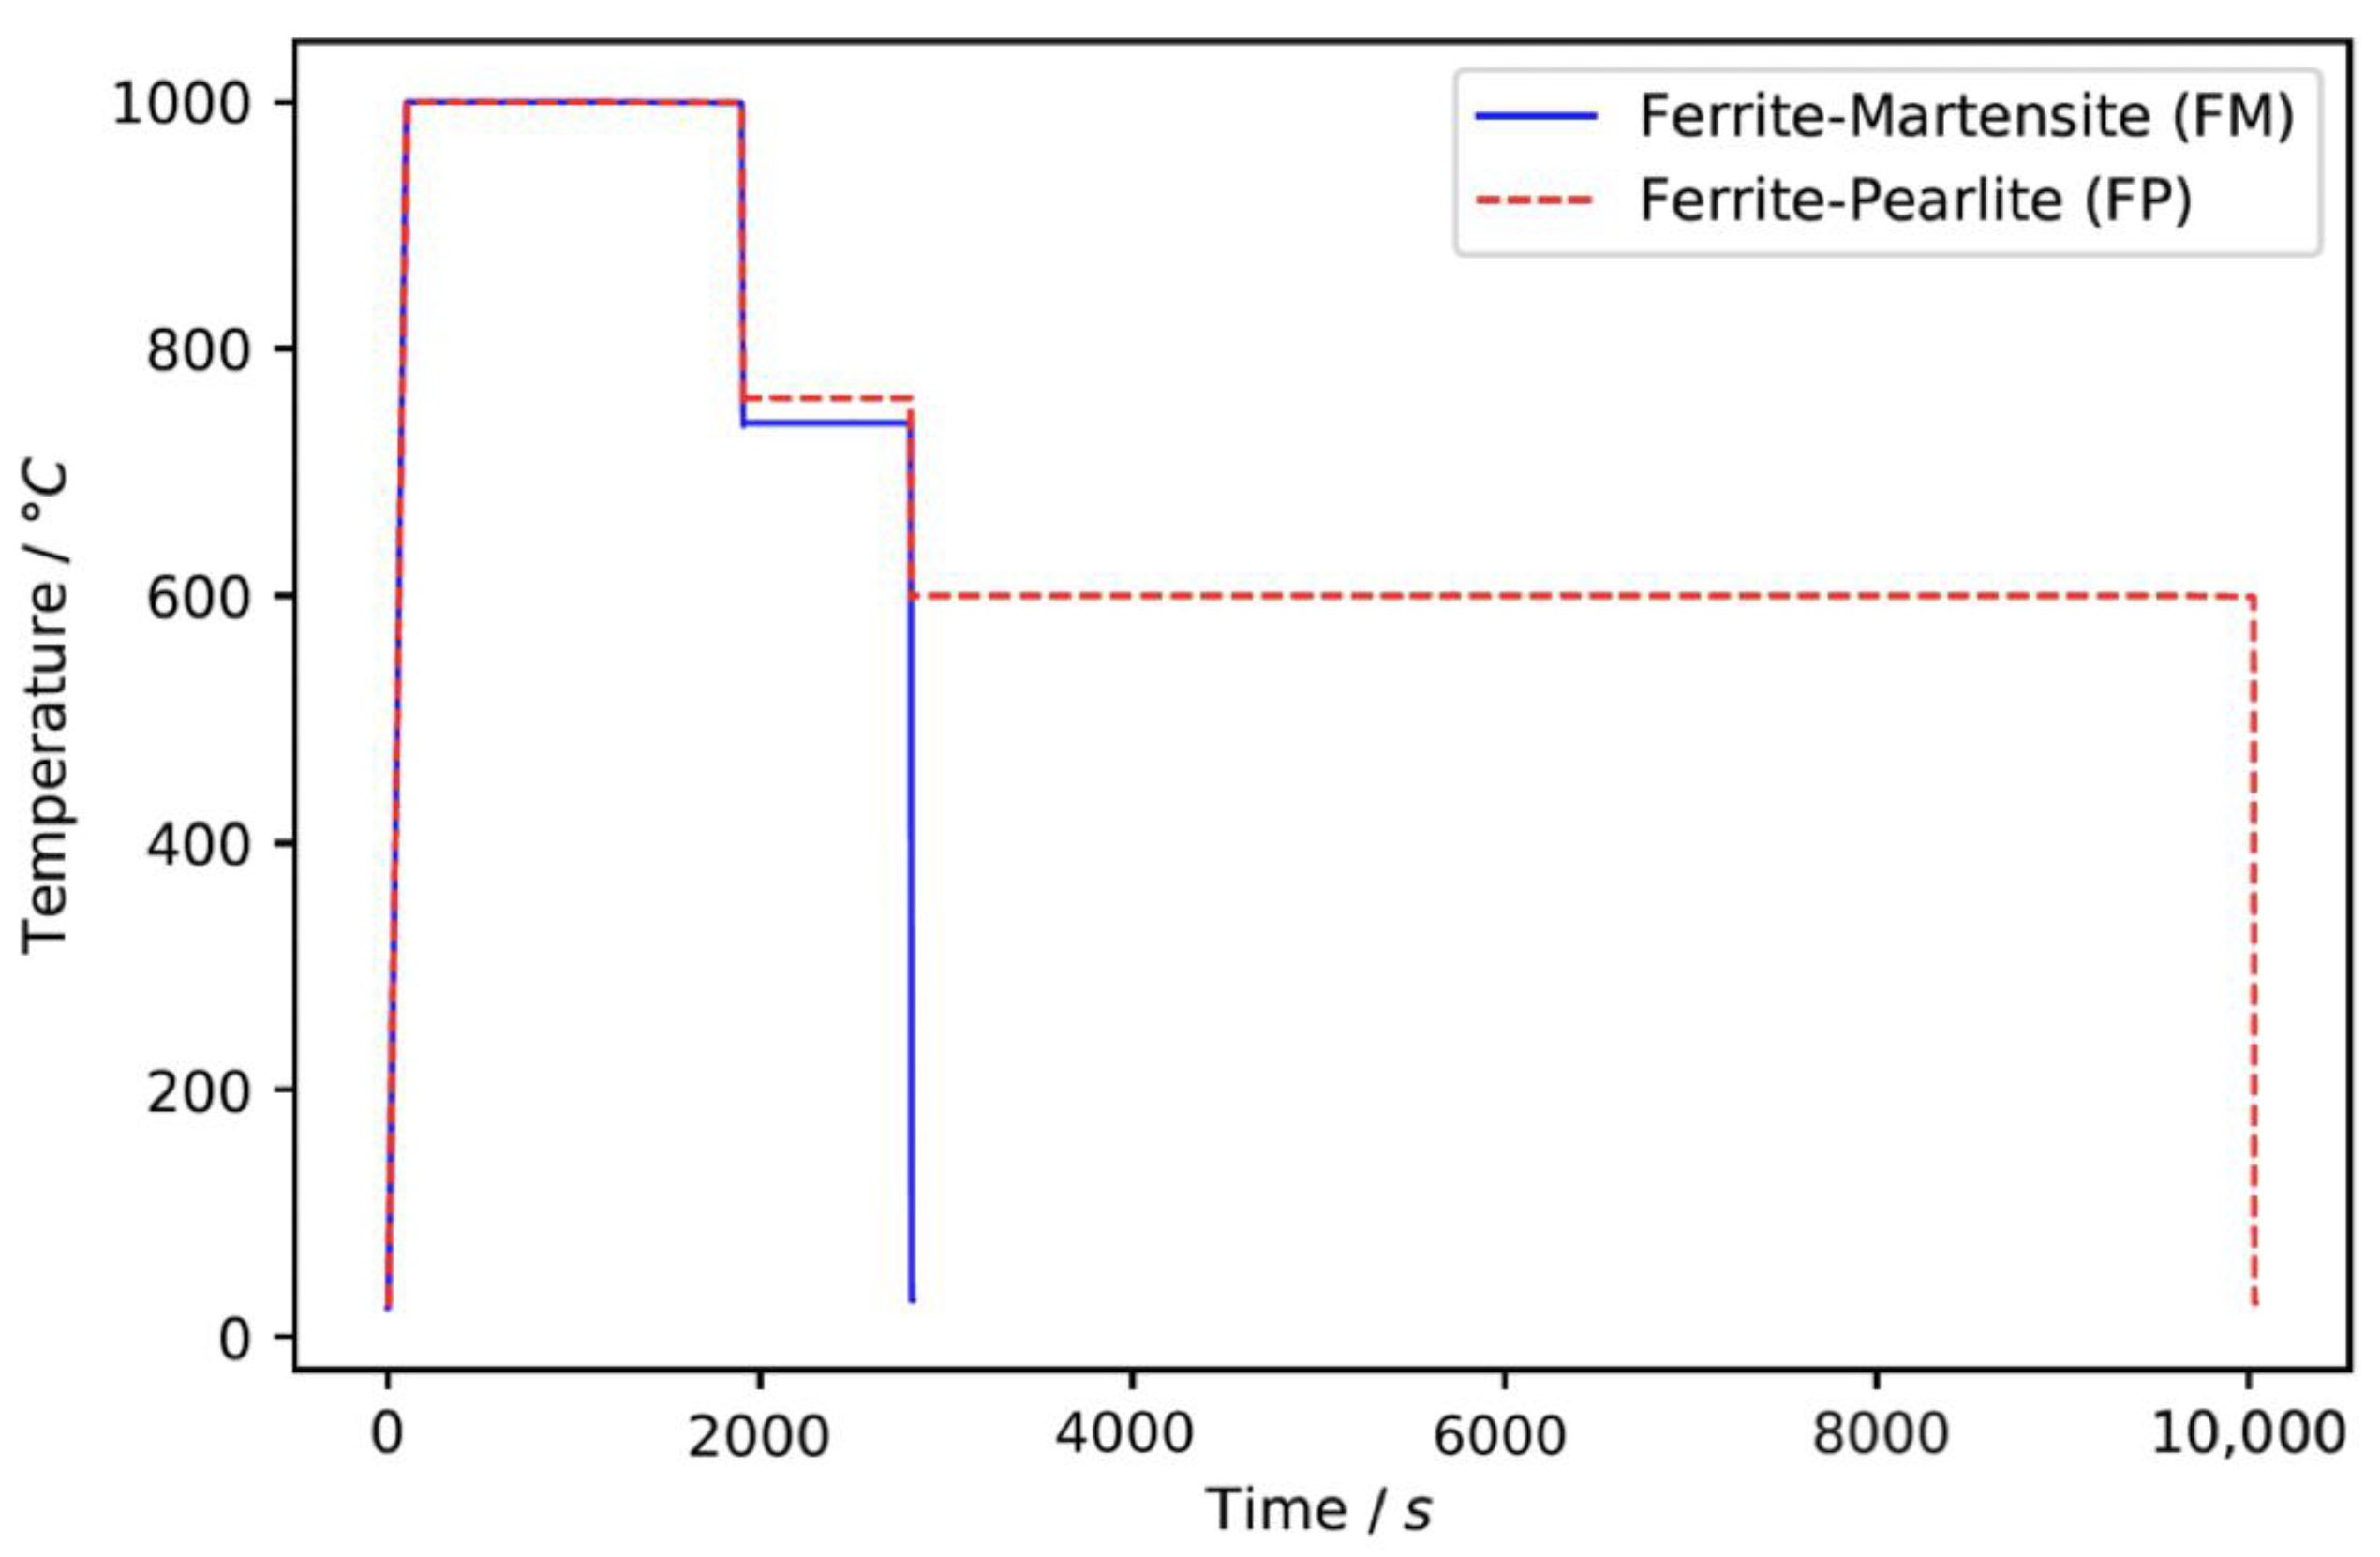
Dilatometry—A Bähr DIL 805 A/D dilatometer (TA Instrument, New Castle, DE, USA) was employed to perform the heat treatments. Various heat treatments were applied to create different two-phase microstructures, a ferrite-pearlite microstructure and a ferrite-martensite (FM) microstructure with similar ferrite volume fractions for both microstructures. The heat treatments are graphically presented in Figure 1. The FM microstructure was obtained by heating the samples to 1000 °C with a rate of 10 °C/s and austenising at 1000 °C for 30 min. Then, quenching to the intercritical annealing temperature 740 °C was applied at a rate of 30 °C/s, subsequently holding the sample at 740 °C for 15 min and quenching to room temperature with a rate of 30 °C/s. The ferrite-pearlite (FP) microstructure was obtained by heating the sample to 1000 °C with a rate of 10 °C/s and subsequent austenisation at 1000 °C for 30 min, quenching to the intercritical annealing temperature 760 °C at a rate of 30 °C/s, holding the sample at 760 °C for 15 min. Then, the samples were cooled to the sub-A1 temperature of 600 °C at a rate of 30 °C/s. Afterwards, the samples were isothermally held at 600 °C for 2 h and then quenched to room temperature with a rate of 30 °C/s.
Sample Preparation—Samples were prepared for microstructure characterisation by embedding them in an epoxy resin (Struers ClaroCit) and curing them for 1 h under 2 bar pressure. The samples were ground with SiC sanding paper from 80 to 4000 grit and subsequently polished using a fine diamond suspension (Struers DiaDuo-2) with 3 and 1 µm particle sizes. Subsequently, the samples were cleaned in an ultrasonic bath with isopropanol for 10 min and afterwards dried with compressed air. A 2% nital solution was used for etching.
Optical Microscopy and SEM—An optical microscope (Keyence VHX-500, Mechelen, Belgium) was employed to characterise the microstructure with optical micrographs. A scanning electron microscope, SEM (Jeol JSM-IT100, Peabody, MA, USA) was used for a more detailed secondary phase determination. Micrographs were examined for identification of the phase constituents and the volume fractions of the respective phases. The volume fractions were obtained with the line interception method. Analysis areas of 0.1 mm2 taken from four different locations per sample were investigated with ImageJ software (v.153, National Institutes of Health (NIH), Bethesda, MD, USA).
2.3. Electrochemical Measurements
Sample Preparation—The grinding and polishing steps used for microstructure characterisation were followed to obtain a mirror-like polished surface for the electrochemical experiments. The gap between the steel specimen and the epoxy resin was covered with an insulating lacquer (Electrolube BLR) to prevent possible crevice corrosion during measurements.
Electrochemical Experiments—All electrochemical experiments were conducted at room temperature in aerated 0.1 M NaOH solution (pH 12.6). The solution was prepared with Sigma-Aldrich NaOH pellets and Milli-Q® ultrapure water. A three-electrode electrochemical cell consisting of stainless-steel mesh as the counter electrode, Ag/AgCl as the reference electrode and the specimens as the working electrodes was employed. A Biologic VSP-300 potentiostat was used for electrochemical measurements. EC-lab software (v11.33, Biologic, Seyssinet-Pariset, France) was employed to analyse the data.
Open circuit potential (OCP) was recorded for 1 h, during which it had stabilised. Subsequently, the samples were passivated with potentiostatic polarisation, carried out at a potential of 0.2 V for 6 h. After passivation of the samples, electrochemical impedance spectroscopy (EIS) measurements were conducted by applying an AC perturbation with a peak-to-peak amplitude of 10 mV in the frequency range from 30 kHz to 10 mHz. The equivalent electrical circuit (EEC) fitting of electrochemical impedance spectroscopy data was done using the software Zview (v3.5h, Charlottesville, VA, USA). Capacitance measurements (Mott–Schottky analysis) were performed to characterise the electronic properties of the passive layer. Capacitance measurements were conducted at a frequency of 1 kHz with a peak-to-peak AC voltage of 10 mV. At this frequency, the capacitance of the iron oxide is not significantly affected. As a result, the electronic part of the space charge region contribution to the capacitance can be evaluated [6]. A potential step size of 50 mV is used to sweep a potential range from 0.6 V to −1.0 V. All electrochemical measurements were repeated at least three times to estimate the uncertainty of the experiments.
3. Results and Discussion
3.1. Microstructure Characterisation
Table 2 shows the austenite transformation start (Ac1) and austenite transformation finish (Ac3) temperatures, as well as martensite start (Ms) and martensite finish (Mf) temperatures, for the heat treatments, obtained through the dilatation responses of samples during the heat-treatments (not shown here). Heat treatments for creating ferrite-martensite and ferrite-pearlite dual phase microstructures are determined from these values. Intercritical annealing treatment allows the partial transformation of the austenite into ferrite. During the quenching process, the austenite is transformed into martensite and in the case of isothermal holding at 600 °C, the austenite is transformed into pearlite. The grain sizes of ferrite phase are 12 ± 3 µm for FM microstructure and 9 ± 4 µm for ferrite-pearlite microstructure.
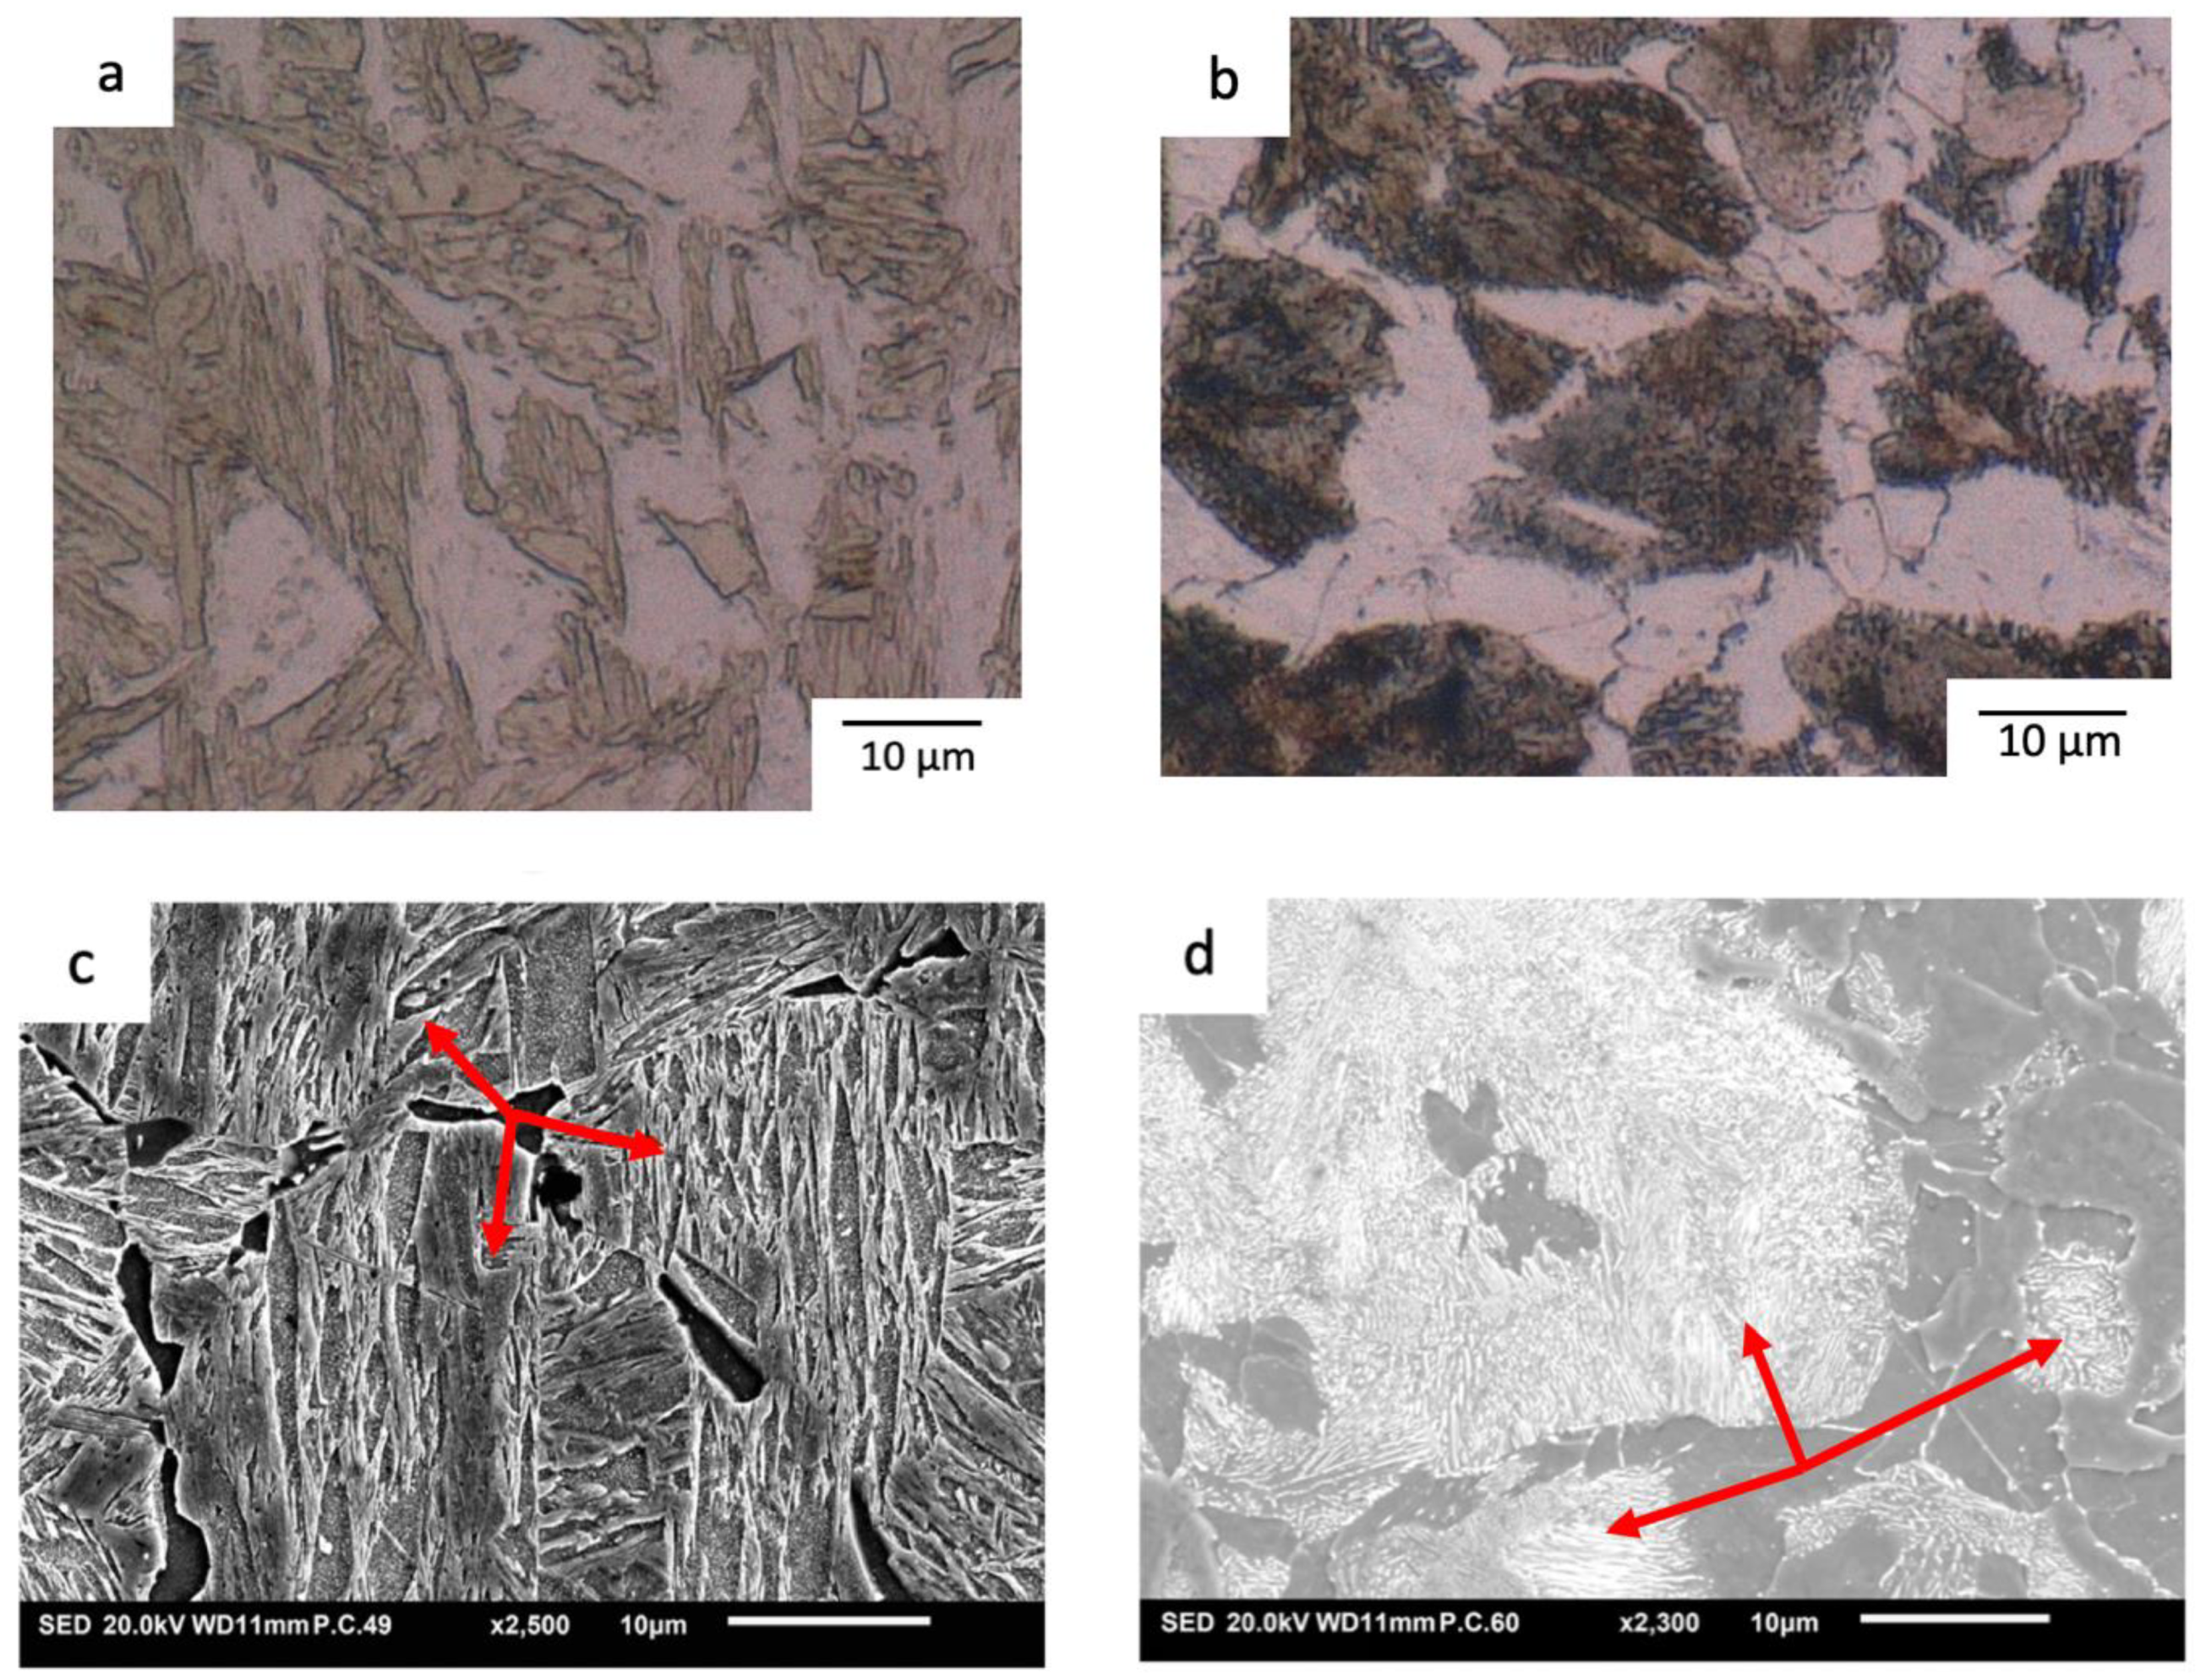
Optical images of both microstructures and SEM images, highlighting the distinct secondary phases of the microstructures, are presented in Figure 2. The heat treatments (in Figure 1) result in a FM dual-phase microstructure with 50 ± 2% ferrite volume fraction and a ferrite-pearlite dual-phase microstructure with 56 ± 5% ferrite volume fraction. In Figure 2a,b, lighter shades correspond to the ferrite phase, and darker ones correspond to martensite and pearlite phases for FM and FP microstructures, respectively. In Figure 2c,d, SEM images show the respective martensite and pearlite secondary phases in more detail, where red arrows demonstrate different martensite packets and pearlite colonies. The complex morphology of the martensite phase is seen to be composed of laths and blocks and displays a needle-like morphology. In contrast to the martensite, the pearlite phase has an entirely different morphology which consists of a lamellar structure of ferrite and cementite phases, as shown in Figure 2d.
3.2. Electrochemical Characterisation of the Passive Layer
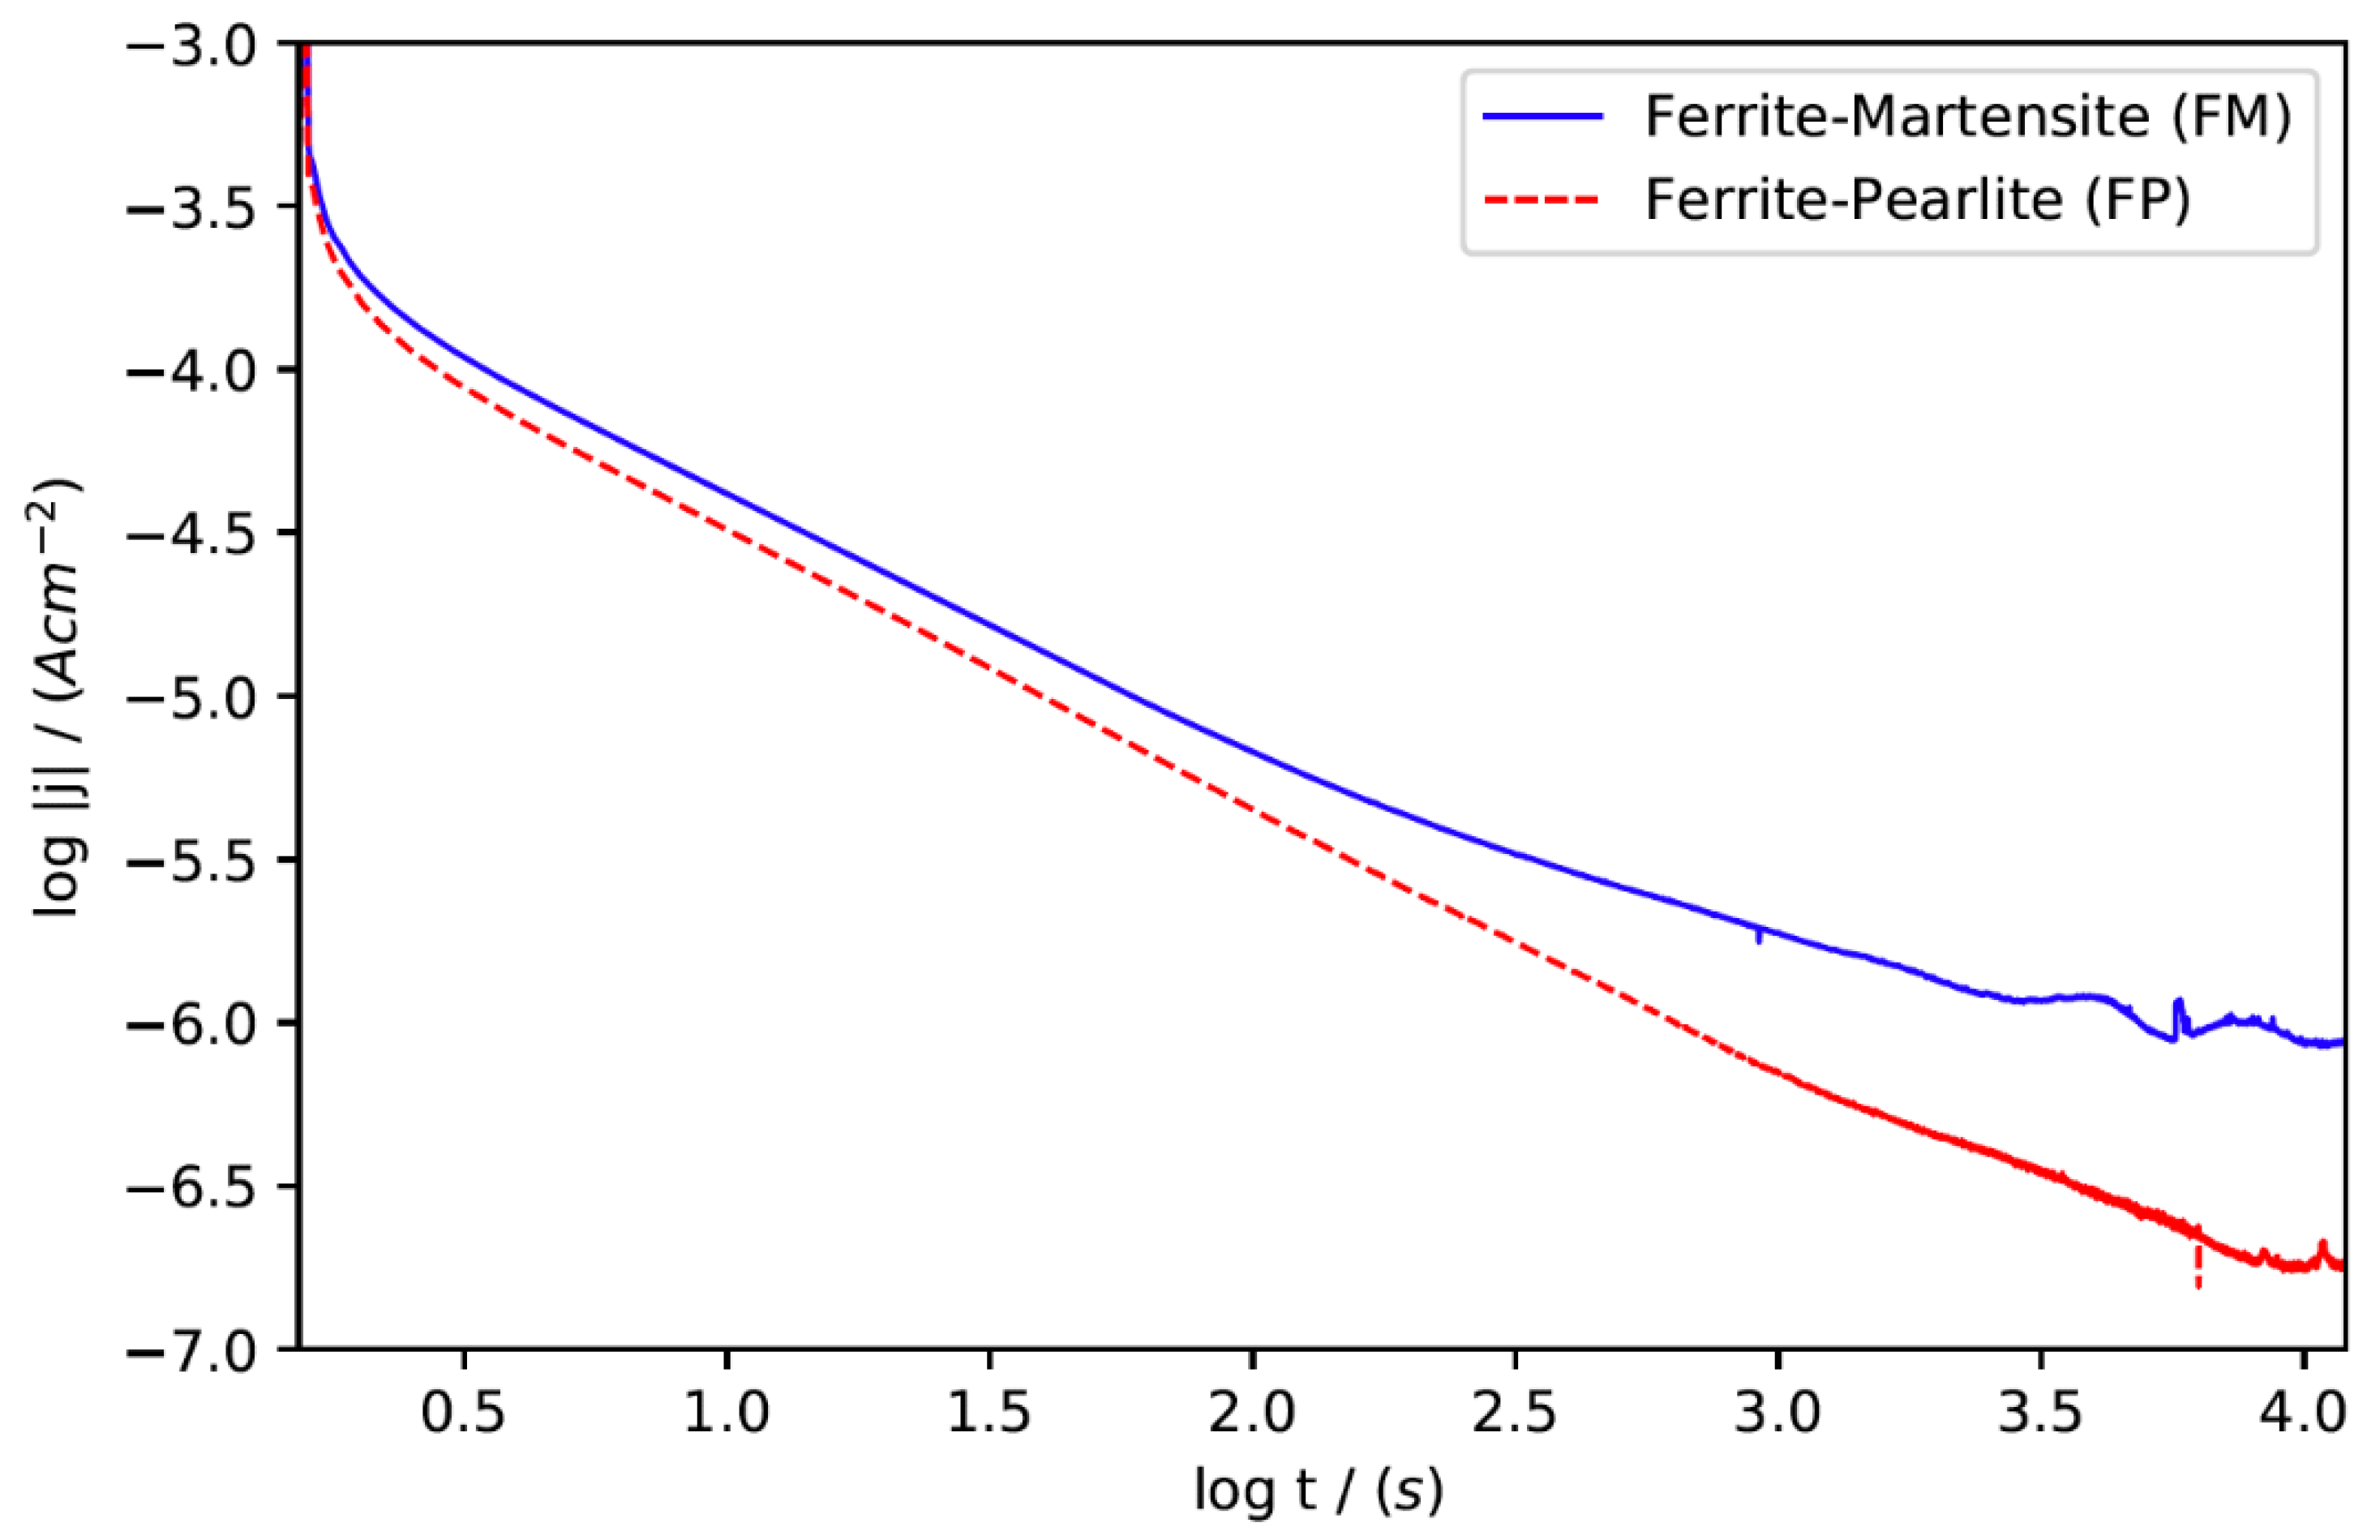
Potentiostatic polarisation at 0.2 V (vs. Ag/AgCl) is employed in 0.1 M NaOH environment for 6 h, ensuring the formation of a passive layer due to the alkaline environment. Figure 3 displays the change in current density with time during the potentiostatic polarisation experiment. Initially, for the first seconds, the current densities j of both samples decrease exponentially due to the formation of a passive film layer. The current changes correspond to the growth of the passive layer. After the sharp decrease in the first few seconds, until around 100 s, the logarithmic slope (-dlog| j |/dlog t) of FM and FP samples has a value of 0.87 and 0.82, respectively, and decreases as the potentiostatic polarisation continues. A slope of 1 is associated with a perfect anodic passive film growth under a high electric field with negligible dissolution reactions of the oxide, where the entire current is consumed for the passive film growth [6,7,8,9]. In our case, the slopes of 0.87 and 0.82 indicate that part of the currents can be attributed to other processes. Then, it is assumed that initially, the passive layer grows homogeneously as a large part of the current is consumed for oxide growth, and other processes take place, such as the transformation of ferrous oxides into ferric oxides. The currents start stabilising after 6000 s for the FM sample and after 8000 s for the FP sample.
It is also observed that the samples present different steady-state currents. The current densities for the steady state are measured as 0.17 ± 0.02 µAcm−2 for the FP sample and 1.10 ± 0.04 µAcm−2 for the FM sample. Therefore, the conductivity of passive film developing on the FM sample is demonstrated to be 6.5 times the passive layer conductivity of the FP sample. The differences are indicative of the differences in the ionic and/or electronic conductivity of the formed passive layers.
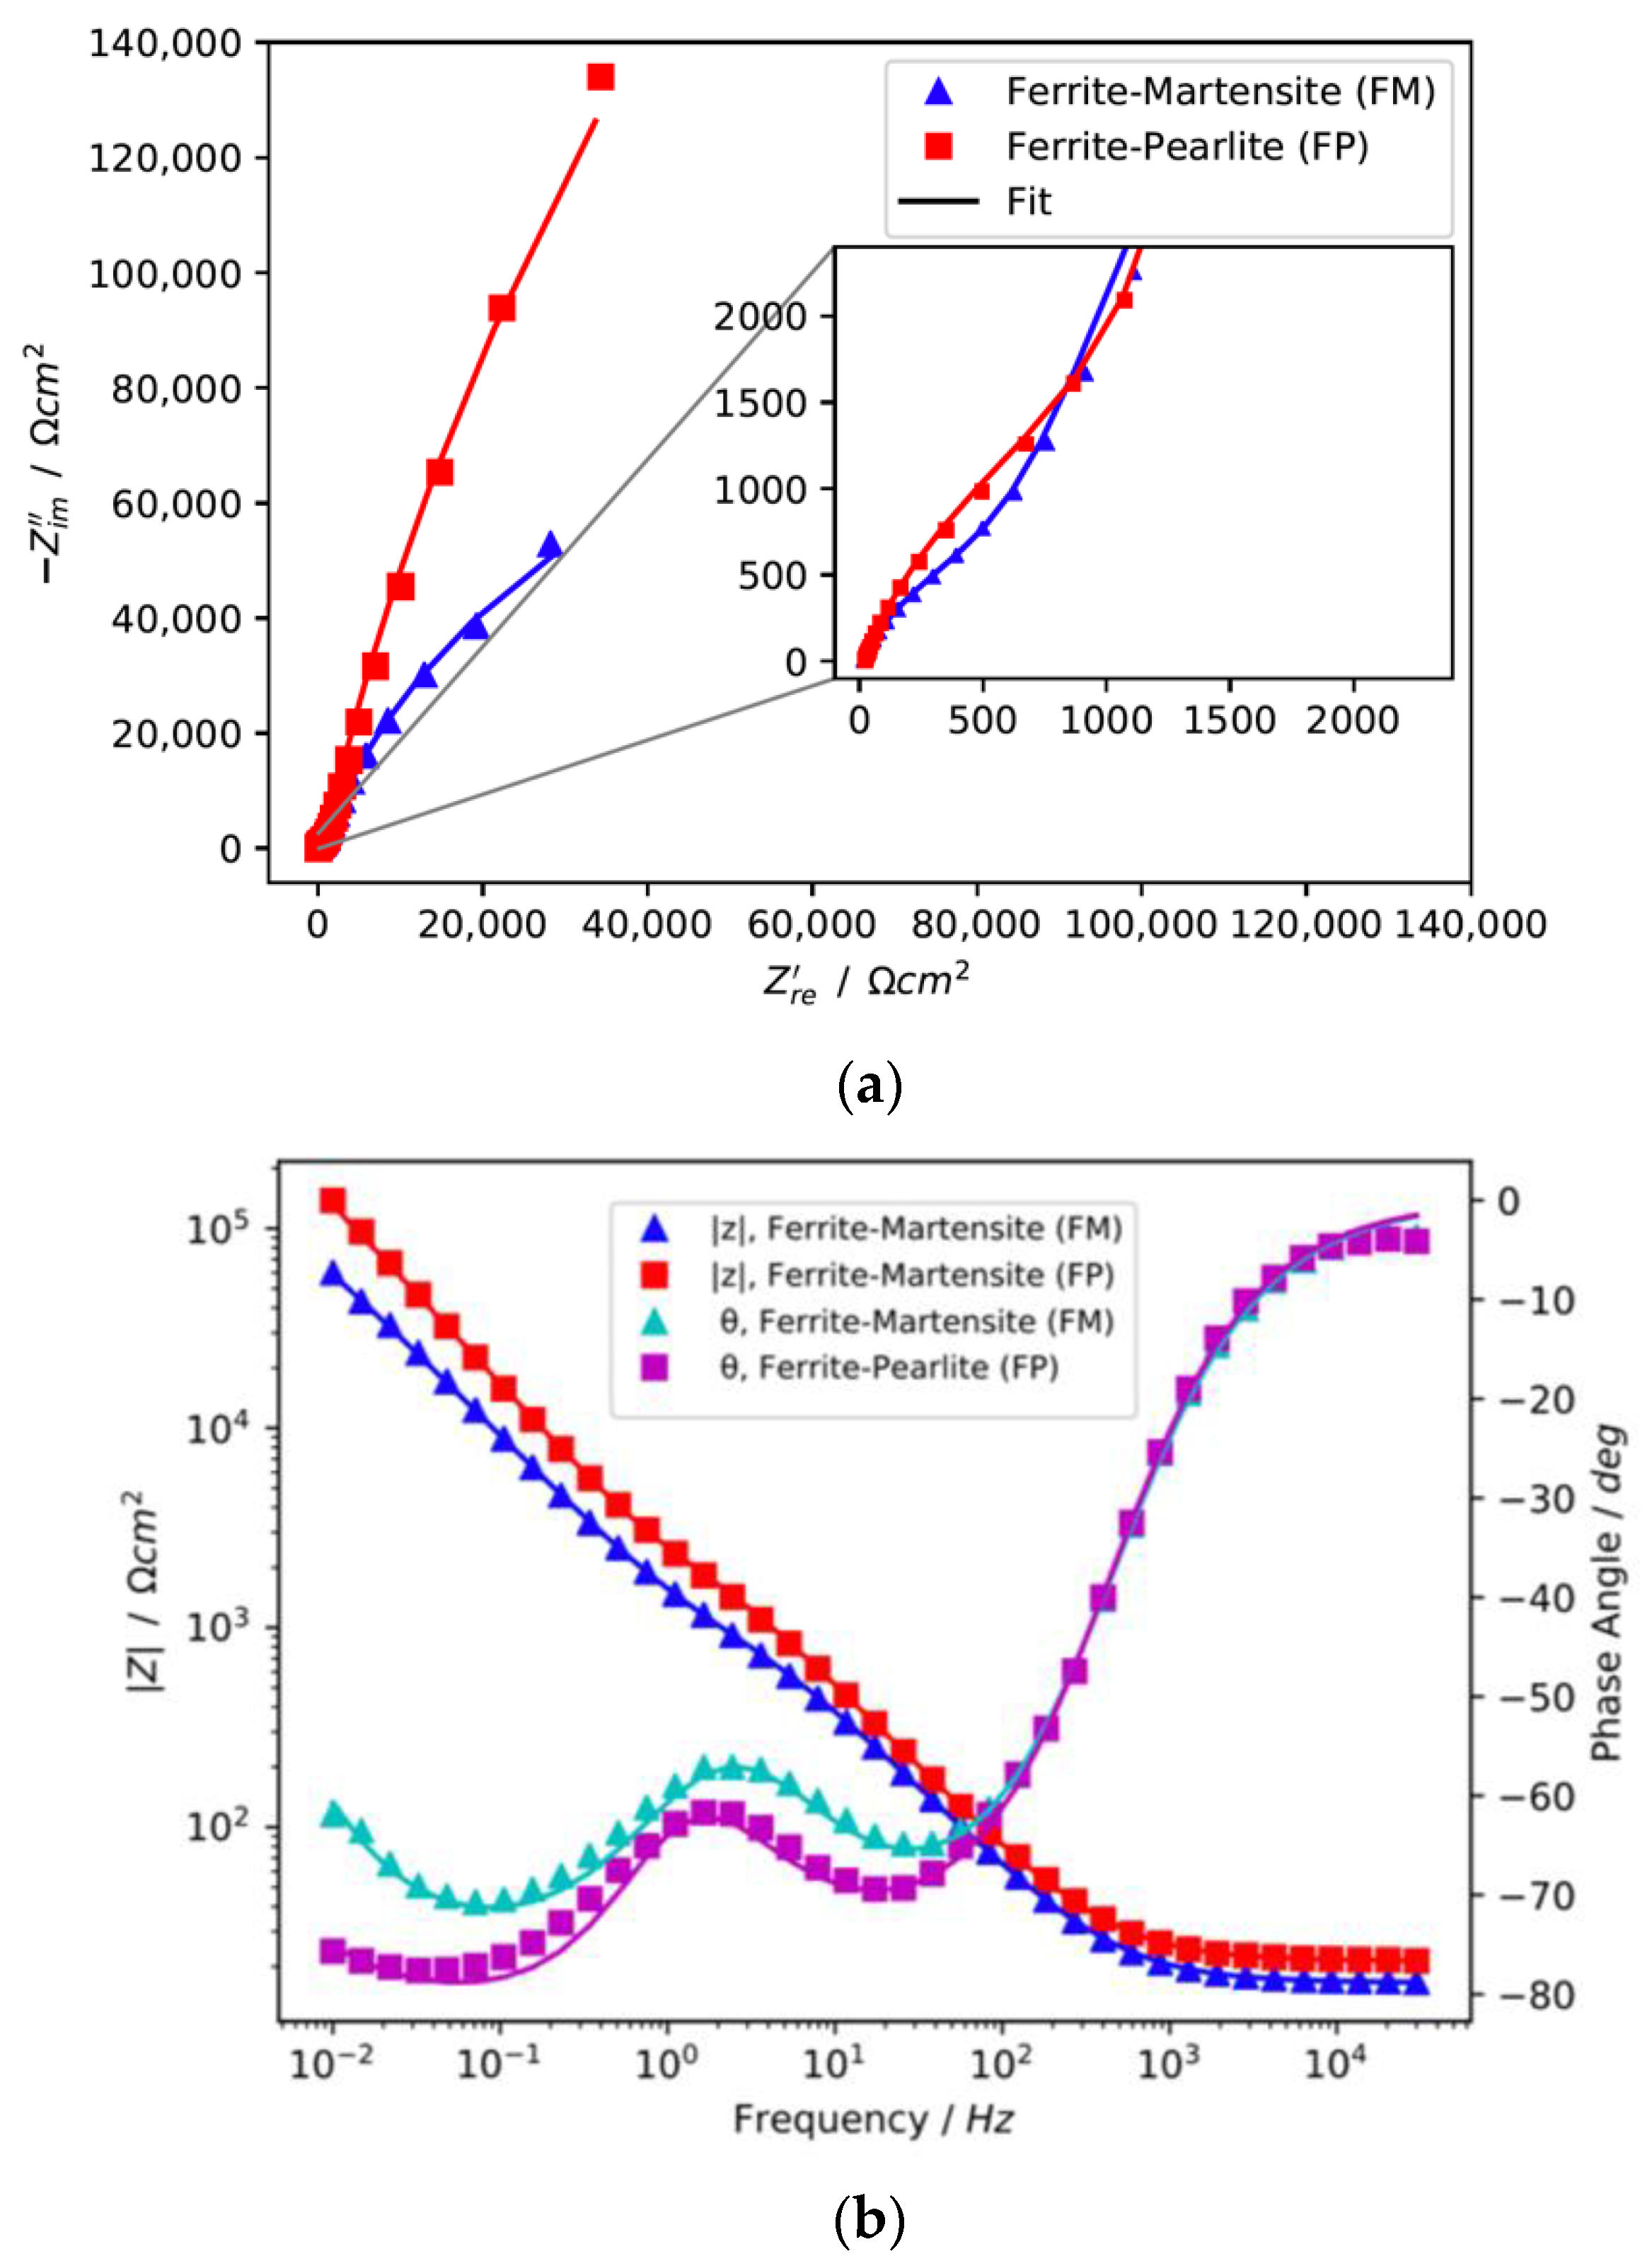
Electrochemical Impedance Spectroscopy (EIS) investigations are demonstrated in Figure 4, which shows selected Nyquist and Bode plots of the FM and FP samples after potentiostatic polarisation. In the Nyquist plots, the FP samples exhibit a larger arc diameter in comparison with the FM samples. A second smaller semi-circle found at higher frequencies is only visible after zooming in the graph, see Figure 4a. The two time constants are more clearly visualised in the Bode plots, see Figure 4b, especially in the twin valleys seen in the phase angle plots. From the EIS spectra, a higher impedance value for the FP sample is observed. The impedance modulus values are 59.88 ± 3.42 kΩcm2 for FM and 138.31 ± 19.02 kΩcm2 for FP sample at the low frequency of 10−2 Hz. The larger arc in the Nyquist plots and the higher impedance modulus values in the Bode plots for the FP samples indicate a higher barrier property for the passive layer formed on the FP samples. This agrees with the current transient trends observed in the steady-state potentiostatic polarisation curves.
Solid lines show the fitted curves by the proposed equivalent circuit. |z| values correspond to impedance modulus and θ values correspond to phase angle values in the Bode plots.
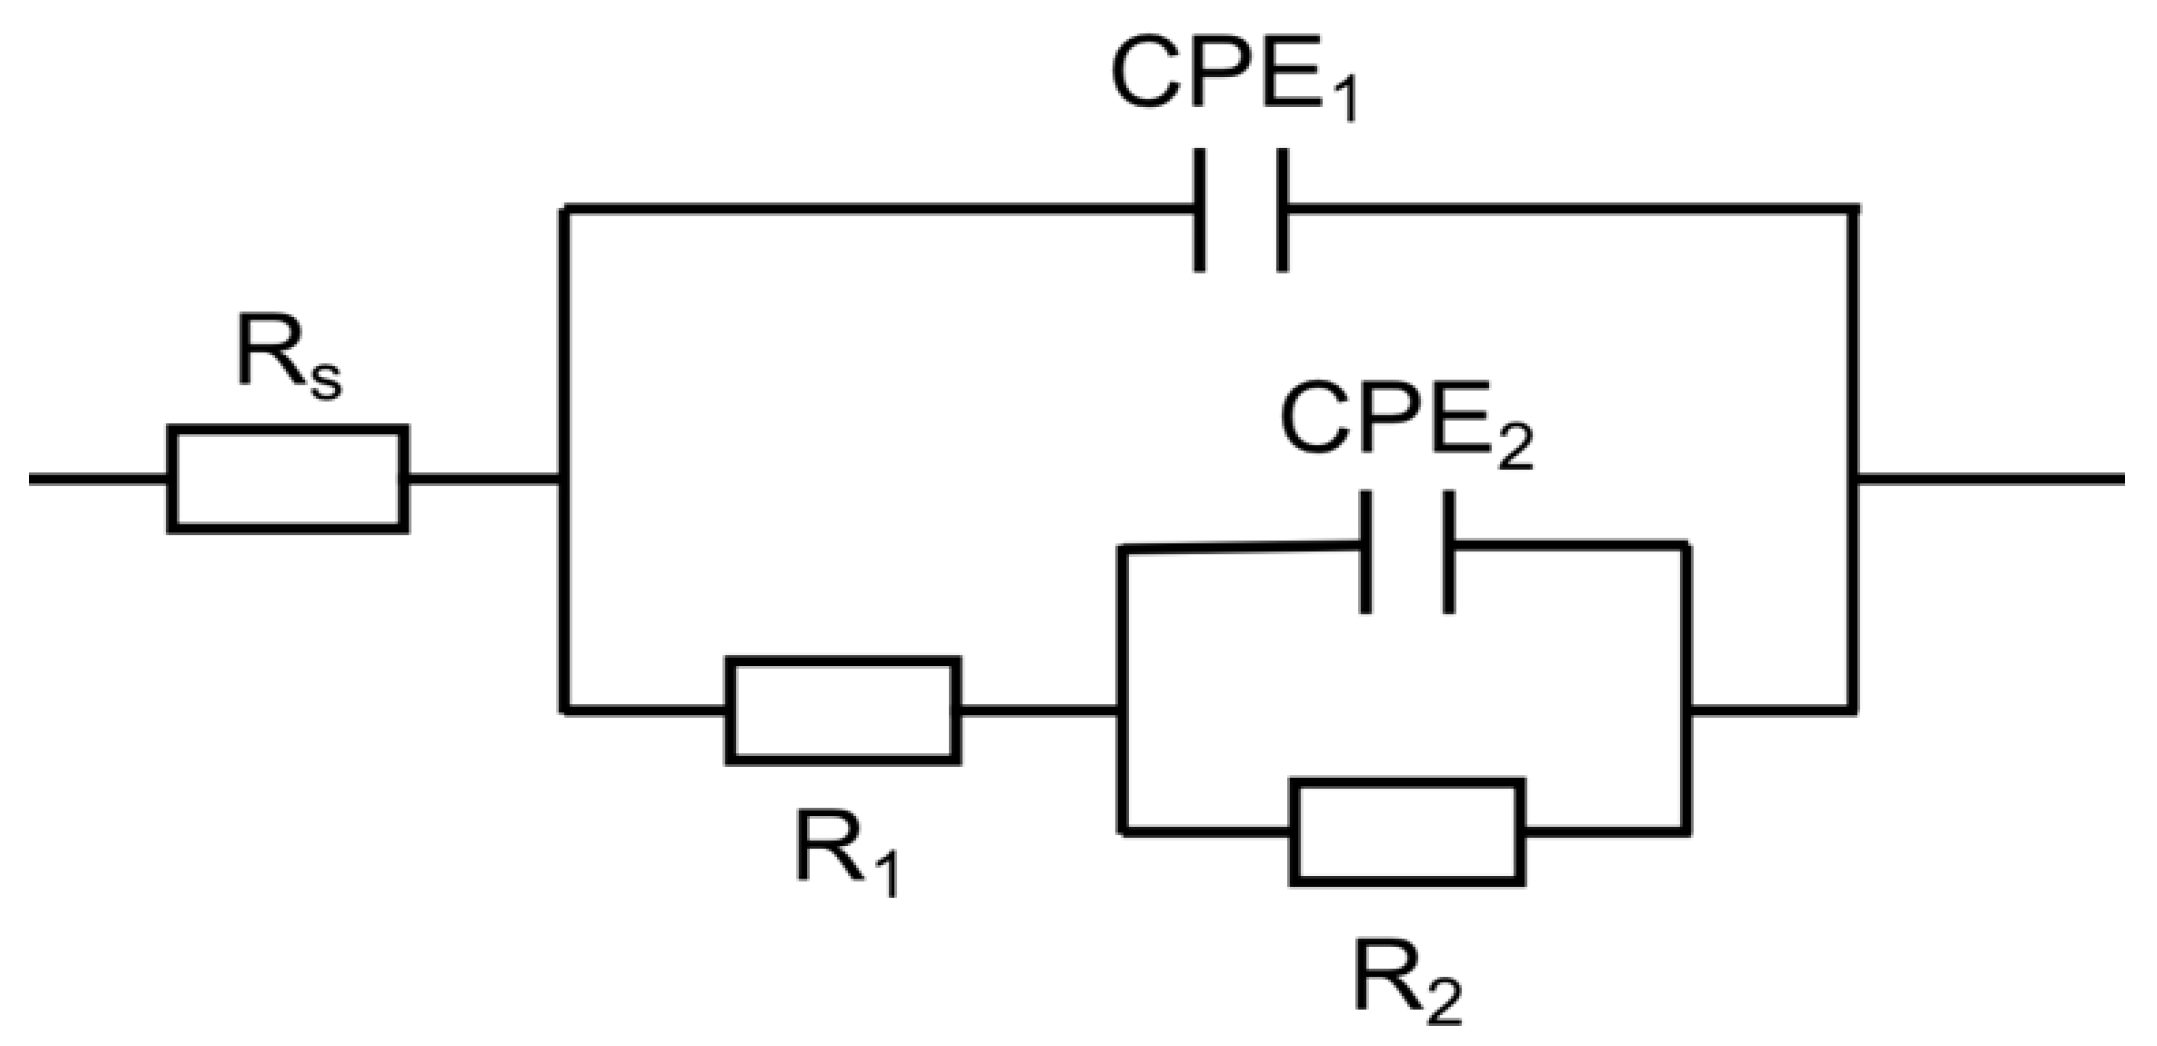
The EIS results are fitted by an electrical equivalent circuit (EEC) shown in Figure 5. The chosen circuit with two time constants was used in a recent study for fitting the EIS response of low carbon steels in an alkaline NaOH environment [10,11]. Rs represents the resistance of the electrolyte, R1 and CPE1 the resistance and capacitance of the double layer, R2 the passive layer resistance and CPE2 the capacitance of the surface of the passive film. Constant phase elements (CPE) are employed instead of capacitors due to the deviation from the ideal capacitive behaviour. Capacitance values (C) are calculated by using the resistance and constant phase element values with the Hsu and Mansfeld approach [12]:
where R is the resistance, n the CPE coefficient, and Q the CPE constant. The calculated equivalent resistance and capacitance values after the equivalent circuit fit are given in Table 3.
The resistance of the passive layer, R2, is considerably higher for the FP sample, with a fivefold higher value than the FM sample’s resistance value. This agrees with the behaviour seen in potentiostatic measurements. It indicates that the ferrite-pearlite microstructure forms a passive layer with better barrier properties. Capacitance values of the double layers are in close proximity to one another. The average capacitance of the FM samples’ passive film is higher than of the passive film of the FP samples.
The capacitance values can be used to estimate the thickness of the passive layer. The relation between the capacitance value and the thickness is given by [13]:
where df is the thickness of the passive layer, ε = 40 [14,15] the dielectric constant of the passive films formed on carbon steels, ε0 the permittivity of vacuum, and Cf the capacitance of the passive film. The thickness values are 1.10 ± 0.17 nm for FM samples and 2.2 ± 0.8 nm for FP samples, respectively.
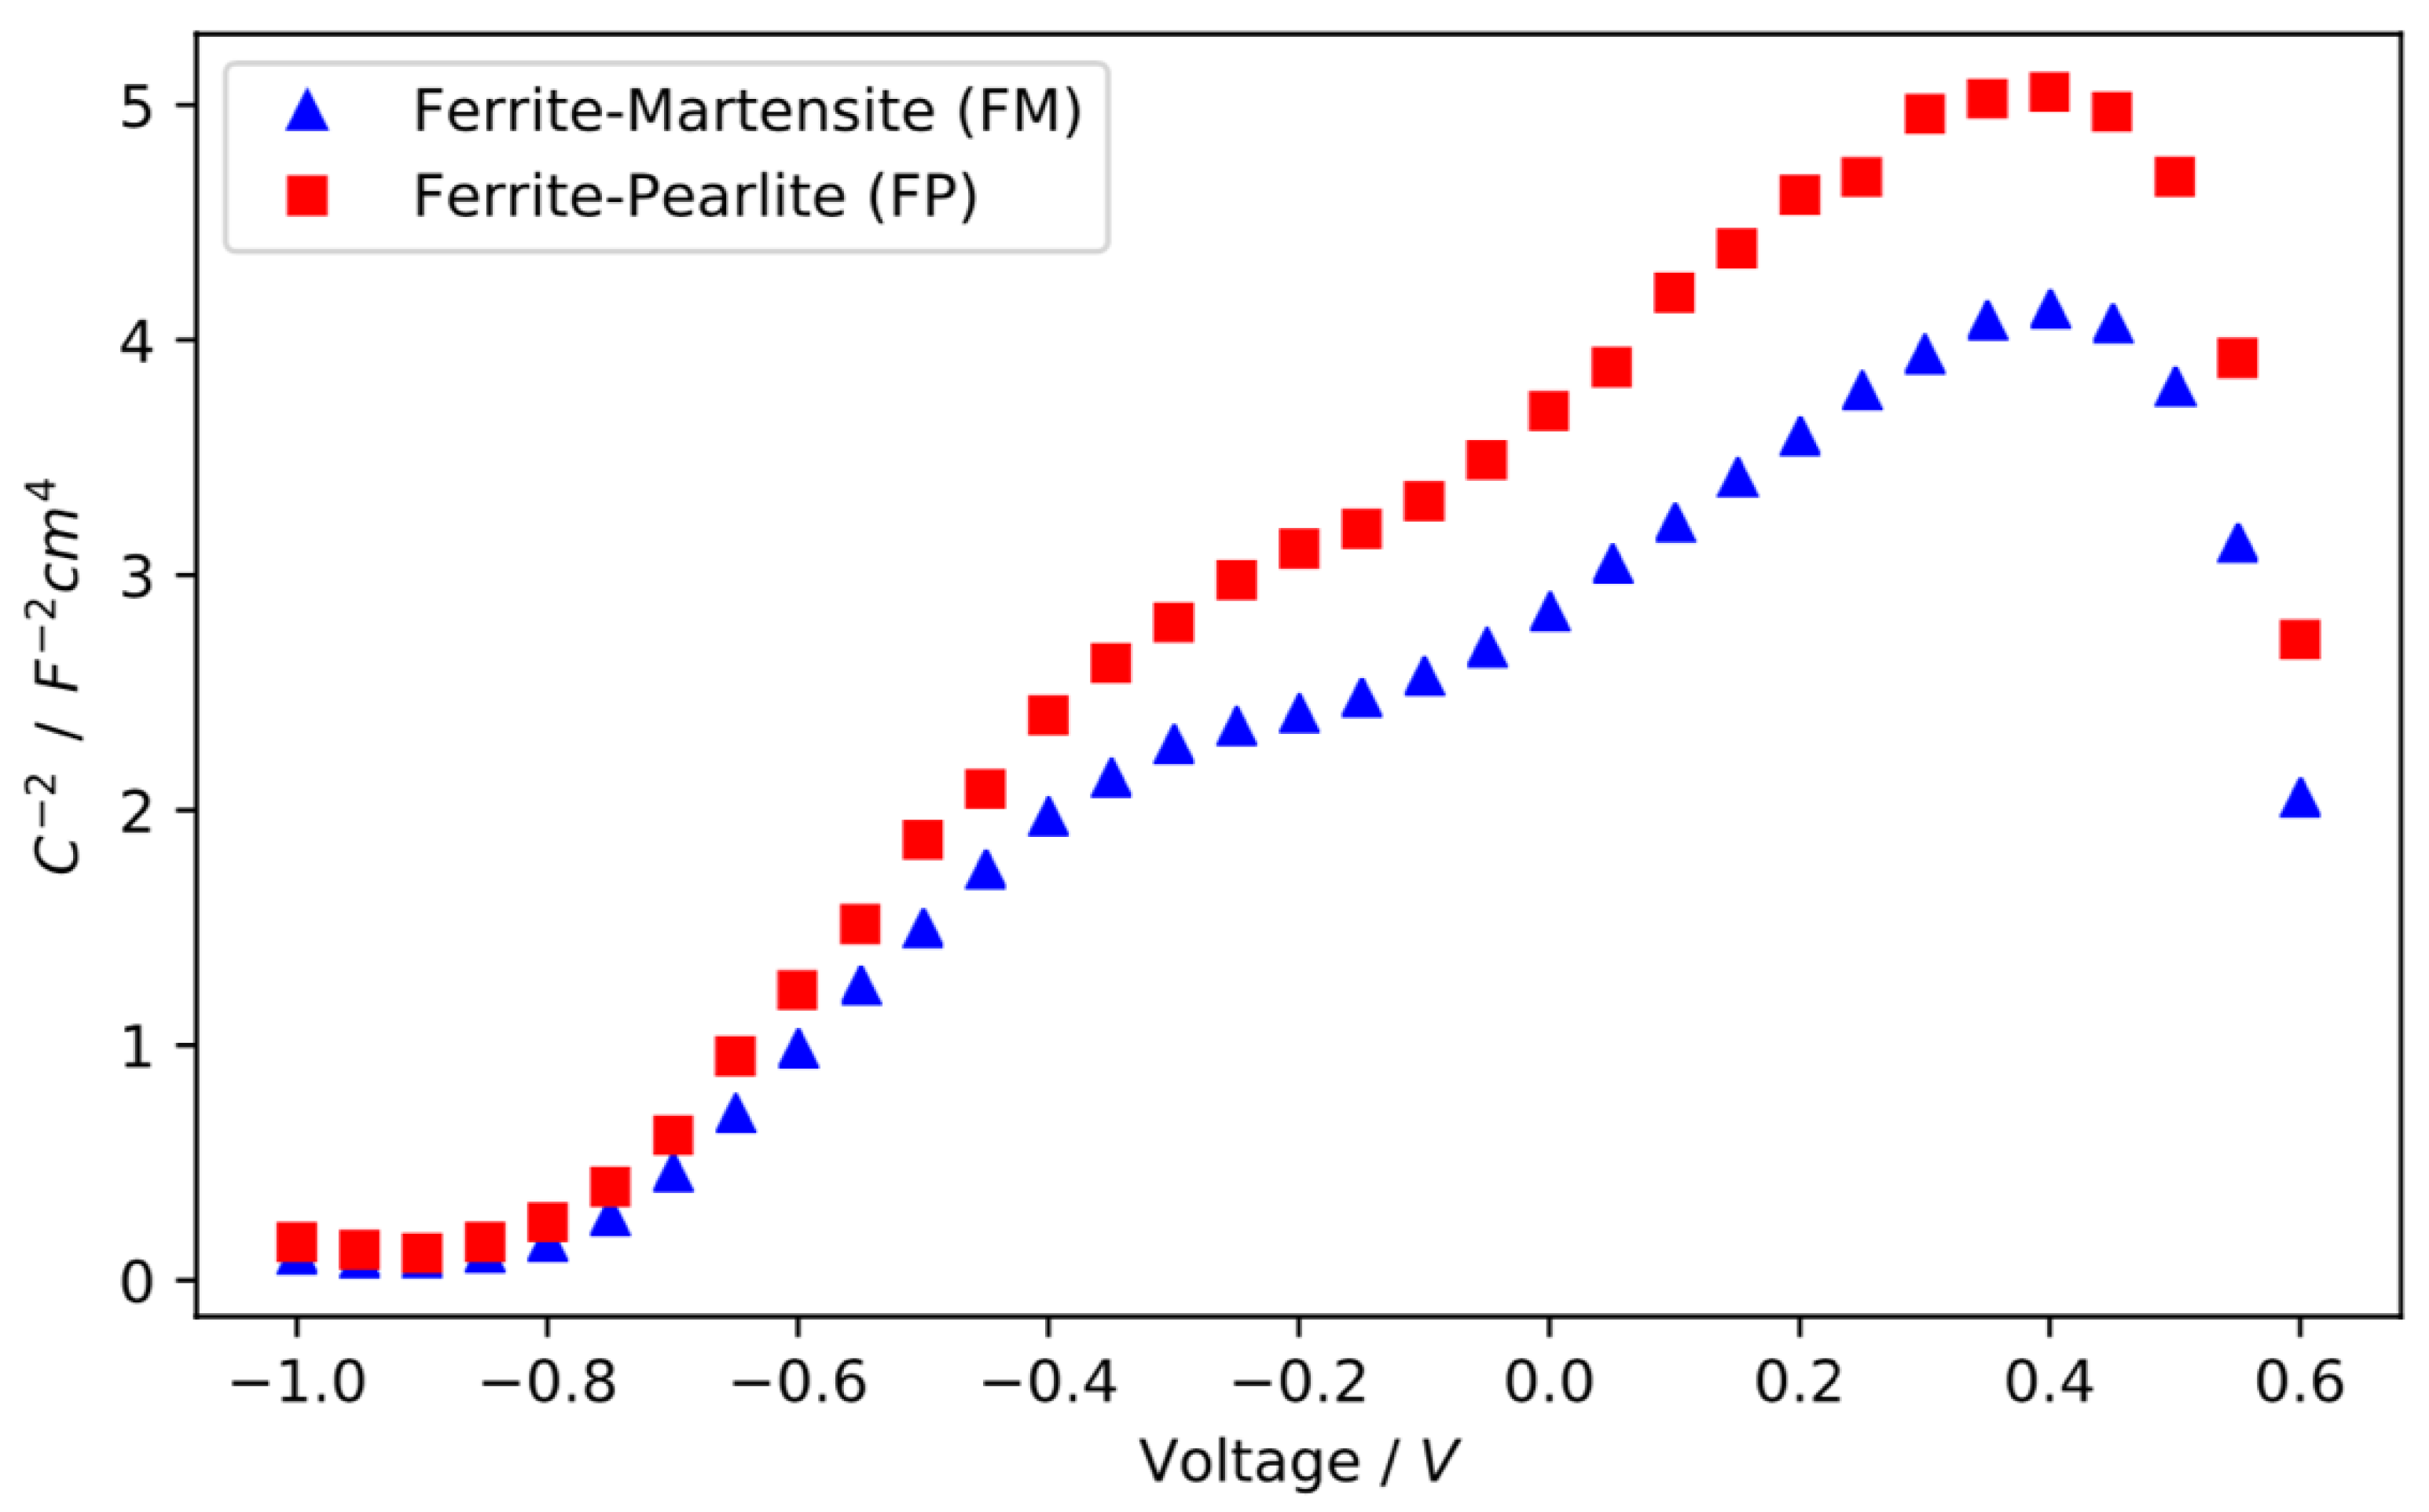
The Mott–Schottky analysis is carried out to measure the effect of different phase constituents on the passive film’s electronic properties. Figure 6 shows the Mott–Schottky plots of the passivated samples. The positive slopes of both samples indicate an n-type semiconductor behaviour of the passive layer [16]. It is considered that this behaviour arises from point defects in the oxide structure, such as O2− vacancies [17].
A non-linear behaviour is observed in the Mott–Schottky plots of Figure 6. The decreasing slopes at higher potentials suggest that Fe3+ vacancies start contributing to the total doping concentration with increasing potential [17]. The existence of a second positive slope indicates a change in donor type or the presence of a second donor level in the band gap that corresponds to the ionisation of a deeper donor level [18]. The (hydr)oxide film’s capacitance is composed of the Helmholtz layer of the electrolyte and the space charge region of the semiconductor. The capacitance of the passive film is the combination of the capacitances of both layers connected in series. In the case of the passive film, the capacitance of the Helmholtz layer is much higher, and the capacitance can be regarded as the capacitance of the space charge layer. In such a case, the Mott–Schottky relationship can be used to quantitatively analyse the donor density of the oxide [19,20]:
where C is the capacitance, EFB the flat band potential, E the applied potential, k the Boltzmann constant, T the temperature, q the electron charge, ε0 the permittivity of vacuum, ε = 40, the previously measured dielectric constant of the passive films formed on carbon steels [14,15], and Nd is the donor density. The donor density is inversely correlated with the Mott–Schottky slope C−2/E.
The donor densities of both FM and FP samples are on the order of 1021 cm−3. This order of magnitude is typical for disordered heavily doped passive films [5,9,18,21]. The donor density values have been calculated from the slopes in the more positive potential range, i.e., for E > −0.3 V. The donor densities of passive films are 2.4 ± 0.3 × 1021 cm−3 for the FM and 1.49 ± 0.08 × 1021 cm−3 for the FP sample. The FM sample’s donor density is 1.6 times the FP sample’s donor density, showing that the passive layer of the FM sample is notably more defective. Furthermore, the flatband potentials for the FP and FM samples are 0.81 ± 0.01 V and 0.73 ± 0.02 V. This difference in flatband potentials suggests variations in the fraction of iron oxides in the passive film. This is in line with previously reported values for passive layers developed on multi-phase steel substrates [5].
Electrochemical experiments demonstrate that the FP microstructure has a more resistant passive layer with better barrier properties than the FM microstructure. Superior barrier properties of the ferrite-pearlite microstructure are attributed to a lower donor density of the developed passive film. The defect density is an essential factor for the electronic and ionic conductivity of the passive oxide layer. An increase in the donor density decreases the band gap of the oxide [22], facilitating the transfer of electrons and resulting in increased electronic conductivity. On the other hand, an increase in ionic defect concentration also allows easier ionic access through the oxide film, increasing the ionic current [5]. As a result, both ionic and electronic resistances become essential factors in determining the barrier properties of the developed passive layer.
The higher donor density of the FM samples can be explained by the complex microstructural morphology of the martensite phase, resulting from the displacive and diffusionless martensite transformation. The passive film’s overall quality is depreciated by the disordered surface. The distorted microstructure has high surface energy due to the high dislocation density. The ferrite-martensite grain boundaries contain a significant degree of lattice mismatch. Intricate lath and grain boundaries disturb the passive layer’s packing structure, therefore resulting in a more defective passive film. The work of Yanagisawa et al. [5] showed that the donor density of layers growing on pure martensite is higher than for both dual phase ferrite-martensite and pure ferrite microstructures, highlighting the harmful effect of martensite on passivity. The high donor density can also facilitate the formation of Fe3O4, which results in a conductive passive layer with a high fraction of oxygen vacancies [17].
It has been shown that the electronic resistivity of bulk Fe2O3 is significantly larger than of Fe3O4 (a resistivity in the range of 1010 Ωm for γ-Fe2O3 [23] and 1016 Ωm for α-Fe2O3 [24]) with a much higher band-gap (2.3 eV for γ-Fe2O3 [18], 0.1 eV for Fe3O4 [25]). Electronic conduction is further affected by the continuous exchange of electrons between Fe+2 and Fe+3 ions. The logarithmic slope of the potentiostatic experiments decreases faster for the FM sample, indicating that an increasing part of the current is directed towards conversion between different forms of iron oxide. This would introduce higher Fe+2 concentration due to a higher Fe3O4 fraction, potentially increasing the current density by facilitating the exchange of electrons between Fe+2 and Fe+3 ions. Meanwhile, irregular and open structures such as porous FeO(OH) permit easier access to corrosive species such as oxygen to the substrate under the protective oxide film, causing minimal resistance [26]. The relative fraction of such species undoubtedly results in different corrosion resistivities for different microstructures. Future X-ray Photoelectron Spectroscopy analysis would illuminate this behaviour.
4. Conclusions
In this paper, the role of phase constituents on the passivity behaviour of two-phase low alloy steels is investigated in a 0.1 M NaOH environment. The effect of phases on the passivity behaviour of two-phase steels is analysed with potentiostatic polarisation, electrochemical impedance spectroscopy, and Mott–Schottky analysis. The following conclusions are drawn from the electrochemical measurements:
- (a)
- The current density during steady-state potentiostatic polarisation is higher for the ferrite-martensite microstructure than for the ferrite-pearlite microstructure. The evolution of the logarithmic slopes with time indicates an immense degree of ferric to ferrous oxide transformation for the passive film formed on the ferrite-martensite microstructure.
- (b)
- Electrochemical Impedance Spectroscopy measurements of the passive layers show a similar electrochemical response with two-time constants for both microstructures; however, the passive layer of the ferrite-pearlite microstructure displays a distinctly more resistive behaviour.
- (c)
- The ferrite-martensite microstructure passive layer has a higher donor density than the layer on the ferrite-pearlite microstructure, which results in a more defective film.
The presented results demonstrate that passive electrochemical behaviour is strongly dependent on the microstructure and phase constituents. For passivated ferrite-martensite and ferrite-pearlite microstructures with an equal ferrite volume fraction, the barrier properties of the passive layer of ferrite-pearlite microstructure are determined to be superior to the one on ferrite-martensite.
Author Contributions
Conceptualization, A.Y. and Y.G.-G.; methodology, A.Y. and Y.G.-G.; formal analysis, C.O. and A.Y.; investigation, C.O.; resources, J.S. and Y.G.-G.; writing—original draft preparation, C.O. and A.Y.; writing—review and editing, A.Y., J.S. and Y.G.-G.; supervision, J.S. and Y.G.-G. project administration, J.S. and Y.G.-G.; funding acquisition, J.S. and Y.G.-G. All authors have read and agreed to the published version of the manuscript.
Funding
This research was carried out under project number F41.3.14546a in the framework of the Partnership Program of the Materials innovation institute M2i (www.m2i.nl) and the foundation for fundamental research on matter (FOM), which is part of the Netherlands Organisation for scientific research, NWO (www.nwo.nl).
Institutional Review Board Statement
Not applicable.
Informed Consent Statement
Not applicable.
Data Availability Statement
The data presented in this study are available on request from the corresponding author.
Conflicts of Interest
The authors declare no conflict of interest.
References
- Sietsma, J. Physical modelling the microstructure formation in advanced high-strength steels. Mater. Sci. Forum 2013, 762, 194–209. [Google Scholar] [CrossRef]
- Kalhor, A.; Soleimani, M.; Mirzadeh, H.; Uthaisangsuk, V. A review of recent progress in mechanical and corrosion properties of dual phase steels. Arch. Civ. Mech. Eng. 2020, 20, 85. [Google Scholar] [CrossRef]
- Astafurova, E.G.; Zakharova, G.G.; Naydenkin, E.V.; Raab, G.I.; Dobatkin, S. V Structure and mechanical properties of low-carbon ferrite-pearlite steel after severe plastic deformation and subsequent high-temperature annealing. Phys. Mesomech. 2011, 14, 195–203. [Google Scholar] [CrossRef]
- Fushimi, K.; Nakagawa, R.; Kitagawa, Y.; Hasegawa, Y. Micro- and Nano-Scopic Aspects of Passive Surface on Pearlite Structure of Carbon Steel in pH 8.4 Boric Acid-Borate Buffer. J. Electrochem. Soc. 2019, 166, C3409–C3416. [Google Scholar] [CrossRef]
- Yanagisawa, K.; Nakanishi, T.; Hasegawa, Y.; Fushimi, K. Passivity of dual-phase carbon steel with ferrite and martensite phases in pH 8.4 boric acid-borate buffer solution. J. Electrochem. Soc. 2015, 162, C322–C326. [Google Scholar] [CrossRef] [Green Version]
- Takabatake, Y.; Kitagawa, Y.; Nakanishi, T.; Hasegawa, Y.; Fushimi, K. Grain Dependency of a Passive Film Formed on Polycrystalline Iron in {pH} 8.4 Borate Solution. J. Electrochem. Soc. 2017, 164, C349–C355. [Google Scholar] [CrossRef]
- Macdonald, D.D. PassivityÐthe key to our metals-based civilization. Pure Appl. Chem 1999, 71, 951–978. [Google Scholar] [CrossRef]
- Burstein, G.T.; Davenport, A.J. The Current-Time Relationship during Anodic Oxide Film Growth under High Electric Field. J. Electrochem. Soc. 1989, 136, 936–941. [Google Scholar] [CrossRef]
- Yamamoto, T.; Fushimi, K.; Miura, S.; Konno, H. Influence of Substrate Dislocation on Passivation of Pure Iron in pH 8.4 Borate Buffer Solution. J. Electrochem. Soc. 2010, 157, 231–237. [Google Scholar] [CrossRef]
- Freire, L.; Nóvoa, X.R.; Montemor, M.F.; Carmezim, M.J. Study of passive films formed on mild steel in alkaline media by the application of anodic potentials. Mater. Chem. Phys. 2009, 114, 962–972. [Google Scholar] [CrossRef]
- Joiret, S.; Keddam, M.; Nóvoa, X.R.; Pérez, M.C.; Rangel, C.; Takenouti, H. Use of EIS, ring-disk electrode, EQCM and Raman spectroscopy to study the film of oxides formed on iron in 1 M NaOH. Cem. Concr. Compos. 2002, 24, 7–15. [Google Scholar] [CrossRef]
- Hsu, C.H.; Mansfeld, F. Concernng the conversion of the constant phase element parameter Y0 into a capacitance. Corrosion 2001, 57, 747–748. [Google Scholar] [CrossRef]
- Bard, A.J.; Faulkner, L.R. Electrochemical Methods: Fundamentals and Applications, 2nd ed.; John Wiley & Sons: Hoboken, NJ, USA, 2001. [Google Scholar]
- Azumi, K. Mott-Schottky Plot of the Passive Film Formed on Iron in Neutral Borate and Phosphate Solutions. J. Electrochem. Soc. 1987, 134, 1352. [Google Scholar] [CrossRef]
- Azumi, K.; Ohtsuka, T.; Sato, N. Impedance of Iron Electrode Passivated in Borate and Phosphate Solutions. Trans. Jpn. Inst. Met. 1986, 27, 382–392. [Google Scholar] [CrossRef] [Green Version]
- Kennedy, J.H.; Frese, K.W. Flatband Potentials and Donor Densities of Polycrystalline α-Fe2O3 Determined from Mott-Schottky Plots. J. Electrochem. Soc. 1978, 125, 723–726. [Google Scholar] [CrossRef]
- Wielant, J.; Goossens, V.; Hausbrand, R.; Terryn, H. Electronic properties of thermally formed thin iron oxide films. Electrochim. Acta 2007, 52, 7617–7625. [Google Scholar] [CrossRef]
- Hamadou, L.; Kadri, A.; Benbrahim, N. Characterisation of passive films formed on low carbon steel in borate buffer solution (pH 9.2) by electrochemical impedance spectroscopy. Appl. Surf. Sci. 2005, 252, 1510–1519. [Google Scholar] [CrossRef]
- Schmuki, P.; Böhni, H. Illumination effects on the stability of the passive film on iron. Electrochim. Acta 1995, 40, 775–783. [Google Scholar] [CrossRef]
- Schottky, W. Halbleitertheorie der Sperrschicht. Naturwissenschaften 1938, 26, 843. [Google Scholar] [CrossRef]
- Yilmaz, A.; Li, X.; Pletincx, S.; Hauffman, T.; Sietsma, J.; Gonzalez-Garcia, Y. Effect of microstructural defects on passive layer properties of interstitial free (IF) ferritic steels in alkaline environment. Corros. Sci. 2021, 182, 109271. [Google Scholar] [CrossRef]
- Wang, J.; Wang, Z.; Huang, B.; Ma, Y.; Liu, Y.; Qin, X.; Zhang, X.; Dai, Y. Oxygen vacancy induced band-gap narrowing and enhanced visible light photocatalytic activity of ZnO. ACS Appl. Mater. Interfaces 2012, 4, 4024–4030. [Google Scholar] [CrossRef] [PubMed]
- Takabatake, Y.; Fushimi, K.; Nakanishi, T.; Hasegawa, Y. Grain-Dependent Passivation of Iron in Sulfuric Acid Solution. J. Electrochem. Soc. 2014, 161, C594–C600. [Google Scholar] [CrossRef] [Green Version]
- Takabatake, Y.; Kitagawa, Y.; Nakanishi, T.; Hasegawa, Y.; Fushimi, K. Heterogeneity of a Thermal Oxide Film Formed on Polycrystalline Iron Observed by Two-Dimensional Ellipsometry. J. Electrochem. Soc. 2016, 163, C815–C822. [Google Scholar] [CrossRef]
- Cornell, R.M.; Schwertmann, U. The Iron Oxides: Structure Properties, Reactions, Occurrences and Uses; John Wiley & Sons: Hoboken, NJ, USA, 2003; ISBN 3527302743. [Google Scholar]
- Moon, A.P.; Sangal, S.; Layek, S.; Giribaskar, S.; Mondal, K. Corrosion Behavior of High-Strength Bainitic Rail Steels. Metall. Mater. Trans. A 2015, 46, 1500–1518. [Google Scholar] [CrossRef]
Figure 1.
Graphical summary of the heat treatments applied to obtain the different microstructures.

Figure 2.
Optical and SEM micrographs of the samples after the heat treatments: (a) FM microstructure, (b) FP microstructure, (c) detail of the martensite phase, (d) detail of the pearlite phase. In (c) and (d), the darker phase is ferrite.
Figure 2.
Optical and SEM micrographs of the samples after the heat treatments: (a) FM microstructure, (b) FP microstructure, (c) detail of the martensite phase, (d) detail of the pearlite phase. In (c) and (d), the darker phase is ferrite.

Figure 3.
Double logarithmic time-current density plots of dual-phase steels during potentiostatic polarisation at 0.2 V (vs. Ag/AgCl) in 0.1 M NaOH solution.
Figure 3.
Double logarithmic time-current density plots of dual-phase steels during potentiostatic polarisation at 0.2 V (vs. Ag/AgCl) in 0.1 M NaOH solution.

Figure 4.
Nyquist (a) and Bode (b) plots of dual phase microstructures obtained with EIS experiments in 0.1 M NaOH solution. Samples were pre-passivated by potentiostatic polarisation at 0.2 V (vs. Ag/AgCl) for 6 h in 0.1 M NaOH solution.
Figure 4.
Nyquist (a) and Bode (b) plots of dual phase microstructures obtained with EIS experiments in 0.1 M NaOH solution. Samples were pre-passivated by potentiostatic polarisation at 0.2 V (vs. Ag/AgCl) for 6 h in 0.1 M NaOH solution.

Figure 5.
Equivalent circuit proposed for modelling the EIS electrochemical response of dual-phase microstructures.
Figure 5.
Equivalent circuit proposed for modelling the EIS electrochemical response of dual-phase microstructures.

Figure 6.
Mott–Schottky plots for the passive film formed on different microstructures for 6 h at 0.2 V (vs. Ag/AgCl) in 0.1 M NaOH solution at a frequency of 1 kHz.
Figure 6.
Mott–Schottky plots for the passive film formed on different microstructures for 6 h at 0.2 V (vs. Ag/AgCl) in 0.1 M NaOH solution at a frequency of 1 kHz.


Table 1.
Chemical composition (wt.%) of dual-phase steel.
| Element | Fe | C | Si | Mn | P | S | Al | Cr | Cu | Mo | Ni | Sn | Ti | Ca | V |
|---|---|---|---|---|---|---|---|---|---|---|---|---|---|---|---|
| wt.% | 96.92 | 0.141 | 0.051 | 2.149 | 0.013 | 0.014 | 0.041 | 0.576 | 0.012 | 0.004 | 0.021 | 0.001 | 0.032 | 0.022 | 0.007 |
Table 2.
Critical temperatures for the heat treatments of the steel samples, determined by dilatometry.
Table 2.
Critical temperatures for the heat treatments of the steel samples, determined by dilatometry.
| Temperatures | Ac1 | Ac3 | Ms | Mf |
|---|---|---|---|---|
| °C | 720 | 840 | 400 | 140 |
Table 3.
The fitting values of the equivalent circuit components for FM and FP microstructures.
| Sample | Rs (Ωcm2) | R1 (Ωcm2) | C1 (Fcm−2 × 10⁻⁵) | CPE1-Q (Ω−1 sncm2 × 10−5) | CPE1-n | R2 (Ωcm2 × 105) | C2 (Fcm−2 × 10⁻⁵) | CPE2-Q (Ω−1 sncm2 × 10−5) | CPE2-n | Chi-Squared (× 10−4) |
|---|---|---|---|---|---|---|---|---|---|---|
| FM | 13.2 ± 1.5 | 85 ± 30 | 13.1 ± 0.7 | 2.3 ± 1.2 | 0.87 ± 0.04 | 2.02 ± 0.12 | 3.2 ± 0.5 | 2.2 ± 0.5 | 0.82 ± 0.03 | 3 ± 2 |
| FP | 15 ± 2 | 250 ± 110 | 1.3 ± 0.5 | 1.91 ± 0.13 | 0.85 ± 0.02 | 11.0 ± 1.5 | 1.3 ± 0.4 | 1.1 ± 0.4 | 0.88 ± 0.08 | 4 ± 2 |
Publisher’s Note: MDPI stays neutral with regard to jurisdictional claims in published maps and institutional affiliations. |
© 2021 by the authors. Licensee MDPI, Basel, Switzerland. This article is an open access article distributed under the terms and conditions of the Creative Commons Attribution (CC BY) license (https://creativecommons.org/licenses/by/4.0/).
Share and Cite
MDPI and ACS Style
Yilmaz, A.; Ozkan, C.; Sietsma, J.; Gonzalez-Garcia, Y. Properties of Passive Films Formed on Ferrite-Martensite and Ferrite-Pearlite Steel Microstructures. Metals 2021, 11, 594. https://doi.org/10.3390/met11040594
AMA Style
Yilmaz A, Ozkan C, Sietsma J, Gonzalez-Garcia Y. Properties of Passive Films Formed on Ferrite-Martensite and Ferrite-Pearlite Steel Microstructures. Metals. 2021; 11(4):594. https://doi.org/10.3390/met11040594
Chicago/Turabian StyleYilmaz, Aytac, Can Ozkan, Jilt Sietsma, and Yaiza Gonzalez-Garcia. 2021. "Properties of Passive Films Formed on Ferrite-Martensite and Ferrite-Pearlite Steel Microstructures" Metals 11, no. 4: 594. https://doi.org/10.3390/met11040594
Note that from the first issue of 2016, this journal uses article numbers instead of page numbers. See further details here.