
Thirty-Year Dynamics of LULC at the Dong Thap Muoi Area, Southern Vietnam, Using Google Earth Engine

 and
and
Abstract
:1. Introduction
2. Study Area and Data
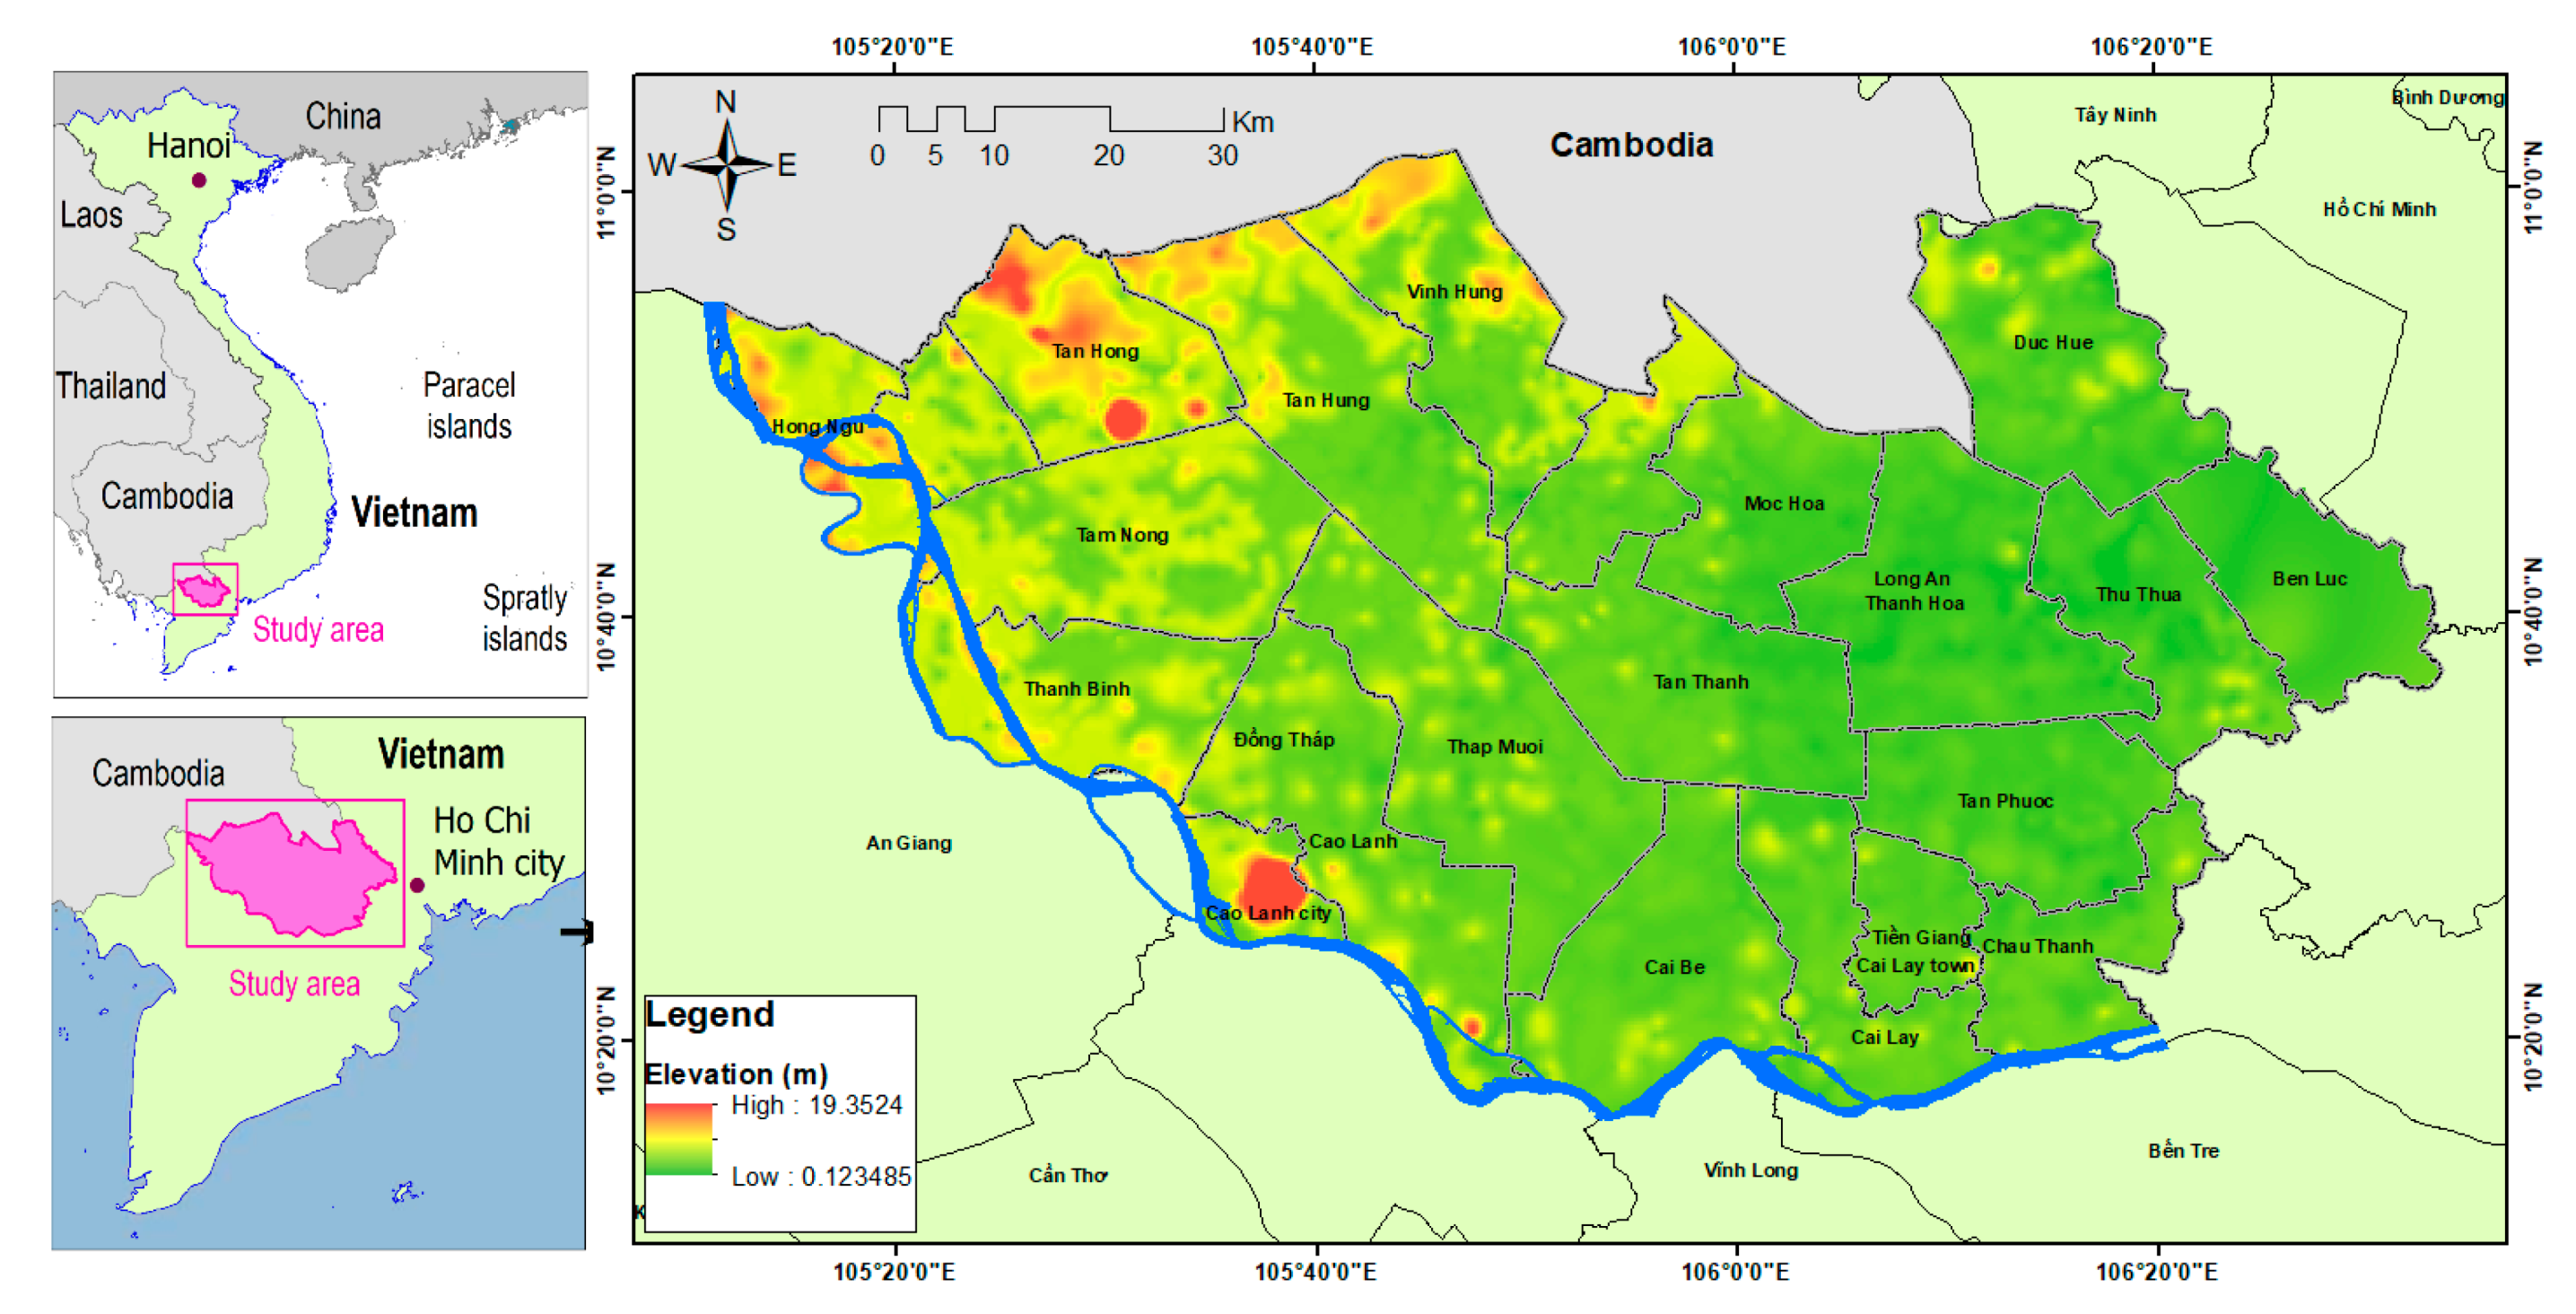
2.1. Study Area
2.2. Remote Sensing Images, Ancillary Maps, and Fieldwork Data
3. Research Methodology
3.1. Image Pre-Processing
3.2. Determination of the LULC Classes, Training and Validation of Samples
3.3. Landsat Image Classification and Accuracy Assessment
3.4. LULC Change Assessment
4. Results and Analysis
4.1. LULC Classification and Accuracy
4.2. LULC Estimation
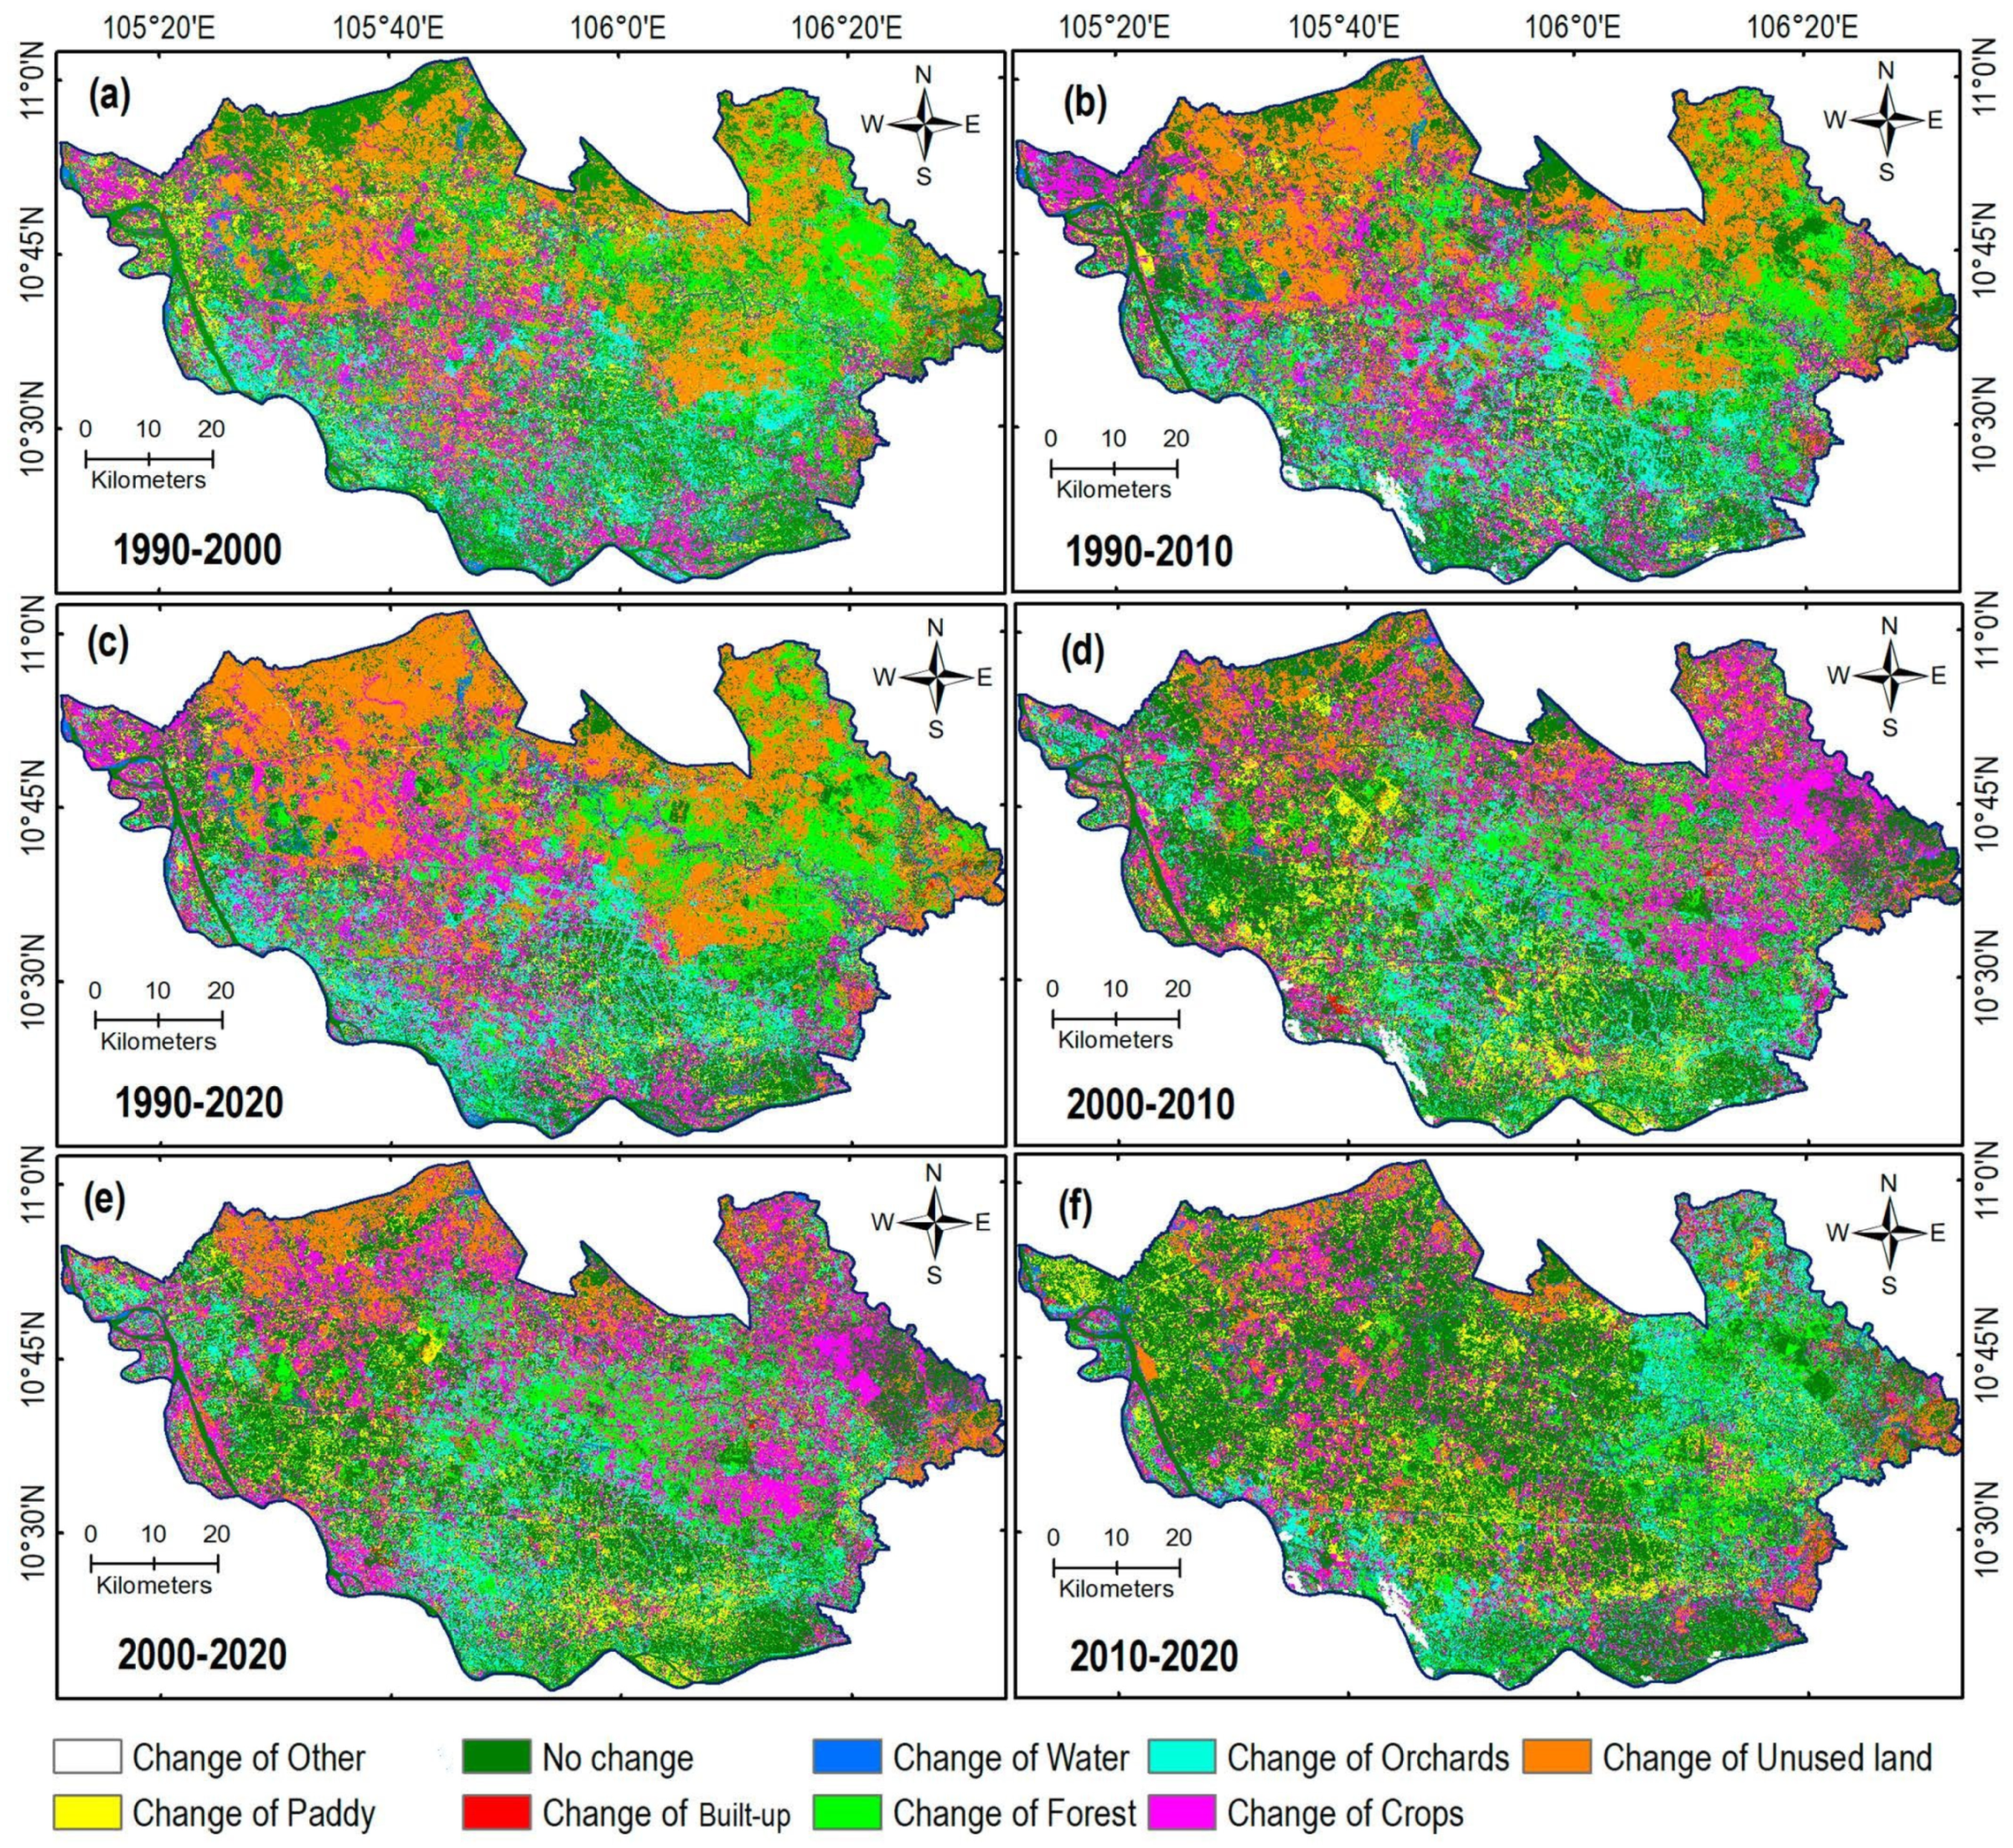
4.3. LULC Evolution Analysis
5. Discussion
5.1. Accuracy of the LULC Classification
5.2. LULC Changes
5.3. Potential Driving Forces for the LULC Changes
6. Concluding Remarks
- ▪
- The paddy, built-up, water body, forest, orchard, crops, and unused land classes are the main LULC classes in the Dong Thap Muoi area;
- ▪
- During the last 30 years, from 1990 to 2020, the paddy and built-up areas have increased greatly, whereas the forest and unused land areas have been significantly reduced. The paddy areas were transformed mainly from unused land areas;
- ▪
- The LULC analysis results from this study may help the authorities design exploitation policies for the socioeconomic development of the Dong Thap Muoi area in the future;
- ▪
- Google Earth Engine is a powerful tool for LULC classification;
- ▪
- Future extensions of this research should focus on assessing the effects of the LULC changes in flood hazards and natural ecosystems in the Dong Thap Muoi area.
Author Contributions
Funding
Data Availability Statement
Acknowledgments
Conflicts of Interest
References
- Kuenzer, C.; Ottinger, M.; Liu, G.; Sun, B.; Baumhauer, R.; Dech, S. Earth observation-based coastal zone monitoring of the yellow river delta: Dynamics in China’s second largest oil producing region over four decades. Appl. Geogr. 2014, 55, 92–107. [Google Scholar] [CrossRef]
- Spruce, J.; Bolten, J.; Mohammed, I.N.; Srinivasan, R.; Lakshmi, V. Mapping land use land cover change in the lower mekong basin from 1997 to 2010. Front. Environ. Sci. 2020, 8, 21. [Google Scholar] [CrossRef] [Green Version]
- Sleeter, B.M.; Liu, J.; Daniel, C.; Rayfield, B.; Sherba, J.; Hawbaker, T.J.; Zhu, Z.; Selmants, P.C.; Loveland, T.R. Effects of contemporary land-use and land-cover change on the carbon balance of terrestrial ecosystems in the United States. Environ. Res. Lett. 2018, 13, 045006. [Google Scholar] [CrossRef]
- Tran, D.X.; Pla, F.; Latorre-Carmona, P.; Myint, S.W.; Caetano, M.; Kieu, H.V. Characterizing the relationship between land use land cover change and land surface temperature. ISPRS J. Photogramm. Remote Sens. 2017, 124, 119–132. [Google Scholar] [CrossRef] [Green Version]
- Findell, K.L.; Berg, A.; Gentine, P.; Krasting, J.P.; Lintner, B.R.; Malyshev, S.; Santanello, J.A.; Shevliakova, E. The impact of anthropogenic land use and land cover change on regional climate extremes. Nat. Commun. 2017, 8, 989. [Google Scholar] [CrossRef] [PubMed]
- Safaei, M.; Bashari, H.; Mosaddeghi, M.R.; Jafari, R. Assessing the impacts of land use and land cover changes on soil functions using landscape function analysis and soil quality indicators in semi-arid natural ecosystems. Catena 2019, 177, 260–271. [Google Scholar] [CrossRef]
- Garg, V.; Aggarwal, S.; Gupta, P.K.; Nikam, B.R.; Thakur, P.K.; Srivastav, S.; Kumar, A.S. Assessment of land use land cover change impact on hydrological regime of a basin. Environ. Earth Sci. 2017, 76, 635. [Google Scholar] [CrossRef]
- Zope, P.; Eldho, T.; Jothiprakash, V. Impacts of land use–land cover change and urbanization on flooding: A case study of oshiwara river Basin in Mumbai, India. Catena 2016, 145, 142–154. [Google Scholar] [CrossRef]
- Zope, P.; Eldho, T.; Jothiprakash, V. Hydrological impacts of land use–land cover change and detention basins on urban flood hazard: A case study of Poisar River basin, Mumbai, India. Nat. Hazards 2017, 87, 1267–1283. [Google Scholar] [CrossRef]
- Gómez-Aíza, L.; Martínez-Ballesté, A.; Álvarez-Balderas, L.; Lombardero-Goldaracena, A.; García-Meneses, P.M.; Caso-Chávez, M.; Conde-Álvarez, C. Can wildlife management units reduce land use/land cover change and climate change vulnerability? Conditions to encourage this capacity in Mexican municipalities. Land Use Policy 2017, 64, 317–326. [Google Scholar] [CrossRef]
- Hasan, M.H.; Hossain, M.J.; Chowdhury, M.A.; Billah, M. Salinity intrusion in southwest coastal Bangladesh: An insight from land use change. In Water, Flood Management and Water Security under a Changing Climate; Springer: Berlin/Heidelberg, Germany, 2020; pp. 125–140. [Google Scholar]
- Tadese, M.; Kumar, L.; Koech, R.; Kogo, B.K. Mapping of land-use/land-cover changes and its dynamics in Awash River Basin using remote sensing and GIS. Remote Sens. Appl. Soc. Environ. 2020, 19, 100352. [Google Scholar]
- Li, J.; Wang, Z.; Lai, C.; Wu, X.; Zeng, Z.; Chen, X.; Lian, Y. Response of net primary production to land use and land cover change in mainland China since the late 1980s. Sci. Total Environ. 2018, 639, 237–247. [Google Scholar] [CrossRef]
- Li, X.; Chen, D.; Duan, Y.; Ji, H.; Zhang, L.; Chai, Q.; Hu, X. Understanding land use/land cover dynamics and impacts of human activities in the Mekong Delta over the last 40 years. Glob. Ecol. Conserv. 2020, 22, e00991. [Google Scholar] [CrossRef]
- Tran, H.; Tran, T.; Kervyn, M. Dynamics of land cover/land use changes in the Mekong Delta, 1973–2011: A remote sensing analysis of the Tran Van Thoi District, Ca Mau Province, Vietnam. Remote Sens. 2015, 7, 2899–2925. [Google Scholar] [CrossRef] [Green Version]
- Paik, S.; Le, D.T.P.; Nhu, L.T.; Mills, B.F. Salt-tolerant rice variety adoption in the Mekong River Delta: Farmer adaptation to sea-level rise. PLoS ONE 2020, 15, e0229464. [Google Scholar] [CrossRef]
- My, N.H.; Demont, M.; Verbeke, W. Inclusiveness of consumer access to food safety: Evidence from certified rice in Vietnam. Glob. Food Secur. 2021, 28, 100491. [Google Scholar] [CrossRef]
- Ngo, K.D.; Lechner, A.M.; Vu, T.T. Land cover mapping of the Mekong Delta to support natural resource management with multi-temporal Sentinel-1A synthetic aperture radar imagery. Remote Sens. Appl. Soc. Environ. 2020, 17, 100272. [Google Scholar] [CrossRef]
- Sakamoto, T.; Van Phung, C.; Kotera, A.; Nguyen, K.D.; Yokozawa, M. Analysis of rapid expansion of inland aquaculture and triple rice-cropping areas in a coastal area of the Vietnamese Mekong Delta using MODIS time-series imagery. Landsc. Urban Plan. 2009, 92, 34–46. [Google Scholar] [CrossRef]
- Hong, H.T.C.; Avtar, R.; Fujii, M. Monitoring changes in land use and distribution of mangroves in the southeastern part of the Mekong River Delta, Vietnam. Trop. Ecol. 2019, 60, 552–565. [Google Scholar] [CrossRef]
- Binh, T.; Vromant, N.; Hung, N.T.; Hens, L.; Boon, E. Land cover changes between 1968 and 2003 in Cai Nuoc, Ca Mau peninsula, Vietnam. Environ. Dev. Sustain. 2005, 7, 519–536. [Google Scholar] [CrossRef]
- Nguyen, H.H.; Dargusch, P.; Moss, P.; Aziz, A.A. Land-use change and socio-ecological drivers of wetland conversion in Ha Tien Plain, Mekong Delta, Vietnam. Land Use Policy 2017, 64, 101–113. [Google Scholar] [CrossRef]
- Veettil, B.K.; Quang, N.X.; Trang, N.T.T. Changes in mangrove vegetation, aquaculture and paddy cultivation in the Mekong Delta: A study from Ben Tre Province, southern Vietnam. Estuar. Coast. Shelf Sci. 2019, 226, 106273. [Google Scholar] [CrossRef]
- Sakamoto, T.; Van Nguyen, N.; Ohno, H.; Ishitsuka, N.; Yokozawa, M. Spatio–temporal distribution of rice phenology and cropping systems in the Mekong Delta with special reference to the seasonal water flow of the Mekong and Bassac rivers. Remote Sens. Environ. 2006, 100, 1–16. [Google Scholar] [CrossRef]
- Le, T.N.; Bregt, A.K.; van Halsema, G.E.; Hellegers, P.J.; Nguyen, L.-D. Interplay between land-use dynamics and changes in hydrological regime in the Vietnamese Mekong Delta. Land Use Policy 2018, 73, 269–280. [Google Scholar] [CrossRef] [Green Version]
- Van, C.T.; Tuyet, N.T.; An, N.V.; Phung, L.V.; Huy, N.P.; Hong, N.M.; Ngoc, N.Q. Assessment of the change of water surface flow in feature points in the Dong Thap Muoi. J. Meteorol. Hydrol. 2018, 8, 1–7. [Google Scholar]
- Hien, M. Links for Sustainable Development of Dong Thap Muoi Sub-Region Online Newspaper of the Goverment of Vietnam. 2017. Available online: http://baochinhphu.vn/Hoat-dong-dia-phuong/Lien-ket-phat-trien-ben-vung-Tieu-vung-Dong-Thap-Muoi/304602.vgp (accessed on 25 September 2020).
- Nghia, S. Dong Thap Muoi Exploit. Available online: https://vietnam.vnanet.vn/english/dong-thap-muoi-exploit/200646.html (accessed on 25 September 2020).
- MohanRajan, S.N.; Loganathan, A.; Manoharan, P. Survey on land use/land cover (LU/LC) change analysis in remote sensing and GIS environment: Techniques and challenges. Environ. Sci. Pollut. Res. 2020, 27, 29900–29926. [Google Scholar] [CrossRef]
- Zou, Q.; Li, G.; Yu, W. MapReduce functions to remote sensing distributed data processing—Global vegetation drought monitoring as example. Softw. Pract. Exp. 2018, 48, 1352–1367. [Google Scholar] [CrossRef]
- Mutanga, O.; Kumar, L. Google Earth Engine Applications. Remote Sens. 2019, 11, 591. [Google Scholar] [CrossRef] [Green Version]
- Rizvi, S.R.; Killough, B.; Cherry, A.; Gowda, S. Lessons learned and cost analysis of hosting a full stack Open Data Cube (ODC) application on the Amazon Web Services (AWS). In Proceedings of the 2018 IEEE International Geoscience and Remote Sensing Symposium, Valencin, Spain, 22–27 July 2018; pp. 8643–8646. [Google Scholar]
- Dong, J.; Metternicht, G.; Hostert, P.; Fensholt, R.; Chowdhury, R.R. Remote sensing and geospatial technologies in support of a normative land system science: Status and prospects. Curr. Opin. Environ. Sustain. 2019, 38, 44–52. [Google Scholar] [CrossRef]
- Lewis, A.; Oliver, S.; Lymburner, L.; Evans, B.; Wyborn, L.; Mueller, N.; Raevksi, G.; Hooke, J.; Woodcock, R.; Sixsmith, J. The Australian geoscience data cube—Foundations and lessons learned. Remote Sens. Environ. 2017, 202, 276–292. [Google Scholar] [CrossRef]
- Ghorbanian, A.; Kakooei, M.; Amani, M.; Mahdavi, S.; Mohammadzadeh, A.; Hasanlou, M. Improved land cover map of Iran using Sentinel imagery within Google Earth Engine and a novel automatic workflow for land cover classification using migrated training samples. ISPRS J. Photogramm. Remote Sens. 2020, 167, 276–288. [Google Scholar] [CrossRef]
- Hoc, D.X. Study on Flood Drainage and Socio-Economic and Environmental Issues for Sustainable Development in Dong Thap Muoi region; Thuyloi University, Ho Chi Minh city Campus: Ho Chi Minh City, Vietnam, 2004. [Google Scholar]
- Nguyen, N.A. Historic drought and salinity intrusion in the Mekong Delta in 2016: Lessons learned and response solutions. Vietnam J. Sci. Technol. Eng. 2017, 59, 93–96. [Google Scholar] [CrossRef]
- Yen, B.T.; Son, N.H.; Amjath-Babu, T.; Sebastian, L. Development of a participatory approach for mapping climate risks and adaptive interventions (CS-MAP) in Vietnam’s Mekong River Delta. Clim. Risk Manag. 2019, 24, 59–70. [Google Scholar] [CrossRef]
- Shrestha, S.; Bach, T.V.; Pandey, V.P. Climate change impacts on groundwater resources in Mekong Delta under representative concentration pathways (RCPs) scenarios. Environ. Sci. Policy 2016, 61, 1–13. [Google Scholar] [CrossRef]
- MONRE. Technical Regulation on the Structure Model and Content of the National Spatial Data Infrastructure of the Vietnam Scales 1: 10,000 and 1: 25,000; Ministry of Natural Resources and Environment Hanoi: Hanoi, Vietnam, 2020.
- Tien Bui, D.; Tran, C.T.; Pradhan, B.; Revhaug, I.; Seidu, R. iGeoTrans—A novel iOS application for GPS positioning in geosciences. Geocarto Int. 2015, 30, 202–217. [Google Scholar] [CrossRef]
- Jensen, J. Introductory Digital Image Processing: A Remote Sensing Perspective, 4th ed.; Pearson: Glenview, IL, USA, 2015. [Google Scholar]
- Claverie, M.; Ju, J.; Masek, J.G.; Dungan, J.L.; Vermote, E.F.; Roger, J.-C.; Skakun, S.V.; Justice, C. The harmonized landsat and sentinel-2 surface reflectance data set. Remote Sens. Environ. 2018, 219, 145–161. [Google Scholar] [CrossRef]
- Li, H.; Wan, W.; Fang, Y.; Zhu, S.; Chen, X.; Liu, B.; Hong, Y. A google earth engine-enabled software for efficiently generating high-quality user-ready landsat mosaic images. Environ. Model. Softw. 2019, 112, 16–22. [Google Scholar] [CrossRef]
- Vo, Q.T.; Oppelt, N.; Leinenkugel, P.; Kuenzer, C. Remote sensing in mapping mangrove ecosystems—An object-based approach. Remote Sens. 2013, 5, 183–201. [Google Scholar] [CrossRef] [Green Version]
- Thi, H.P.; Quoc, D.N.; Hoai, T.T.T.; Le Thi, N. Determination of the relationship between Vietnam national coordinate reference system (VN-2000) and ITRS, WGS84 and PZ-90. In Proceedings of the E3S Web of Conferences, Bali, Indonesia, 21–23 November 2018; p. 03014. [Google Scholar]
- Liu, C.; Frazier, P.; Kumar, L. Comparative assessment of the measures of thematic classification accuracy. Remote Sens. Environ. 2007, 107, 606–616. [Google Scholar] [CrossRef]
- Hoa, N.T.P. Circular of the Regulation on Economic and Technical Levels of the Landuse Statistics and Landuse Status Mapping; Ministry of Natural Resources and Environment: Hanoi, Vietnam, 2019.
- FAO. Land Cover Classification System: Classification Concepts and User Manual. Software Version 2 (Environment and Natural Resources Management Series); Food and Agriculture Organization of the United Nations: Rome, Italy, 2008. [Google Scholar]
- Homer, C.H.; Fry, J.A.; Barnes, C.A. The national land cover database. USA Geol. Surv. Fact Sheet 2012, 3020, 1–4. [Google Scholar]
- Fortier, J.; Rogan, J.; Woodcock, C.E.; Runfola, D.M. Utilizing temporally invariant calibration sites to classify multiple dates and types of satellite imagery. Photogramm. Eng. Remote Sens. 2011, 77, 181–189. [Google Scholar] [CrossRef]
- Zhou, W.; Cao, F. Effects of changing spatial extent on the relationship between urban forest patterns and land surface temperature. Ecol. Indic. 2020, 109, 105778. [Google Scholar] [CrossRef]
- Rodriguez-Galiano, V.F.; Ghimire, B.; Rogan, J.; Chica-Olmo, M.; Rigol-Sanchez, J.P. An assessment of the effectiveness of a random forest classifier for land-cover classification. ISPRS J. Photogramm. Remote Sens. 2012, 67, 93–104. [Google Scholar] [CrossRef]
- Phalke, A.R.; Özdoğan, M.; Thenkabail, P.S.; Erickson, T.; Gorelick, N.; Yadav, K.; Congalton, R.G. Mapping croplands of Europe, middle east, russia, and central asia using landsat, random forest, and google earth engine. ISPRS J. Photogramm. Remote Sens. 2020, 167, 104–122. [Google Scholar] [CrossRef]
- Zeferino, L.B.; de Souza, L.F.T.; do Amaral, C.H.; Fernandes Filho, E.I.; de Oliveira, T.S. Does environmental data increase the accuracy of land use and land cover classification? Int. J. Appl. Earth Obs. Geoinf. 2020, 91, 102128. [Google Scholar] [CrossRef]
- Breiman, L. Random forests. Mach. Learn. 2001, 45, 5–32. [Google Scholar] [CrossRef] [Green Version]
- Sheykhmousa, M.; Mahdianpari, M.; Ghanbari, H.; Mohammadimanesh, F.; Ghamisi, P.; Homayouni, S. Support vector machine vs. random forest for remote sensing image classification: A meta-analysis and systematic review. IEEE J. Sel. Top. Appl. Earth Obs. Remote Sens. 2020. [Google Scholar] [CrossRef]
- Belgiu, M.; Drăguţ, L. Random forest in remote sensing: A review of applications and future directions. ISPRS J. Photogramm. Remote Sens. 2016, 114, 24–31. [Google Scholar] [CrossRef]
- Batar, A.K.; Watanabe, T.; Kumar, A. Assessment of land-use/land-cover change and forest fragmentation in the Garhwal Himalayan Region of India. Environments 2017, 4, 34. [Google Scholar] [CrossRef] [Green Version]
- Rodriguez-Galiano, V.; Chica-Olmo, M.; Abarca-Hernandez, F.; Atkinson, P.M.; Jeganathan, C. Random Forest classification of Mediterranean land cover using multi-seasonal imagery and multi-seasonal texture. Remote Sens. Environ. 2012, 121, 93–107. [Google Scholar] [CrossRef]
- Rodriguez-Galiano, V.F.; Chica-Rivas, M. Evaluation of different machine learning methods for land cover mapping of a Mediterranean area using multi-seasonal Landsat images and digital terrain models. Int. J. Digit. Earth 2014, 7, 492–509. [Google Scholar] [CrossRef]
- Chan, J.C.-W.; Paelinckx, D. Evaluation of Random Forest and Adaboost tree-based ensemble classification and spectral band selection for ecotope mapping using airborne hyperspectral imagery. Remote Sens. Environ. 2008, 112, 2999–3011. [Google Scholar] [CrossRef]
- Shirvani, Z. A holistic analysis for landslide susceptibility mapping applying geographic object-based random forest: A comparison between protected and non-protected forests. Remote Sens. 2020, 12, 434. [Google Scholar] [CrossRef] [Green Version]
- Isaac, E.; Easwarakumar, K.; Isaac, J. Urban landcover classification from multispectral image data using optimized AdaBoosted random forests. Remote Sens. Lett. 2017, 8, 350–359. [Google Scholar] [CrossRef]
- Colkesen, I.; Kavzoglu, T. Ensemble-based canonical correlation forest (CCF) for land use and land cover classification using sentinel-2 and Landsat OLI imagery. Remote Sens. Lett. 2017, 8, 1082–1091. [Google Scholar] [CrossRef]
- Foody, G.M. Explaining the unsuitability of the kappa coefficient in the assessment and comparison of the accuracy of thematic maps obtained by image classification. Remote Sens. Environ. 2020, 239, 111630. [Google Scholar] [CrossRef]
- Were, K.O.; Dick, Ø.B.; Singh, B.R. Remotely sensing the spatial and temporal land cover changes in Eastern Mau forest reserve and Lake Nakuru drainage basin, Kenya. Appl. Geogr. 2013, 41, 75–86. [Google Scholar] [CrossRef]
- GSO. Statistical Yearbook of Vietnam; General Statistics Office of Vietnam: Hanoi, Vietnam, 2019.
- Le, T.V.; Haruyama, S.; Nhan, N.H.; Cong, T.T.; Long, B.D. The historical flood in 2000 in Mekong River Delta, Vietnam: A quantitative analysis and simulation. Geogr. Rev. Jpn. 2007, 80, 663–680. [Google Scholar]
- Hoa, L.T.V.; Shigeko, H.; Nhan, N.H.; Cong, T.T. Infrastructure effects on floods in the Mekong River Delta in Vietnam. Hydrol. Process. Int. J. 2008, 22, 1359–1372. [Google Scholar] [CrossRef]
- Hai, T.N.; Phuong, N.T.; Hien, T.T.T.; Bui, T.; Son, V.N.; Wilder, M.N. Research, development and economics of seed production of giant freshwater prawn (Macrobrachium rosenbergii): A review. In Proceedings of the Final Workshop of the JIRCAS Mekong Delta Project, Cantho, Vietnam, 23–25 November 2003; pp. 298–306. [Google Scholar]
- Ministry of Agriculture and Rural Development. Regional Environmental Assessment Report on Mekong Delta Intergrated Climate Resilence and Sustainable Livelihoods Project; Ministry of Agriculture and Rural Development: Hanoi, Vietnam, 2016.
- Hung, T.V.; Le, P.T.; Tran, V.D.; Hung, N.N. Morphological and physicochemical properties of acid sulfate soils in Dong Thap Muoi. Can Tho Univ. J. Sci. 2017, 2017, 1–10. [Google Scholar]
- Boothroyd, P.; Nam, P.X. Socioeconomic Renovation in Vietnam: The Origin, Evolution, and Impact of Doi Moi; IDRC: Ottawa, ON, Canada, 2000. [Google Scholar]
- Binh, T.V.; Le Huy Ba, T.T.T.; Huong, L.N. Ecological economic assessment of the production models in different forms of dikes in Dong Thap Muoi area, Vietnam. Southeast Asian J. Sci. 2015, 4, 38–50. [Google Scholar]
- Tran, T.; James, H. Transformation of household livelihoods in adapting to the impacts of flood control schemes in the Vietnamese Mekong Delta. Water Resour. Rural Dev. 2017, 9, 67–80. [Google Scholar] [CrossRef]


| Sensor and Image | Path/Row | Acquired Date (Date/Month) | Year |
|---|---|---|---|
| Landsat-5 ETM | 125/052 | 03/01; 19/01; 04/02; 20/02; 08/03; and 09/04 | 1990 |
| (19 scenes) | 125/053 | 03/01; 19/01; 04/02; and 09/02 | 1990 |
| 126/052 | 10/01; 26/01; 27/02; and 16/04 | 1990 | |
| 126/053 | 10/01; 26/01; 27/02; 15/03; and 16/04 | 1990 | |
| Landsat-5 ETM | 125/052 | 15/01; 31/01; 16/02; 03/03; 19/03; 04/04; and 20/04 | 2000 |
| (28 scenes) | 125/053 | 15/01; 31/01; 16/02; 03/03; 19/03; 04/04; and 20/04 | 2000 |
| 126/052 | 06/01; 22/01; 07/02; 23/02; 10/3; 26/03; 11/04; and 27/04 | 2000 | |
| 126/053 | 22/01; 23/02; 10/3; 26/03; 11/04; and 27/04 | 2000 | |
| Landsat-5 ETM | 125/052 | 02/02;18/02; 06/03; 22/03; 07/04; and 23/04 | 2001 |
| (23 scenes) | 125/053 | 02/02;18/02; 06/03; 22/03; 07/04; and 23/04 | 2001 |
| 126/052 | 08/01; 24/01; 09/02; 29/03; 14/04 | 2001 | |
| 126/053 | 08/01;24/01;09/02; 13/03; 29/03; and 14/04 | 2001 | |
| Landsat-5 ETM | 125/052 | 26/01; 11/02; 27/02; and 31/03 | 2010 |
| (14 scenes) | 125/053 | 26/01; 11/02; and 27/02 | 2010 |
| 126/052 | 17/01; 02/02; and 22/03 | 2010 | |
| 126/053 | 17/02; 02/02; 18/02; and 12/03 | 2010 | |
| Landsat-5 ETM | 125/052 | 13/01; 29/01; 02/03; and 18/03 | 2011 |
| (14 scenes) | 125/053 | 29/01 and 02/03 | 2011 |
| 126/052 | 20/01; 05/02; 21/02; and 09/03 | 2011 | |
| 126/053 | 20/01;05/02; 21/02; and 09/03 | 2011 | |
| Landsat-8 OLI | 125/052 | 06/01; 22/01; 07/02; 23/02; 10/03; 26/03; 11/04; and 27/04 | 2020 |
| (30 scenes) | 125/053 | 06/01; 22/01; 07/02; 23/02; 10/03; 26/03; 11/04; and 27/04 | 2020 |
| 126/052 | 12/01; 29/01; 14/02; 01/03; 17/03; 02/04; 18/04 | 2020 | |
| 126/053 | 12/01; 29/01; 14/02; 01/03; 17/03; 02/04; 18/04 | 2020 |
| No. | Ancillary Data | Scale/Resolution | Source |
|---|---|---|---|
| 1 | Topographic maps | 1:50,000 | V-MONRE [40] |
| 2 | Land use status maps | 1:50,000 | V-MONRE [40] |
| Cadastre maps 1:2000 | 1:2000 | Local authorities | |
| 3 | ALOS DEM | 30 × 30 m | JAXA, https://www.eorc.jaxa.jp (assessed on 2 April 2020) |
| 4 | Google Earth Imagery | - | Google LLC, https://www.google.com/earth (assessed on 2 April 2020) |
| 5 | Statistical data | - | General Statistics Office of Vietnam, https://www.gso.gov.vn/ (assessed on 2 April 2020) |
| 6 | Fieldwork data for June 2020 | - | 422 samples |
| 7 | Humidity and temperature data | 1990–2019 | Cao Lanh and Moc Hoa stations |
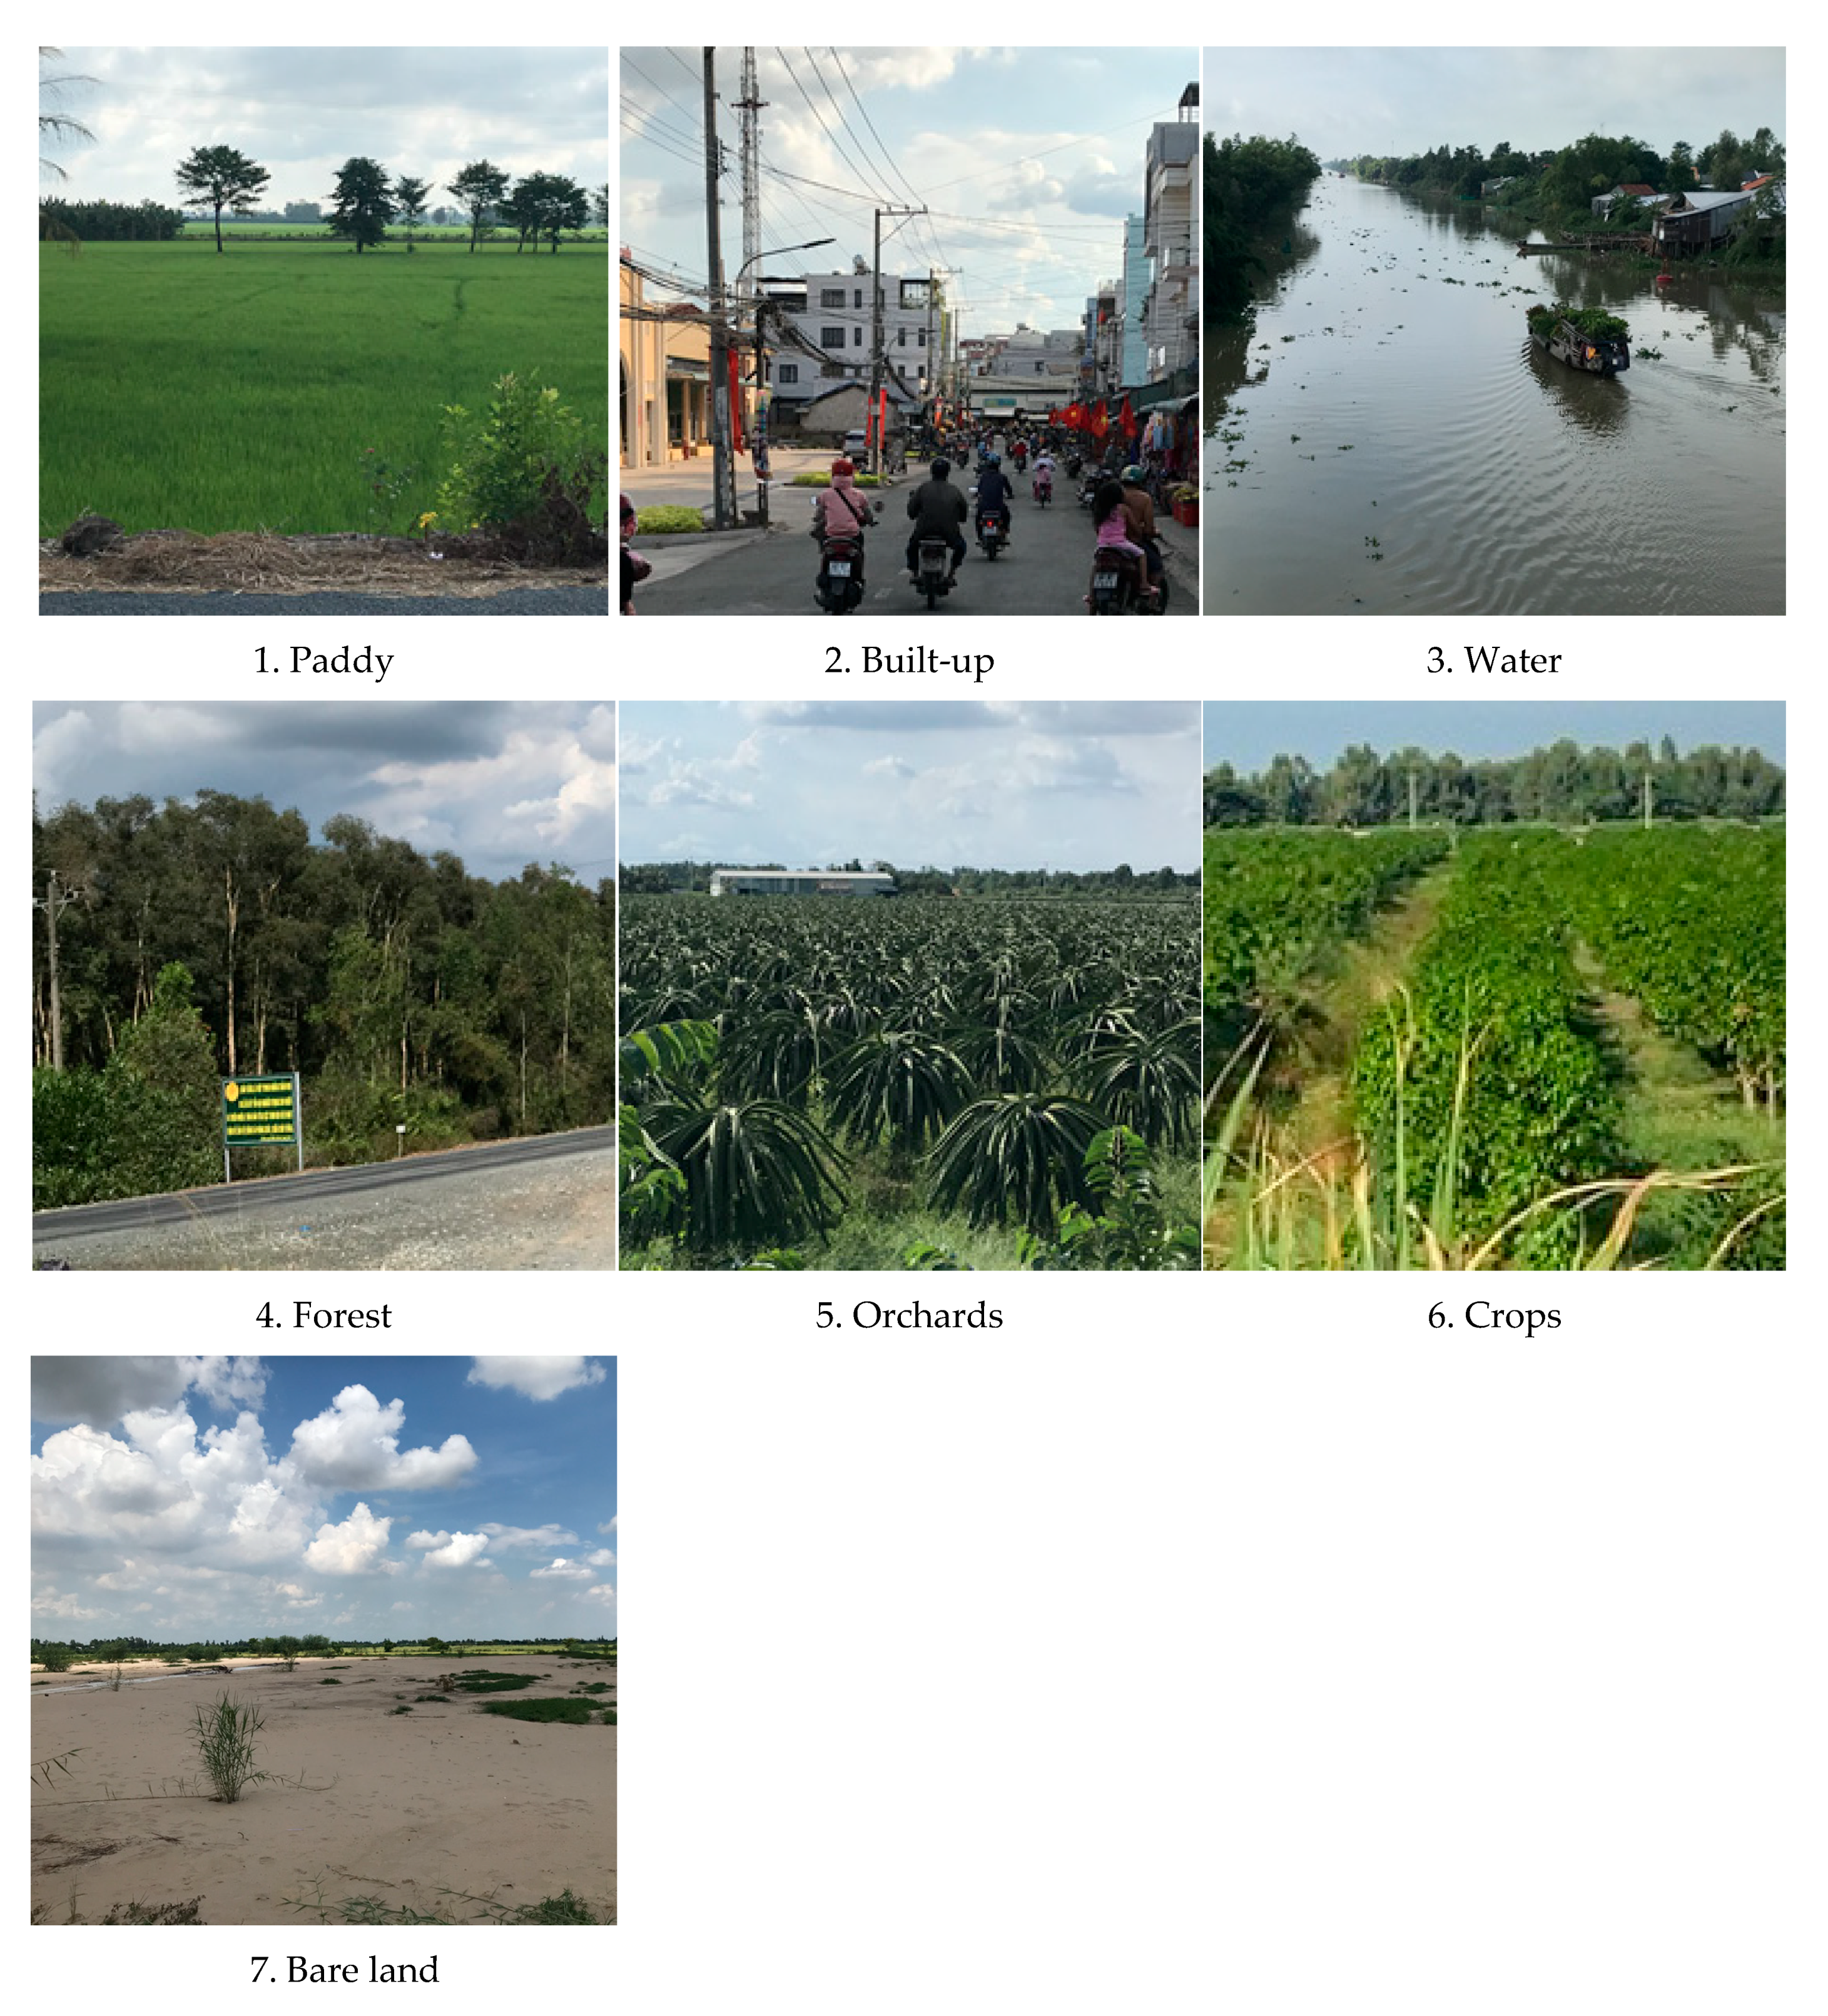
| No | LULC Classes | Description |
|---|---|---|
| 1 | Paddy | Rice crops |
| 2 | Built-up | Urban built-up areas, roads |
| 3 | Water | Rivers, streams, lakes, and canal systems |
| 4 | Forest | Productive and natural forests |
| 5 | Orchards | Gardens with orange, lemon, pomelo, and mixed fruits |
| 6 | Crops | Corn and vegetables |
| 7 | Unused Land | Uncultivated land, undeveloped land, new land |
| 8 | Others | Clouds, scrub |
| Year | Accuracy | LULC Classes | OA | Kappa Index | ||||||
|---|---|---|---|---|---|---|---|---|---|---|
| Paddy | Built-Up | Water | Forest | Orchards | Crops | Unused Land | ||||
| 1990 | Producer | 84.5 | 81.8 | 97.2 | 92.5 | 83.9 | 82.1 | 91.1 | 88.9 | 0.889 |
| User | 78.9 | 85.7 | 96.6 | 90.2 | 82.1 | 96.0 | 88.1 | |||
| 2000 | Producer | 83.0 | 70.6 | 91.5 | 90.2 | 85.8 | 77.1 | 78.1 | 83.5 | 0.835 |
| User | 86.5 | 76.6 | 91.5 | 86.5 | 79.2 | 77.1 | 80.9 | |||
| 2010 | Producer | 90.1 | 71.4 | 92.2 | 86.5 | 84.3 | 91.5 | 86.2 | 87.1 | 0.871 |
| User | 91.9 | 75.0 | 89.2 | 90.1 | 80.4 | 96.2 | 83.5 | |||
| 2020 | Producer | 87.3 | 81.1 | 90.0 | 83.3 | 94.7 | 85.0 | 65.2 | 85.6 | 0.856 |
| User | 88.0 | 82.6 | 90.8 | 87.4 | 82.4 | 89.7 | 66.7 | |||
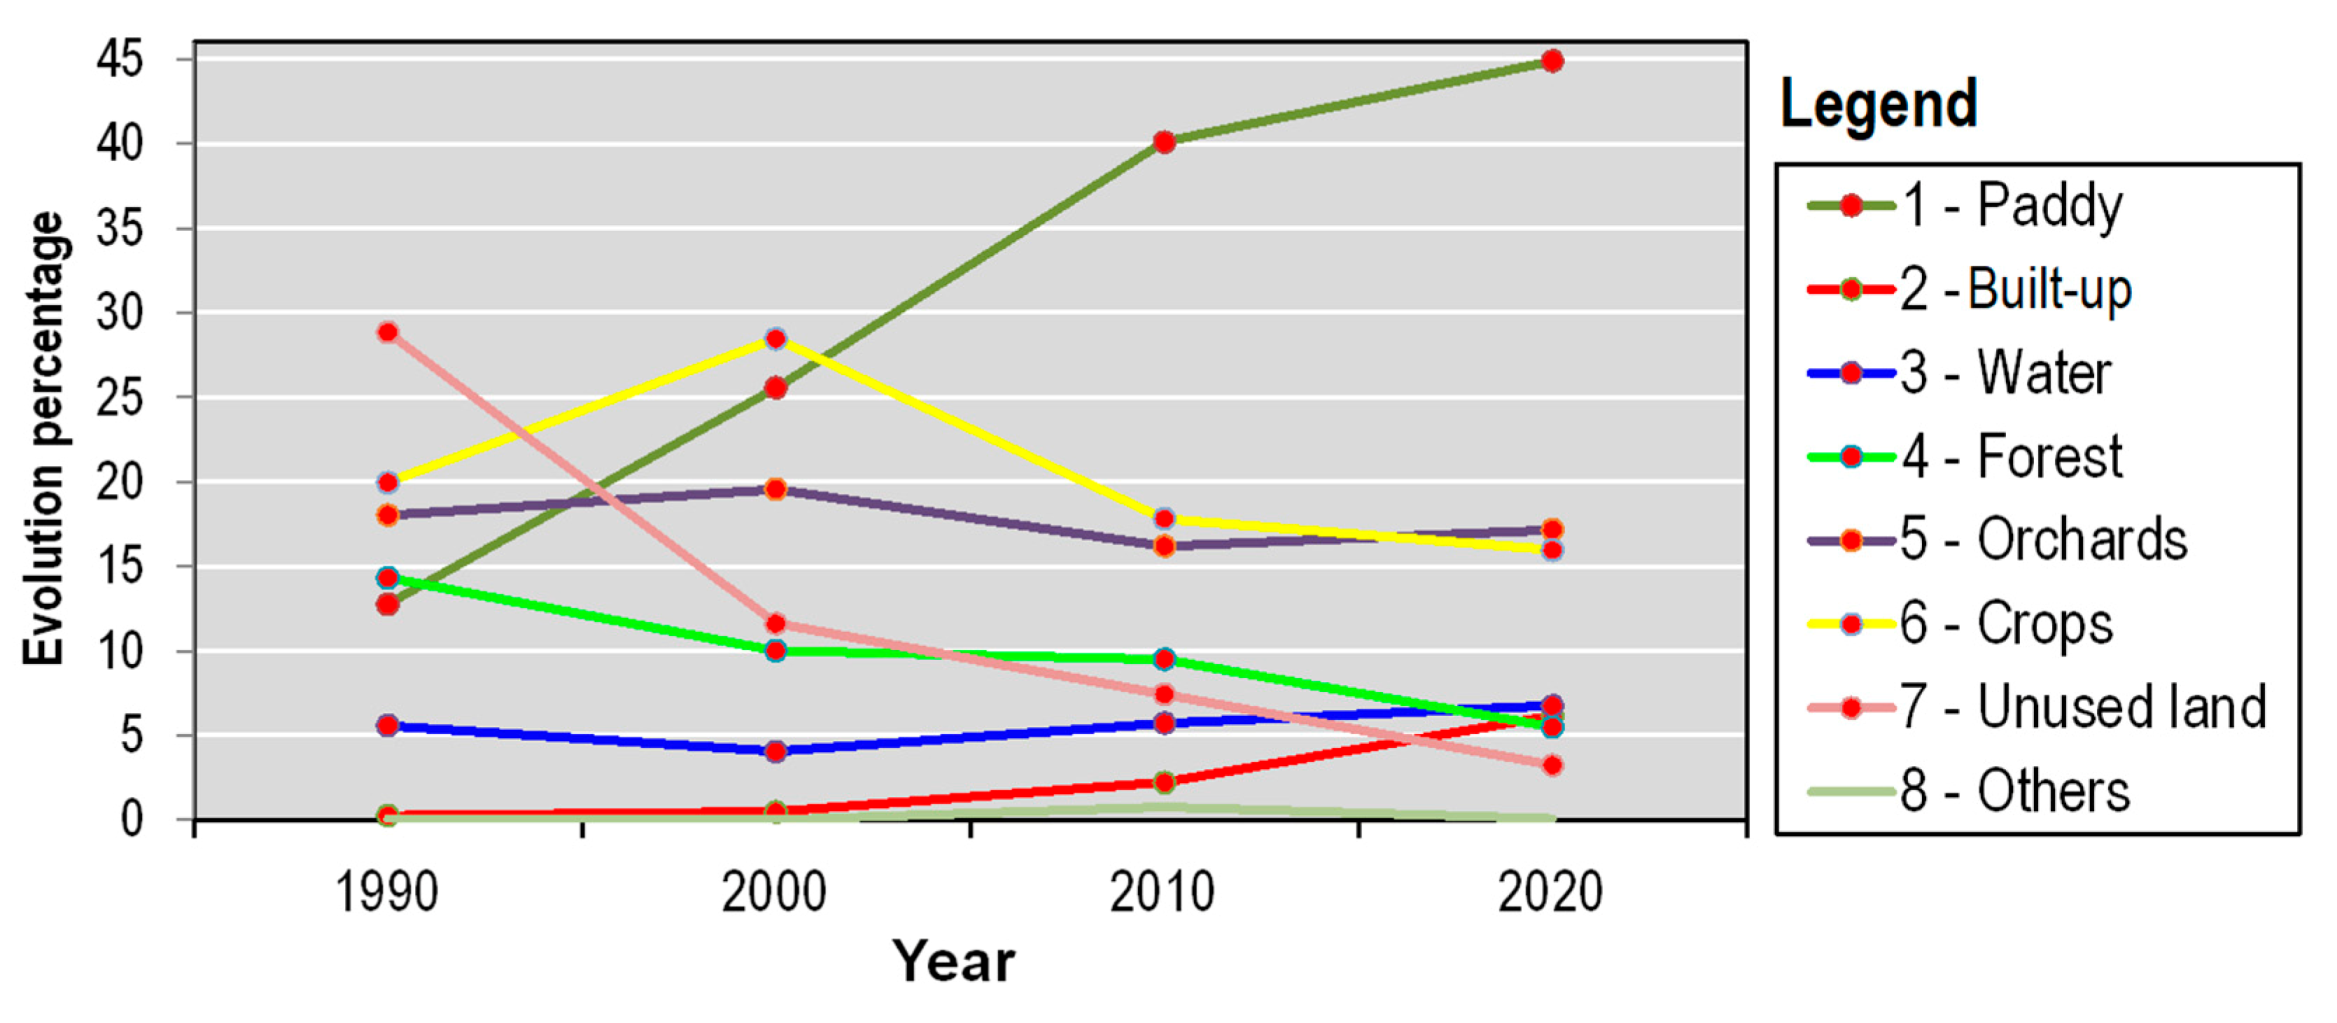
| LULC Class | Area (km2) | |||
|---|---|---|---|---|
| 1990 | 2000 | 2010 | 2020 | |
| 1. Paddy | 935.0 | 1874.5 | 2941.4 | 3292.2 |
| 2. Built-up | 18.8 | 35.3 | 162.5 | 450.7 |
| 3. Water | 403.6 | 292.6 | 416.1 | 491.3 |
| 4. Forest | 1049.5 | 733.9 | 696.5 | 402.7 |
| 5. Orchards | 1322.0 | 1433.4 | 1186.0 | 1257.7 |
| 6. Crops | 1462.4 | 2085.8 | 1305.3 | 1170.0 |
| 7. Unused land | 2111.9 | 849.8 | 543.7 | 236.0 |
| 8. Others | 3.4 | 1.2 | 55.0 | 5.9 |
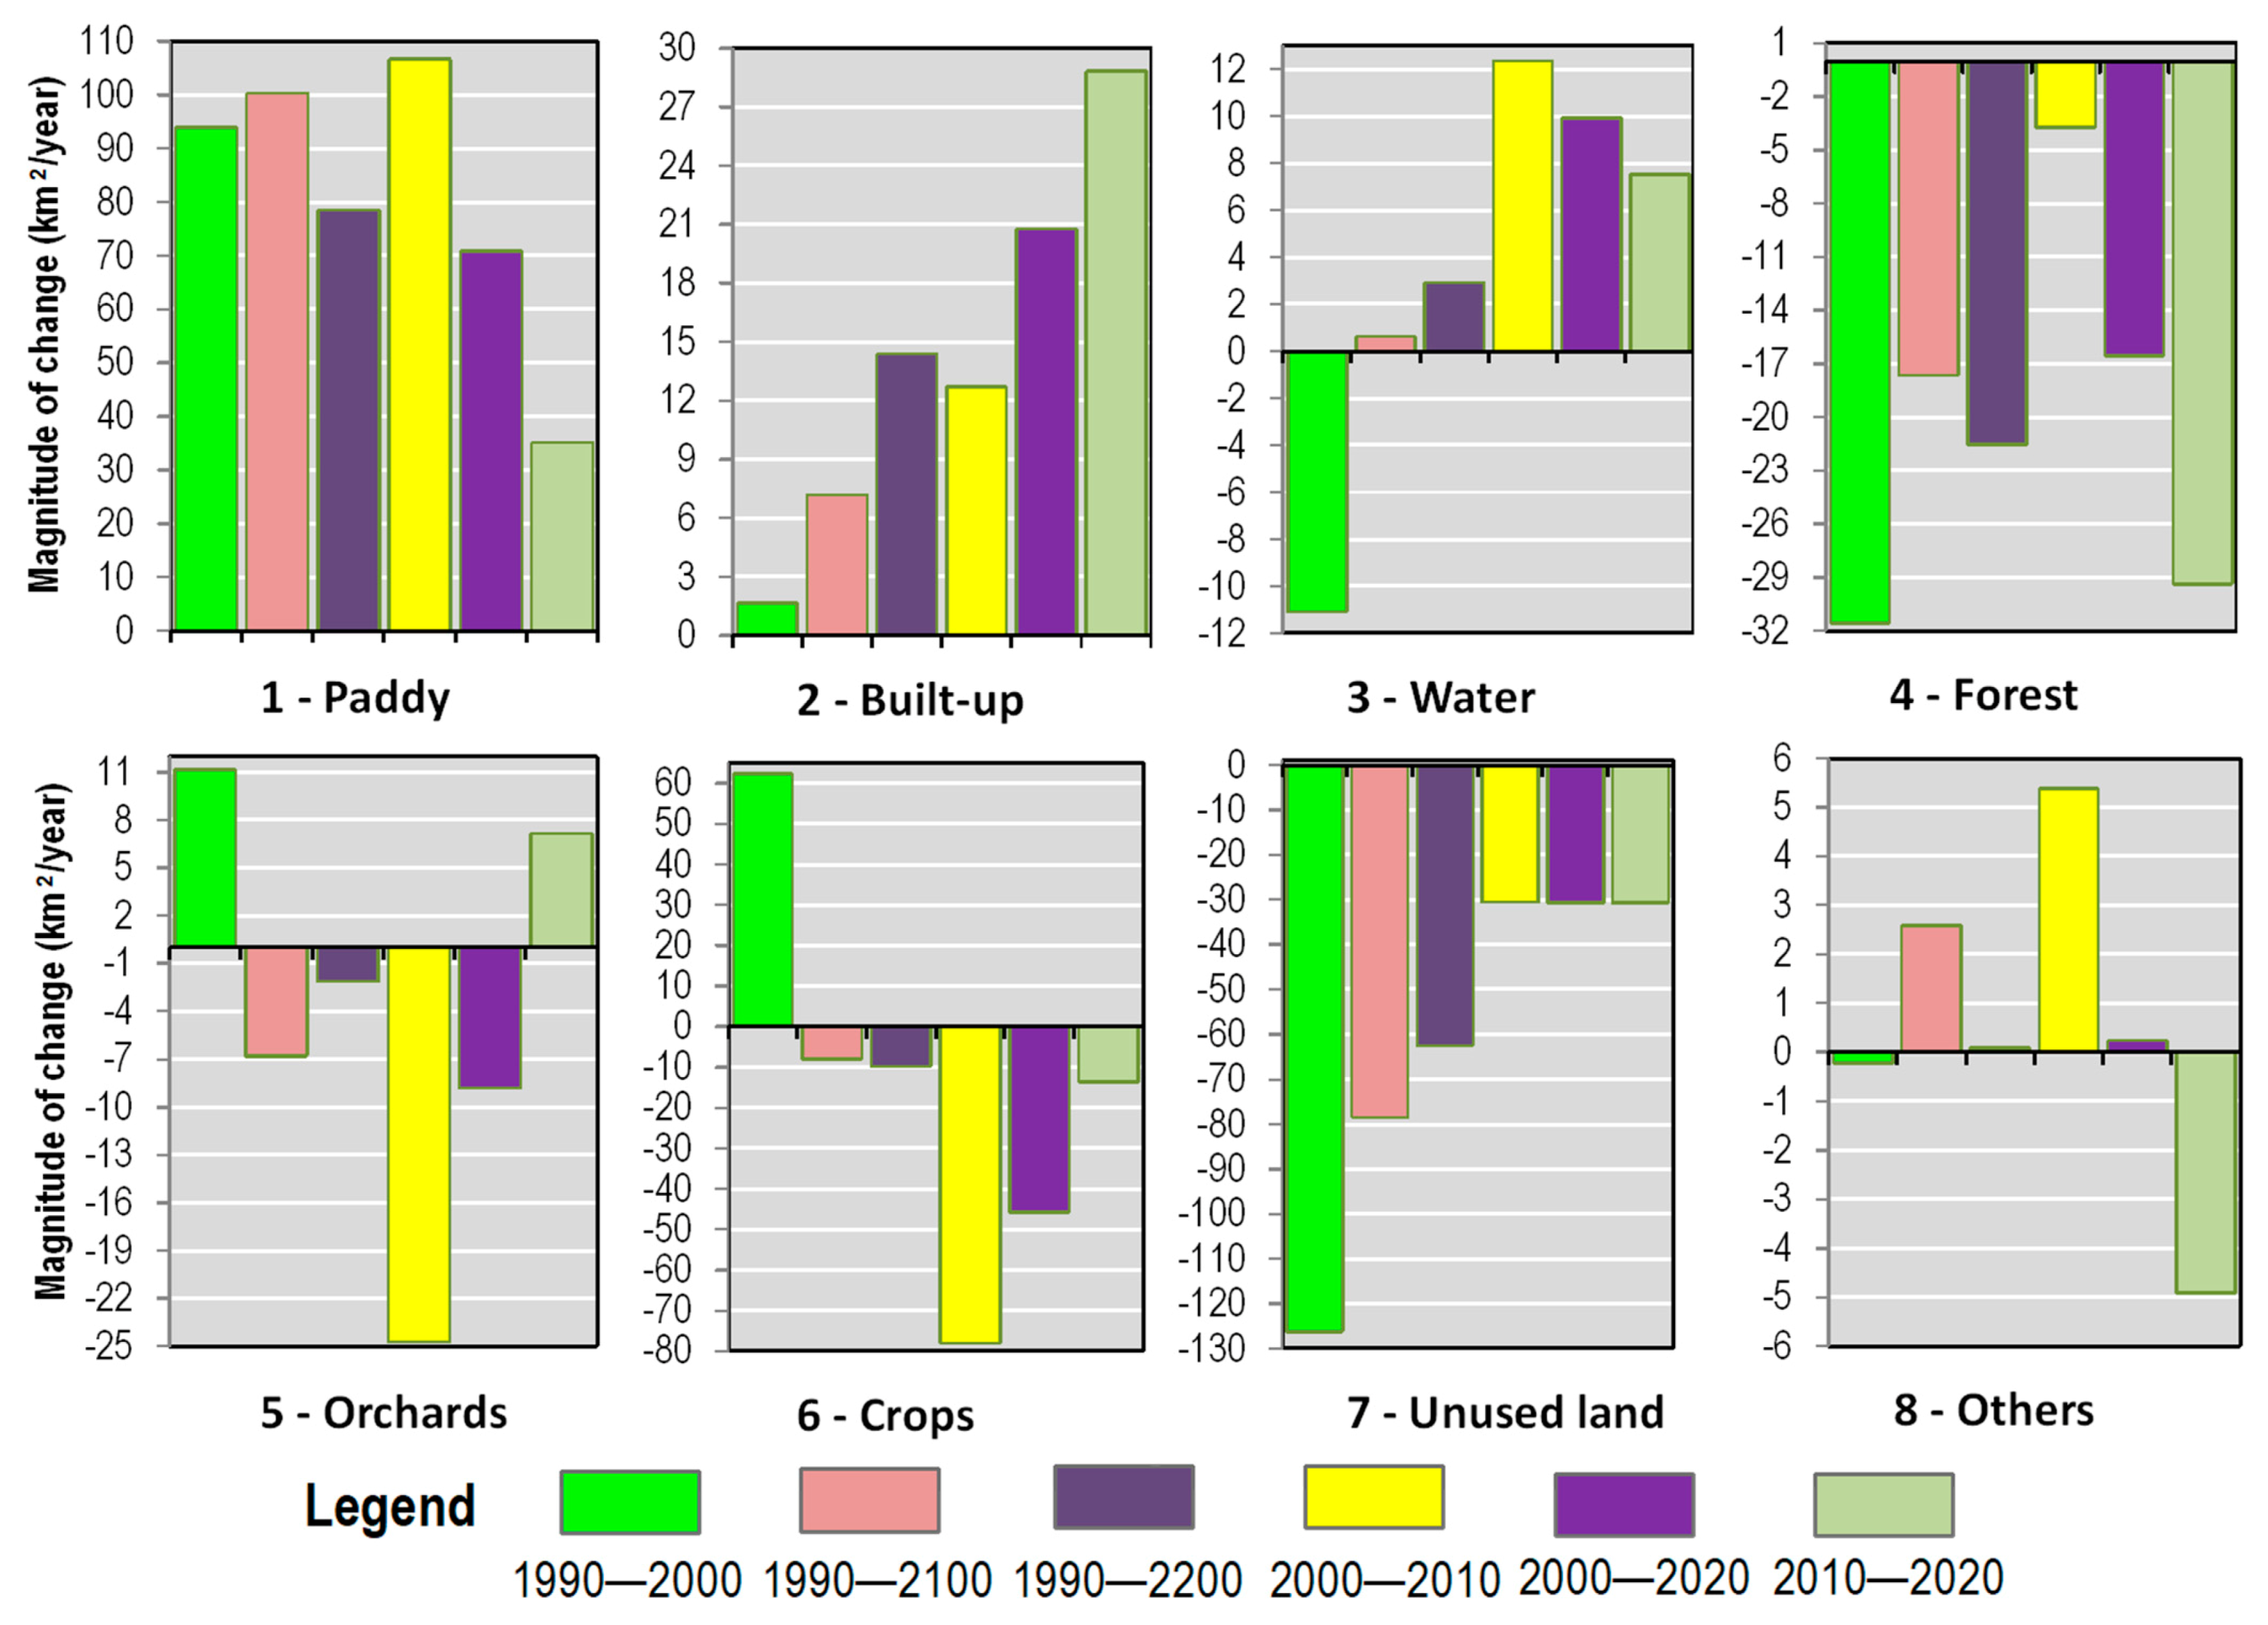
| LULC Class | Change Magnitude (km2) | Change Rate per Year (km2/Year) | ||||||||||
|---|---|---|---|---|---|---|---|---|---|---|---|---|
| 1990–2000 | 1990–2010 | 1990–2020 | 2000–2010 | 2000–2020 | 2010–2020 | 1990–2000 | 1990–2010 | 1990–2020 | 2000–2010 | 2000–2020 | 2010–2020 | |
| 1. Paddy | 939.6 | 2006.4 | 2357.2 | 1066.8 | 1417.7 | 350.8 | 94.0 | 100.3 | 78.6 | 106.7 | 70.9 | 35.1 |
| 2. Built-up | 16.6 | 143.8 | 432.0 | 127.2 | 415.4 | 288.2 | 1.7 | 7.2 | 14.4 | 12.7 | 20.8 | 28.8 |
| 3. Water | −111.0 | 12.5 | 87.7 | 123.5 | 198.7 | 75.2 | −11.1 | 0.6 | 2.9 | 12.3 | 9.9 | 7.5 |
| 4. Forest | −315.7 | −353.0 | −646.8 | −37.4 | −331.1 | −293.8 | −31.6 | −17.7 | −21.6 | −3.7 | −16.6 | −29.4 |
| 5. Orchards | 111.5 | −136.0 | −64.3 | −247.4 | −175.8 | 71.7 | 11.1 | −6.8 | −2.1 | −24.7 | −8.8 | 7.2 |
| 6. Crops | 623.4 | −157.1 | −292.4 | −780.6 | −915.9 | −135.3 | 62.3 | −7.9 | −9.7 | −78.1 | −45.8 | −13.5 |
| 7. Unused land | −1262.1 | −1568.2 | −1875.9 | −306.1 | −613.7 | −832.2 | −126.2 | −78.4 | −62.5 | −30.6 | −30.7 | −83.2 |
| 8. Others | −2.2 | 51.6 | 2.5 | 53.9 | 4.7 | −49.2 | −0.2 | 2.6 | 0.1 | 5.4 | 0.2 | −4.9 |
| The 1990–2000 Period | PD | BU | WT | FR | OC | CR | UL | OT | Total | Expansion | |
| 2000 | Paddy (PD) | 454.4 | 0.9 | 66.6 | 150.8 | 357.1 | 451.8 | 392.4 | 0.5 | 1874.5 | 1420.1 |
| Built-up (BU) | 2.3 | 4.9 | 1.5 | 1.2 | 8.1 | 8.5 | 8.7 | 0.1 | 35.3 | 30.4 | |
| Water (WT) | 5.9 | 1.4 | 177.3 | 14.2 | 10.7 | 21.4 | 61.2 | 0.5 | 292.6 | 115.3 | |
| Forest (FR) | 38.2 | 0.2 | 27.1 | 238.9 | 128.9 | 104.8 | 195.7 | 0.0 | 733.9 | 494.9 | |
| Orchards (OC) | 169.3 | 1.0 | 43.9 | 175.0 | 509.0 | 362.6 | 172.5 | 0.0 | 1433.4 | 924.5 | |
| Crops (CR) | 209.3 | 4.6 | 62.4 | 390.0 | 266.8 | 403.2 | 749.0 | 0.5 | 2085.8 | 1682.7 | |
| Unused (UL) | 55.4 | 5.7 | 24.7 | 79.3 | 41.3 | 109.8 | 531.9 | 1.6 | 849.8 | 317.9 | |
| Others (OT) | 0.0 | 0.0 | 0.1 | 0.1 | 0.1 | 0.2 | 0.5 | 0.1 | 1.2 | 1.1 | |
| Total | 935.0 | 18.8 | 403.6 | 1049.5 | 1322.0 | 1462.4 | 2111.9 | 3.4 | 7306.6 | 4986.8 | |
| Reduction | 480.5 | 13.8 | 226.3 | 810.6 | 813.0 | 1059.2 | 1580.0 | 3.3 | 4986.8 | 0.0 | |
| The 1990–2010 Period | PD | BU | WT | FR | OC | CR | UL | OT | Total | Expansion | |
| 2010 | Paddy (PD) | 588.7 | 2.1 | 109.8 | 364.9 | 430.2 | 676.7 | 768.2 | 0.8 | 2941.4 | 2352.7 |
| Built-up (BU) | 12.7 | 6.5 | 5.0 | 9.7 | 28.1 | 43.5 | 56.4 | 0.6 | 162.5 | 156.0 | |
| Water (WT) | 18.3 | 1.8 | 166.8 | 26.9 | 34.7 | 63.1 | 103.7 | 0.7 | 416.1 | 249.4 | |
| Forest (FR) | 22.3 | 0.4 | 21.9 | 243.4 | 133.0 | 73.7 | 201.7 | 0.1 | 696.5 | 453.1 | |
| Orchards (OC) | 104.5 | 0.5 | 31.3 | 219.7 | 391.7 | 207.3 | 230.9 | 0.0 | 1186.0 | 794.3 | |
| Crops (CR) | 138.9 | 2.7 | 39.1 | 146.4 | 237.1 | 306.6 | 433.9 | 0.5 | 1305.3 | 998.7 | |
| Unused (UL) | 46.4 | 4.7 | 10.1 | 37.2 | 45.5 | 85.3 | 314.0 | 0.5 | 543.7 | 229.7 | |
| Others (OT) | 3.0 | 0.1 | 19.7 | 1.3 | 21.7 | 6.1 | 3.0 | 0.1 | 55.0 | 54.9 | |
| Total | 935.0 | 18.8 | 403.6 | 1049.5 | 1322.0 | 1462.4 | 2111.9 | 3.4 | 7306.6 | 5288.7 | |
| Reduction | 346.3 | 12.2 | 236.8 | 806.1 | 930.3 | 1155.8 | 1797.9 | 3.3 | 5288.7 | ||
| The 1990–2020 Period | PD | BU | WT | FR | OC | CR | UL | OT | Total | Expansion | |
| 2020 | Paddy (PD) | 575.3 | 2.1 | 121.3 | 429.2 | 487.5 | 701.3 | 974.4 | 1.1 | 3292.2 | 2717.0 |
| Built-up (BU) | 41.7 | 9.3 | 17.7 | 27.3 | 105.2 | 117.0 | 131.5 | 0.9 | 450.7 | 441.4 | |
| Water (WT) | 51.1 | 0.9 | 171.4 | 35.9 | 52.5 | 86.7 | 92.4 | 0.5 | 491.3 | 320.0 | |
| Forest (FR) | 17.7 | 0.2 | 18.0 | 142.9 | 51.8 | 49.1 | 123.0 | 0.1 | 402.7 | 259.8 | |
| Orchards (OC) | 117.7 | 1.0 | 32.1 | 195.9 | 419.2 | 246.3 | 245.3 | 0.2 | 1257.7 | 838.4 | |
| Crops (CR) | 113.6 | 3.1 | 27.7 | 188.7 | 185.9 | 233.5 | 416.9 | 0.5 | 1170.0 | 936.5 | |
| Unused (UL) | 17.6 | 2.0 | 14.9 | 28.2 | 19.3 | 27.6 | 126.3 | 0.1 | 236.0 | 109.8 | |
| Others (OT) | 0.2 | 0.2 | 0.5 | 1.4 | 0.4 | 0.9 | 2.2 | 0.0 | 5.9 | 5.9 | |
| Total | 935.0 | 18.8 | 403.6 | 1049.5 | 1322.0 | 1462.4 | 2111.9 | 3.4 | 7306.6 | 5628.8 | |
| Reduction | 359.7 | 9.5 | 232.2 | 906.7 | 902.7 | 1228.9 | 1985.7 | 3.4 | 5628.8 | ||
| The 2000–2010 Period | PD | BU | WT | FR | OC | CR | UL | OT | Total | Expansion | |
| 2010 | Paddy (PD) | 1163.4 | 4.8 | 33.8 | 278.0 | 533.1 | 685.8 | 242.3 | 0.1 | 2941.4 | 1778.0 |
| Built-up (BU) | 17.1 | 15.0 | 7.8 | 6.5 | 22.2 | 61.0 | 32.7 | 0.1 | 162.5 | 147.5 | |
| Water (WT) | 32.6 | 5.2 | 169.0 | 19.9 | 29.0 | 104.1 | 56.2 | 0.1 | 416.1 | 247.1 | |
| Forest (FR) | 41.1 | 1.1 | 11.4 | 205.3 | 101.1 | 273.8 | 62.6 | 0.1 | 696.5 | 491.2 | |
| Orchards (OC) | 207.7 | 1.7 | 11.6 | 124.0 | 438.2 | 338.0 | 64.6 | 0.1 | 1186.0 | 747.8 | |
| Crops (CR) | 309.0 | 5.2 | 25.3 | 79.2 | 240.1 | 470.7 | 175.6 | 0.3 | 1305.3 | 834.6 | |
| Unused (UL) | 97.5 | 1.9 | 15.5 | 18.6 | 54.0 | 142.1 | 214.0 | 0.2 | 543.7 | 329.7 | |
| Others (OT) | 6.1 | 0.4 | 18.3 | 2.3 | 15.7 | 10.4 | 1.7 | 0.2 | 55.0 | 54.8 | |
| Total | 1874.5 | 35.3 | 292.6 | 733.9 | 1433.4 | 2085.8 | 849.8 | 1.2 | 7306.6 | 4630.8 | |
| Reduction | 711.1 | 20.3 | 123.7 | 528.5 | 995.3 | 1615.2 | 635.8 | 0.9 | 4630.8 | ||
| The 2000–2020 Period | PD | BU | WT | FR | OC | CR | UL | OT | Total | Expansion | |
| 2020 | Paddy (PD) | 1176.3 | 3.8 | 52.2 | 305.5 | 577.8 | 820.2 | 356.2 | 0.2 | 3292.2 | 2115.9 |
| Built-up (BU) | 61.6 | 23.5 | 20.2 | 18.8 | 75.6 | 161.2 | 89.5 | 0.2 | 450.7 | 427.2 | |
| Water (WT) | 96.0 | 2.3 | 168.0 | 26.4 | 56.8 | 91.0 | 50.8 | 0.1 | 491.3 | 323.3 | |
| Forest (FR) | 36.1 | 0.4 | 9.4 | 123.0 | 43.9 | 149.3 | 40.5 | 0.1 | 402.7 | 279.7 | |
| Orchards (OC) | 248.7 | 1.5 | 10.5 | 137.6 | 444.0 | 340.4 | 74.8 | 0.1 | 1257.7 | 813.7 | |
| Crops (CR) | 220.8 | 3.0 | 19.2 | 102.2 | 210.9 | 452.5 | 160.9 | 0.3 | 1170.0 | 717.4 | |
| Unused (UL) | 34.6 | 0.8 | 12.5 | 19.7 | 23.8 | 68.8 | 75.8 | 0.1 | 236.0 | 160.2 | |
| Others (OT) | 0.3 | 0.1 | 0.6 | 0.6 | 0.7 | 2.3 | 1.2 | 0.0 | 5.9 | 5.8 | |
| Total | 1874.5 | 35.3 | 292.6 | 733.9 | 1433.4 | 2085.8 | 849.8 | 1.2 | 7306.6 | 4843.2 | |
| Reduction | 698.2 | 11.8 | 124.6 | 610.8 | 989.4 | 1633.3 | 773.9 | 1.1 | 4843.2 | ||
| The 2010–2020 Period | PD | BU | WT | FR | OC | CR | UL | OT | Total | Expansion | |
| 2020 | Paddy (PD) | 1980.0 | 25.0 | 79.0 | 107.1 | 355.2 | 529.2 | 203.1 | 13.7 | 3292.2 | 1312.3 |
| Built-up (BU) | 79.2 | 87.7 | 53.5 | 19.0 | 47.7 | 103.0 | 54.7 | 5.9 | 450.7 | 363.0 | |
| Water (WT) | 138.8 | 8.7 | 189.0 | 26.7 | 29.6 | 53.1 | 24.9 | 20.6 | 491.3 | 302.4 | |
| Forest (FR) | 62.3 | 2.2 | 16.5 | 220.5 | 40.3 | 46.8 | 12.7 | 1.5 | 402.7 | 182.2 | |
| Orchards (OC) | 290.3 | 11.4 | 26.1 | 167.6 | 472.5 | 225.6 | 55.7 | 8.4 | 1257.7 | 785.1 | |
| Crops (CR) | 337.8 | 20.4 | 34.8 | 133.2 | 211.7 | 303.2 | 125.1 | 3.7 | 1170.0 | 866.8 | |
| Unused (UL) | 52.5 | 6.1 | 16.7 | 21.5 | 28.7 | 43.3 | 66.2 | 0.9 | 236.0 | 169.8 | |
| Others (OT) | 0.6 | 1.0 | 0.5 | 1.0 | 0.3 | 1.1 | 1.3 | 0.1 | 5.9 | 5.7 | |
| Total | 2941.4 | 162.5 | 416.1 | 696.5 | 1186.0 | 1305.3 | 543.7 | 55.0 | 7306.6 | 3987.4 | |
| Reduction | 961.4 | 74.8 | 227.2 | 476.0 | 713.5 | 1002.1 | 1002.1 | 54.9 | 4512.0 | ||
Publisher’s Note: MDPI stays neutral with regard to jurisdictional claims in published maps and institutional affiliations. |
© 2021 by the authors. Licensee MDPI, Basel, Switzerland. This article is an open access article distributed under the terms and conditions of the Creative Commons Attribution (CC BY) license (https://creativecommons.org/licenses/by/4.0/).
Share and Cite
Binh, N.A.; Nhut, H.S.; An, N.N.; Phuong, T.A.; Hanh, N.C.; Thao, G.T.P.; Pham, T.T.; Hong, P.V.; Ha, L.T.T.; Bui, D.T.; et al. Thirty-Year Dynamics of LULC at the Dong Thap Muoi Area, Southern Vietnam, Using Google Earth Engine. ISPRS Int. J. Geo-Inf. 2021, 10, 226. https://doi.org/10.3390/ijgi10040226
Binh NA, Nhut HS, An NN, Phuong TA, Hanh NC, Thao GTP, Pham TT, Hong PV, Ha LTT, Bui DT, et al. Thirty-Year Dynamics of LULC at the Dong Thap Muoi Area, Southern Vietnam, Using Google Earth Engine. ISPRS International Journal of Geo-Information. 2021; 10(4):226. https://doi.org/10.3390/ijgi10040226
Chicago/Turabian StyleBinh, Nguyen An, Huynh Song Nhut, Nguyen Ngoc An, Tran Anh Phuong, Nguyen Cao Hanh, Giang Thi Phuong Thao, The Trinh Pham, Pham Viet Hong, Le Thi Thu Ha, Dieu Tien Bui, and et al. 2021. "Thirty-Year Dynamics of LULC at the Dong Thap Muoi Area, Southern Vietnam, Using Google Earth Engine" ISPRS International Journal of Geo-Information 10, no. 4: 226. https://doi.org/10.3390/ijgi10040226