
View-Dependent Progressive Transmission Method for 3D Building Models


1
Jiangsu Provincial Key Laboratory of Geographic Information Science and Technology, Key Laboratory for Land Satellite Remote Sensing Applications of Ministry of Natural Resources, School of Geography and Ocean Science, Nanjing University, Nanjing 210023, Jiangsu, China
2
Jiangsu Center for Collaborative Innovation in Novel Software Technology and Industrialization, Nanjing 210023, Jiangsu, China
*
Author to whom correspondence should be addressed.
ISPRS Int. J. Geo-Inf. 2021, 10(4), 228; https://doi.org/10.3390/ijgi10040228
Submission received: 4 February 2021
/
Revised: 29 March 2021
/
Accepted: 4 April 2021
/
Published: 6 April 2021
Abstract
:Complex 3D building models, because of their huge data volume, almost always result in transmission congestion, which leads to poor user experience. To reduce the real-time transmission pressure, a novel view-dependent progressive transmission method was developed. With this method, only a small amount of transmitted data is necessary to achieve an acceptable rendering effect when the viewpoint changes. The method involves two stages. A preprocessing stage simplifies the building model using a multi-level vertex clustering algorithm. The local mesh in each clustering unit is organized into a node tree where each node includes a vertex and its related triangles. The building model is finally reorganized into a node forest. In the reconstruction stage, all root nodes are transmitted first to build a basic model. Their descendant nodes are then requested and transmitted according to viewpoint information to refine the building model during user interaction. The experimental results show that this method can effectively improve the transmission and reconstruction efficiency of 3D building models.
1. Introduction
3D building models, a key part of the virtual geographic environment, are widely used in smart cities, 3D navigation, and computer games [1,2]. In recent years, transmission of 3D models over the Internet and their subsequent rendering in real-time for clients have been in demand [3]. With the rapid development of 3D data-acquisition technologies such as tilt photogrammetry [4] and LiDAR scanning [5], 3D building models are becoming more realistic and complex, resulting in enormous volumes of data. These vast quantities of data often cause transmission congestion, which makes it difficult to refine the building model in real-time. Rough or incomplete 3D building models make for a poor user experience and may even confuse users.
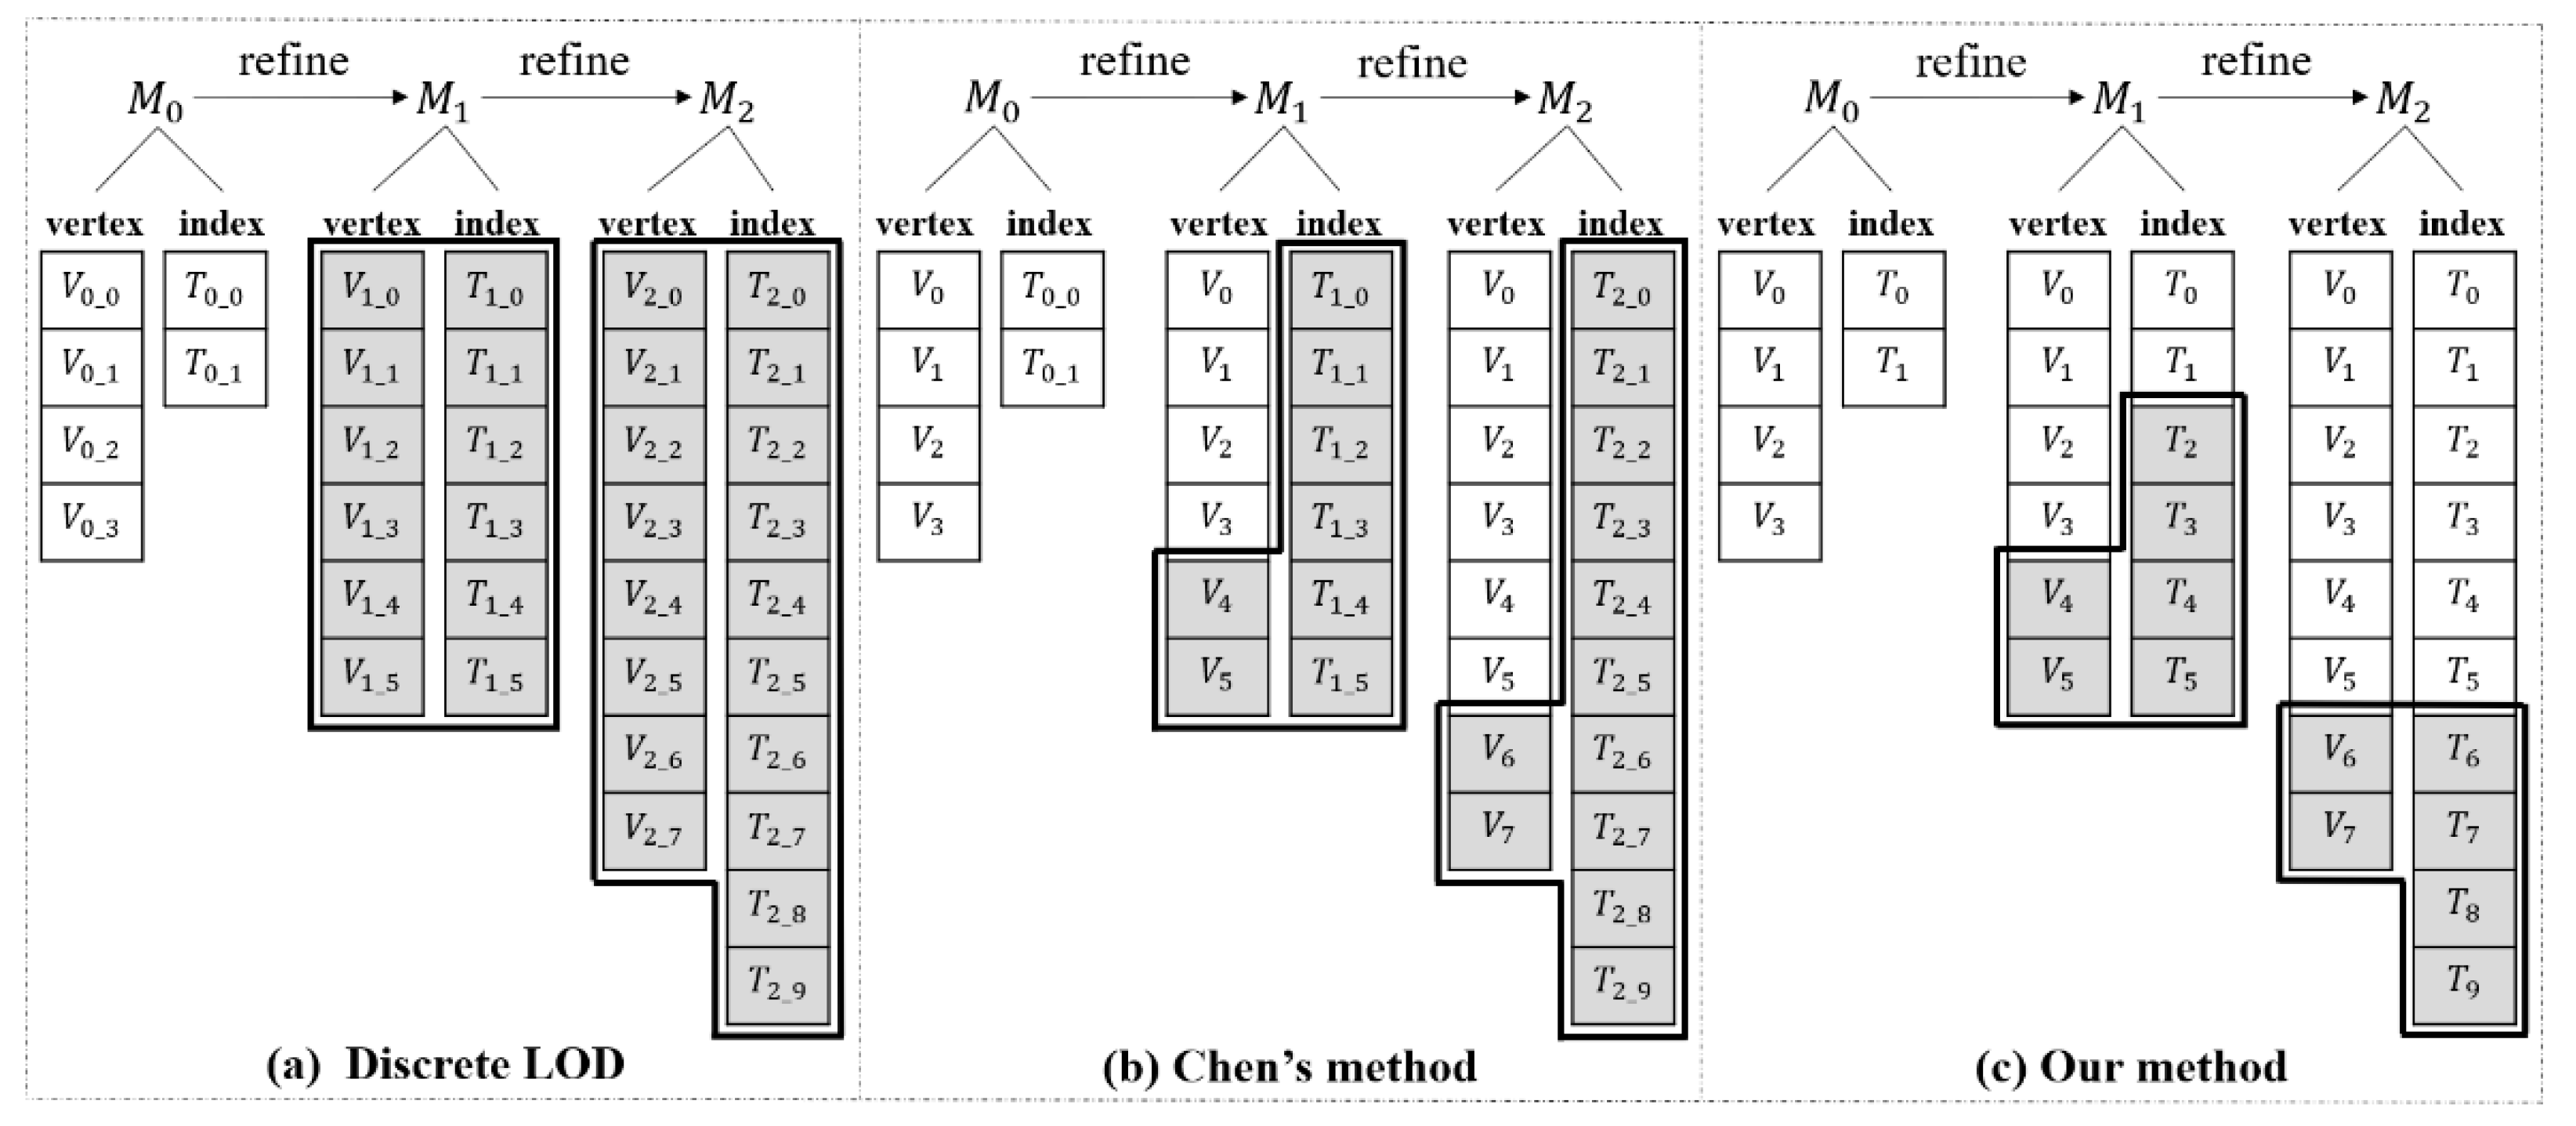
Many methods and strategies have been proposed to improve the efficiency of 3D model transmission. These can be divided into two general categories: Replacement strategies and additive strategies. The discrete LOD strategy [6] is a typical replacement strategy. The original 3D model is simplified several times independently in advance to generate multiple models at different levels of detail. As the viewpoint approaches, the coarse models are successively replaced by the more detailed models. Such a strategy reduces the data transmission pressure to a certain extent when interacting with an initial coarse scene. However, because the detailed model completely covers the information from the coarse model, the previously transmitted data should be reused rather than directly replaced. As shown in Figure 1a, the gray-filled boxes represent the data that need to be transmitted each time the model is refined. This method results in a large volume of data being transmitted repeatedly during scene refinement.
The additive strategy realizes progressive refinement of the model by transmitting and appending incremental data continuously to the coarse model. Compared with the replacement strategy, it reduces the redundancy of data transmission but it also increases the workload for refining the model. Chen et al. [7] proposed a progressive transmission method. The 3D model is usually composed of vertex data and triangle index data. In their method, higher-level, incremental vertex data and global triangle index data are transmitted as the viewpoint approaches the simulation object. As shown in Figure 1b, this progressive transmission method reuses the vertex data but does not eliminate the redundancy of the index data.
The time from the emergence of the requirement to refine the 3D model to the completion of the model refinement significantly affects the user’s experience. Shorter time intervals result in better user experiences. The methods described above still require a lot of data redundancy during transmission, which increases transmission time and affects the user’s experience, especially when interacting with a wide range of scenes. To solve this problem, a view-dependent progressive transmission method was developed for 3D building models to reduce the data transmission pressure and improve the efficiency of model reconstruction. Our method uses a multi-level vertex clustering algorithm to simplify the model. The local mesh in each clustering unit is organized into a node tree where each node includes a vertex and its related triangles, and the building model is finally reorganized into a node forest. All these data nodes are stored together in a database, transmitted on demand, and used for model reconstruction. As shown in Figure 1c, all previously transmitted data can be fully reused in our method, which greatly reduces data redundancy. In addition, our method can realize view-dependent data transmission and model refinement. This can avoid transmitting unnecessary data under the current viewpoint as much as possible, and further reduce the instantaneous transmission pressure.
2. Related Work
2.1. Simplification and Refinement for 3D Models
Simplification of the building model is the basis for progressive transmission. Traditional simplification algorithms for 3D models include vertex clustering [8], vertex decimation [9], edge collapse [10], and polygon collapse [11]. Based on these methods, many improved processes and quality control techniques have been proposed. Garland and Heckbert [12] proposed and then improved [13] the quadric error metric (QEM), which can effectively limit changes in local curvature and volume while maintaining appearance characteristics.
Some methods have been proposed specifically for the simplification of models used for buildings. Zhao, et al. [14] used morphological operations to extract the semantic relationships among building components and generalized building models under semantic constraints. Li, et al. [15] divided building models into three types of structures and then used the vertex decimation algorithm to simplify each structure. She, et al. [16] introduced a new error metric that accounts for both geometric and texture errors, thus preserving geometric features and reducing texture distortions. Using these methods, different simplification rates can be set to generate multiple models at different levels of detail, and then implement discrete LOD strategies. However, it is difficult to generate correlations among models with different levels of detail to implement progressive transmission strategies.
In contrast, view-dependent simplification and refinement algorithms offer more options. Xia and Varshney [17] and Hoppe [18] used a series of split and collapse operations to realize view-dependent simplification in mesh models. Luebke and Erikson [19] realized view-dependent simplification in an arbitrary polygon environment based on hierarchical dynamic simplification (HDS). Pajarola [20] and Pajarola and DeCoro [21] proposed an optimized, sequential view-dependent refinement algorithm. Their FastMesh can manage split dependencies by storing collapse-operations. Hu, et al. [22] developed a parallel adaption algorithm for progressive mesh. They introduced a relatively compact and explicit dependency structure, which allows to group a series of vertex splits and half-edge collapses into parallel steps. The drawback of this method is that explicit dependencies require additional memory. Derzapf and Guthe [23] proposed a novel algorithm for real-time, view-dependent rendering of complex models through a per-operation compression method that eliminated the interdependency of split operations. These methods generally realize refinement by adding incremental data to the coarse model, but they also usually need to record additional information. Therefore, data redundancy will occur if these methods are directly applied to transmission.
2.2. Progressive Transmission Over The Internet
Many progressive transmission methods have been proposed to meet the requirements of real-time interaction with 3D scenes over the Internet. Research on progressive transmission mainly focuses on how to reduce the instantaneous pressure of data transmission and ways to rapidly complete model reconstruction. Yang, et al. [24] divided the model into 40–60 parts and transmitted the locally compressed mesh according to the viewpoint to reduce the instantaneous transmission pressure. Gao, et al. [25] introduced Huffman encoding into the progressive mesh and transmitted the required compressed mesh data over the network. Yang, et al. [26] proposed an elastic error packetization scheme for progressive transmission over unreliable networks, with a supplemental strategy for dealing with dropped packets over the wireless network. The progressive transmission algorithm based on triangle collapse [27] preserved the model features well, but data dependence still exists. The progressive scheme based on string grammar proposed by Kada [28] describes a sequence of successive LODs as a dynamic set of production rules and uses a solid modeling approach based on planar half-spaces to construct 3D buildings. This scheme may perform well in reconstructing building models. Liu, et al. [29] considered the redundancy, semantics, and parameterization of BIM data and presented a Web3D-based lightweight solution for real-time visualization of large-scale BIM scenes. Chen, et al. [7] proposed a novel progressive mesh structure. As the viewpoint approaches, the incremental vertices and all indexes at a higher level are transmitted. This method eliminates the redundancy of vertex data during transmission, but redundancy of the index data still exists.
When interacting with a 3D scene, user experience is influenced by the total time of data transmission and model reconstruction. Transmitting and storing redundant data benefits reconstruction but increases the transmission time. Conversely, the deletion of some redundancy data reduces the transmission time, but at the cost of reconstruction performance. The progressive transmission method seeks to maintain a balance between data transmission and model reconstruction to try compressing the total time of transmission and reconstruction. Weighing the pros and cons to facilitate overall efficiency without sacrifice remains unsolved with the real-world limits on network bandwidth and hardware performance. However, the view-dependent progressive transmission method described in this paper not only realizes the full reuse of vertex and index data but also can reconstruct 3D building models quickly based on vertex encoding. This is expected to improve the experience of real-time interaction with the 3D scene.
3. Methodology
3.1. Multi-Level Vertex Clustering
The vertex clustering algorithm is one of the most widely used mesh simplification methods. It divides a model into several clustering units and takes the vertex with the highest weight to represent other vertices in each clustering unit, thus achieving model simplification. To reduce the texture distortion, we adopted the vertex clustering algorithm optimized by Chen, et al. [30], which considered both geometric and texture errors to simplify 3D building models. In 3D meshes, each vertex is surrounded by a series of triangles , and the weight of each vertex is calculated using Formula (1), where and are the normal vectors of any two adjacent triangles and of the vertex.
The model is divided into octree structures to obtain multiple clustering units. The vertex with the highest weight in the clustering unit is taken as the clustering characteristic vertex, and the geometric error and texture error in each clustering unit are calculated according to Formulas (2) and (3). If neither nor is smaller than the preset threshold, subdivision is continued. Otherwise, further subdivision is stopped and vertex clustering is performed. In Formula (2), represents the number of triangles containing vertex , which is a vertex in the clustering unit, and are the normal vectors of triangles and , respectively, is the triangle containing vertex , and is the corresponding new triangle after vertex clustering. In Formula (3), are the texture coordinates of , and are the texture coordinates of , which is the clustering characteristic vertex.
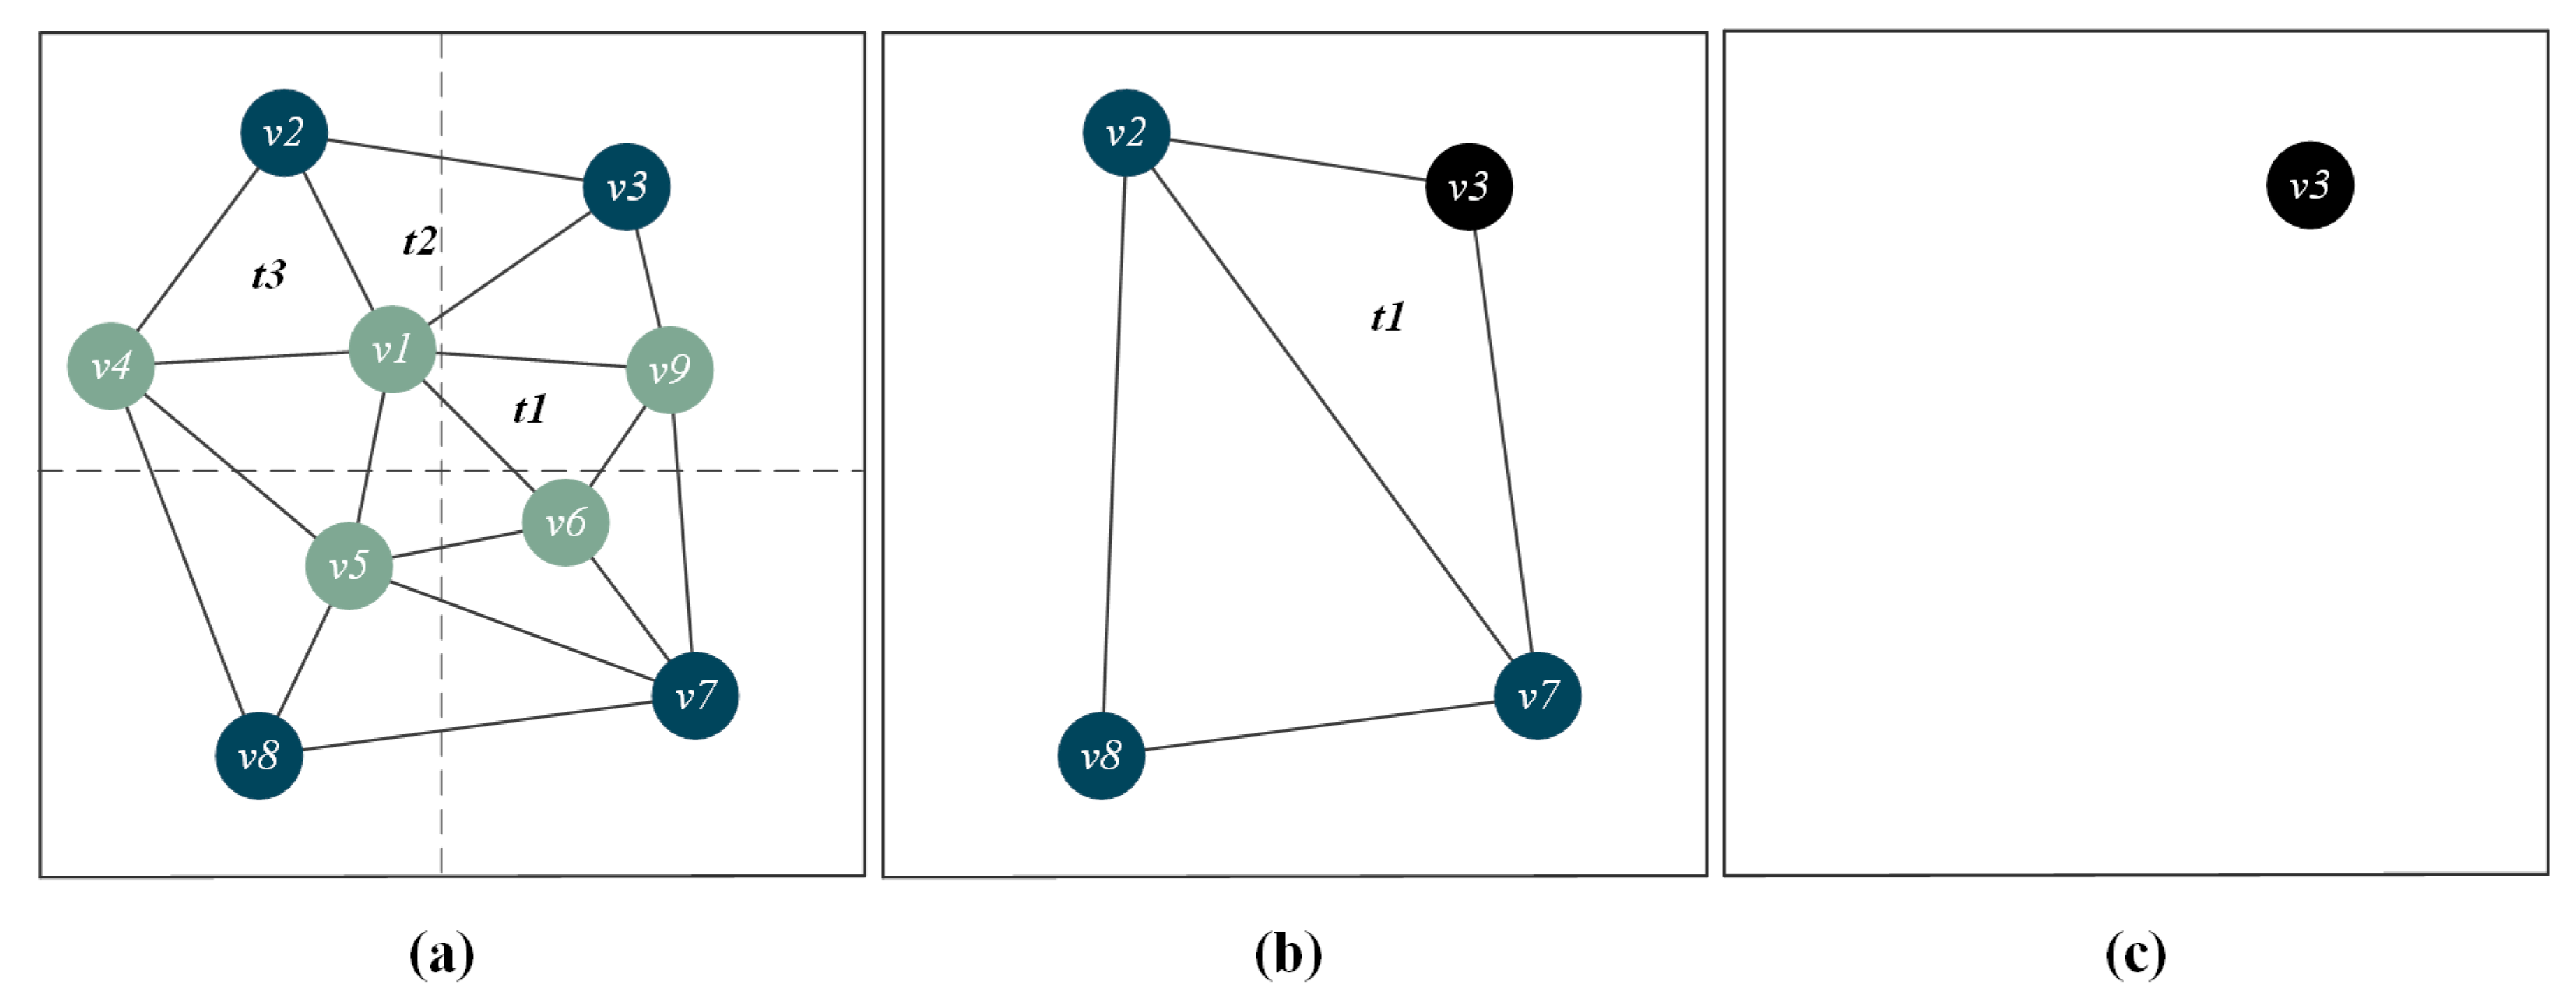
The traditional discrete LOD method must simplify the original model independently multiple times to generate models with different simplification rates, making it difficult to generate correlations between vertices of models with different levels of detail. The multi-level vertex clustering algorithm adopted in our method simplifies the original model to generate a simplified model . Then, the geometric error and texture error threshold are increased, and is taken as the basement to generate a coarser model . Finally, multiple models with different levels of detail are generated through this iterative process. Figure 2 is a schematic diagram of the multi-level vertex clustering algorithm. Figure 2a shows the original mesh, which is divided into four cluster units. The green vertices in each clustering unit are clustered to the dark blue vertex, which is the clustering characteristic vertex. The results are shown in Figure 2b. Based on Figure 2b, the clustering unit is expanded and the same clustering procedure is applied to obtain the result, as shown in Figure 2c. In each vertex clustering process, a vertex may be removed and a triangle may collapse. For example, in the process from Figure 2a to Figure 2b, and collapsed into an edge and a vertex, respectively. For triangles that do not collapse, the vertices they connect to may change like .
3.2. Fundamental Strategy of Progressive Transmission
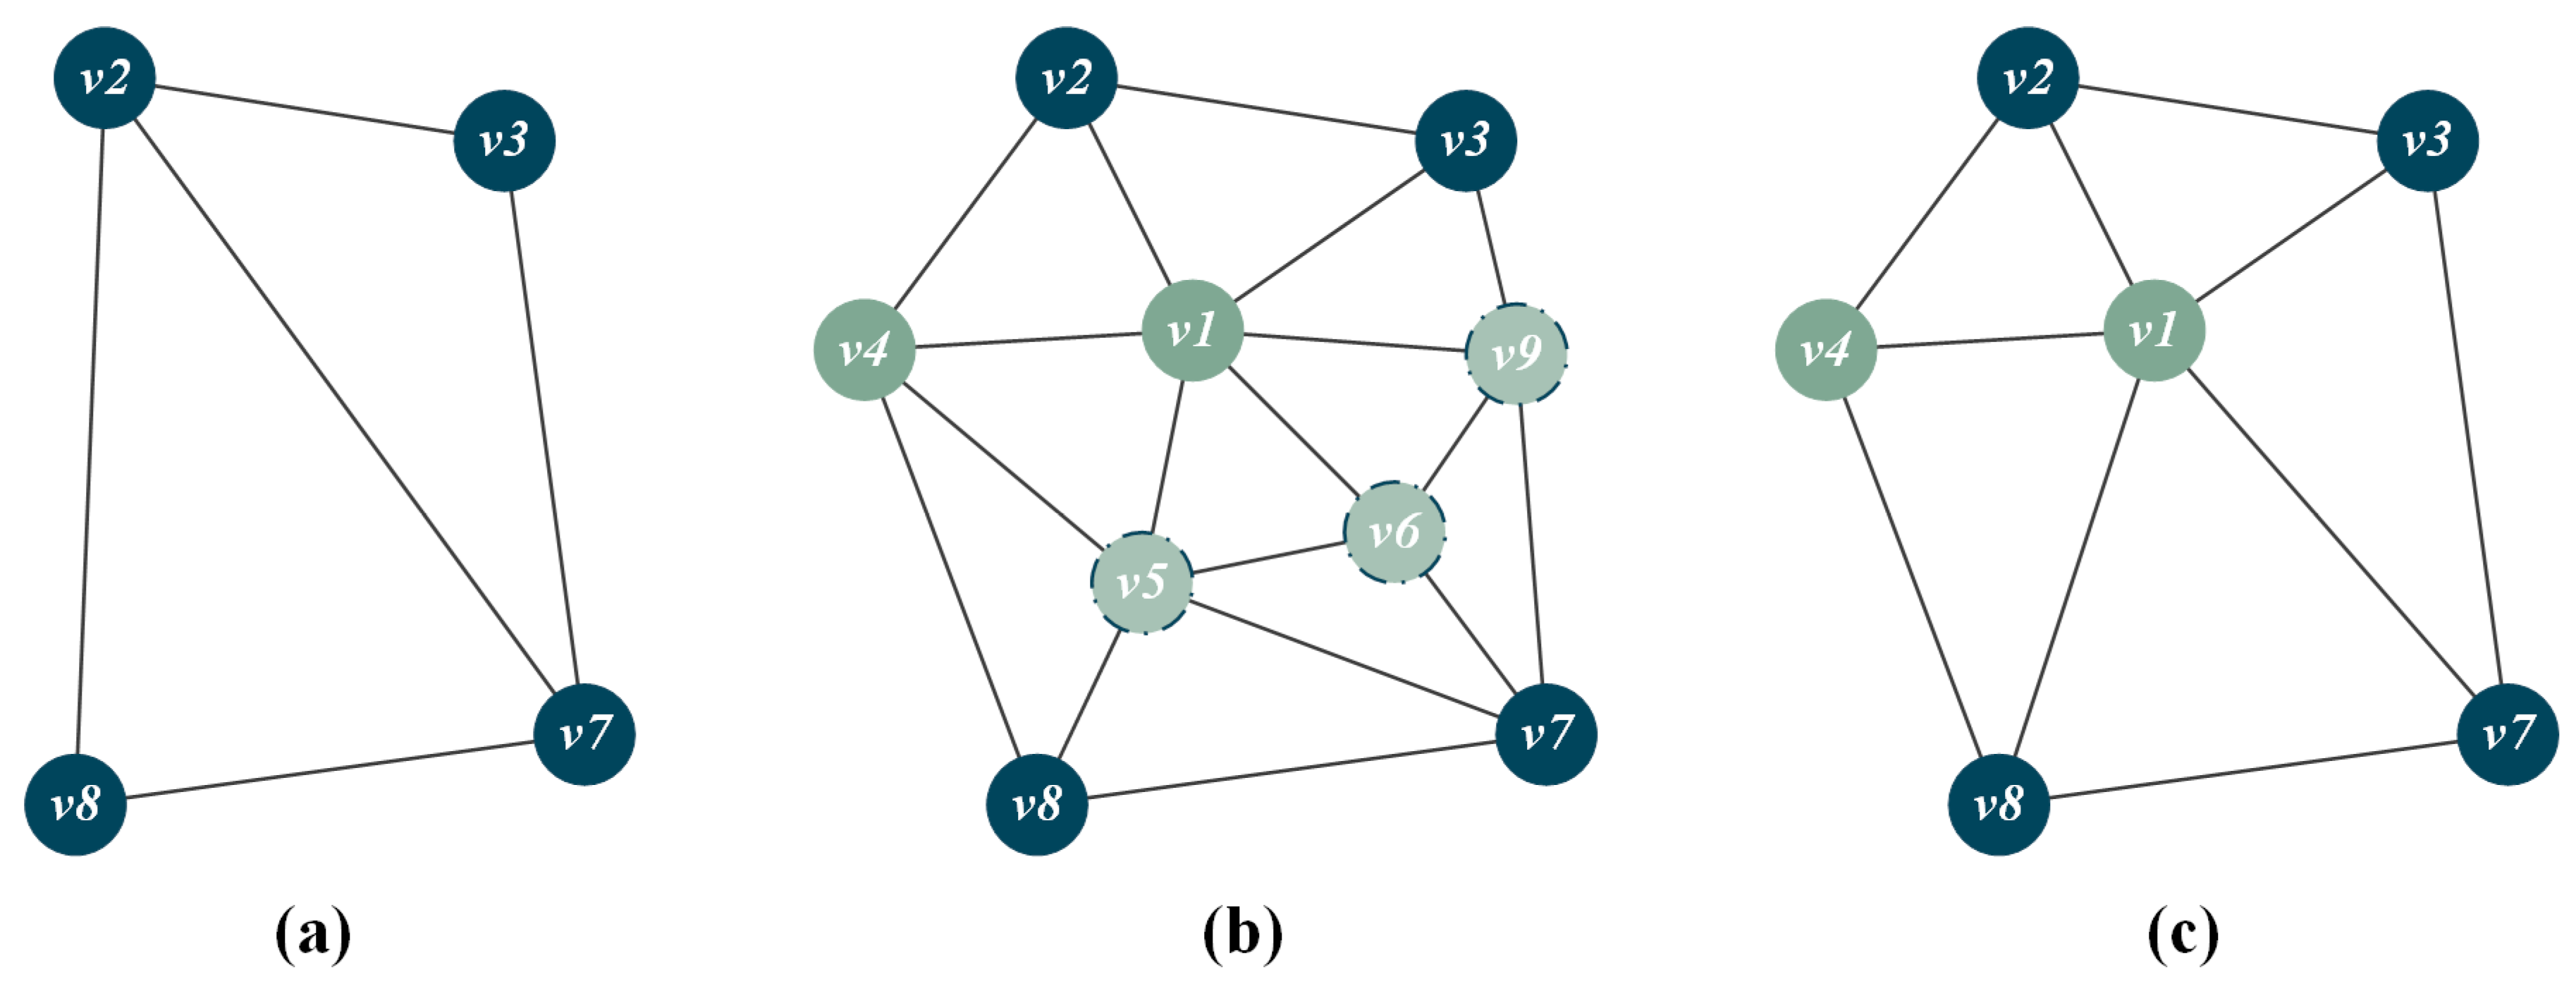
The progressive transmission strategy described in this paper refines models of buildings by the inverse process of multi-level vertex clustering. However, there is a problem of neighborhood dependency in this reverse process. As shown in Figure 3a, suppose that among the four adjacent vertices , , , and , only needs to be split. Vertex splits out its sub-vertices and during the refinement process, whereas , , and have not yet split out their sub-vertices , , and . However, and need to be connected to , , and to form triangular faces, as shown in Figure 3b, which means that , , and must be split with at the same time. The splits of , , and may cause a chain reaction, resulting in the transmission of some data not currently needed and increase the pressure of instantaneous transmission.
The nature of the vertex clustering algorithm is to use the vertex with the highest weight to represent other vertices in a clustering unit. We call the vertex with the highest weight as the representative vertex of other vertices, and the representative relationship can be passed down. During model refinement, if a target vertex does not exist in the current vertex list, it can be temporarily replaced with its representative vertex. As shown in Figure 3c, can temporarily substitute for to form a triangle until splits. Similarly, the connection requirements for and can also temporarily be replaced by and to solve the neighborhood dependency problem during model refinement. Moreover, this idea can be further expanded. Whether the vertices connected by a triangle have changed during the simplification process is not important, but which three vertices the triangle connects in the original model does matter. These three vertices are recorded in the triangle index. When the model is reconstructed, even if these three vertices do not exist in the current vertex list, the triangle can still connect to their representative vertices temporarily. If a triangle is connected to the representative vertex of the vertex recorded by its index, it means that the local mesh has not been refined to the finest state.
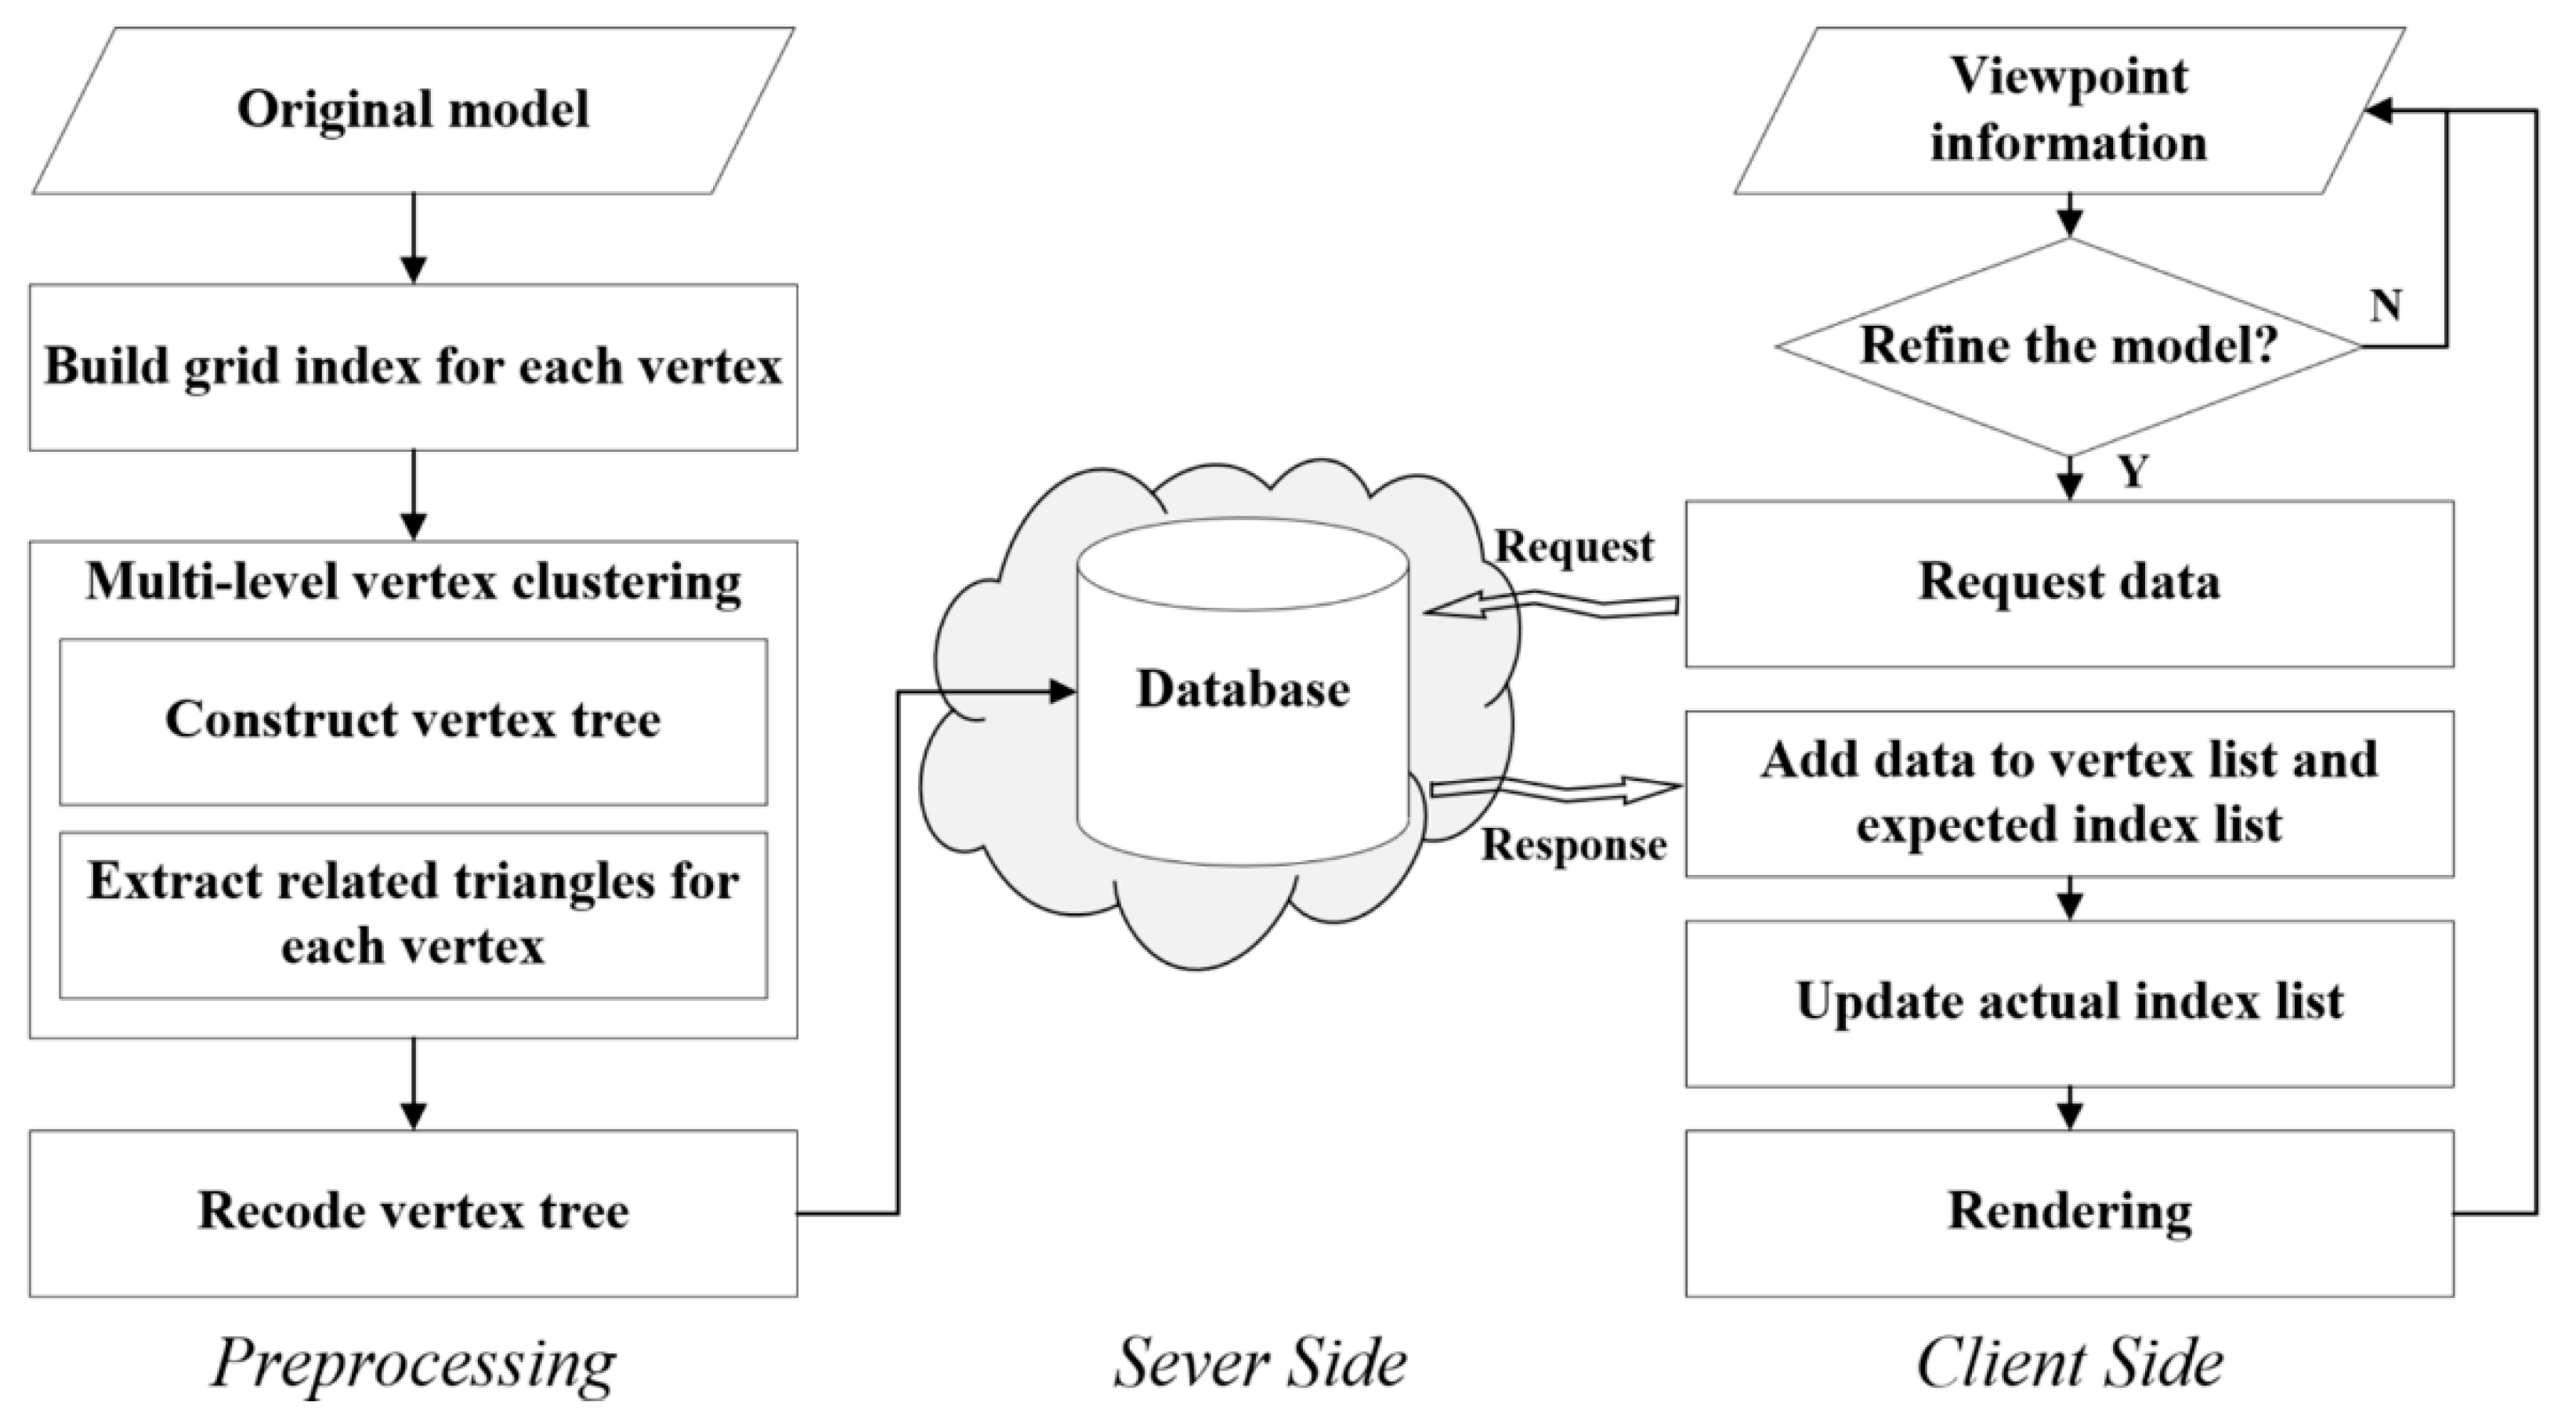
Figure 4 shows the overall flow of the progressive transmission method. In the preprocessing process, the multi-level vertex clustering algorithm was used to simplify the model. During simplification, the vertex tree was constructed, and the related triangles of each vertex were extracted. A vertex and its related triangle set were packed into a data node as the smallest data unit for data storage and transmission. The ID of a node is consistent with the vertex ID it contains, and the parent–child relationship between nodes is consistent with the parent–child relationship between vertices. All data nodes were stored in the database after recoding the vertex tree. In the interaction stage, the coarsest basic model was built first with nodes at the smallest depth. When the viewpoint approaches, vertices are calculated to decide whether to split. If a vertex is to split, its child nodes are requested and then added to the vertex list and triangle index list to achieve model refinement. Further details of this method are described below.
3.3. Construction and Recoding of Vertex Tree
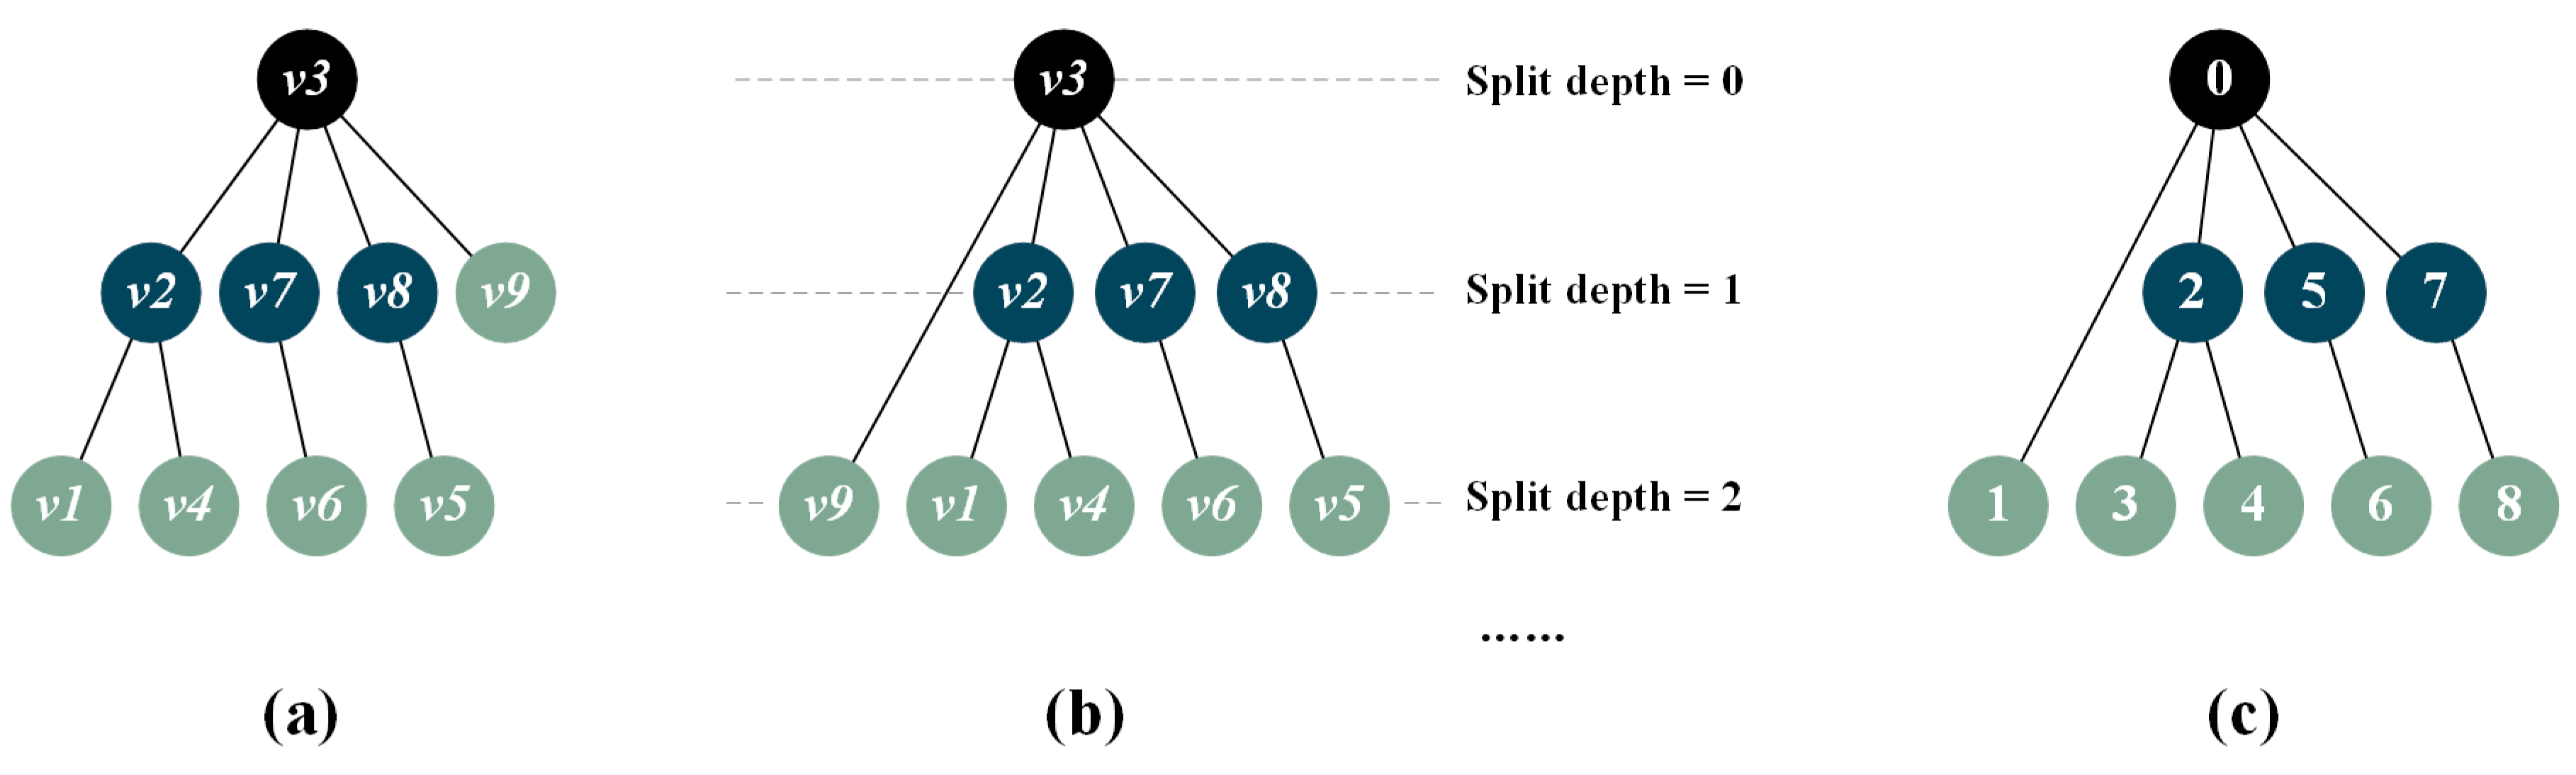
When performing multi-level vertex clustering on a 3D building model, the clustering characteristic vertex is regarded as a parent vertex, and others in the same clustering unit as the child vertices. As shown previously in Figure 2a, vertices and are clustered to , and vertices , , and are clustered to , , and , respectively, in the first vertex clustering process. Vertices , , and are clustered to in the second clustering process. The above two vertex clustering processes can construct the initial vertex tree, as shown in Figure 5a.
In the reconstruction stage, a building model needs to be refined according to the inverse process of vertex clustering. For the first refinement, , , and are split from . For the second refinement, further splits out and , splits out , splits out , and splits out . A large number of parent–child relationships generated in the process of multi-level vertex clustering are needed to complete the refinement, which means that a large number of parent–child relationships must be transmitted as additional data. To avoid this, the IDs of all vertices can be recoded to reflect the parent–child relationship between the vertices through the value of their IDs.
Before recoding, the initial vertex tree, as shown in Figure 5a, needs to be further adjusted. This uses the concept of split depth, which represents the time at which a vertex is split out. For a vertex, its depth in the tree and its split depth may be different. As shown in Figure 5a, the depth of in the tree is 1, and the split depth is 2. In order to quickly find the representative vertex of a vertex according to their IDs in the model reconstruction stage, it is necessary to follow this principle when recoding. If the tree depth is the same, the vertices with greater split depth should be coded first. Therefore, in Figure 5a needs to be moved to the left of , as shown in Figure 5b.
After adjusting the vertex tree, it is coded from small to large in the order of preorder traversal. As shown in Figure 5c, in Figure 5b becomes vertex 0 in Figure 5c, and becomes vertex 1. Such a recoding method can ensure that the representative vertex of a target vertex can be quickly found if the target vertex does not exist in the current vertex list. The representative vertex is the vertex with the largest ID among vertices whose IDs are less than that of the target vertex. In Figure 5c, if vertex 0 splits out vertex 2, vertex 5, and vertex 7, and the next split operation has not been performed, the representative vertex of vertex 1 that we can quickly find in the current vertex list is vertex 0.
3.4. Extracting Related Triangles of Each Vertex
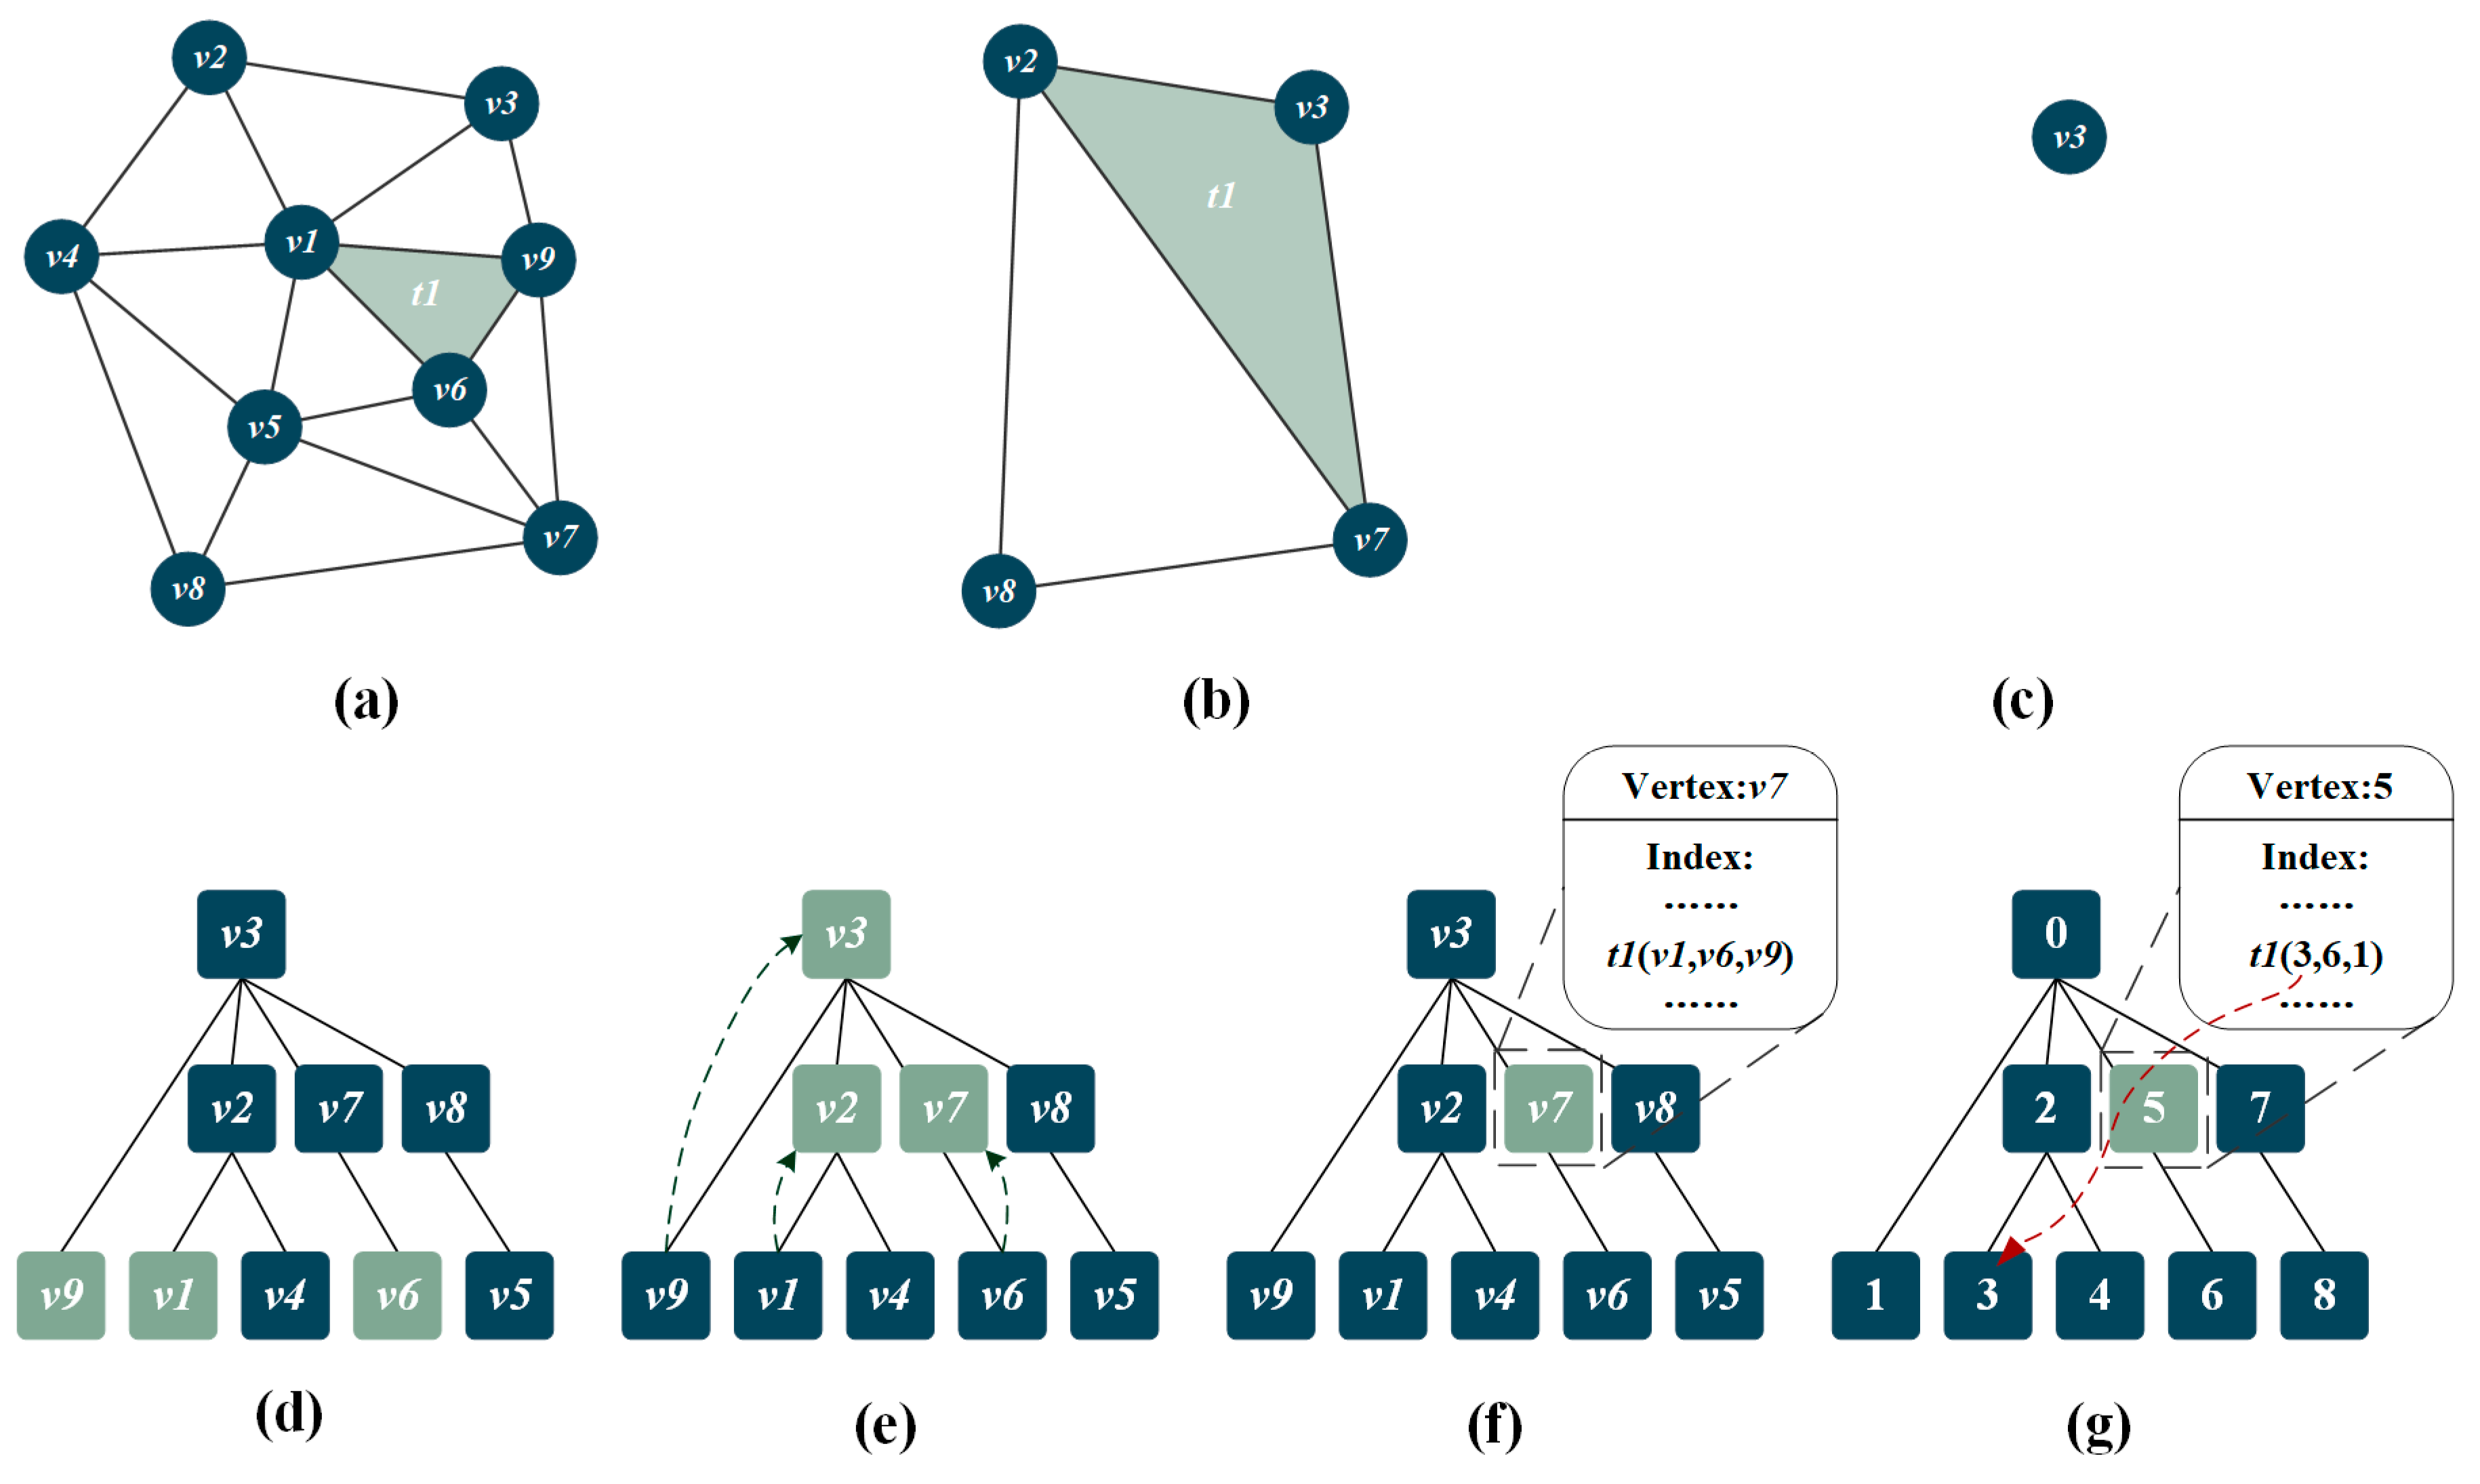
The related triangles of a vertex refer to the triangles that need to be transmitted to the client along with the vertex to refine the model of the building in the reconstruction stage. In the original model, a triangle connects three vertices. This triangle is placed into the related triangle set of these three vertices in the initial state. For example, the triangle shaded green in Figure 6a will be recorded in the related triangle set of , , and , as shown in Figure 6d. The green data nodes in Figure 6d–f represent the storage location of .
Suppose triangle , which is in the related triangle set of vertex , does not collapse into an edge or a vertex after vertex has been clustered to vertex . The transfer of from the related triangle set of to is required. As shown in Figure 6b, does not collapse after the first clustering procedure. Therefore, should be transferred from the related triangle set of ,, and to that of ,, and as shown in Figure 6e. It should be noted that only the storage location of changes from Figure 6d to Figure 6e. Although the three vertices connected by constantly change during the vertex clustering process, the vertices recorded by are always , , and , which are used for storage and transmission. If such transfers are not made, for example, refining a building model from a coarser state (Figure 6c) to the state of Figure 6b will create a hole because there is no triangle index connecting to , , and in the original model. If the triangle index can be transmitted to the client in advance along with any vertex in , , or , since , , and do not exist in the current vertex list, will connect to their representative vertices , , and to fill this hole.
After the multi-level vertex clustering simplification process, a triangle index is recorded in related triangle sets of three vertices, which is a waste of storage and transmission resources. The triangle index can only be stored in the related triangle set of any vertex with the largest split depth. As shown in Figure 6f, after deleting the redundant storage, is only stored in the related triangle set of . As mentioned above, recoding will be performed after multi-level vertex clustering. During the recoding process, the index changes synchronously with the encoding of the vertex. Figure 6g shows a node tree that is finally stored in the database.
3.5. Data Scheduling and Model Refinement
In the model refinement stage, many calculations are required to judge whether it should be split and which depth should split to vertex by vertex. There are a large number of vertices that are close to each other in space, whether they should be split and the depth to which they should be split may be the same. Therefore, a grid index [31] was constructed for all vertices of the 3D building model before multi-level vertex clustering. The vertices of the building model were divided into several parts according to their coordinates and the bounding rectangles of each part were recorded. During interaction, these bounding rectangles are regarded as the index space of each part. If the current viewpoint is close to an index space and it is determined that the mesh within this index space needs to be refined, all vertices within will be split.
In the simplification process of multi-level vertex clustering for 3D building models, the data were reorganized and recoded. Figure 7 shows a forest, which is the reorganized data form of the 3D building model and has been stored in the database, composed of several node trees. When interacting with a 3D scene, all vertices with the smallest split depth and their related triangles are loaded first to construct the coarsest basic 3D building model. During the movement of the viewpoint, it is determined whether the vertices in each index space need to be split further according to whether each index space is in the viewing frustum [32], whether each index space is occluded [33], and the distance from the index space to the viewpoint. If there are vertices that need to be split further, the required vertices and their related triangle sets are requested from the server side, as shown in Figure 7. The dark blue nodes represent the data nodes that need to be transmitted from the current viewpoint.
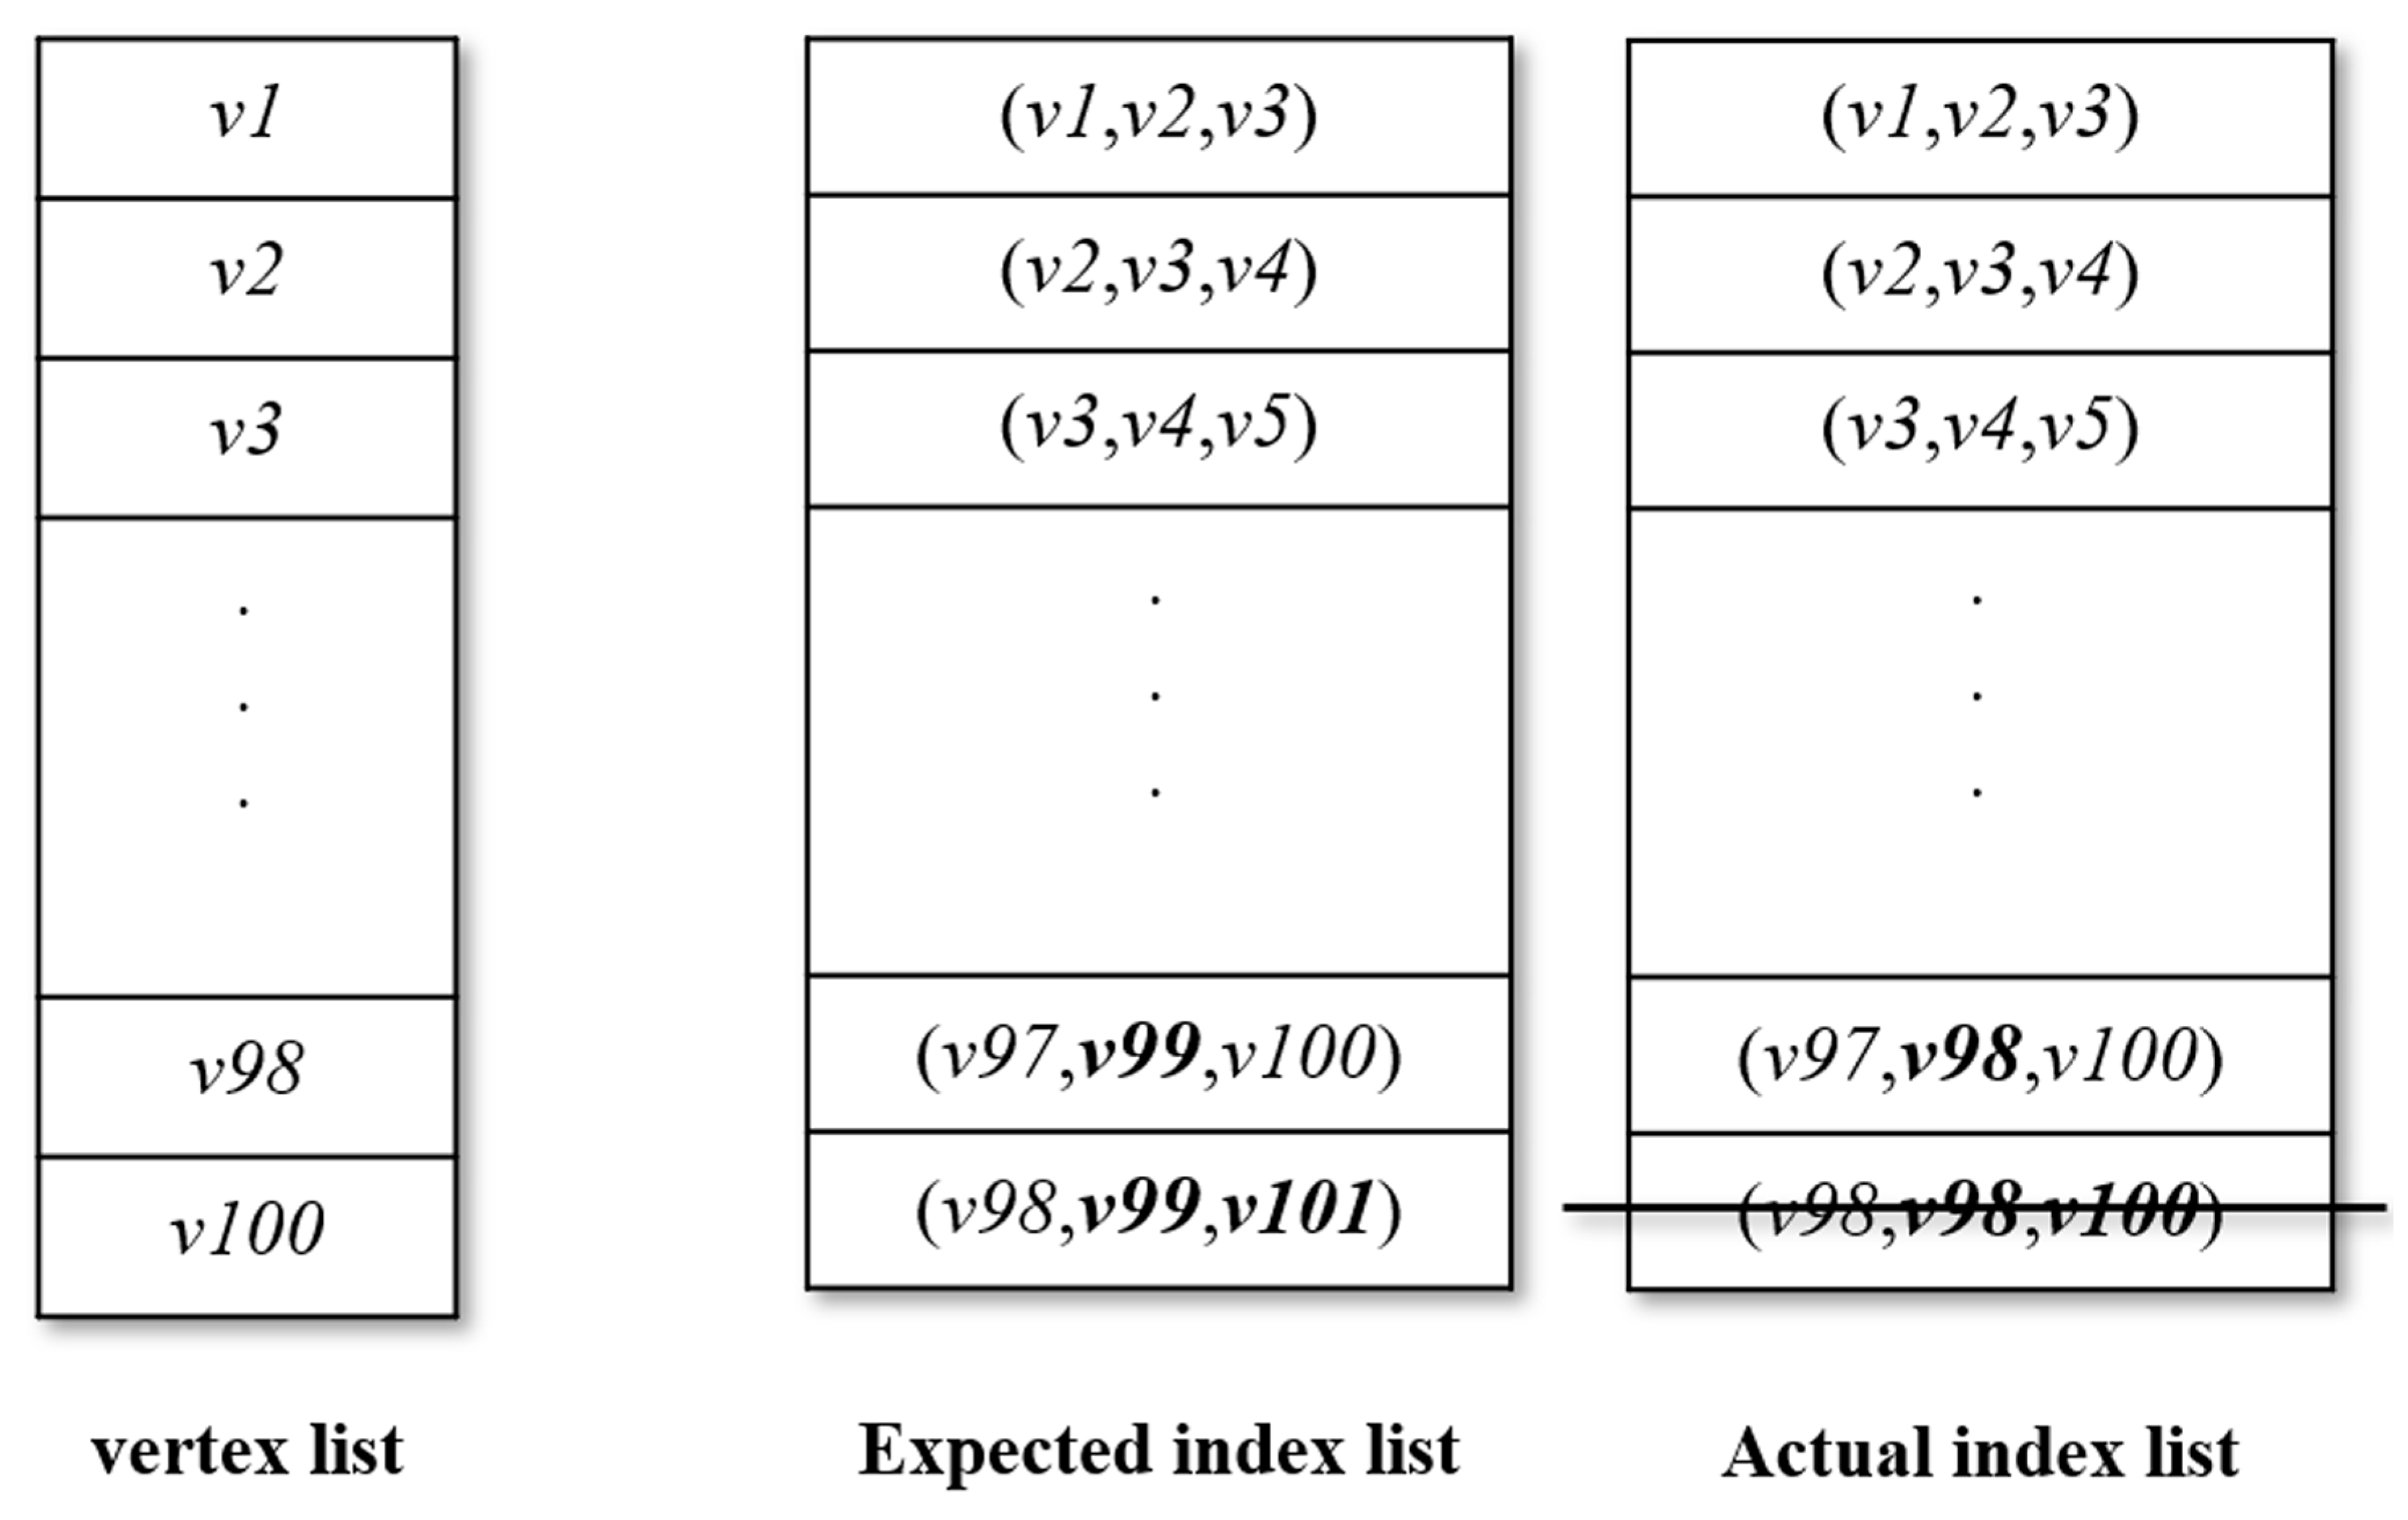
The client maintains three lists: A vertex list, an expected index list, and an actual index list. The expected index list stores the index requested from the server side, and the actual index list stores the adjusted indexes used for rendering the model. All vertex data transmitted to the client will be stored in the vertex list, and the index data will be stored in the expected index list. If a vertex in the expected index list does not exist in the current vertex list, the vertex with the largest encoding among vertices smaller than this vertex in the current vertex list is taken as its representative vertex to temporarily replace it. Consequently, the actual index list can be obtained. As shown in Figure 8, in the expected index list, and , which do not exist in the current vertex list, need to be replaced by their representative vertices and . After all replacements have been made, since has collapsed into an edge, it can be removed from the actual index list. Finally, the vertex list and the actual index list are used to render the building model.
4. Experiments
4.1. Overview
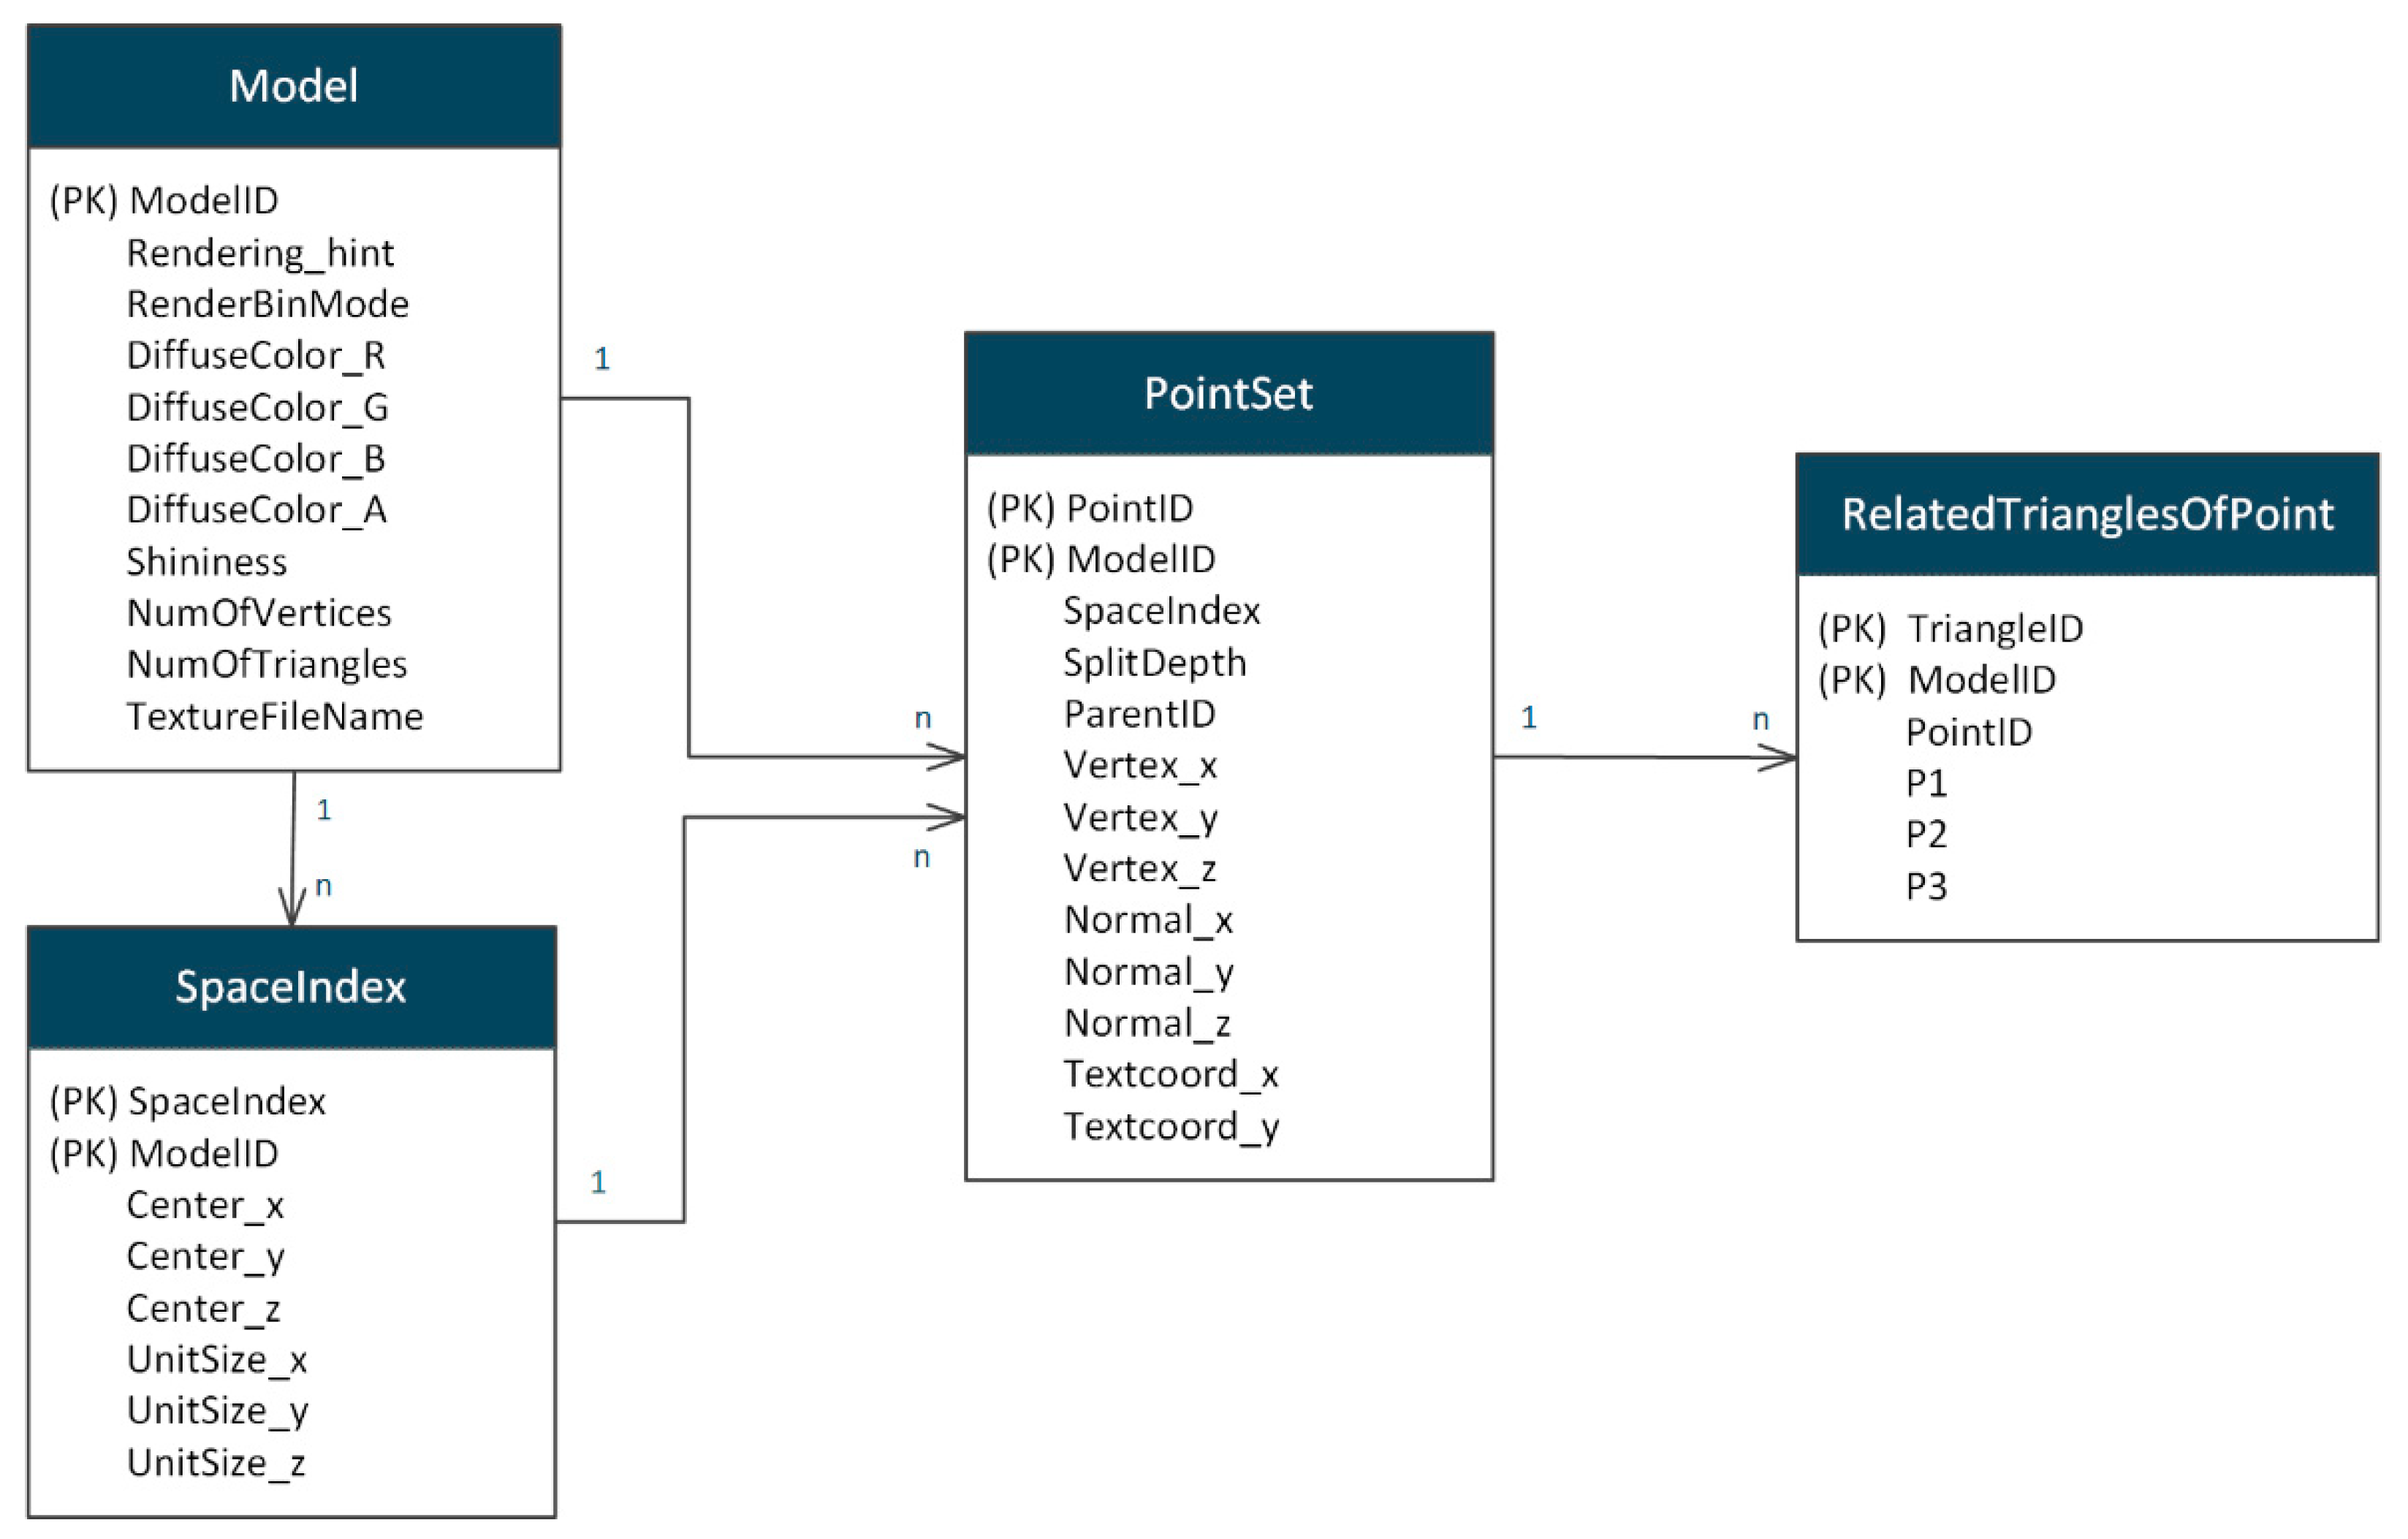
To verify the feasibility and efficiency of our method, a prototype system was designed. This includes three parts: The preprocessing program, the server-side, and the client. The preprocessing program was designed and implemented with a graphics toolkit called OpenSceneGraph (OSG) [34]. This preprocessing program was used to build a grid index for each vertex of the model, perform model simplification and reorganize data, and finally store the data in the server-side database. The server side uses the SQL Server database, which contains four tables to store building model metadata, grid index, vertex data, and related triangle index data. The relationship between them is shown in Figure 9. The client is used to request data and reconstruct the building models. The client program was also designed and implemented based on OSG on a PC with a 1.80GHz Intel Core i7-8550 CPU, 8G of RAM, and an NVIDIA GeForce MX150 GPU. It mainly includes two threads, one for data scheduling and the other for model rendering.
The experimental data includes five models, covering various types such as ancient building, modern building, single building, and building group. All models are made by 3ds Max. The experiment performed 4 levels vertex clustering simplification for these models, which means that the split depth of the vertices stored in the database ranges from 0 to 5. The basic information of these models is shown in Table 1.
4.2. View-Dependent Effects
Because we can only see the front of a modeled building from a specific viewpoint, it is not necessary to request the data at the same time to complete the refinement of the back. Therefore, the realization of view-dependent data transmission and model refinement, which can avoid requests for currently unnecessary data, can effectively reduce the amount of instantaneous data transmission.
Our method overcomes the neighborhood dependency so that each vertex can be split freely without constraints, thus realizing view-dependent data transmission and model refinement. In the experiment, to avoid unnecessarily repeated judgments, a grid index was built for each complex 3D building model and used each index space as a unit to determine whether the vertices in each needed to be split further. Although this expands the minimum granularity of judgment from a vertex to a local index space, it still maintains the advantages of view-dependent data transmission and model refinement. It also realizes the asynchronous transmission of front and back face data of the building model from a certain viewpoint.
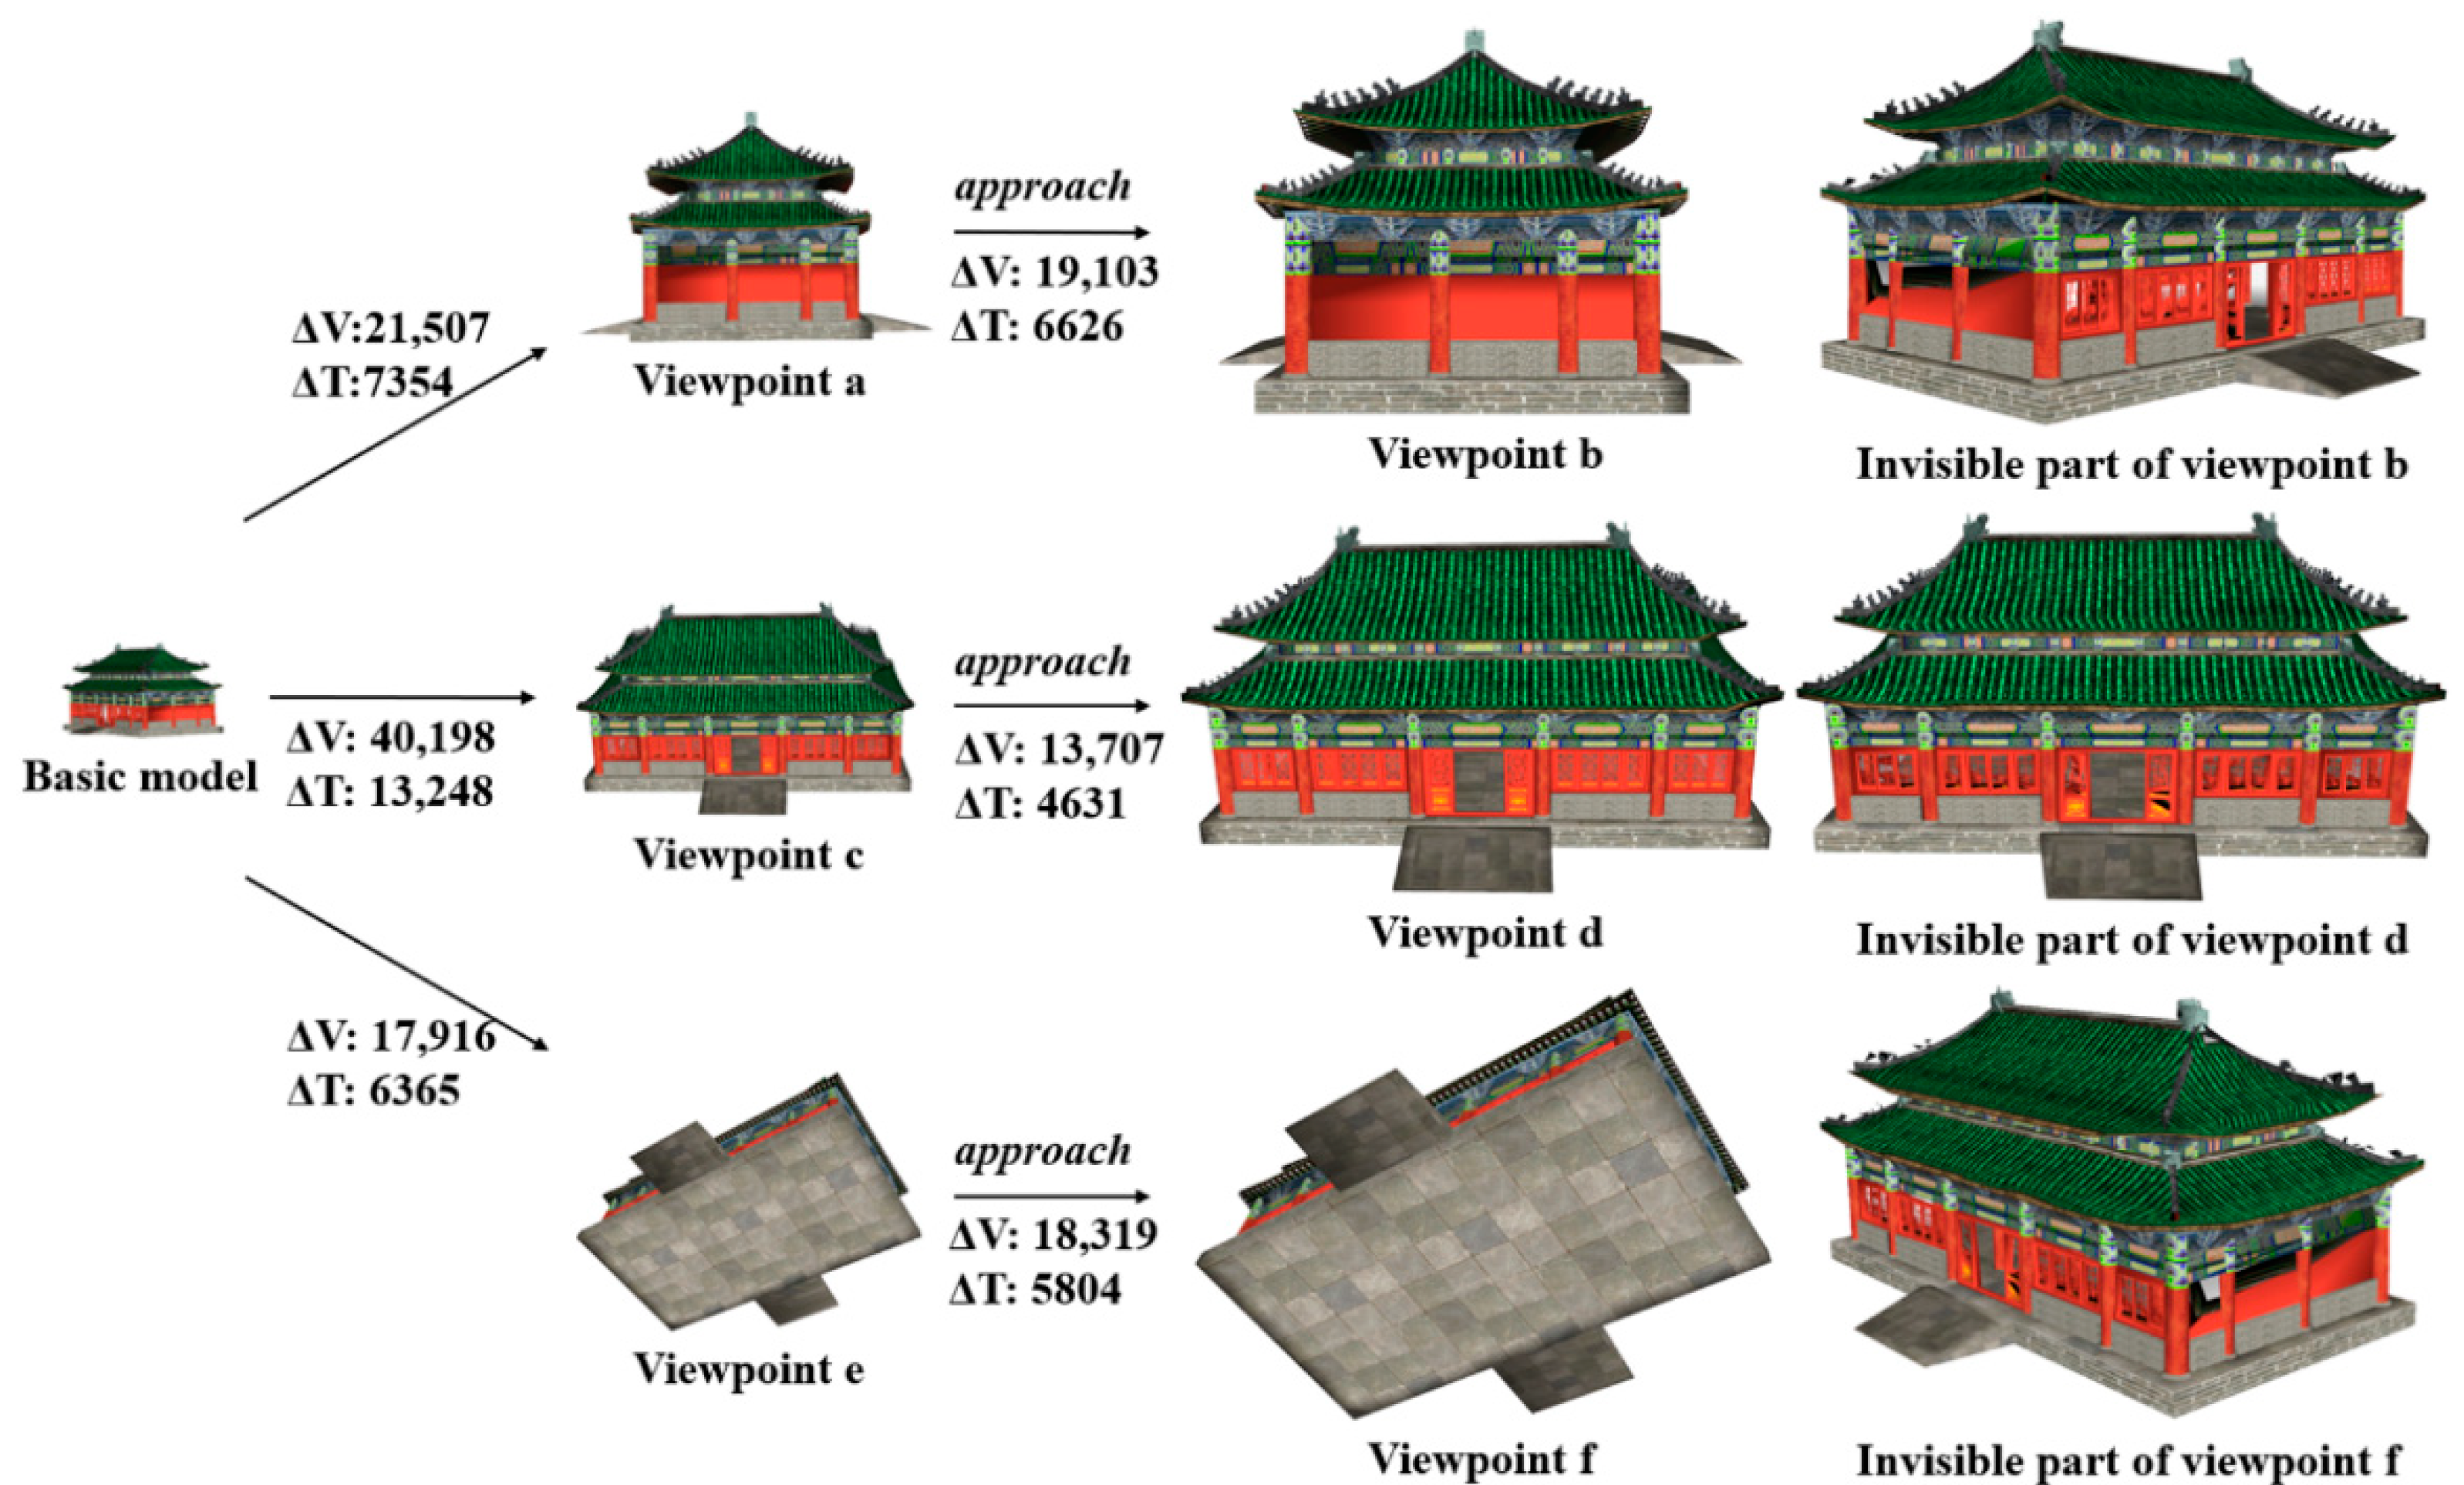
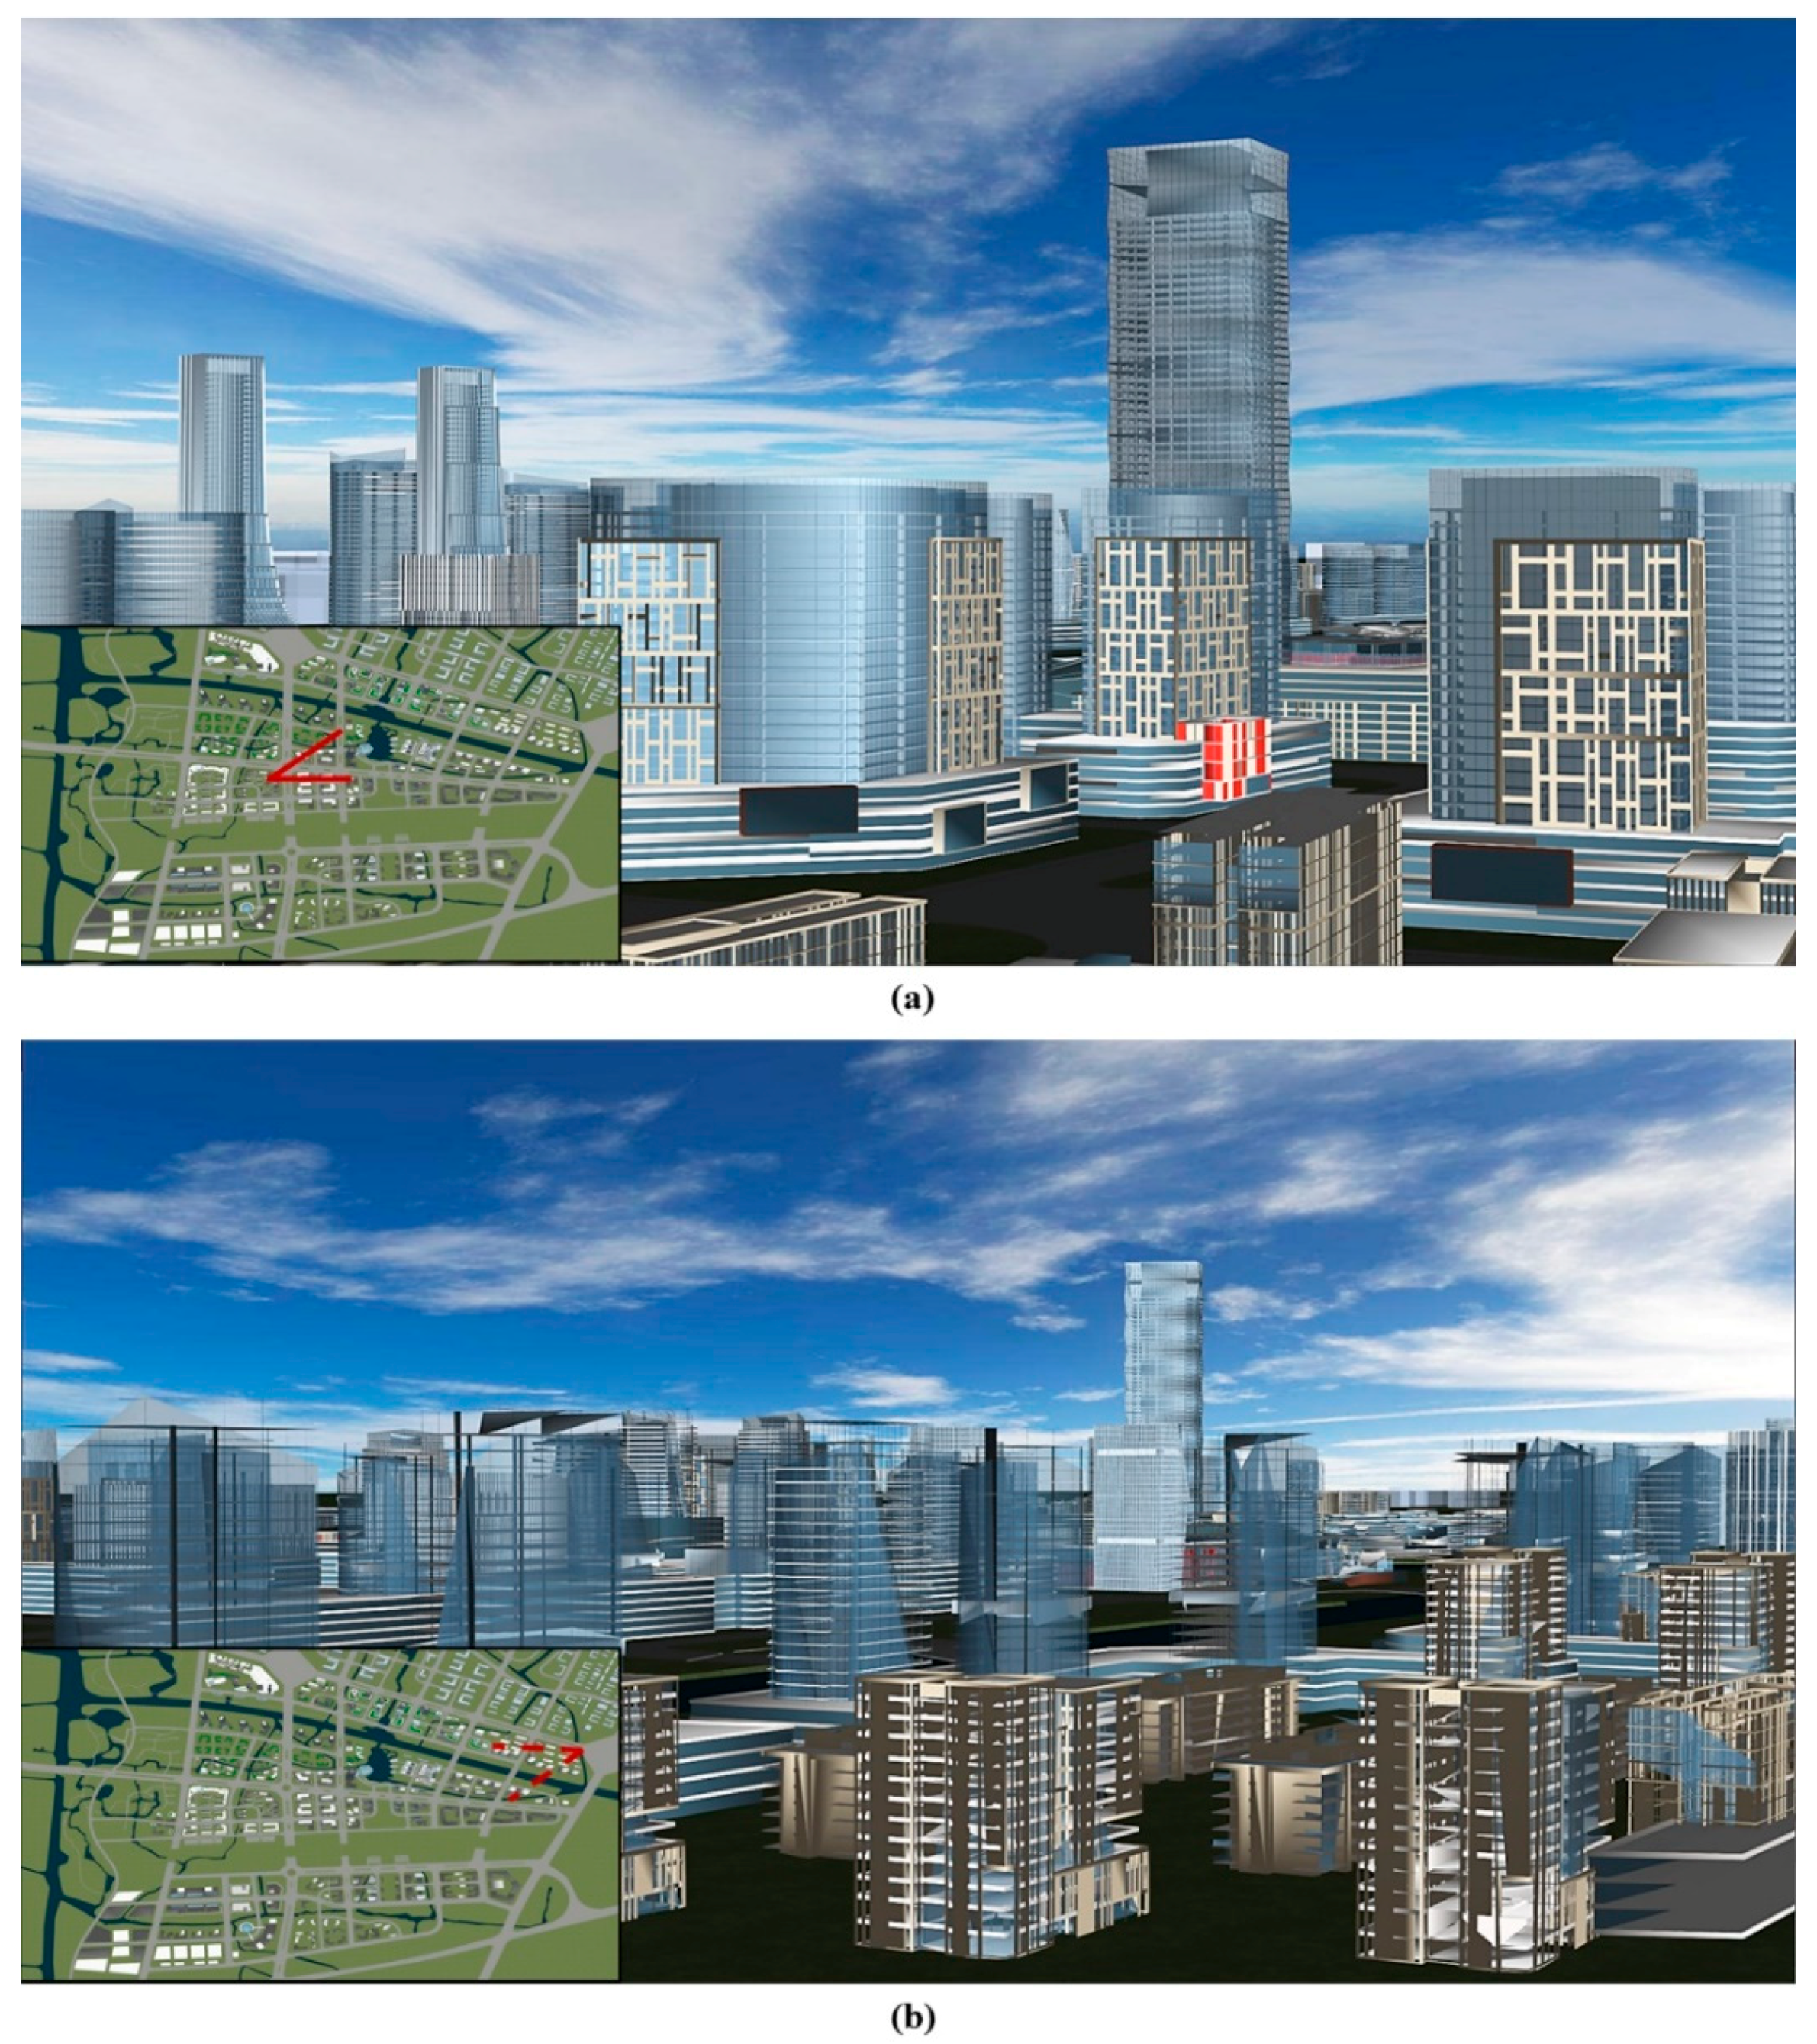
Figure 10 shows the amount of data transmitted from different viewpoints and rendering effects. From the initial viewpoint to viewpoint a, 21,507 vertices and 7354 triangle indices are added to the basic model. As the viewpoint approaches, 19,103 vertices and 6626 triangle indices are transmitted to meet the rendering requirements, and all the details of the model have been fully refined under viewpoint b. However, the invisible part of viewpoint b is still in a coarse state where doors, window frames, eaves, and walls are still obviously deformed. Other viewpoint movement processes also show the same effects. Figure 11a shows the urban scene observed from the current viewpoint. It can be seen that the structures of buildings were well refined. However, the city observed from the other end is still in a coarse state at this moment, as shown in Figure 11b.
4.3. Performance Analysis
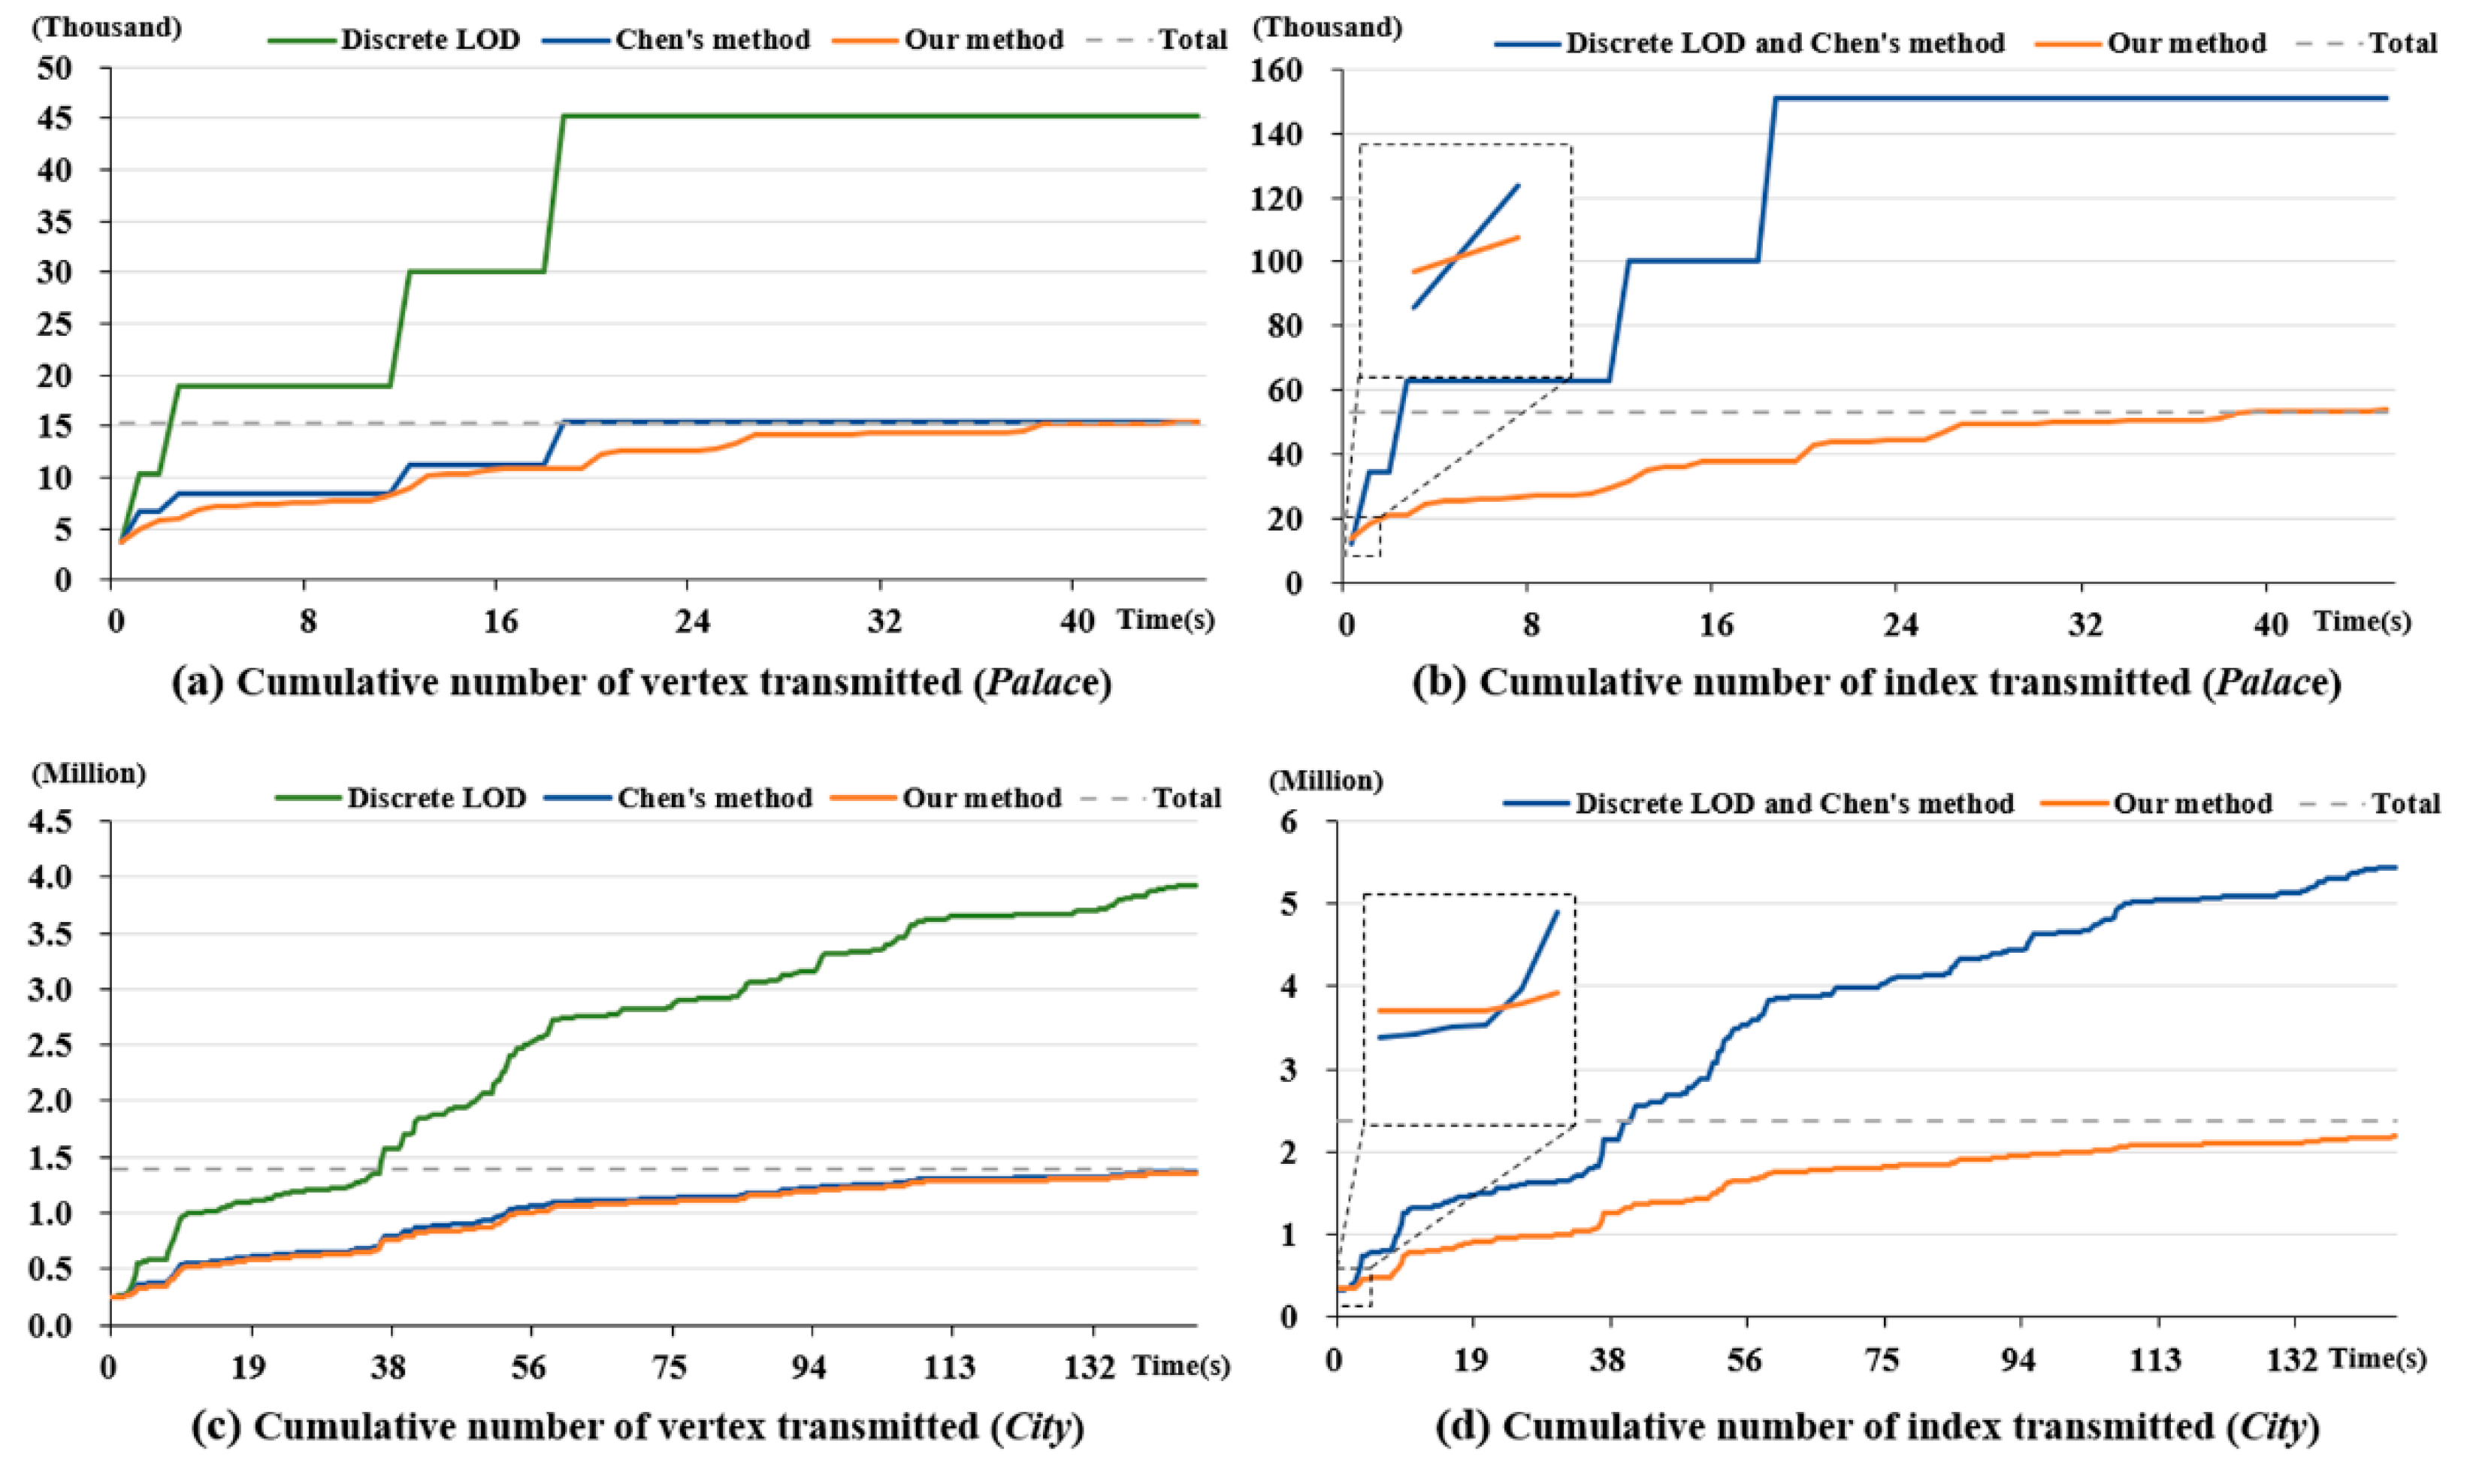
Our method was compared against the traditional discrete LOD method, as well as the method proposed by Chen, Li, and Li [7]. From the perspective of efficiency, our method realizes the full reuse of vertex data and triangle index data, and effectively reduces the redundancy of transmission data in the process of model refinement. Table 2 lists the cumulative transmitted data volume with these methods. To compare the differences in detail, we show the complete transmission process of the palace and city models in Figure 12.
Figure 12a shows the vertex data transmission of the palace model. From the perspective of total transmission volume, since both our method and Chen’s method realize the reuse of vertex data, the cumulative number of vertex data transmitted is significantly less than that of the discrete LOD method. From the perspective of the growth of data transmission, Chen’s method and the traditional discrete LOD method have obvious jumps. The curve of our method is smoother compared with the other two, with the result that our method realizes the view-dependent transmission to avoid the split of vertices in some invisible areas rather than refines the model as a whole. This means a lower instantaneous transmission pressure. Figure 12c shows the vertex data transmission of the city model. Again, the cumulative amount of vertex data transmitted by the traditional LOD method is much larger. Because there are many building models in the urban scene, and the level of details of each building model is not consistent at the same time, the transmission curves of the three methods are smoother than those of the single complex building model. However, the vertex number of instantaneous transmission of our method is still less than that of the other two methods.
Figure 12b,d shows the transmission curves of the index data for the three methods. Because neither the traditional discrete LOD method nor Chen’s method realizes the reuse of triangle index data, their cumulative transmission volume is the same, and much larger than our method. From the perspective of the growth of data transmission, it is similar to the situation of vertex data transmission that the index data transmitted curve of our method appears to be smoother. However, in the initial stage, the number of index data transmitted by our method will be slightly higher than that of the other two methods, as depicted in the dotted windows. This is for the reason that triangle indices from the related triangle set of vertices with large split depth were transferred to those of vertices with small split depth during the simplification stage. Thus, the storage locations of some triangle indexes "float up" in the node tree. The vertices in split depth 0 may store some triangle indices that are not originally adjacent to themselves in their related triangle set. Experimental results show that this increment does not cause a significant increase in the number of indexes transmitted when the initial coarse model is loaded. In addition, with our method, the cumulative number of index transmitted as shown in Table 2 may be a few more than index number of the original model. This is for the reason that the grid index is built. Before reducing index storage redundancy, the triangle index is recorded in the related triangle set of three vertices. Since the three vertices may not be in the same grid index space, the triangle index will be recorded in the related triangle set of any vertex with the largest split depth in each grid index space.
When rendering the 3D scene, the actual index list is constantly updated according to the status of the vertex list. Our recoding scheme limits the performance cost of this update process. Table 3 shows the detailed refinement delay time in the LAN environment. The refinement delay time refers to the total time of the data request, data transmission, and the index list update process. The short average delay time proves that our method is highly efficient in data scheduling. As to rendering performance, the client program was tested on a PC with an NVIDIA GeForce MX150 GPU, which is a common GPU. During the interaction process of approximately 45 s, the average frame rate of the palace model reached 202 FPS. The data volume of the city model is larger, and the number of rendered primitives is more than 40 times that of the palace model. During the interaction process of approximately 149 s, the average frame rate of the city model reached 91 FPS. Table 4 lists the detailed frame rate data of all models on MX150 GPU. The experimental results show that our method can maintain the frame rate at a high level to meet the needs of interaction with a large range of 3D scenes.
5. Conclusions
This paper introduces a novel progressive transmission method for 3D building models. Representative relationships among vertices were established through the process of multi-level vertex clustering. These relationships are reflected by the encodings of vertices. In the model reconstruction stage, if a triangle index in the current index list contains a vertex that has not yet been transmitted to the client, this triangle could connect to the representative vertex of this vertex temporarily for model rendering. The experimental results show that the proposed method achieves the view-dependent data transmission and refinement, as well as the reuse of previously transmitted data. Compared with traditional methods, the number of real-time transmission data is significantly reduced. The low latency and high frame rates prove that the model refinement process is efficient enough to meet the needs of users for real-time interaction with the 3D scene.
However, some limitations should be addressed through further research. The proposed method realizes the progressive transmission of geometric data, but transmits texture images independently in advance. Numerous high-resolution texture images will take a long time to transmit before loading the geometric data. Therefore, the synchronous progressive transmission of the geometry and texture data still needs to be explored. Second, visual popping still exists in the process of model refinement. The process from requesting increment data to completing the model refinement will consume time inevitably. Optimizing this process can relieve but not eliminate visual popping. Utilizing idle bandwidth to cache some data in advance, like a video buffer, will reduce the sense of popping when the viewpoint changes but is still a challenge.
Author Contributions
Conceptualization, Yuchang Sun; methodology, Yuchang Sun and Jiangfeng She; software, Yuchang Sun; validation, Jingsong Ma; writing—original draft preparation, Yuchang Sun; writing—review and editing, Jingsong Ma and Yuchang Sun; visualization, Qiang Zhao and Lixia He; project administration, Jiangfeng She; funding acquisition, Jiangfeng She. All authors have read and agreed to the published version of the manuscript.
Funding
This research was funded by National Natural Science Foundation of China, grant number 41871293.
Data Availability Statement
The data presented in this paper are openly available at http://doi.org/10.5281/zenodo.4662454 (accessed on 2 February 2021).
Acknowledgments
Thanks to the website http://www.cadnav.com/ and http://www.720ku.net/ (accessed on 2 February 2021) for providing the free building models.
Conflicts of Interest
The authors declare no conflict of interest.
References
- Döllner, J.; Buchholz, H. Continuous level-of-detail modeling of buildings in 3D city models. In Proceedings of the 13th Annual ACM International Workshop on Geographic Information Systems, Arlington, VA, USA, 12–13 November 2004; pp. 173–181. [Google Scholar]
- Lin, H.; Zhu, Q. Virtual Geographic Environments; CRC Press: Boca Raton, FL, USA, 2005. [Google Scholar]
- Valkanova, N.; Jorda, S.; Moere, A.V. Public visualization displays of citizen data: Design, impact and implications. Int. J. Hum. Comput. Stud. 2015, 81, 4–16. [Google Scholar] [CrossRef] [Green Version]
- Ren, J.; Chen, X.; Zheng, Z. Future Prospects of UAV Tilt Photogrammetry Technology. In IOP Conference Series: Materials Science and Engineering; IOP Publishing: Yunnan, China, 2019; p. 032023. [Google Scholar]
- Schwarz, B. Mapping the world in 3D. Nat. Photonics 2010, 4, 429–430. [Google Scholar] [CrossRef]
- Luebke, D.; Reddy, M.; Cohen, J.D.; Varshney, A.; Watson, B.; Huebner, R. Level of Detail for 3D Graphics; Morgan Kaufmann: San Francisco, CA, USA, 2003. [Google Scholar]
- Chen, J.; Li, J.; Li, M. Progressive visualization of complex 3D models over the internet. Trans. GIS 2016, 20, 887–902. [Google Scholar] [CrossRef]
- Rossignac, J.; Borrel, P. Multi-resolution 3D approximations for rendering complex scenes. In Modeling in Computer Graphics; Springer: Berlin/Heidelberg, Germany, 1993; pp. 455–465. [Google Scholar]
- Schroeder, W.J.; Zarge, J.A.; Lorensen, W.E. Decimation of triangle meshes. In Proceedings of the 19th Annual Conference on Computer Graphics and Interactive Techniques, Anaheim, CA, USA, 21–25 July 2013; pp. 65–70. [Google Scholar]
- Hoppe, H.; DeRose, T.; Duchamp, T.; McDonald, J.; Stuetzle, W. Mesh optimization. In Proceedings of the 20th Annual Conference on Computer Graphics and Interactive Techniques, Anaheim, CA, USA, 2–6 August 1993; pp. 19–26. [Google Scholar]
- Hinker, P.; Hansen, C. Geometric optimization. In Proceedings Visualization’93; IEEE: San Jose, CA, USA, 1993; pp. 189–195. [Google Scholar]
- Garland, M.; Heckbert, P.S. Surface simplification using quadric error metrics. In Proceedings of the 24th Annual Conference on Computer Graphics and Interactive Techniques; ACM Press: New York, NY, USA, 1997; pp. 209–216. [Google Scholar]
- Garland, M.; Heckbert, P.S. Simplifying surfaces with color and texture using quadric error metrics. In Proceedings of the Proceedings Visualization’98 (Cat. No. 98CB36276); IEEE: Research Triangle Park, NC, USA, 1998; pp. 263–269. [Google Scholar]
- Zhao, J.; Zhu, Q.; Du, Z.; Feng, T.; Zhang, Y. Mathematical morphology-based generalization of complex 3D building models incorporating semantic relationships. ISPRS J. Photogramm. Remote Sens. 2012, 68, 95–111. [Google Scholar] [CrossRef]
- Li, Q.; Sun, X.; Yang, B.; Jiang, S. Geometric structure simplification of 3D building models. ISPRS J. Photogramm. Remote Sens. 2013, 84, 100–113. [Google Scholar] [CrossRef]
- She, J.; Gu, X.; Tan, J.; Tong, M.; Wang, C. An appearance-preserving simplification method for complex 3D building models. Trans. GIS 2019, 23, 275–293. [Google Scholar] [CrossRef]
- Xia, J.C.; Varshney, A. Dynamic view-dependent simplification for polygonal models. In Proceedings of the Seventh Annual IEEE Visualization’96, San Francisco, CA, USA, 27 October–1 November 1996; pp. 327–334. [Google Scholar]
- Hoppe, H. View-dependent refinement of progressive meshes. In Proceedings of the 24th Annual Conference on Computer Graphics and Interactive Techniques, Los Angeles, CA, USA, 3–8 August 1997; pp. 189–198. [Google Scholar]
- Luebke, D.; Erikson, C. View-dependent simplification of arbitrary polygonal environments. In Proceedings of the 24th Annual Conference on Computer Graphics and Interactive Techniques; ACM Press: New York, NY, USA, 1997; pp. 199–208. [Google Scholar]
- Pajarola, R. Fastmesh: Efficient view-dependent meshing. In Proceedings of the Ninth Pacific Conference on Computer Graphics and Applications, Tokyo, Japan, 16–18 October 2001; pp. 22–30. [Google Scholar]
- Pajarola, R.; DeCoro, C. Efficient implementation of real-time view-dependent multiresolution meshing. IEEE Trans. Vis. Comput. Graph. 2004, 10, 353–368. [Google Scholar] [CrossRef] [PubMed]
- Hu, L.; Sander, P.V.; Hoppe, H. Parallel view-dependent refinement of progressive meshes. In Proceedings of the 2009 Symposium on Interactive 3D Graphics and Games; ACM Press: Boston, MA, USA, 2009; pp. 169–176. [Google Scholar]
- Derzapf, E.; Guthe, M. Dependency-free parallel progressive meshes. In Proceedings of the Computer Graphics Forum; Blackwell Publishing: Oxford, UK, 2012; pp. 2288–2302. [Google Scholar]
- Yang, S.; Kim, C.-S.; Kuo, C.-C. A progressive view-dependent technique for interactive 3-D mesh transmission. IEEE Trans. Circuits Syst. Video Technol. 2004, 14, 1249–1264. [Google Scholar] [CrossRef]
- Gao, Y.; Jia, J.; Xiang, Y. An improved progressive mesh and streaming transmission strategy. In Proceedings of the 2012 2nd International Conference on Computer Science and Network Technology, Changchun, China, 29–31 December 2012; pp. 2024–2028. [Google Scholar]
- Yang, B.-L.; Li, F.W.; Pan, Z.-G.; Wang, X. An effective error resilient packetization scheme for progressive mesh transmission over unreliable networks. J. Comput. Sci. Technol. 2008, 23, 1015–1025. [Google Scholar] [CrossRef]
- Xukun, S.; Xuewei, Z.; Qinping, Z. Feature-Preserved Progressive Texture-Mesh in Digital Museum. J. Comput. Res. Dev. 2007, 44, 1097. [Google Scholar]
- Kada, M. Progressive transmission of 3D building models based on string grammars and planar half-spaces. ISPRS Ann. Photogramm. Remote Sens. Spat. Inf. Sci. 2014, 2, 9. [Google Scholar] [CrossRef] [Green Version]
- Liu, X.; Xie, N.; Tang, K.; Jia, J. Lightweighting for Web3D visualization of large-scale BIM scenes in real-time. Graph. Models 2016, 88, 40–56. [Google Scholar] [CrossRef]
- Chen, J.; Li, M.; Li, J. An improved texture-related vertex clustering algorithm for model simplification. Comput. Geosci. 2015, 83, 37–45. [Google Scholar] [CrossRef]
- Abdul-Rahman, A.; Pilouk, M. Spatial Data Modelling for 3D GIS; Springer Science & Business Media: Berlin, Germany, 2007. [Google Scholar]
- Assarsson, U.; Moller, T. Optimized view frustum culling algorithms for bounding boxes. J. Graph. Tools 2000, 5, 9–22. [Google Scholar] [CrossRef]
- Bittner, J.; Wimmer, M.; Piringer, H.; Purgathofer, W. Coherent hierarchical culling: Hardware occlusion queries made useful. In Proceedings of the Computer Graphics Forum, Boston, MA, USA; Blackwell Publishing: Oxford, UK, 2004; pp. 615–624. [Google Scholar]
- Wang, R.; Qian, X. OpenSceneGraph 3.0: Beginner’s Guide; Packt Publishing Ltd.: Birmingham, UK, 2010. [Google Scholar]
Figure 1.
Comparison of data transmitted by three methods when refining the model: (a) Discrete LOD; (b) Chen’s method; (c) Our method.
Figure 1.
Comparison of data transmitted by three methods when refining the model: (a) Discrete LOD; (b) Chen’s method; (c) Our method.

Figure 2.
Multi-level vertex clustering: (a) Original mesh; (b) the result of vertex clustering on (a); (c) the result of vertex clustering on (b).
Figure 2.
Multi-level vertex clustering: (a) Original mesh; (b) the result of vertex clustering on (a); (c) the result of vertex clustering on (b).

Figure 3.
Overcoming neighborhood dependence: (a) Current grid; (b) neighborhood dependency; (c) solutions to overcome neighborhood dependency.
Figure 3.
Overcoming neighborhood dependence: (a) Current grid; (b) neighborhood dependency; (c) solutions to overcome neighborhood dependency.

Figure 4.
Overall flow chart of our method.

Figure 5.
Construction of vertex tree: (a) The vertex tree obtained after multi-level vertex clustering; (b) the adjusted vertex tree after considering the split depth; (c) the vertex tree after recoding.
Figure 5.
Construction of vertex tree: (a) The vertex tree obtained after multi-level vertex clustering; (b) the adjusted vertex tree after considering the split depth; (c) the vertex tree after recoding.

Figure 6.
Extraction of the related triangle set: (a–c) The change of triangle in the process of multi-level vertex clustering; green nodes indicate the location where is stored, respectively under (d) initial conditions (e) after multi-level vertex clustering (f) after eliminating the redundancy; (g) during recoding, the index changes with the encoding of the vertex synchronously.

Figure 7.
Data scheduling: The black node indicates that it has been transmitted; the dark blue node indicates that it is being requested; the green node indicates that it is not needed at the moment.
Figure 7.
Data scheduling: The black node indicates that it has been transmitted; the dark blue node indicates that it is being requested; the green node indicates that it is not needed at the moment.

Figure 8.
Update actual index list based on vertex list and expected index list.

Figure 9.
Database diagram.

Figure 10.
View-dependent effect of single complex building.

Figure 11.
View-dependent effect of city scene: (a) The effect observed from the current viewpoint; (b) the state at the other end of the city.
Figure 11.
View-dependent effect of city scene: (a) The effect observed from the current viewpoint; (b) the state at the other end of the city.

Figure 12.
Transmission data statistic: (a) Cumulative number of vertices transmitted of Palace; (b) cumulative number of index transmitted of Palace; (c) cumulative number of vertices transmitted of City; (d) cumulative number of index transmitted of City.
Figure 12.
Transmission data statistic: (a) Cumulative number of vertices transmitted of Palace; (b) cumulative number of index transmitted of Palace; (c) cumulative number of vertices transmitted of City; (d) cumulative number of index transmitted of City.


Table 1.
Experiment data.
| Model Name | Vertex Num | Triangle Num | Data Volume | Thumbnail Images |
|---|---|---|---|---|
| Pavilion | 17,256 | 5752 | 1.6 MB |  |
| House | 35,031 | 11,677 | 2.4 MB |  |
| Palace | 153,174 | 51,058 | 15 MB |  |
| Station | 586,002 | 195,334 | 31 MB |  |
| City | 1,392,631 | 2,246,170 | 344 MB |  |
Table 2.
Comparison of the cumulative transmitted data volume.
| Model Name | Roaming Time (s) | Discrete LOD | Chen’s Method | Our Method | |||
|---|---|---|---|---|---|---|---|
| Vertex | Index | Vertex | Index | Vertex | Index | ||
| Pavilion | 28 | 63,366 | 21,122 | 17,256 | 21,122 | 17,256 | 6209 |
| House | 35 | 72,111 | 24,037 | 35,019 | 24,037 | 33,871 | 13,166 |
| Palace | 45 | 453,429 | 151,143 | 153,174 | 151,143 | 153,156 | 53,623 |
| Station | 48 | 1,552,989 | 517,663 | 585,159 | 517,663 | 579,624 | 196,741 |
| City | 149 | 3,938,442 | 5,485,256 | 1,385,838 | 5,485,256 | 1,375,208 | 2,218,943 |
Table 3.
Refinement delay time statistics.
| Model Name | Request Frequency | Basic Model Loading (ms) | Average Time (ms) | Shortest Time (ms) | Longest Time (ms) | Median Time (ms) |
|---|---|---|---|---|---|---|
| Pavilion | 2.3 times/s | 92 | 8 | 3 | 36 | 6 |
| House | 0.8 times/s | 16 | 13 | 5 | 78 | 5 |
| Palace | 1.5 times/s | 341 | 28 | 1 | 143 | 6 |
| Station | 0.8 times/s | 1703 | 129 | 5 | 516 | 31 |
| City | 6.4 times/s | 3434 | 28 | 1 | 1183 | 8 |
Table 4.
Frame rate statistics on MX150.
| Model Name | Roaming Time | Average FPS | Minimum FPS | Maximum FPS | Median FPS |
|---|---|---|---|---|---|
| Pavilion | 28s | 219 | 172 | 230 | 217 |
| House | 35s | 218 | 173 | 235 | 219 |
| Palace | 45s | 202 | 129 | 219 | 209 |
| Station | 48s | 192 | 31 | 248 | 212 |
| City | 149s | 91 | 48 | 210 | 83 |
Publisher’s Note: MDPI stays neutral with regard to jurisdictional claims in published maps and institutional affiliations. |
© 2021 by the authors. Licensee MDPI, Basel, Switzerland. This article is an open access article distributed under the terms and conditions of the Creative Commons Attribution (CC BY) license (https://creativecommons.org/licenses/by/4.0/).
Share and Cite
MDPI and ACS Style
Sun, Y.; Ma, J.; She, J.; Zhao, Q.; He, L. View-Dependent Progressive Transmission Method for 3D Building Models. ISPRS Int. J. Geo-Inf. 2021, 10, 228. https://doi.org/10.3390/ijgi10040228
AMA Style
Sun Y, Ma J, She J, Zhao Q, He L. View-Dependent Progressive Transmission Method for 3D Building Models. ISPRS International Journal of Geo-Information. 2021; 10(4):228. https://doi.org/10.3390/ijgi10040228
Chicago/Turabian StyleSun, Yuchang, Jingsong Ma, Jiangfeng She, Qiang Zhao, and Lixia He. 2021. "View-Dependent Progressive Transmission Method for 3D Building Models" ISPRS International Journal of Geo-Information 10, no. 4: 228. https://doi.org/10.3390/ijgi10040228
Note that from the first issue of 2016, this journal uses article numbers instead of page numbers. See further details here.