Article

Microstructure, Residual Stresses, and Strain-Rate-Dependent Deformation and Fracture Behavior of AISI 304L Joints Brazed with NiCrSiB Filler Metals

1
Department of Materials Test Engineering, TU Dortmund University, 44227 Dortmund, Germany
2
Department Material Science, National Research Nuclear University, 115409 Moscow, Russia
*
Author to whom correspondence should be addressed.
Metals 2021, 11(4), 593; https://doi.org/10.3390/met11040593
Submission received: 28 February 2021 / Revised: 30 March 2021 / Accepted: 31 March 2021 / Published: 5 April 2021
(This article belongs to the Special Issue Mechanical Characteristics of Brazed Joints in Metallic Materials)

Abstract

:
The knowledge of alloy–process–structure–property relationships is of particular interest for several safety-critical brazed components and requires a detailed characterization. Thus, three different nickel-based brazing filler metals were produced with varying chromium and molybdenum content and were used to braze butt joints of the austenitic stainless steel AISI 304L under vacuum. Two holding times were used to evaluate diffusion-related differences, resulting in six specimen variations. Significant microstructural changes due to the formation and location of borides and silicides were demonstrated. Using X-ray diffraction, alloy-dependent residual stress gradients from the brazing seam to the base material were determined and the thermal-induced residual stresses were shown through simulations. For mechanical characterization, impact tests were carried out to determine the impact toughness, as well as tensile tests at low and high strain rates to evaluate the strain-rate-dependent tensile strength of the brazed joints. Further thermal, electrical, and magnetic measurements enabled an understanding of the deformation mechanisms. The negative influence of brittle phases in the seam center could be quantified and showed the most significant effects under impact loading. Fractographic investigations subsequently enabled an enhanced understanding of the fracture mechanisms.

1. Introduction

One of the main goals of engineering is to prevent the failure of components during their operation. Therefore, high strengths must be achieved for constructions that require high resistance against failure. Additionally, strain-related values, such as the yield strength and toughness of materials, must be considered to take account of relevant material properties under service conditions. The exact determination of the mechanical properties of construction materials is important for automotive and especially aerospace constructions due to the high safety standards [1]. The materials used for the latter require high strength and resistance to impact loads, which can be caused by bird strikes or hail [2]. The exact knowledge of these properties is necessary to ensure structural integrity throughout the whole operational life of an aircraft or helicopter. This is particularly true for gas turbine engine blades [3] and other turbine components that can be made of corrosion-resistant austenitic steels and joined by high-temperature brazing based on transient liquid phase bonding (TLP bonding) with various types of filler metals, including nickel-based ones [4].
For safety-critical brazed components, not only is the knowledge of the material behavior under impact loads necessary, but in the case of crash loads with high strain rates, mechanical properties like the ultimate tensile strength (UTS) should also be investigated. Highly dynamic material properties will deviate significantly from the material properties determined in standard quasi-static tensile tests [5]. For the metastable austenite AISI 304L, deformation-induced martensite formation, which is also dependent on strain rates, has a particular influence [6,7]. To the best of the authors’ knowledge, there have been no scientific studies so far on the influence of strain rates on brazed austenitic steel joints under mechanical loads. Thereby, the need for research arises because the failure mechanisms of brazed joints vary significantly depending on their properties and the applied loads [8]. Thus, different strain rates were used for a comprehensive study of the materials’ reactions in order to enable a characterization in combination with the elemental composition and brazing modes.
The mechanical properties are generally determined by interdependencies between the geometry of the brazed joint [9] and the microstructure [10], but also residual stress distributions arising from the brazing process or following post-processing [11]. The microstructure can be adjusted by the filler metal alloy compositions and the manufacturing parameters used. For nickel-based alloys, which usually contain boron and silicon to reduce the melting temperature [12], the formation of borides and silicides can result in significantly reduced mechanical properties depending on their size and localization [13].
So, one of the aims was to investigate the influence of chromium and molybdenum—in previous studies, the authors also investigated these in terms of corrosion resistance [14] and corrosion fatigue behavior [15]. Furthermore, so far, how the alloy and holding time change the residual stress state of austenitic steel joints has not been investigated. Thereby, the correlation of the residual stress state of the brazed joints and the mechanical properties has not been investigated. Consequently, in this research work, the specimen surfaces were measured with X-ray diffraction spectroscopy (XRD) to investigate whether the residual stresses could be linked to the strength of the brazed joints. Additional simulations were carried out to understand the thermal mechanisms during the brazing process that lead to these residual stresses.

2. Materials and Methods

2.1. Production of Filler Metals and Alloy Compositions

Three amorphous crystalline NiCrSiB filler metals were prepared for the alloy-dependence investigation into the microstructure, residual stresses, mechanical properties, and fracture mechanisms of brazed metastable austenitic stainless steel joints. These were produced in the form of foils with a thickness of 45 ± 5 µm through rapid solidification (104–106 K/s) of a flat melting jet on a rapidly rotating copper disk. For this purpose, pure elements according to the Russian state standards 849-70, 5905-2004, 13610-79, and 14316-91 were used as starting materials, which were melted into ingots of the selected brazing alloy composition. Melting of these alloy ingots was carried out in an arc vacuum furnace with a non-consumable tungsten electrode by remelting five times in an argon atmosphere. The chemical compositions of these brazing alloys and the base material—the metastable austenitic stainless steel AISI 304L (X2CrNi18-9, 1.4307) (Viraj Profiles SRM, Maan, Maharashtra, India)—are shown in Table 1. For brevity, the alloys are referred to as ST07, ST15, and ST20 according to the experimental new brazing filler materials of the Russian quality of industrial foils (STEMET). The number indicates the percentage of chromium in the alloy. The brazing temperature for the filler metals needed to be chosen according to the temperature characteristics of the filler metals. Therefore, the melting ranges were determined through differential thermal analysis (DTA) with a SDTQ600 (TA Instruments, New Castle, DE, USA) thermal analyzer and are shown in Table 1 as well.

2.2. Brazing Process

First, cylindrical bars of the base material with a diameter of 16 mm were cut into pieces of 80 mm. For only the impact test specimens, cuboid pieces with a height of 27.5 mm and a cross-section of 10 × 10 mm2 were used for brazing. All pieces were ground with SiC paper up to P320 on the relevant surface for brazing to obtain a uniform width of the brazing gap and to prevent defects caused by unwetted areas [9]. Then, brazing foils were placed between two steel pieces and fixed in a special construction for brazing, as shown in Figure 1. A load of 500 g was applied to the specimens for fixation.
The brazing itself was carried out in a vacuum furnace (XVAC1600, Xerion, Berlin, Germany) at 1.7 × 10⁻³ Pa using electric resistive heating with a molybdenum heater. Heating rates, temperatures, and holding times were controlled during the brazing process by a software. Based on the melting ranges determined in Table 1, a brazing temperature of 1160 °C was selected for all alloy compositions to ensure that the brazing material completely changed to the liquid state.
In addition to the alloy, the holding time is a key parameter for setting the micro-structure and, thus, other properties [15,16]. In addition to the temperature, the holding time determines the diffusion of the elements of the filler metal into the base material, as well as from the base material into the brazed seam. To generate further microstructural variations, all brazing alloys were therefore brazed with two different holding times. The time and temperature data of both brazing process modes are shown in Table 2. First, the specimens were heated up to 900 °C and held for 15 min to ensure homogeneous heat distribution; then, the specimens were heated with a lower heating rate up to the brazing temperature of 1160 °C and held there for 15 or 40 min. The cooling was done within the furnace without using gas. For brevity, specimens brazed according to the first mode are indicated with “15 min”—ST0715min, ST1515min, and ST2015min. Specimens brazed according to the second mode are indicated with “40 min”—ST0740min, ST1540min, and ST2040min.

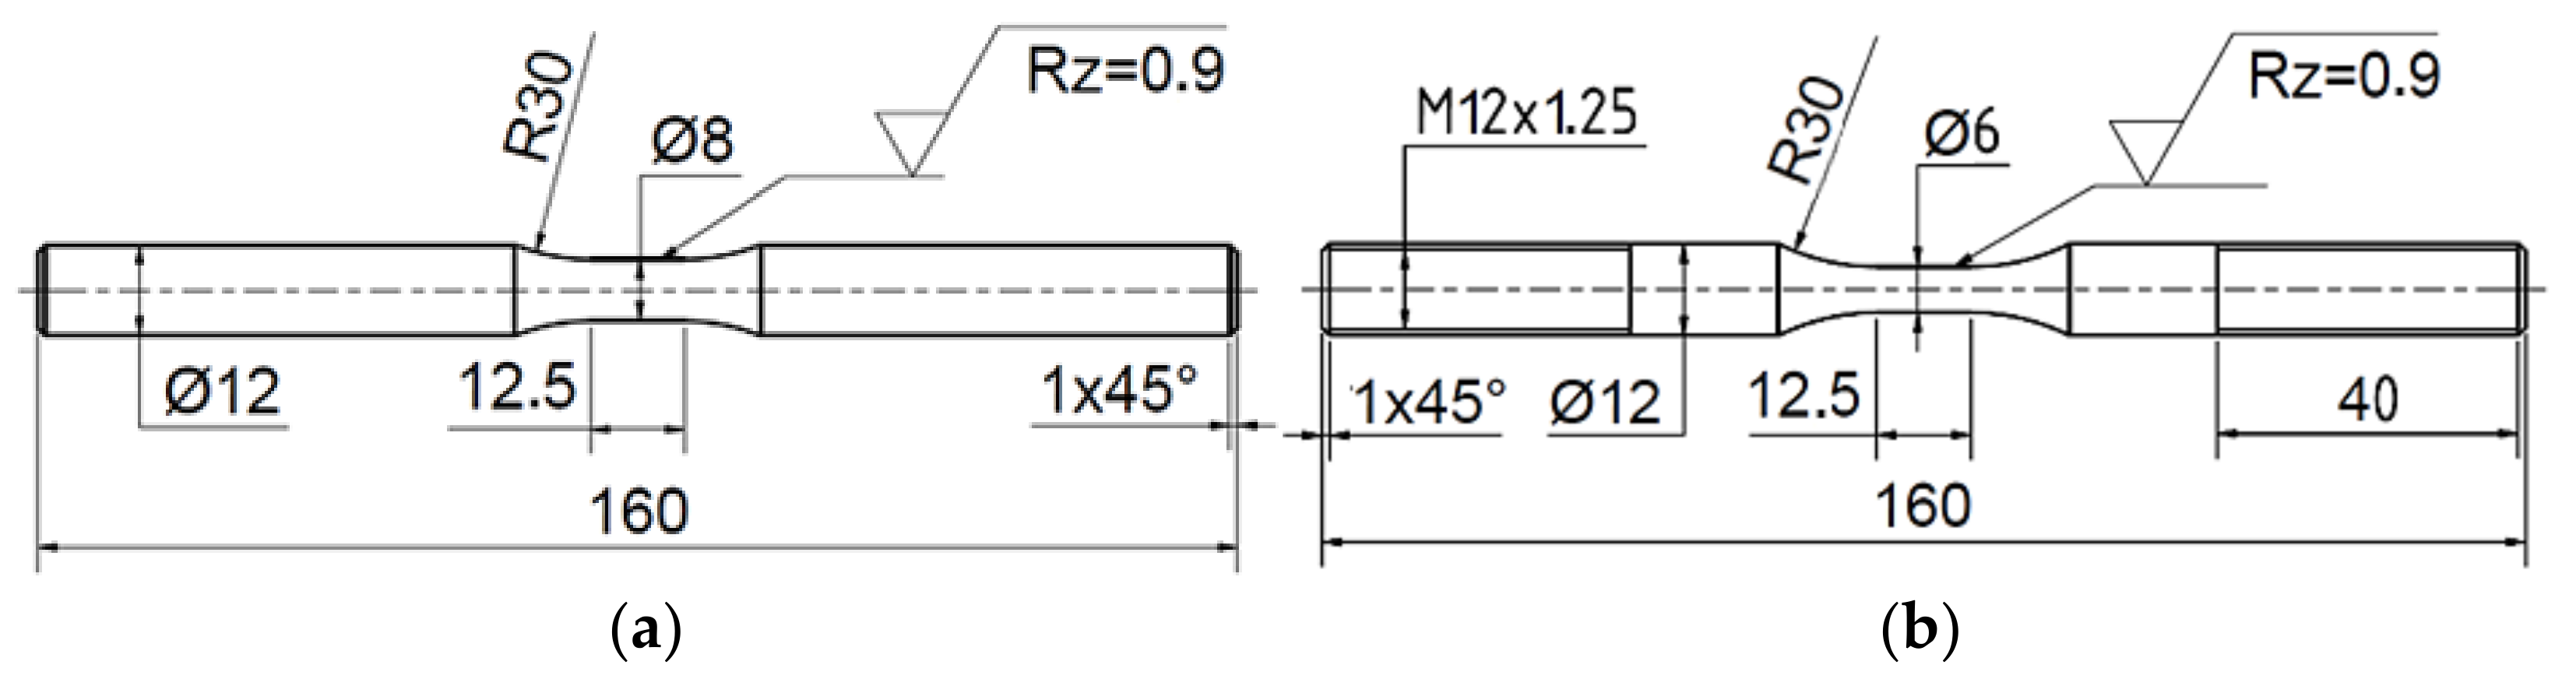
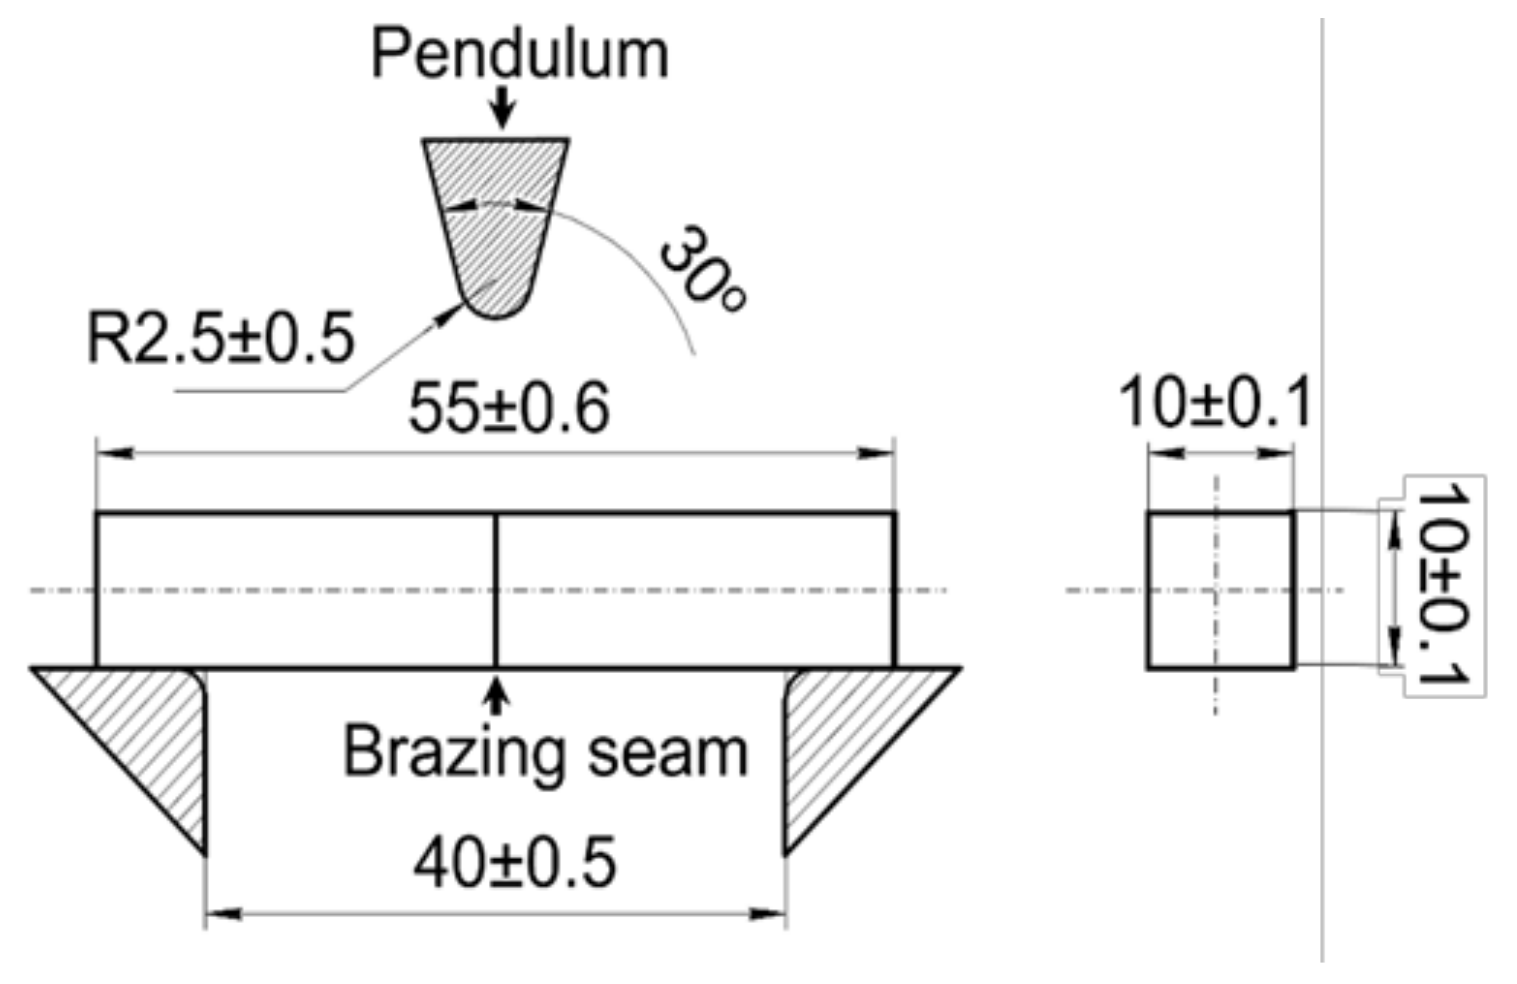
2.3. Specimen Geometry and Manufacturing

The following mechanical tests were carried out for all six specimen variations: impact tests, tensile tests at a low strain rate, and tensile tests at a high strain rate. As the specimens for the impact tests did not require any special geometry, they were not post-processed. The specimen geometry for the low-strain-rate tensile tests was designed according to DIN EN ISO 6892-1 [17] and a test diameter of 8 mm was selected. The specimen geometry for the high-strain-rate tensile tests was designed according to DIN EN ISO 26203-2 [18]. While regarding a potential positive strain-rate dependency of the test forces, a test diameter of 6 mm was selected in order to not exceed the testing system limit of 50 kN. Both types of tensile test geometries are shown in Figure 2.
The tensile specimens were first turned to the geometry shown with the cutting speed vc = 150 m/min and the feed per revolution f = 0.1 mm/r. Afterwards, the test area was polished manually with a miniature lathe. The attention paid to these manufacturing parameters is of interest, since the mechanical results can be affected [19], and the residual stress measurements were carried out on the surfaces of the specimens, as shown in Figure 2a.

2.4. Microstructural Analysis

Cross-sections were performed with a scanning electron microscope (SEM) (MIRA 3 XMU, Tescan, Brno, Czech Republic) to study the characteristics of the microstructures of the specimens. The cross-sections were ground from P320 down to P2500 and polished with diamond suspensions of 6, 3, and 1 μm. The surface was finished with an oxide polishing suspension (OPS). A backscattered electron (BSE) detector for high material contrast was used instead of a secondary electron (SE) detector for the investigation. An electron backscatter diffraction (EBSD) detector (DigiView 5, EDAX/Ametek, Berwyn, PA, USA) was also used to identify FCC and other phases. Light microscopic fractographic images were taken using a light microscope (МЕТАМ PB-21-1, JSC “LOMO”, St. Petersburg, Russia).

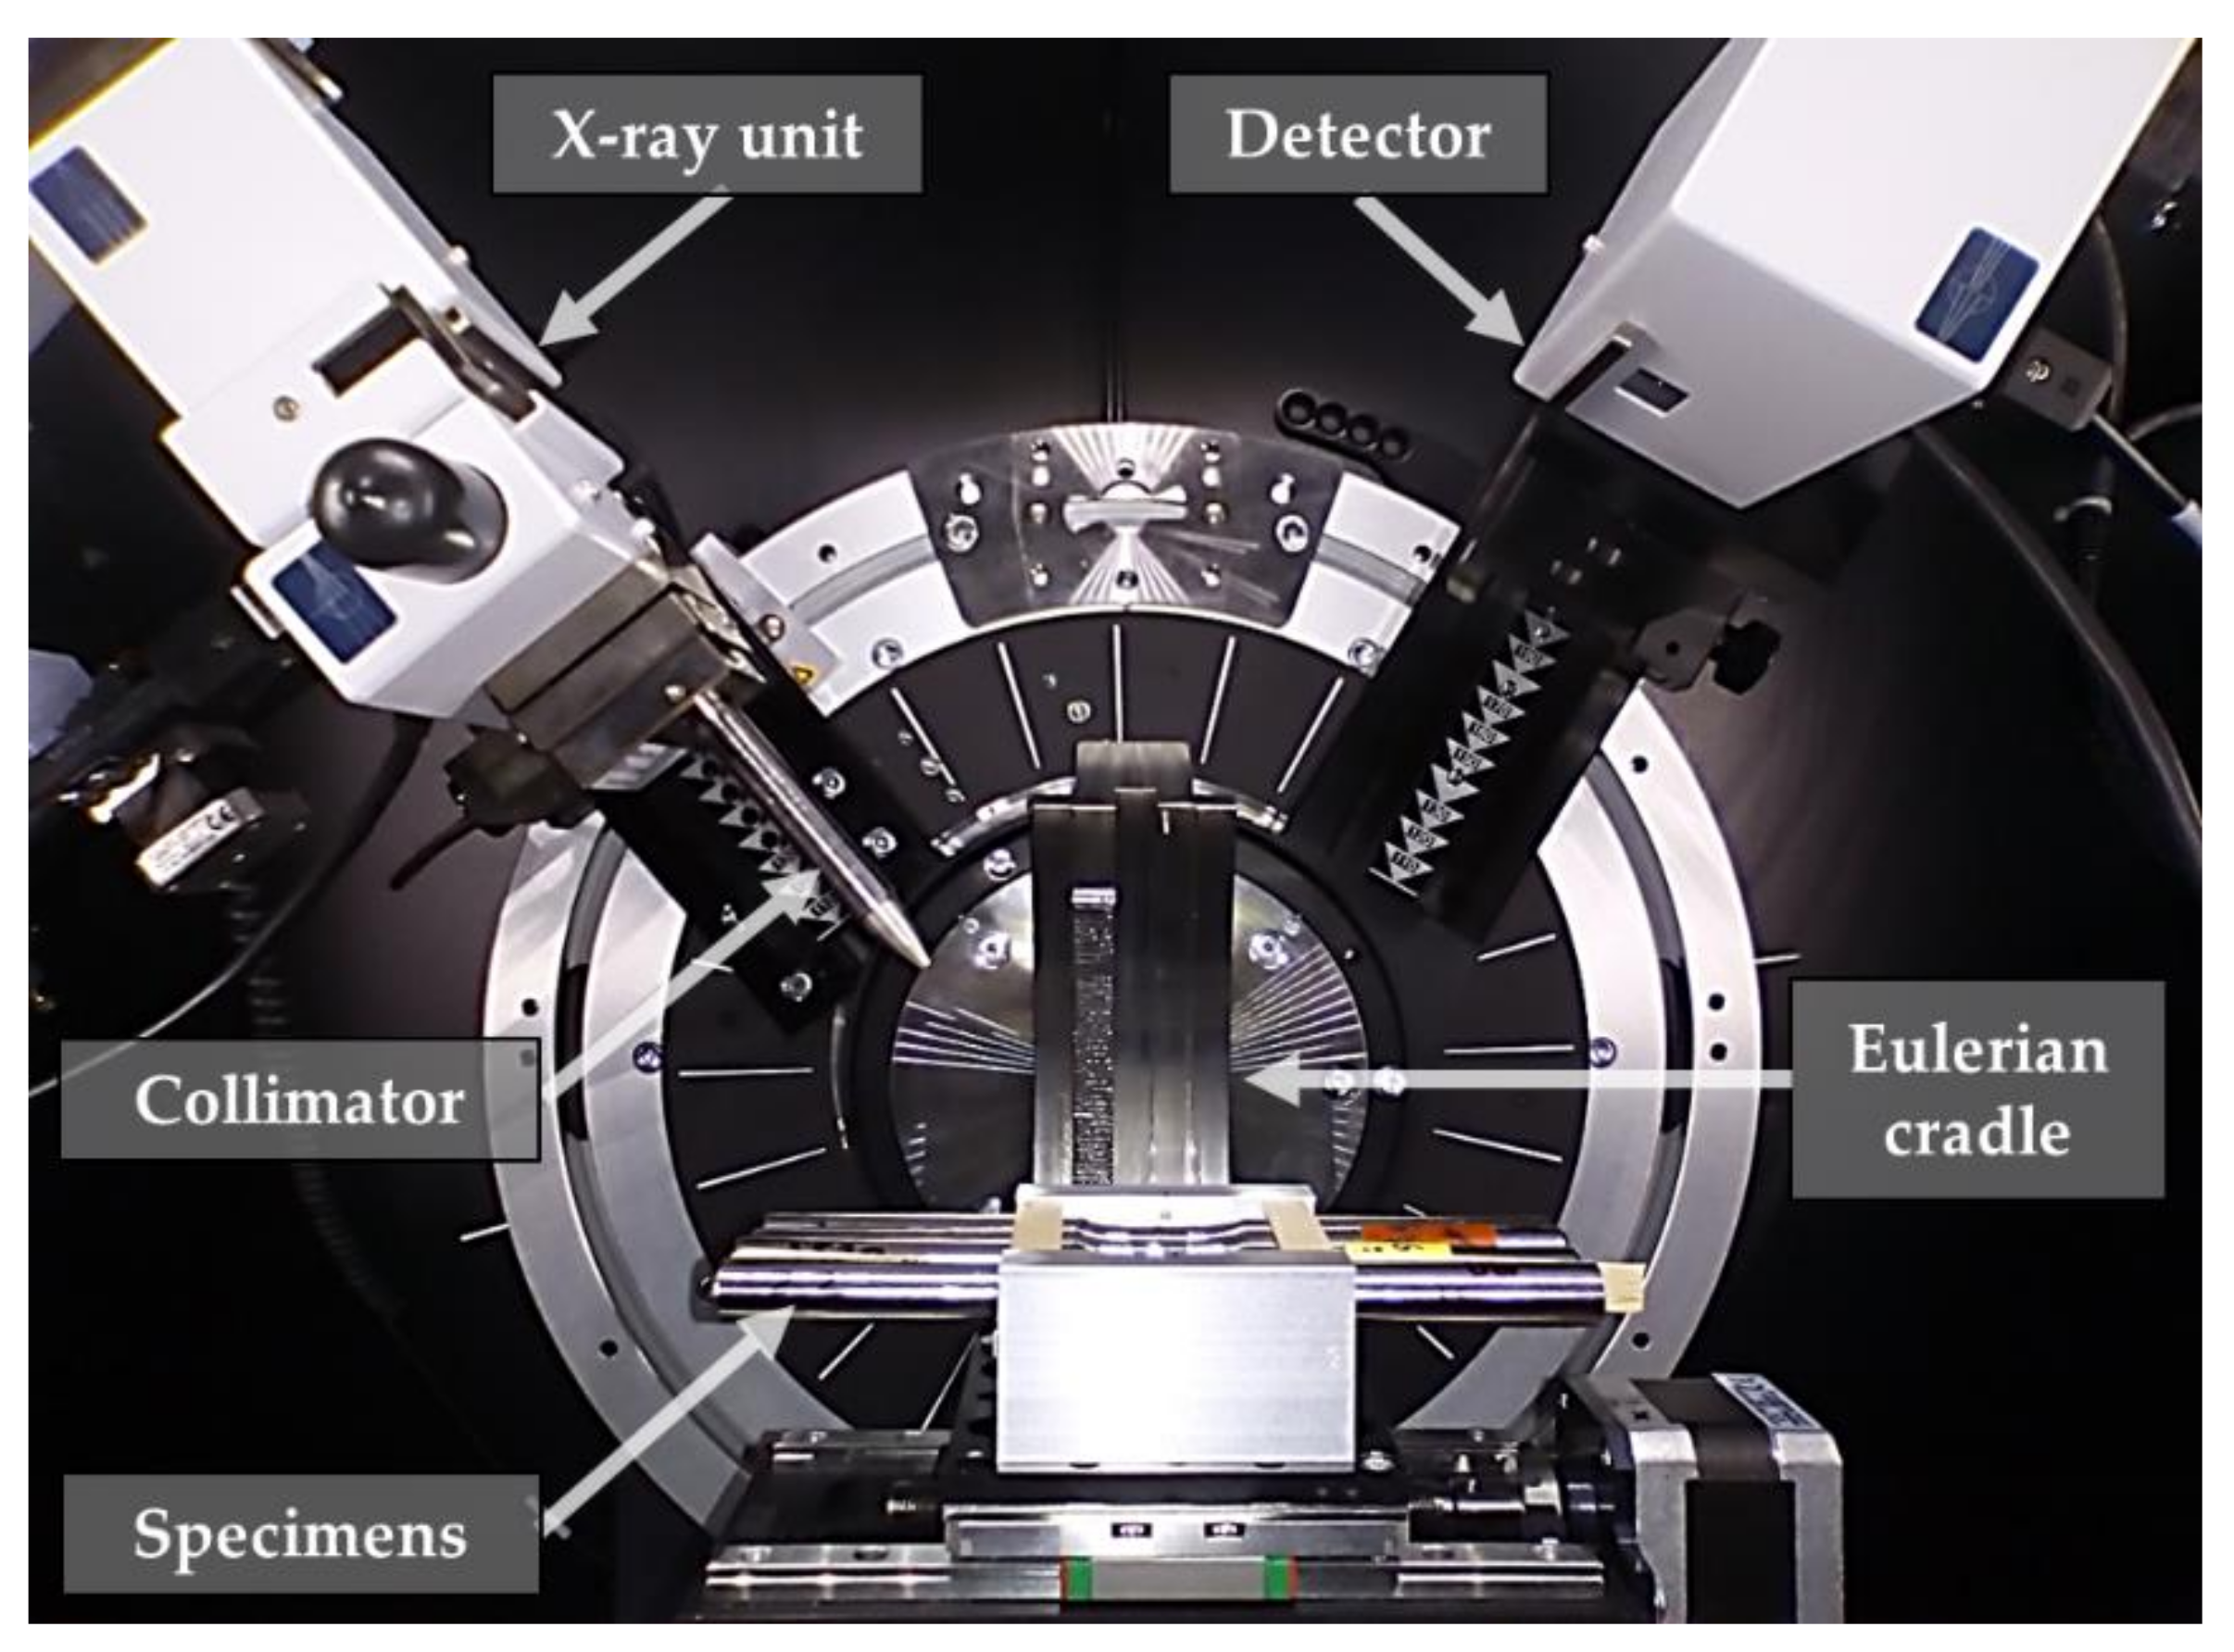
2.5. Residual Stress Measurements

The measurements were performed using a Bruker X-ray diffractometer (D8 Dis-cover, Bruker, Billerica, MA, USA). The parameters used for the measurements are detailed in Table 3. The diffracting plane was the {420} plane of the FCC structure of the austenite. A Eulerian cradle with Bragg–Brentano reflection geometry was used for the measurement according to the sin2ψ method. The calculation of residual stresses was based on the Pearson VII shape function for describing the peak shape. The experimental setup is shown in Figure 3. The number and localization of the measurement points are shown in Figure 4. The collimator with the smallest available measurement area allowed a resulting measuring point with a diameter of 300 µm (shown examplarily in Figure 4a). Considering the width of the brazed seam of about 50 µm, it must be noted that these measured residual stress values are integral values and that local stress peaks are expected to be significantly higher.
The measurement of residual stress was carried out on the mechanically polished surfaces of the specimens according to Figure 2b, since chemical polishing or etching was not possible due to the different chemical resistance from the brazing seam to the base material. In addition, the specimens were tested in this mechanically post-processed condition, which enabled comparability to the strengths.

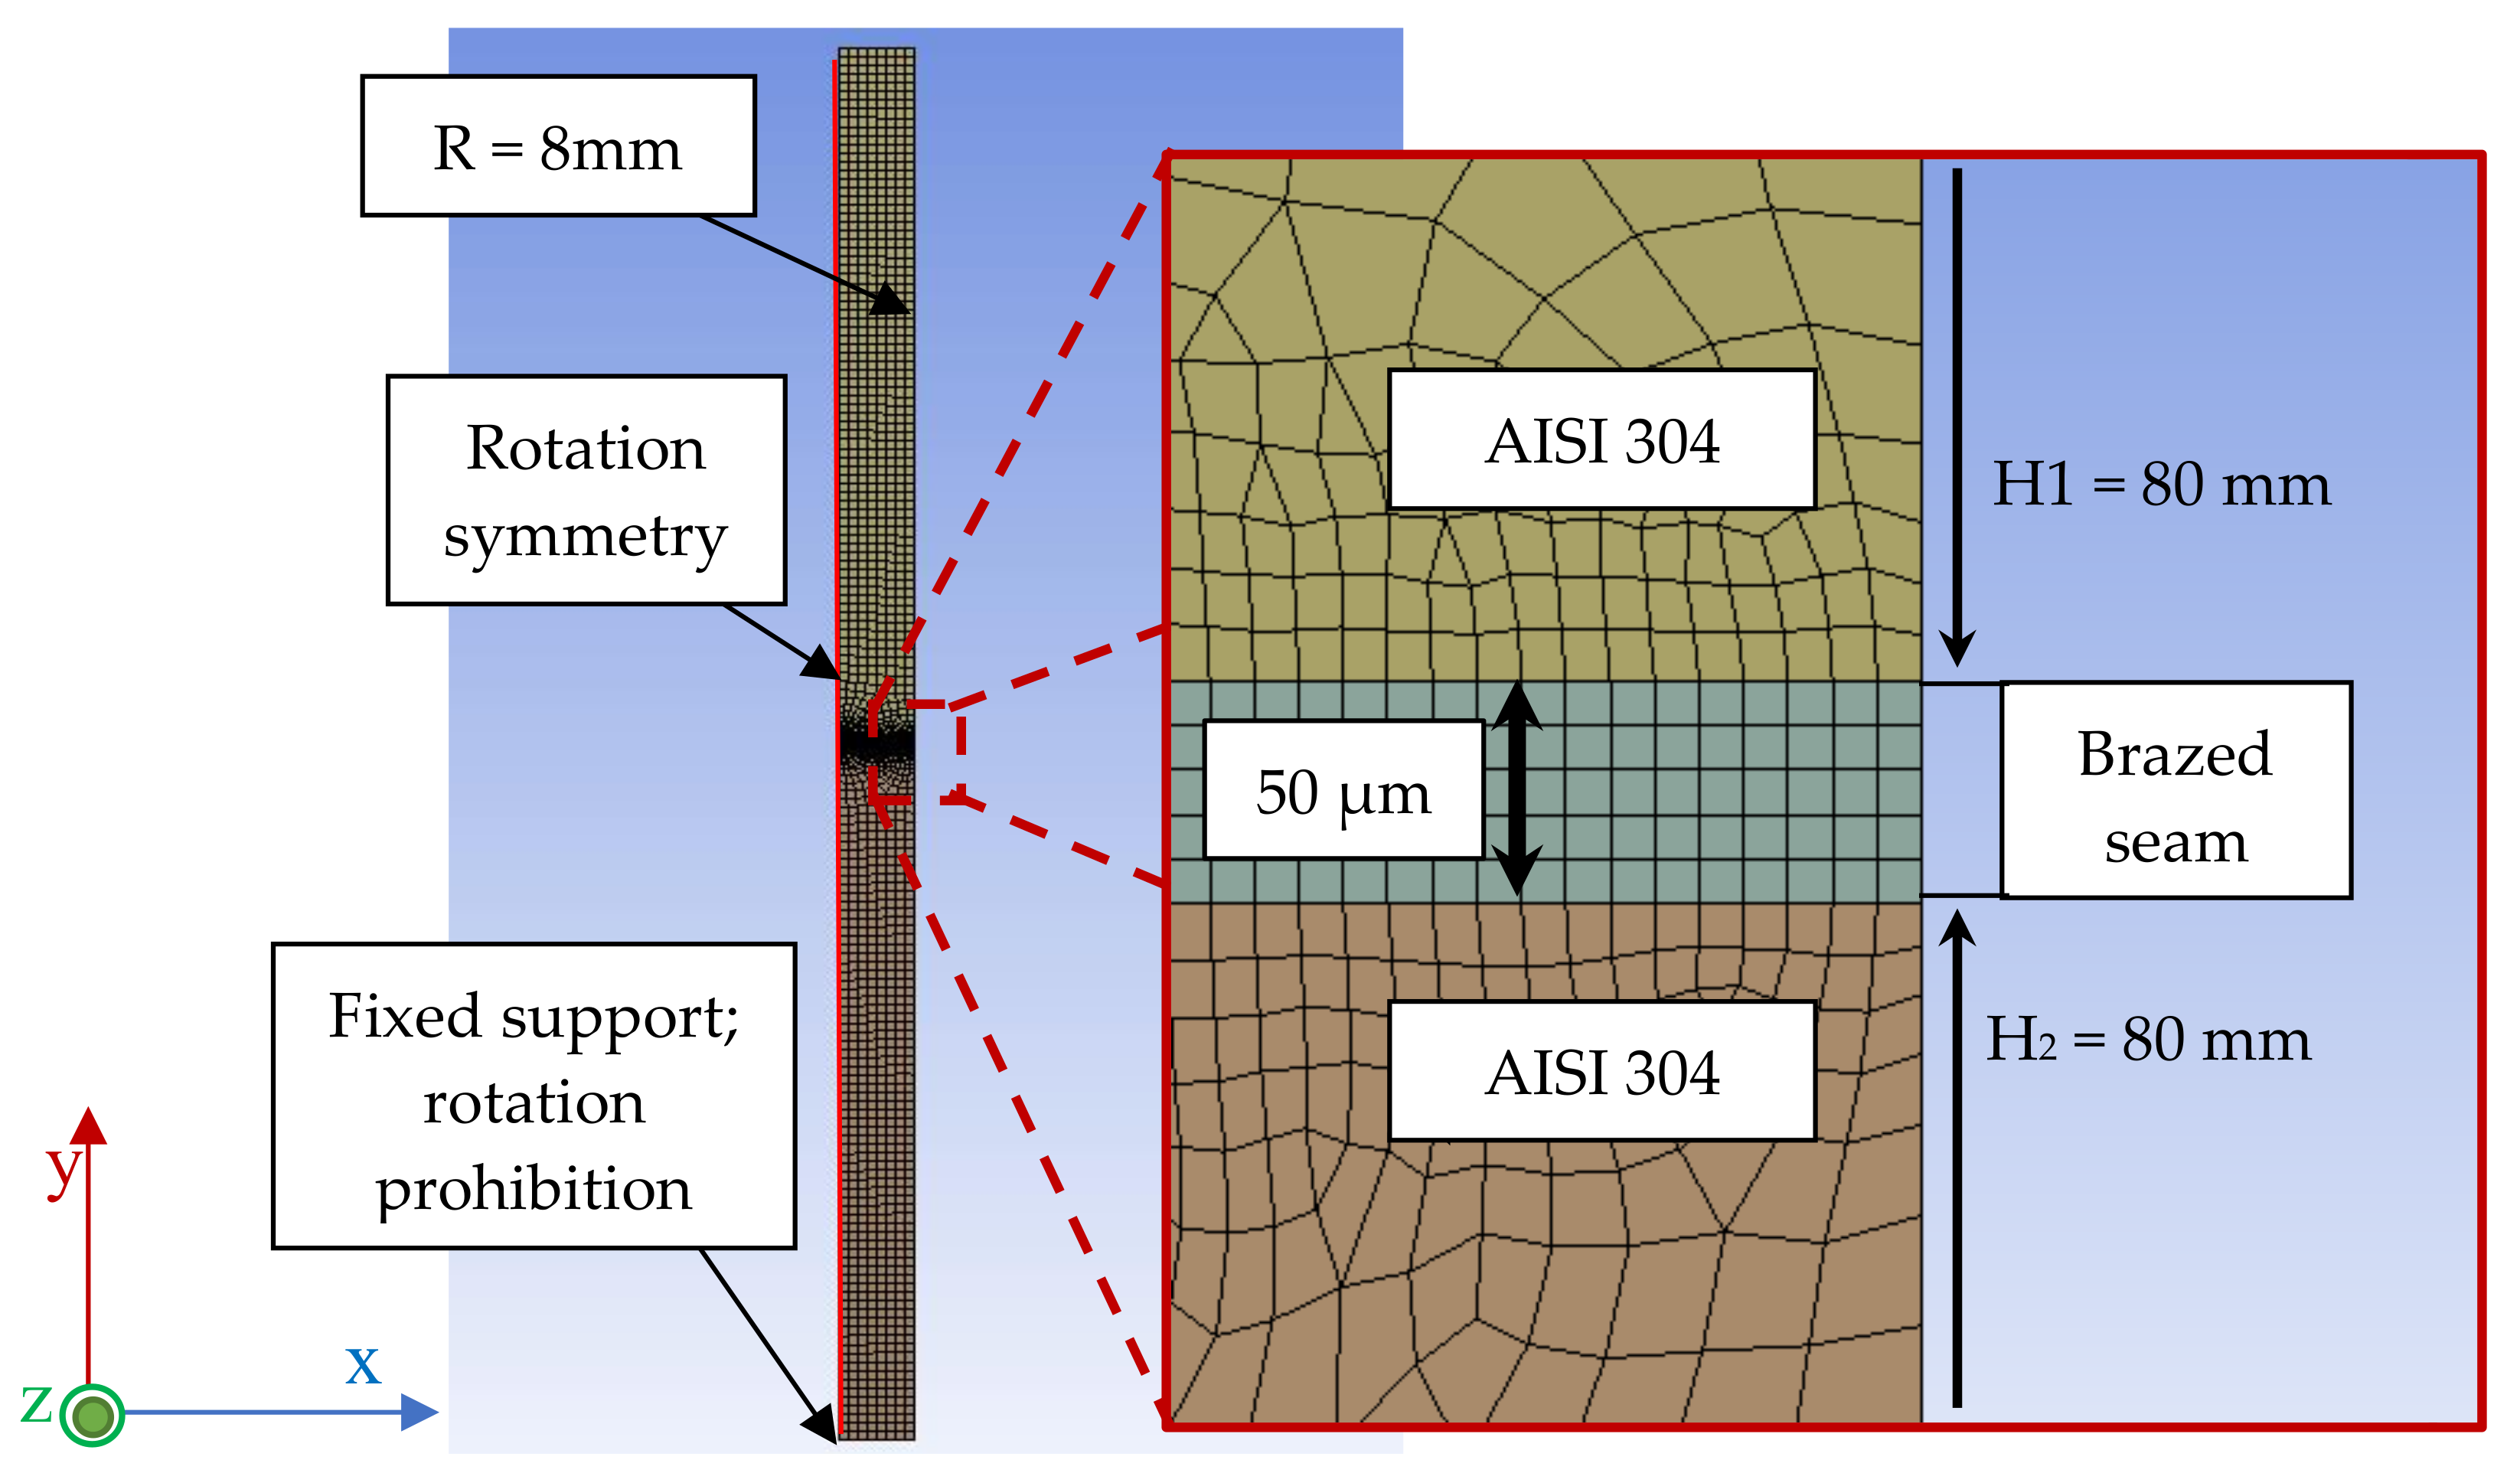
2.6. Residual Stress Calculation with the Finite Element Method

The thermomechanical problem of the brazed specimens during cooling was solved using the software ANSYS Workbench (Ansys Workbench V18.2, Ansys, Canonsburg, PA, USA). Figure 5 shows the meshed finite element method (FEM) model of the brazed cylindrical specimens. The model consists of 2 cylinders with a diameter of 16 mm and a height of 80 mm, joined together with a seam thickness of 50 μm. The mesh element size of 10 μm in the brazed seam was obtained with the quadrilateral dominant method with the curvature size function. With increasing distance from the brazed seam, the mesh size changed to 1 mm, since only the connection area of the zone was of interest. The connection between the steel part and the seam was simulated with the bonding option.
A simulation of the specimen cooling conditions from the initial brazing temperature of 1160 °C to room temperature was conducted (cooling rate of 20 K/min). The boundary conditions included the prohibition on the movement of the side point of the sample, as well as the prohibition of rotation to ensure the stability of the solution. The initial conditions included a completely stress-free state at brazing temperature. The calculation was carried out in order to find the stress–strain state of the brazed seam at room temperature.
The following materials were taken for calculation: the cylindrical specimen parts made from AISI 304L stainless steel and the seam (for ST0715min), which had the following element composition, as measured measured by energy-dispersive X-rax spectroscopy (EDX) in scanning electron microscope (SEM): 62.3Ni-21.3Fe-10.7Cr-5.4Si wt.%. Since the thermal and mechanical properties of the 62.3Ni-21.3Fe-10.7Cr-5.4Si wt.% alloy were unknown, an ingot of this composition was casted, and its coefficient of thermal expansion (CTE) was measured on a high-temperature horizontal dilatometer (DIL 402 C, Netzsch-Geraetebau, Selb, Germany). The density and mechanical properties of this alloy were calculated using the JMatPro software. This allowed the calculation of the physical parameters and characteristics of the alloy for a given composition and heat treatment mode based on the phase diagrams of the alloy components. The materials property data are presented in Table 4.

2.7. Mechanical Testing Methods
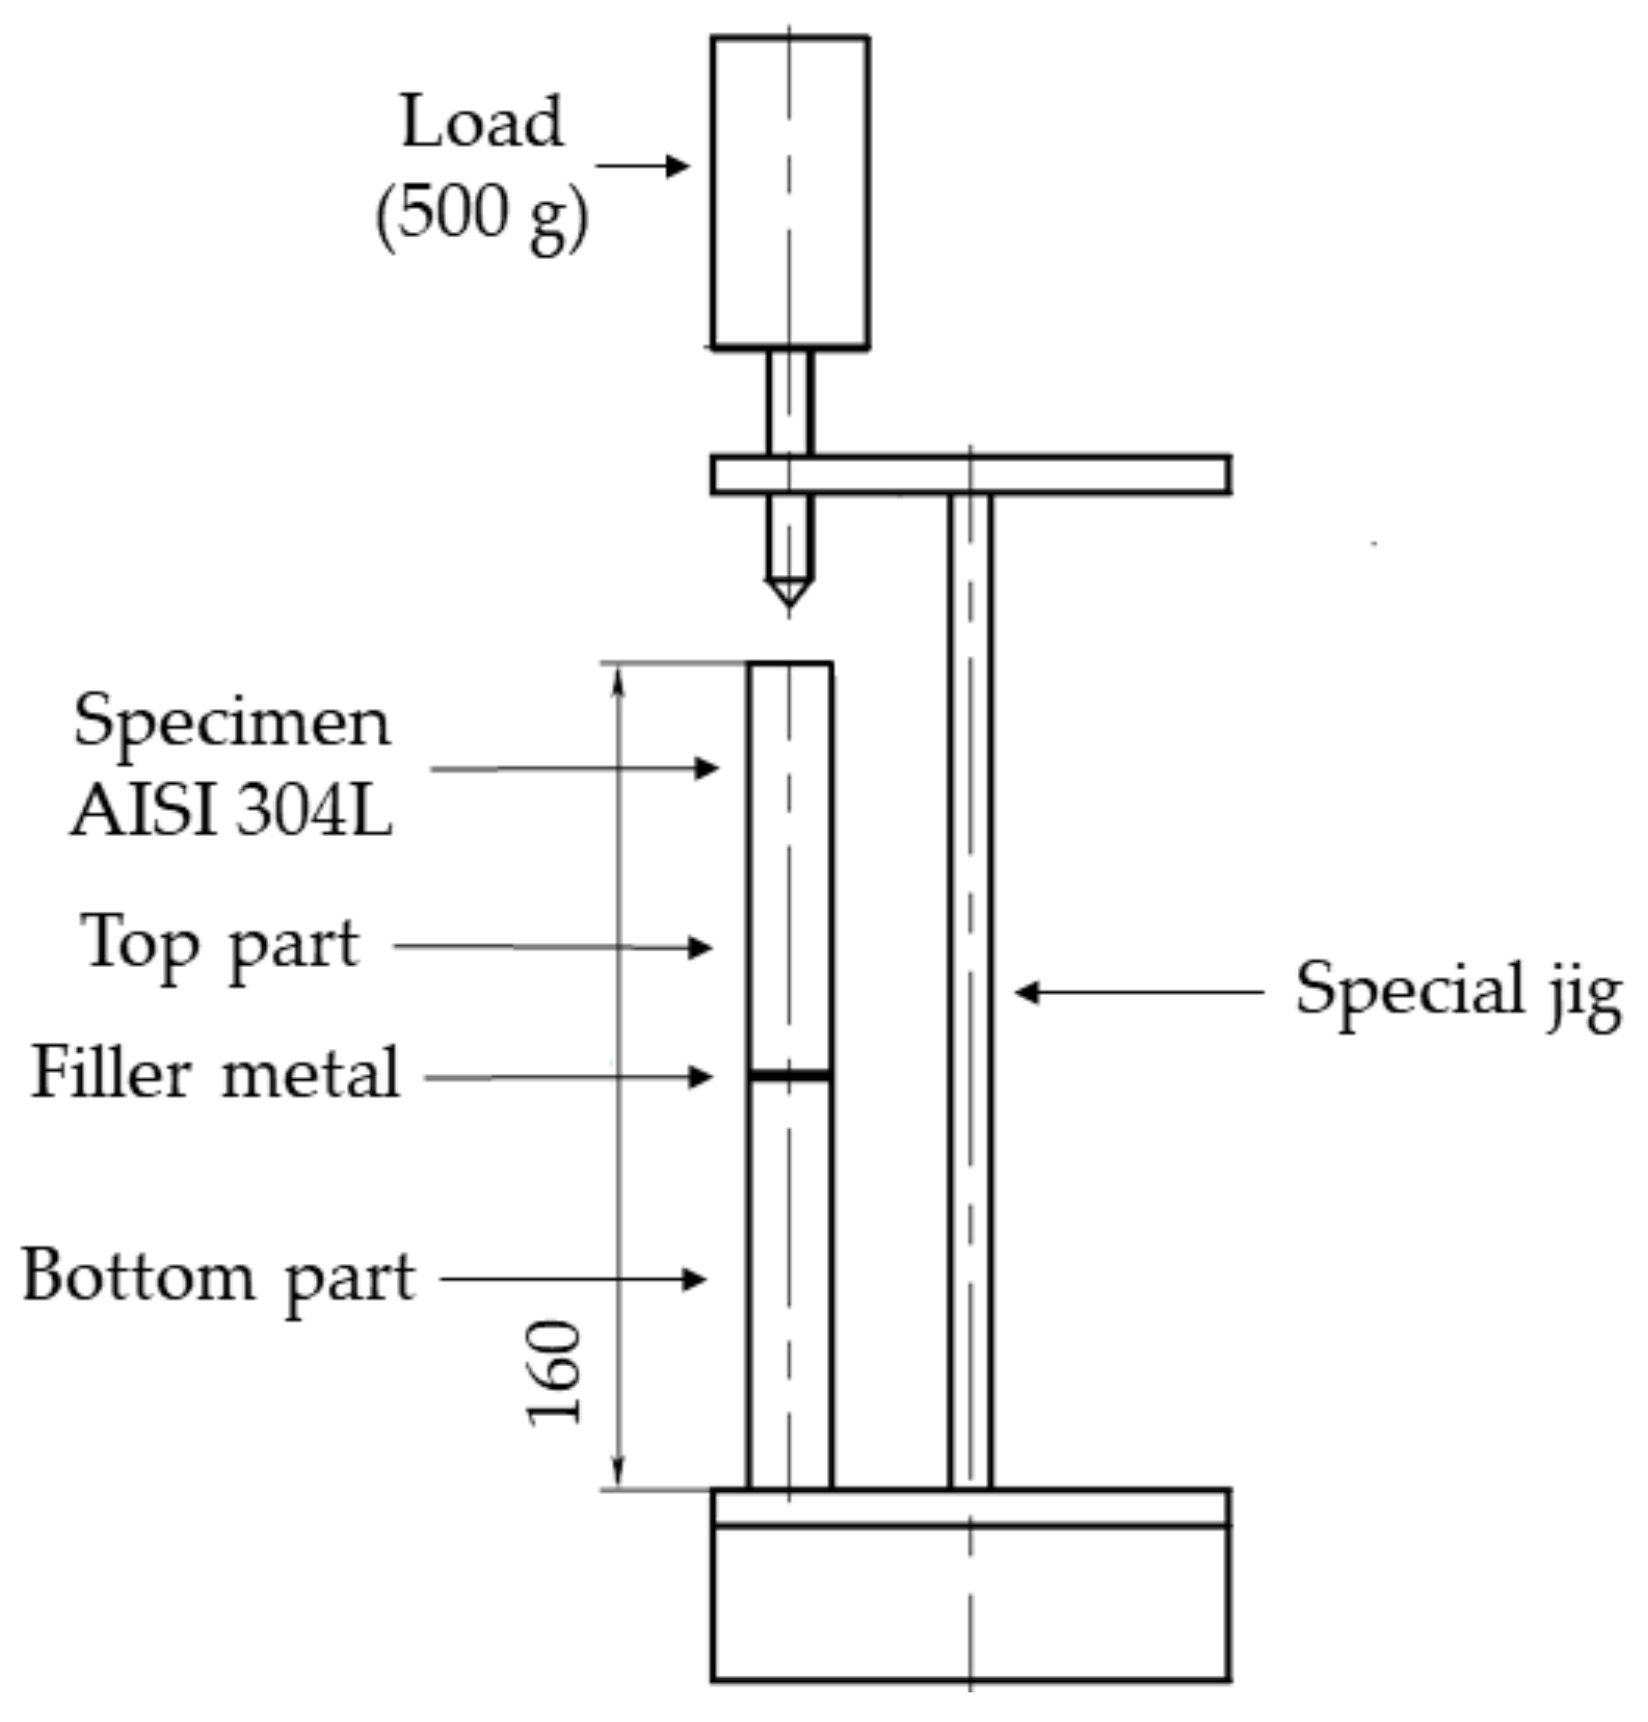
2.7.1. Impact Tests

Tests for impact toughness were carried out in accordance with the Russian State Standard 9454-78 [20]. For the brazed specimens (Figure 6), a concentrator in the form of a cut was not applied, since the seam was already a stress concentrator and a defective area. The tests were carried out on a pendulum impact testing machine (JB-W300, TIME Group Inc., Beijing, China) with removable hammers, which provided the nominal potential energies of the pendulums of 150 and 300 J, and the measurement result could be read on a scale. A schematic drawing of the impact test is shown in Figure 6.

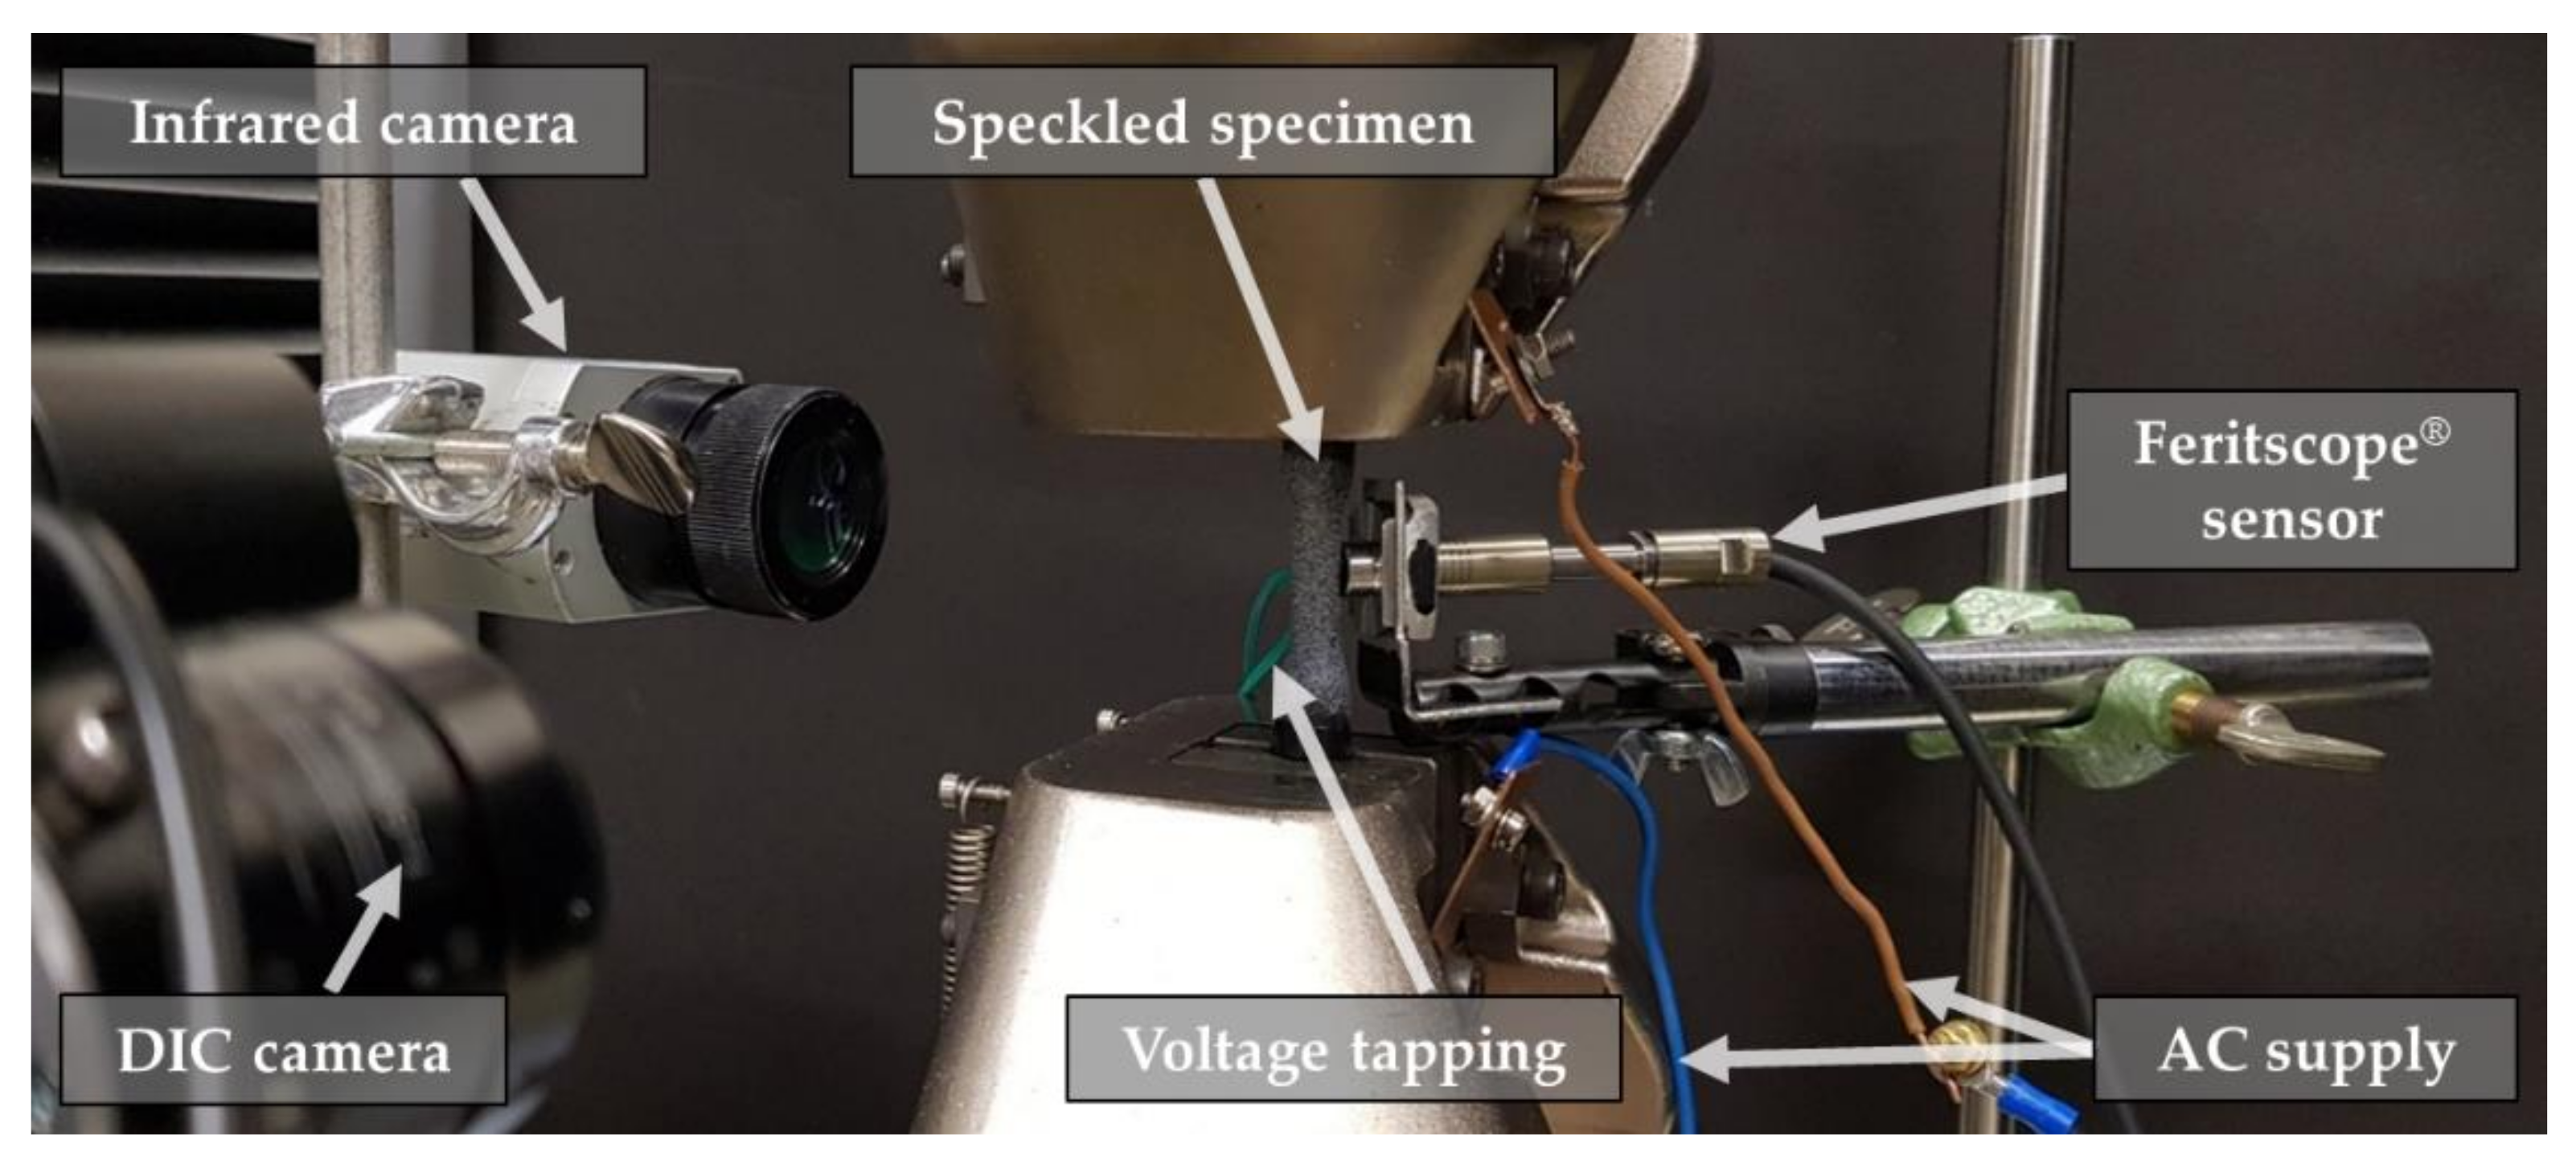
2.7.2. Instrumented Tensile Tests at a Low Strain Rate

Following DIN EN ISO 6892-1 [17], tensile tests were performed with the brazed specimens at the recommended strain rate of 0.00025 s−1, which corresponds to a test speed of 0.003125 mm/s for the 12.5 mm cylindrical measuring length. The strain rate was applied until fracture and was not increased after the plastic strain region was reached. This constant strain rate is needed to allow comparison with the following tensile tests at a high strain rate, and it also increases the number of measuring points of measurement technologies with fixed frequencies. A universal testing system (AG-X 100 kN, Shimadzu, Kyoto, Japan) with a nominal test load of 100 kN was used to perform the tensile tests. For visual recording of the total strain εt and the subsequent digital image correlation (DIC) analysis, a 2D system with 5.3 MP cameras (Me-go 2D, Me-go, Herrieden, Germany) was used. In contrast to tactile mechanical extensometers, optical methods enable local strain measurements in the area of thin brazing seams based on reduced and various virtual gauge lengths (shortly referred to VL0). Thus, different deformation behaviors of the base material and the brazing seams can be visualized [21,22]. For the use of DIC, the samples were painted and given a random speckle pattern. A measurement frequency (fDIC) of 1 frame per second (fps) was selected.
Moreover, the thermal, electrical, and magnetic parameters were measured during the tests. A thermal imaging camera (TIM 400, Micro-Epsilon, Ortenburg, Germany) was used for infrared measurement of the temperature change (ΔT). For plastic deformation, was is assumed that 90% to 95% of the deformation work (W) performed on the specimen was converted into heat (Q), as stated in Equation (1) [23]. So, this measurement is of particular interest in connection with the following measurements, since only a small part of the deformation work performed is converted into internal energy (U) in the form of microstructural changes.
W = Q + U             U Q
The specific deformation work (w) can be calculated integrally from the area under the course of the stress–strain curve, which represents the specific energy absorption (ΔEspec) (see Equation (2)).
w = σ   d ε = Δ E s p e c
In this study, an alternating current (AC) potential drop measuring system (CGM-7, Matelect, Harefield, United Kingdom) was used to characterize the deformation- and damage-induced AC voltage change (ΔU) during tensile loading. Based on the permeability number μr ≈ 1, the induction constant µ0 = 4π × 10−7s Vs/Am, the conductivity σ = 1.37 μΩm−1, and the chosen frequency fAC = 1 kHz, the skin effect (Equation (3)) [24] leads to the penetration depth of δ = 13.6 mm. Thus, microstructural changes were recorded in the entire cross-section, even if the permeability changed due to deformation-induced martensite formation of the metastable austenite [25].
δ = 1 π · f A C · σ · μ 0 · μ r
A Feritscope® (Fischerscope® MMS®, Helmut Fischer, Sindelfingen, Germany) with a single-pole measuring sensor (EGAB1.3-Fe, same company) was used for the continuous measurement of the ferromagnetic phase in the metastable austenite, which was caused by austenite–martensite transformation. The device was based on the magnetic inductive measuring method according to DIN EN ISO 2178. A built-in spring created a contact force of the Feritscope on the sample surface, which ensured contact, even with decreasing sample thickness. The whole setup is shown in Figure 7.
To calculate the Young’s modulus ( E ) of the base material in the linear elastic region (Equation (4)), additional tests—standardized according to DIN EN ISO 6892-1—were carried out in a modified setup with a mechanical extensometer with an initial gauge length of L0 = 10 mm, which had to be removed after 9% elongation.
E = σ N ε t = F · L 0 A · Δ L

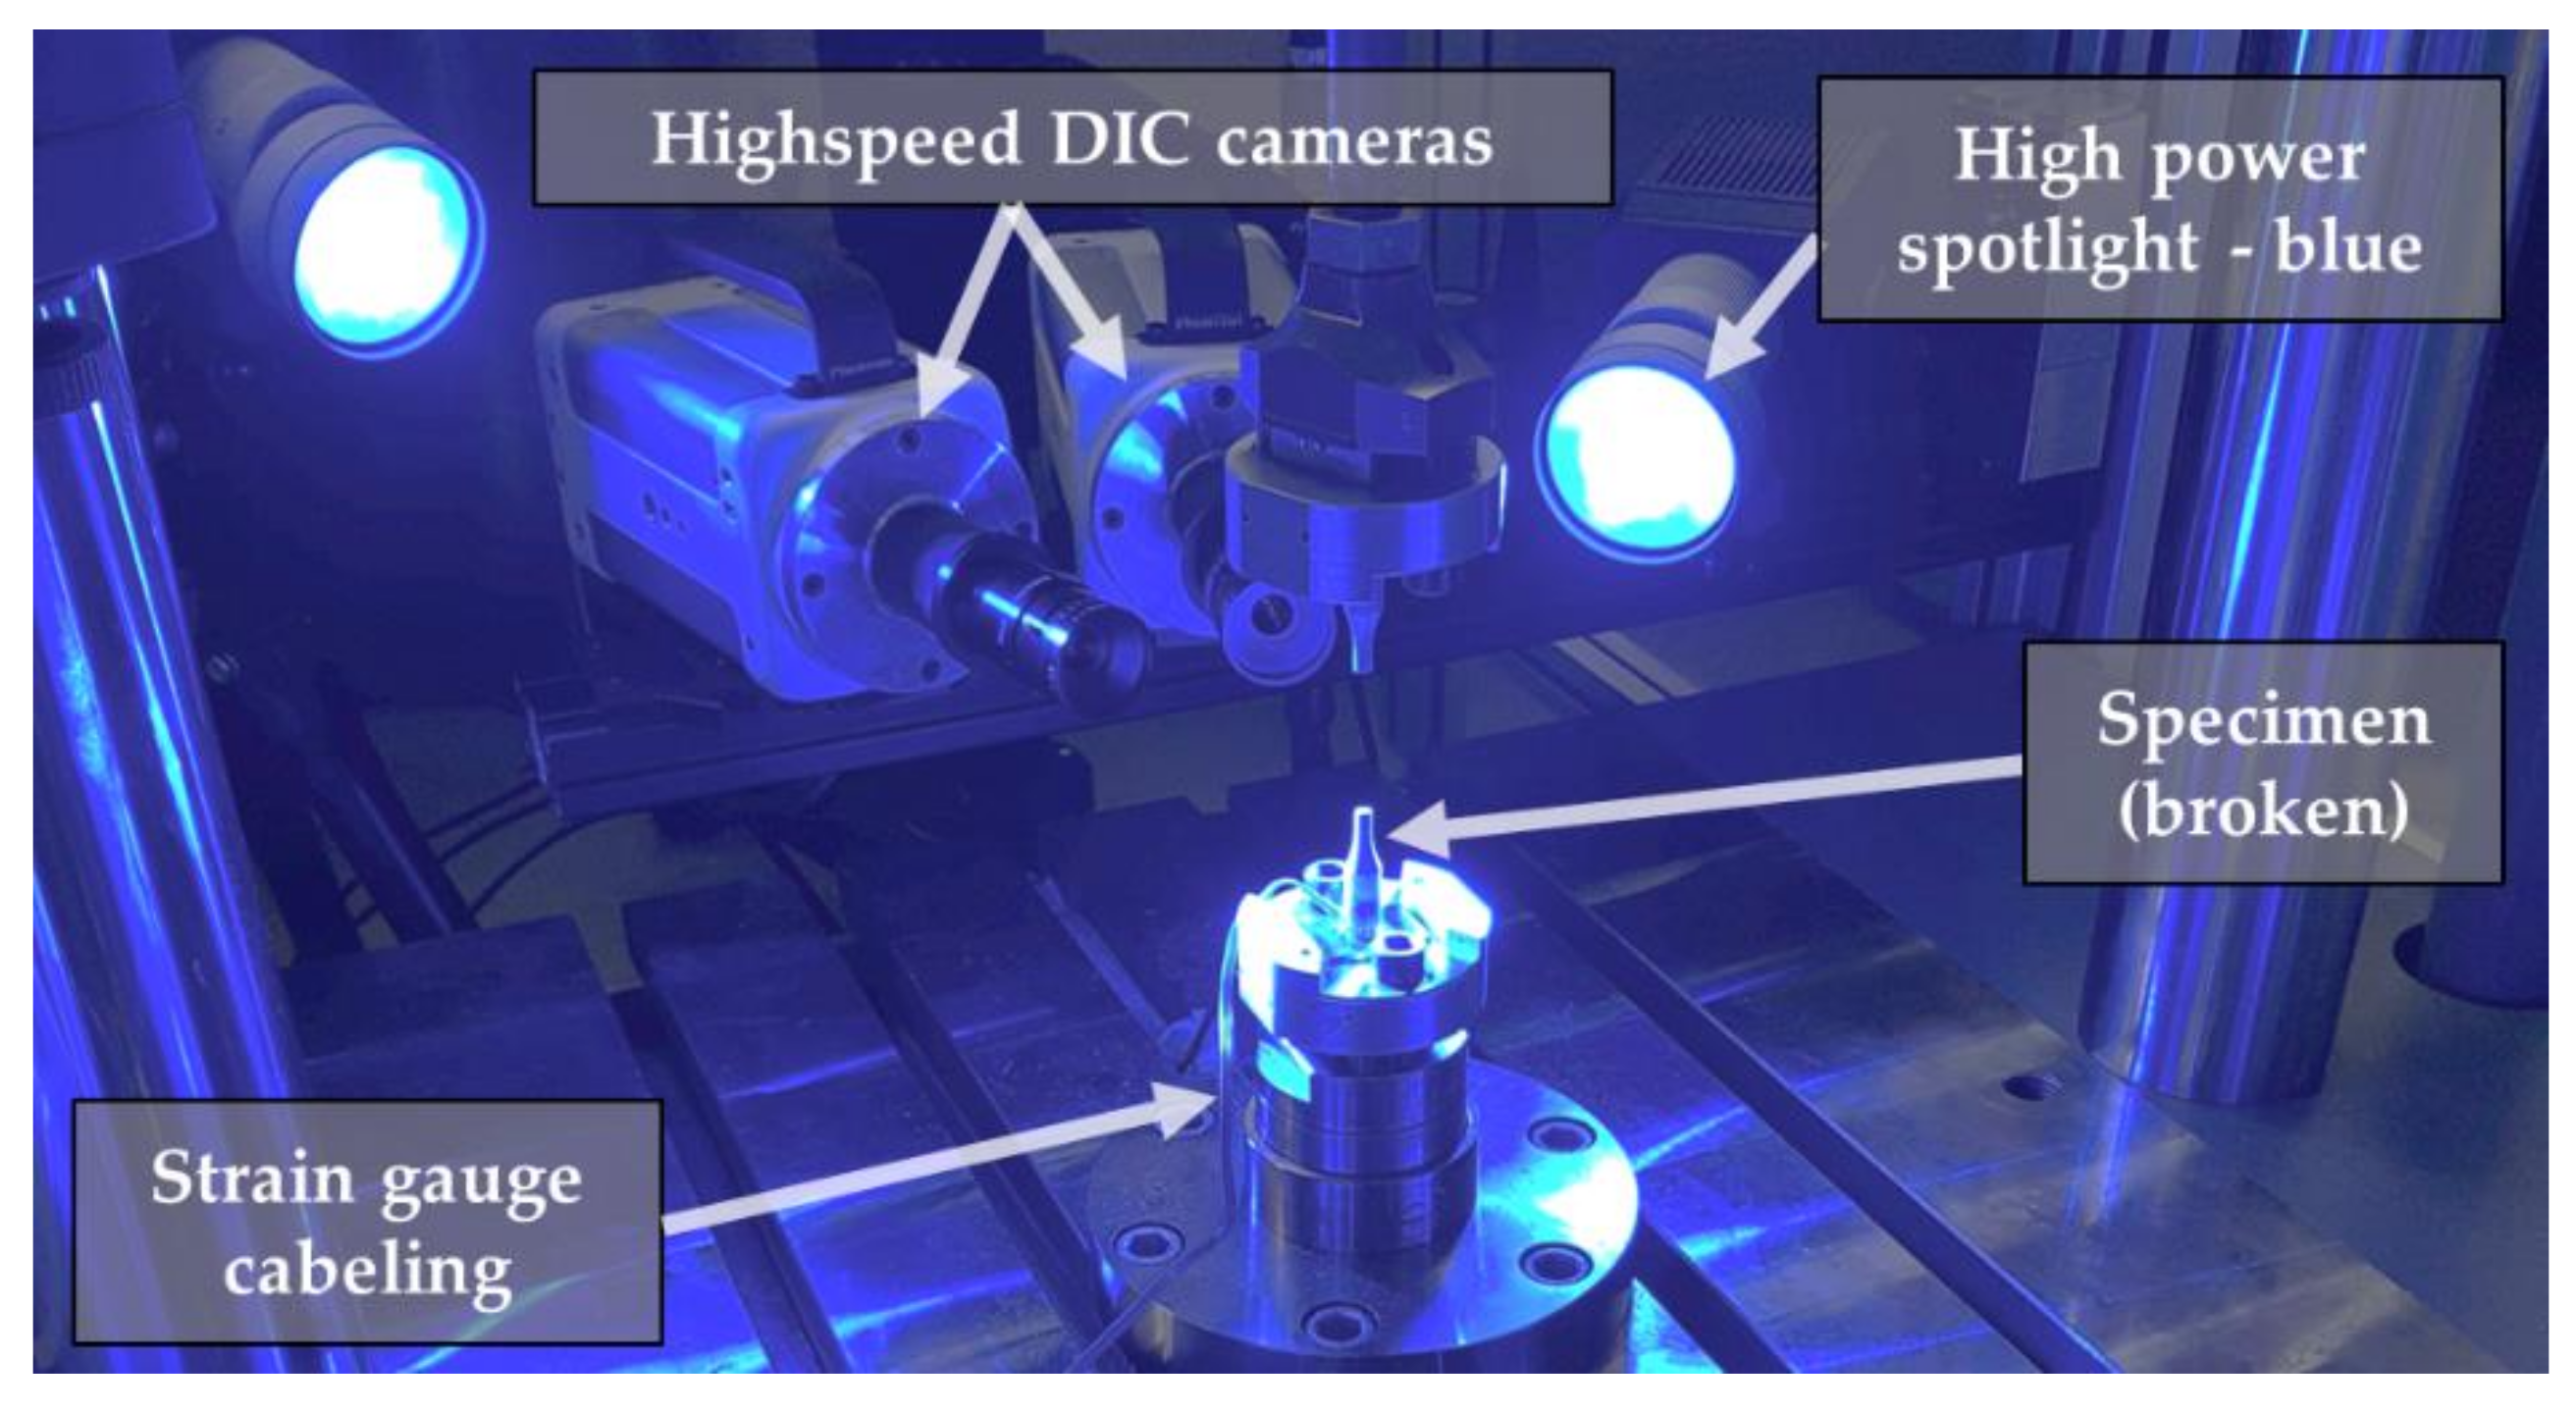
2.7.3. Tensile Tests at a High Strain Rate

The high-speed tensile tests were carried out with a servo-hydraulic high-speed testing system (HTM 5020, ZwickRoell, Ulm, Germany) and additionally recorded with a high-speed camera system (Aramis 3D HHS, GOM, Braunschweig, Germany). The test setup included two high-speed cameras, two high-power spotlights with blue light due to its shorter wavelength, and a piezoelectric load cell. In addition, a strain gauge with a diameter of 12 mm was applied to each specimen shaft (see Figure 2). By measuring the strain in this area with only elastic deformation, it was possible to determine the test force directly on the specimen by using the determined Young’s modulus of the base material. This method of measurement allowed the exclusion of the influence of travelling stress waves, which are usually picked up by the load cell [26]. Hence, both measurement techniques (DIC and strain gauge) were advantageous over machine data from the load cell or piston stroke. The presented test setup enabled recording rates of 40.000 fps, and meanwhile, a fully visualizable strain distribution on the specimen (Figure 8) was possible. With regard to the average test time of about 0.75 ms, a resolution of 384 × 336 pixels could be achieved. In order to characterize the materials’ behavior under crash loadings, the maximum test speed of 5 m/s was chosen, which corresponds to a strain rate of 400 s−1.

3. Results and Discussion

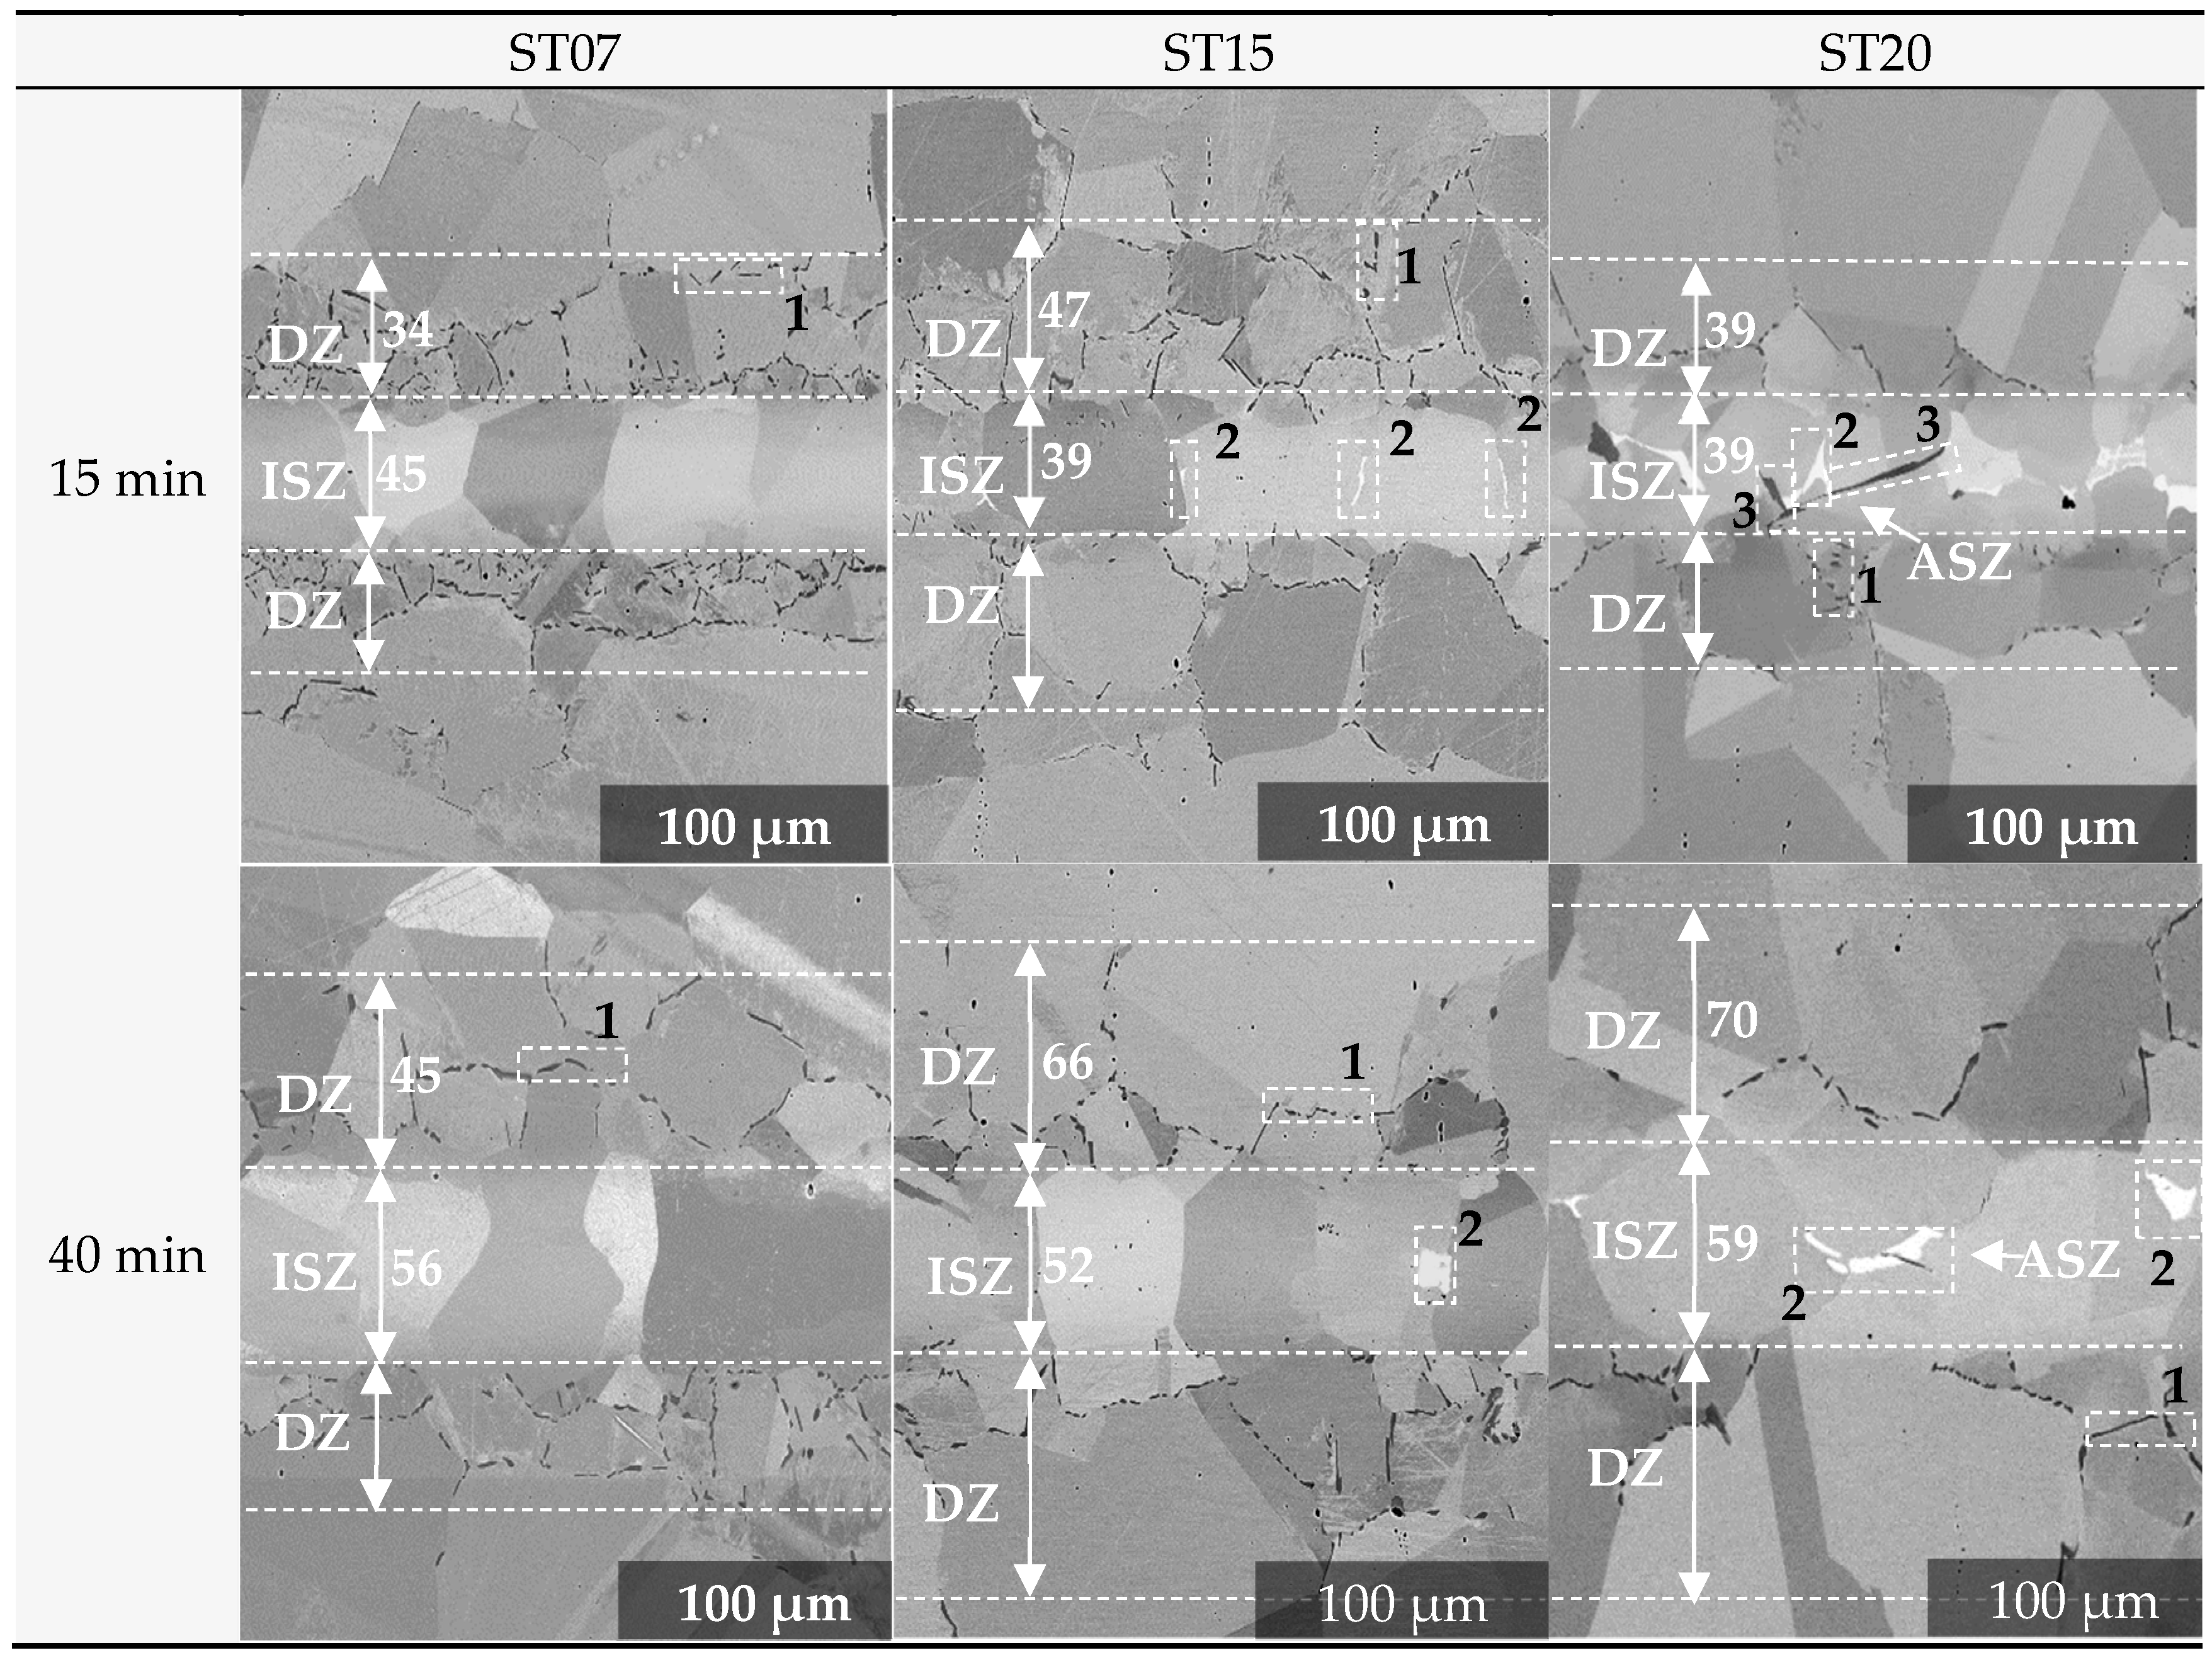
3.1. Alloying and Holding-Time-Dependent Microstructure Formation

A comparison of cross-sections of the investigated joints ST07, ST15, and ST20 with holding times of 15 and 40 min is given in Figure 9. The brazing seam can microstructurally be divided into three main zones [27,28]: the isothermal solidification zone (ISZ), the athermal solidification zone (ASZ), and the diffusion zone (DZ). The ISZ is mostly composed of nickel solid solution. In the ASZ, the eutectic degenerated structurally into two main phases: borides (black phases, marked 3 in Figure 9) and silicides (white phases, marked 2 in Figure 9) [15,29]. The DZ is the transition zone between the material that was influenced by the brazing process and the adjoining base material. The fine chromium borides (CrB) on the grain boundaries highlighted with number 1 in Figure 9 are the main identifier of this zone [12,30]. The analyses of the cross-sections show that the final microstructure depends on the time of isothermal solidification and the elemental composition of the filler metal. With the increased holding time of brazing of 40 min, the seam became more homogeneous for specimens ST15 and ST20. Individual phases (numbers 2 and 3, Figure 9) decreased or almost disappeared in the resulting microstructure, since the brazing process basically finished and, as a result, only a very small amount of the eutectic composition of the liquid phase was present upon cooling. Since silicon (Si) has a lower diffusion coefficient than boron (B) in steel [31], borides (number 3, Figure 9) disappeared completely in the resulting microstructure, but silicides (number 2, Figure 9) remained present as single phases. In the case of ST0715min, these silicide phases were no longer detectable. The material state ST1515min indicated thin layers of silicide between the nickel grains. In the cross-section of ST2015min, blocky borides and silicides were already present. Taking into consideration the chemical composition of the filler metals (see Table 1) and the microstructural features, it can be concluded that the presence of molybdenum (Mo) and an increasing amount of chromium (Cr) in the filler metal hindered the diffusion of melting-point-depressed (MPD-) elements, such as Si and B [32,33]. As a consequence, a decrease in the number of fine borides (number 1, Figure 9) along the boundaries of the steel grains in the DZ occurred with increasing amounts of Cr in the filler metal. In addition, a formation of big individual silicides and borides (ASZ) in the seam center (numbers 2 and 3, Figure 9) occurred as a consequence. The phases are discussed in more detail in [15], including: complex phases (Cr, Fe, Ni, Mn, Mo)3B2 for the borides and (Cr, Fe, Ni, Mo)3Si for the silicides.
When the holding time was increased by 25 min, a decrease in the number of fine borides in the DZ occurred due to the coagulation into thicker layers. Additionally, the thickness of the seam increased by 40–70% (Figure 9). The latter effect was associated with the recrystallization and absorption of adjacent fine steel grains by nickel grains. The analyses of the micro-structure allowed the conclusion that a small distance between the central individual phases in the case of the 15 min holding time could facilitate the crack propagation and reduce the UTS, as well as impact toughness.
Additional investigations using EBSD phase analysis (Figure 10) demonstrated the presence of body-centered cubic iron (BCC-Fe or alpha-iron) in the DZ. In Figure 10, the phase of gamma-iron (faced-centered cubic iron or FCC-Fe) is also defined, but it is indistinguishable from nickel, which also has an FCC structure. Since the possibilities of EBSD measurements are limited, α`-martensite and ferrite were difficult to distinguish, and ε-martensite was difficult to determine [34]. Thus, the BCC-Fe formation in the DZ could be due to two possible microstructural causes. The first is the fact that AISI 304L steel is a metastable austenite [35,36], and ferrite formation may occur due to the depletion of austenite stabilizers, which go into steel grain boundaries, combining with chromium borides [15]. The second is the fact that the brazing seam is a heterogeneous construction that consists of different phases with different thermal and mechanical properties. These differences accumulate the stress state due to cooling after brazing, which may induce martensite formation [35,36,37]. Additional residual stress investigations for understanding this thesis are given below.

3.2. Residual Stresses

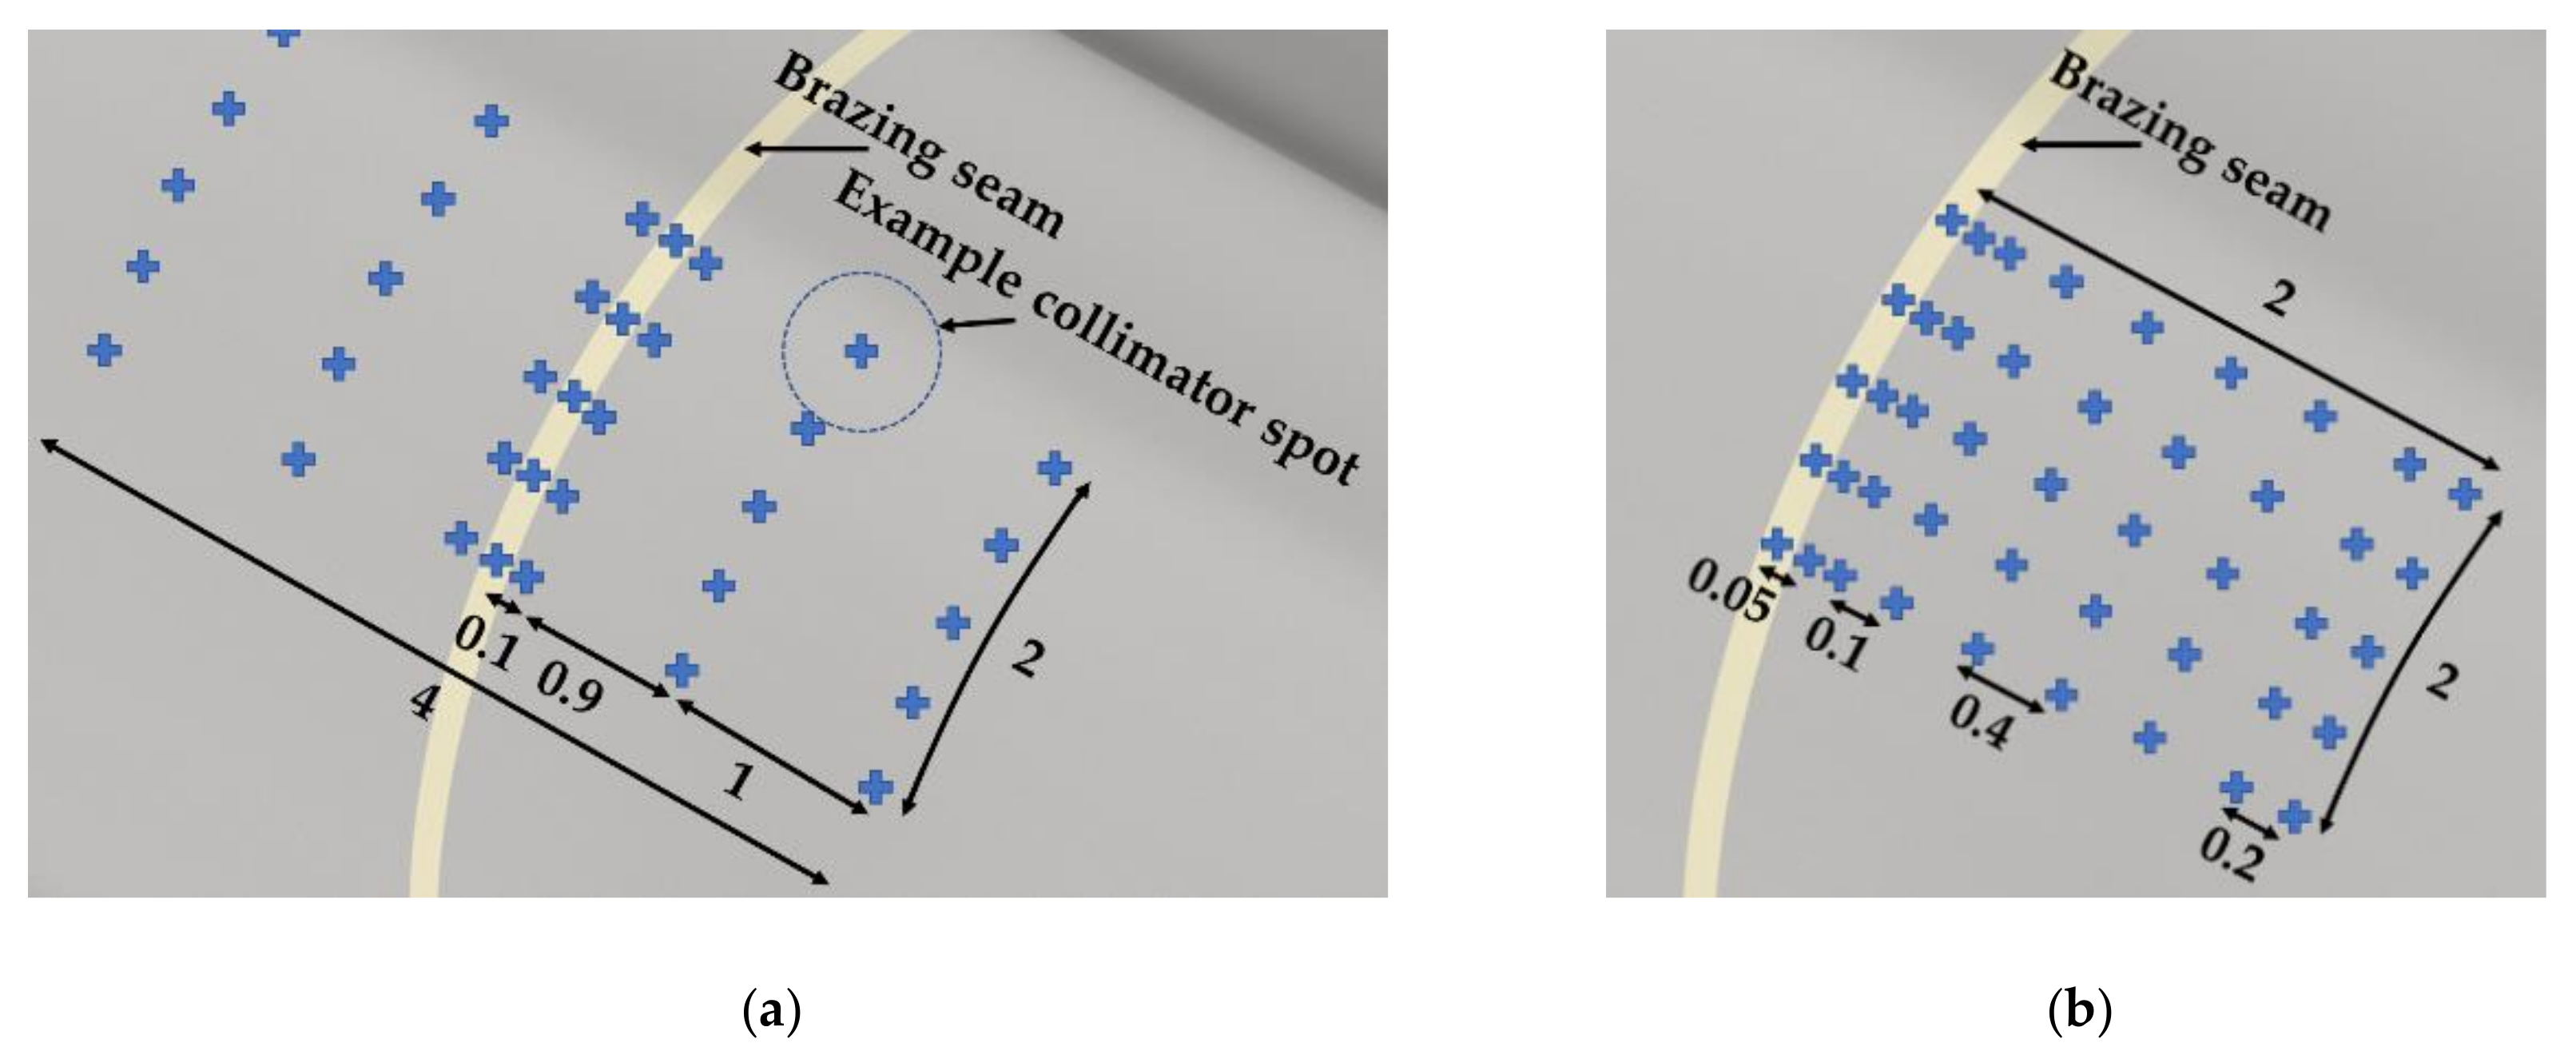
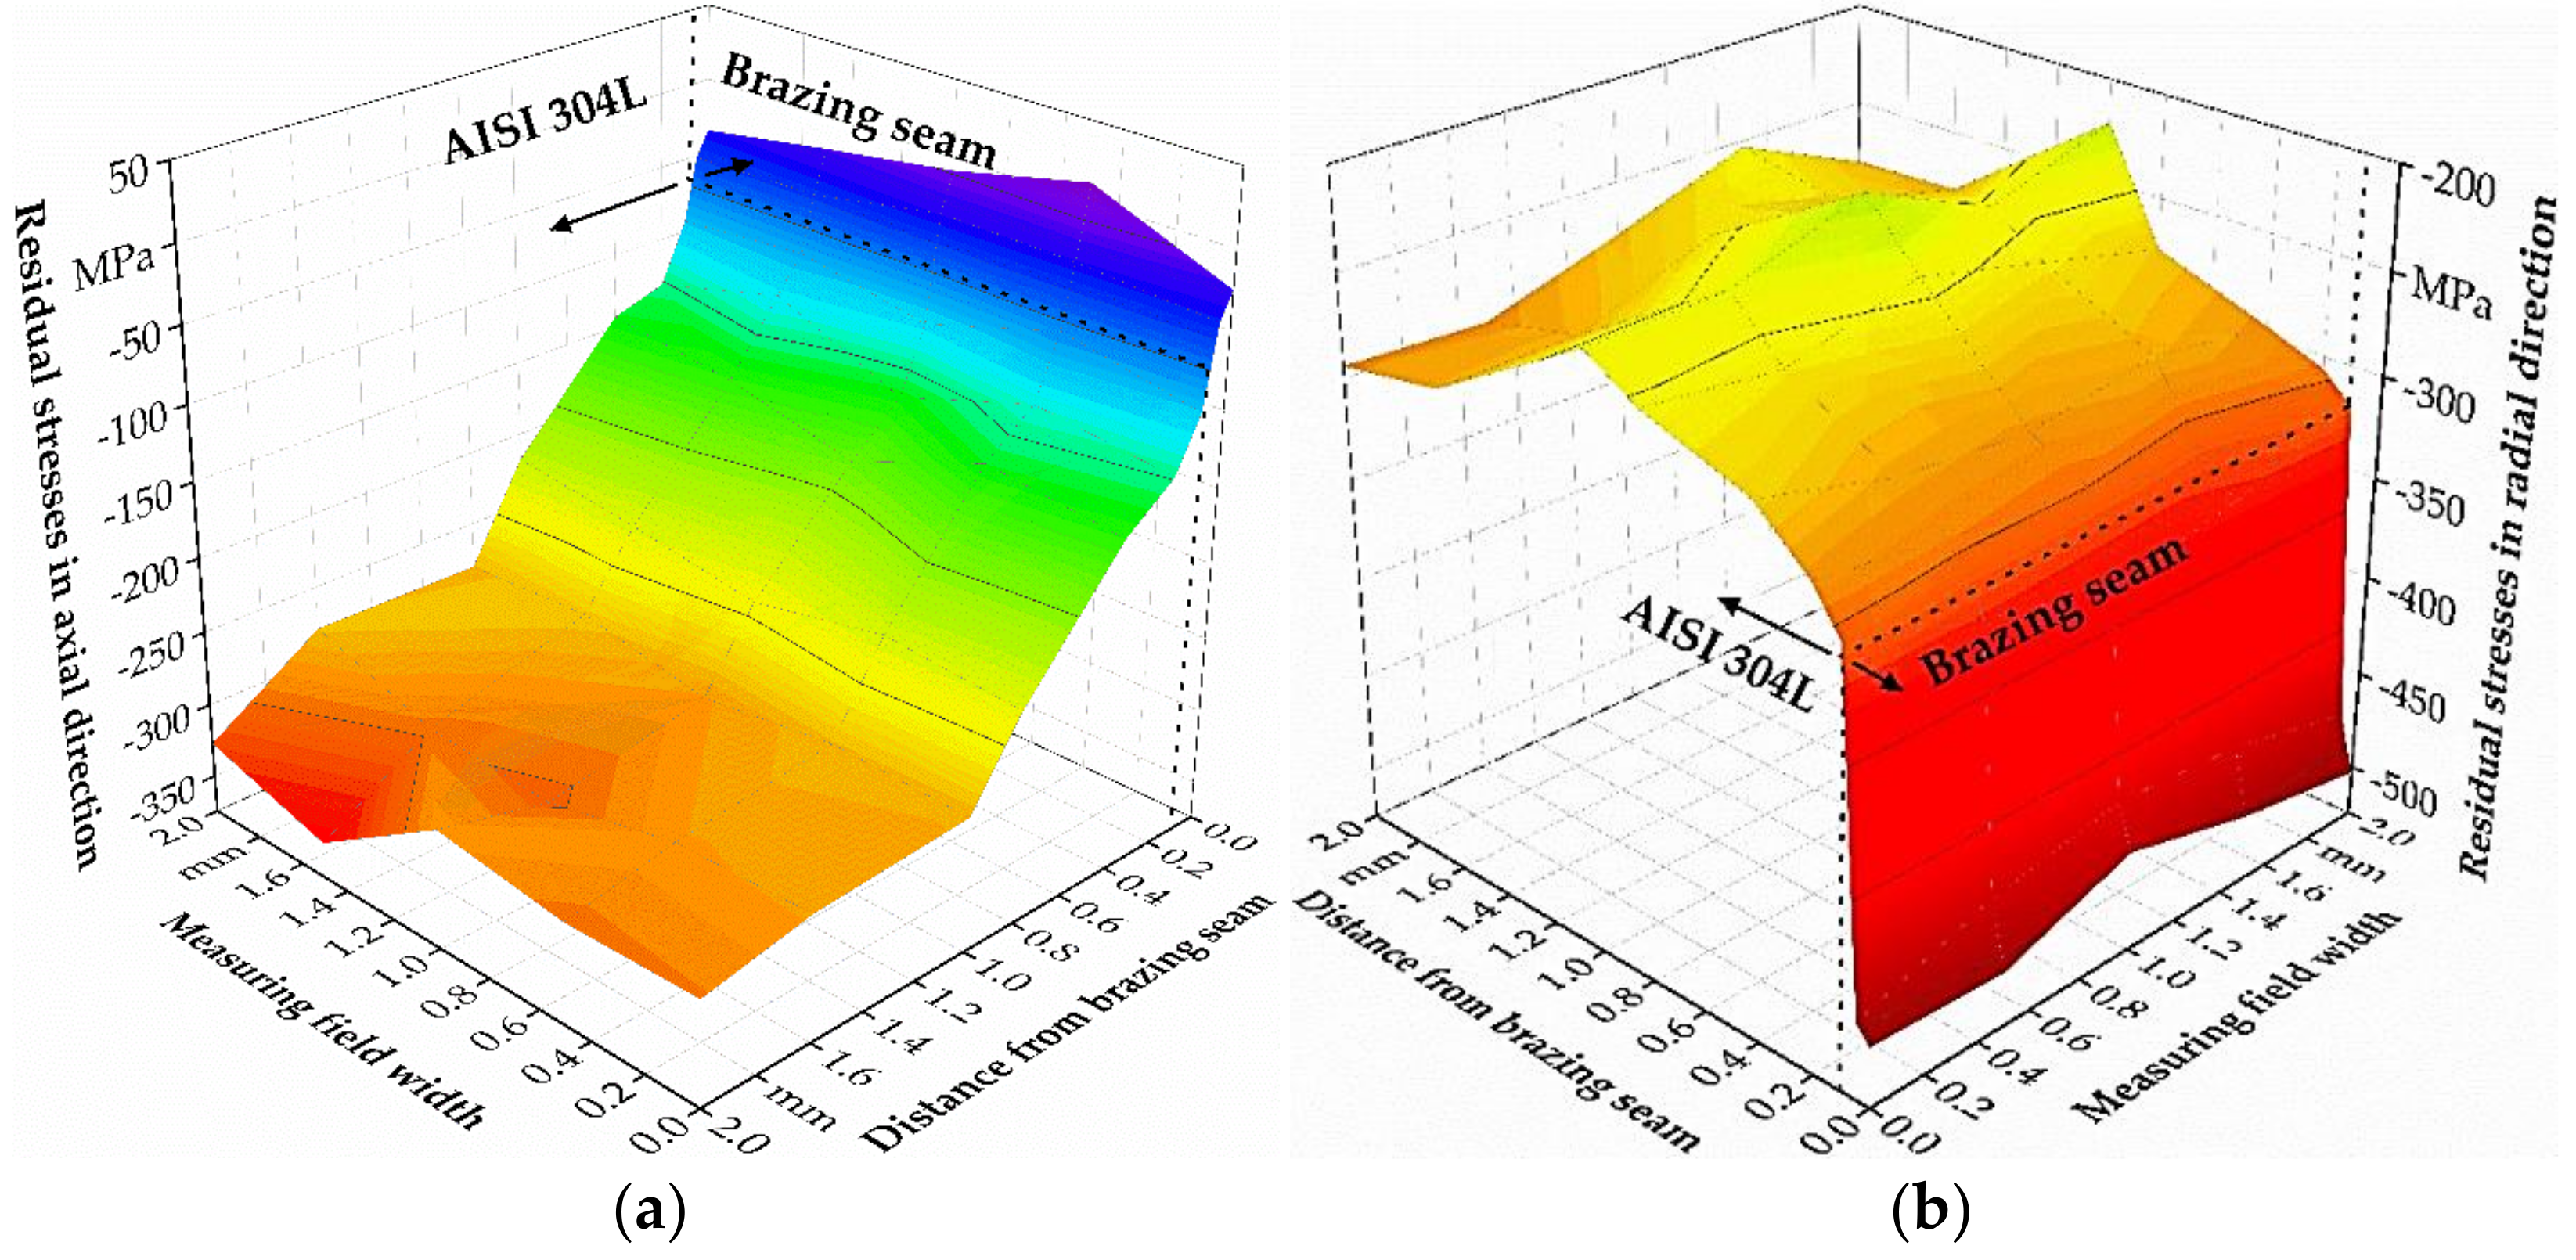
3.2.1. Measured Distribution in the Radial and Axial Directions

The residual stresses were analyzed for ST2040min, as shown in Figure 11. This specimen was selected because it showed the highest measurable residual stress gradient.
The stresses were analyzed in consideration of the directional dependence of the stress measurements in the axial (Figure 11a) and radial (Figure 11b) directions. Both directions indicated a general compressive stress state, whereby the compressive stresses in the radial direction exceeded the compressive stresses in the axial direction. The lower compressive stresses in the radial direction indicated a high stress-induced performance of the specimen investigated. The compressive stress state in the axial direction decreased with increasing distance from the brazing seam. The compressive stress at the brazing seam was σ t a n g = −50 MPa, and it showed a significant drop to less than σ t a n g = −200 MPa within a distance of d = 0.6 mm from the brazing seam. On the contrary, the residual stress changed from σ r a d = −500 MPa in the brazing seam to σ r a d = −250 MPa within a distance of d = 0.6 mm.
As the depth in which 95% of the X-rays were absorbed was 6.096 µm, the values given represent the stress state at the outer surface. The influence of the turning process used for the fabrication of the specimens out of the brazed butt joints was not neglectable. The height of the stresses at the base material was in accordance with the results of [38], which were obtained for steel specimens after turning. The gradient of residual stresses with increasing distance from the brazing seam will be discussed with the results of the calculated residual stresses after brazing in Section 3.2.3.

3.2.2. Influence of Alloying and Holding Time

Apart from the local distribution gradients of the residual stresses in dependence on the distance from the brazing seam, differences in the integral residual stresses σ r e s were investigated for the different alloying and holding time variations (Table 5).
The investigated modes of ST20, ST15, ST07, and the unbrazed specimen showed comparable compression stress states of approximately σ r e s b a s e m a t e r i a l =   −250 MPa in the base material. The maximum value of residual stresses was detected for ST2040min with σ r e s S T 20 40 min =   −490 ± 57 MPa, followed by ST1540min with σ r e s S T 15 40 min =   −475 ± 28 MPa and σ r e s S T 07 40 min =   −409 ± 36 MPa for ST15 and ST07, respectively. The 40 min holding time variations showed a decreased compression state compared to the 15 min holding time variations.
The difference between the specimen variations was in the residual stress state in the area of the brazing seam. However, the compressive stress state showed an increasing tendency from ST20 to ST15 to ST07. This tendency was accompanied by a stress gradient between the center of the brazing seam, the boundary area, and the AISI 304L base material. A uniform compressive stress state may increase the resistance to crack growth in homogeneous materials, but it is suspected here that the local stress gradient induced a higher crack growth potential, which needed to be verified in the following mechanical tests. Due to the fact that rather macroscopic length scales were used, a correlation with the location of the failure was not found based on the results in the present study. In [39], it was found out through simulations that there must exist a local stress peak between the ISZ and the DZ due to diffusion effects. For further investigations, interrupted testing methods could be used to draw the final conclusion on the role of the stress state in the brazing seam on crack initiation. Additionally, further investigations are necessary to clarify the statistical significance of the difference between the stress states detected in terms of the roles of the number and locations of brittle phases in the DZ and ISZ. Apart from these findings, for the holding time of 40 min, the brazed joints with a holding time of 15 min showed the tendency of a further decreased stress state in general and between the brazed joint states of ST2015min, ST1515min, and ST0715min. However, the reduced sizes of the DZ and the ISZ for the holding time of 15 min imply a higher partition of the base material analyzed with X-ray diffraction, since the collimator diameter and, thereby, the measurement point were the same for both holding times. Therefore, comparability could only be ensured within one holding time variation.

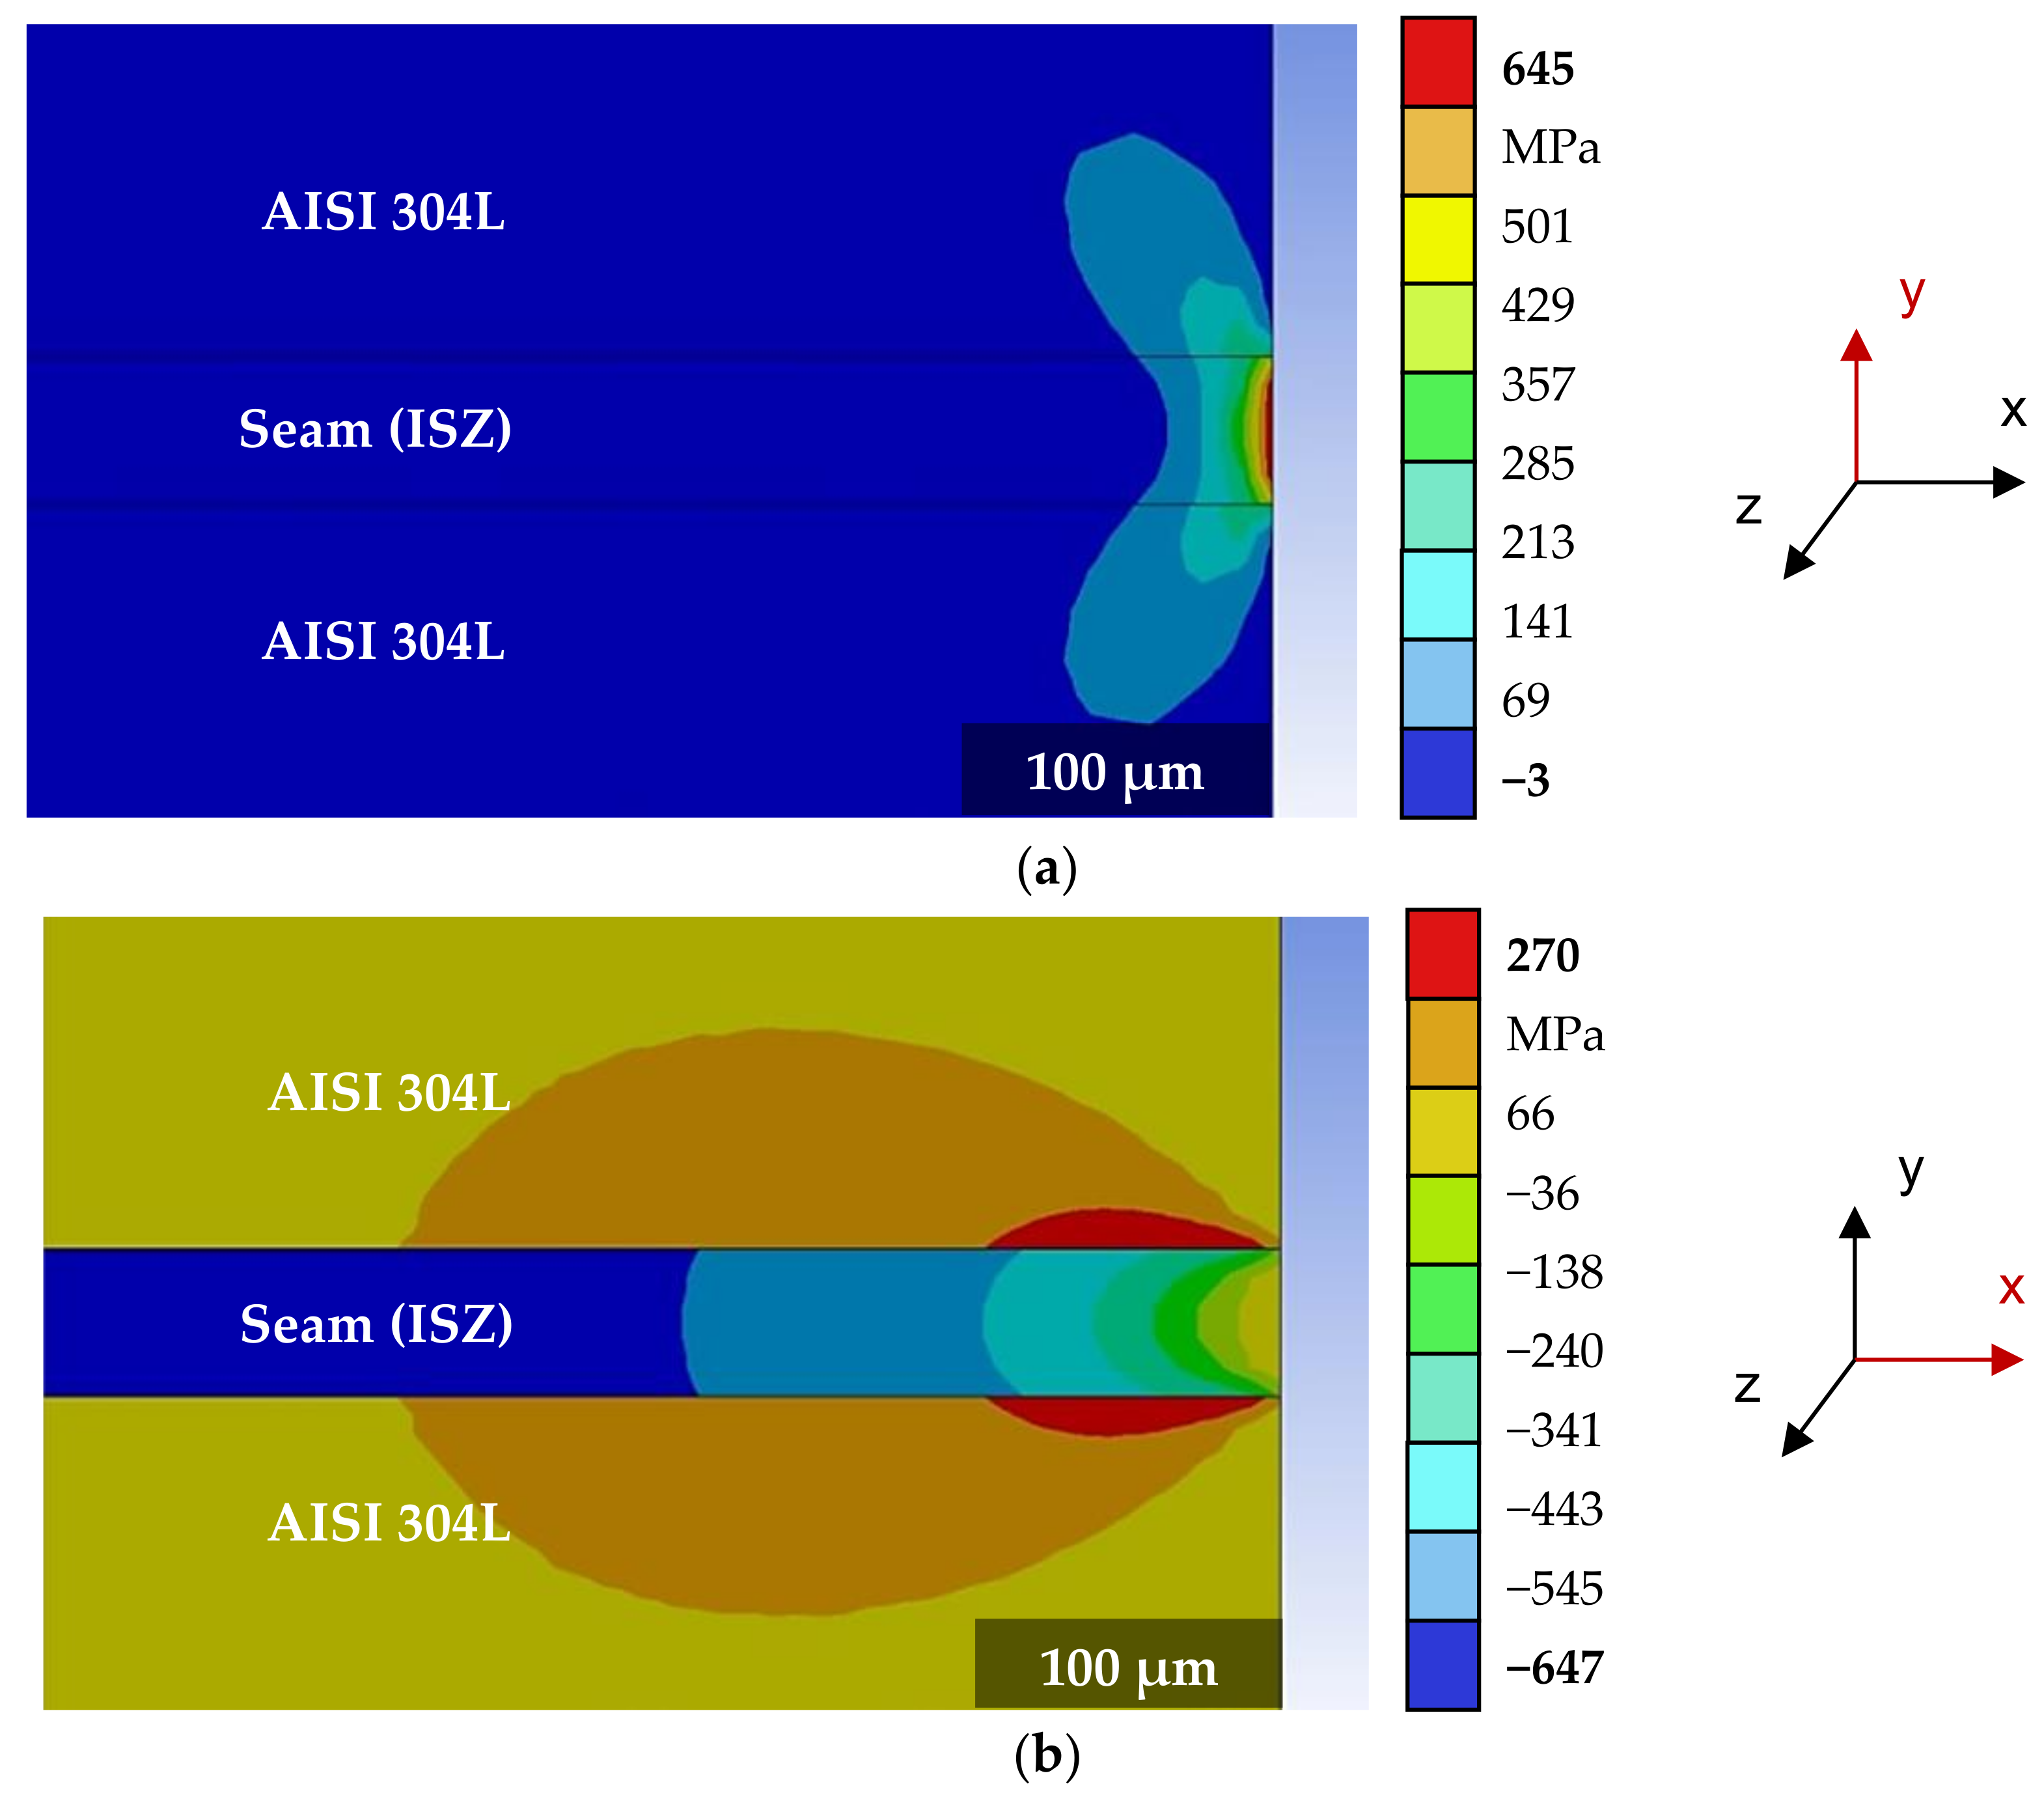
3.2.3. Calculated Distribution of Residual Stresses after Brazing

The thermally induced stresses during brazing due to different CTEs were calculated simulatively for the material state ST0715min, as shown in Figure 12. The thermal stresses are seen as one major cause for the macroscopic residual stresses shown in Section 3.2.2. ST0715min was chosen because no diffusion effects were considered in the simulation, and a variation with a short holding time and, thus, less diffusion had to be selected. In addition, for ST0715min, the smallest residual stress gradient was measured (Table 5), and therefore, it was of interest whether the thermal influence on residual stresses was significant for even this variation. Due to the high effort of the experimental determination of the CTE, it was not possible to simulate further variations within the scope of this study.
The stresses are shown for the y-axis (axial direction) in Figure 12a and for the x-axis (radial direction) in Figure 12b. Despite the fact that the brazing seam and steel had rather close CTE, Young’s modulus, and Poisson’s ratio values (Table 3), the calculation demonstrates a perceptible effect of cooling after brazing on the complex stress state. In the axial direction, the tensile stresses arose locally inside the seam at the cylinder surface and relaxed at small depths. The two joined cylinders of steel strained the seam in opposite directions, causing stretching and reaching 645 MPa. The steel and the brazed seam are in a practically stress-free state at depths of more than 75 µm. A similar distribution of residual stress was obtained in [39] for an AISI 316L/BNi-2 joint, where BNi-2 was a filler metal with a composition of Ni7.5Cr4.5Si3.5Fe3.5B wt.%. In the case of the x axis (corresponding with the radial direction), the stress state was complex in the seam region. The stress state of the seam changed from small tensile stresses on the surface to high compressive stresses at a depth of more than 200 µm. On the contrary, tensile stresses arose in the steel in the area adjacent to the seam. Thus, shear stresses arose at the interface of the seam and steel. Consequently, the brazing seam, which had a higher CTE, tended to shrink more during cooling than the steel, but the steel hindered this due to the connection. This tendency is thought to accumulate high compressive stress, reaching 647 MPa. The comparison of the measurement results presented in Section 3.2.2 shows a qualitative agreement with the simulation results, taking into account that the diameter was reduced by 8 mm through turning (see Section 2.1) and polishing, in addition the measurement was integral due to the collimater spot size. Thus, a residual stress value in the radial direction in the brazing seam of more than −500 MPa due to thermal expansion and contraction during the brazing process could be explained. The superposition with the residual stresses due to the mechanical post-processing cannot be clearly separated.

3.3. Mechanical Test Results

3.3.1. Effect of Brazing Process Parameters on the Base Material

Figure 13 presents stress–strain curves of the base material AISI 304L in the standard tensile test according to DIN EN ISO 6892-1. For comparability with the following results, the strains until fracture At obtained through DIC at VL0 = 3mm are additionally given in the diagram as At,DIC. These are significantly higher than the mechanically recorded values, which mostly deviate due to the use of the tactile extensometer in combination with the traverse movement and the influence necking.
AISI 304L was tested as delivered without heat treatment, and was only post-processed to the test geometry. In addition, the base material was tested after heat treatment (annealed) according to the brazing parameters of mode 2 (see 2.2) at 1160 °C and a hold time of 40 min. It can be clearly observed that the steel was softened. The yield strength (YS) and the ultimate tensile strength (UTS) were reduced, but the ductility and the elongation at fracture were increased. One cause can be assumed to be grain growth [40], since the annealed steel showed a 30% fraction of grain sizes of 100–150 µm and the appearance of single grains with sizes of > 150 µm. In the non-annealed state, the fraction of grains with sizes of 100–150 µm was not more than 8%, and the other grains sizes were 50–100 µm (50%) and 0–50 µm (36%).
It is also necessary to take manufacturing-induced hardening into account, which can be attributed to a high dislocation density and to a high number of deformation twins, because this will be reduced by annealing, too. In addition, carbides may also have formed, further reducing the strength [40]. This shows that long holding times at high temperatures, which contribute, according to Section 3.1, to the homogenization of the brazed joints, are of limited use for improving the mechanical properties. The average Young’s modulus for AISI 304L should be about 203 GPa [41]. Based on Equation (4), in the linear elastic range, the Young’s modulus was calculated to be 205 GPa for the initial state without heat treatment and 190 GPa for the state after annealing. Considering that the initial state of the cylindrical rods of AISI 304L is most probably hot-rolled and quenched by the original manufacturer, a texture could be created that leads to anisotropy in the initial material state, which could be eliminated by annealing and decreasing the Young’s modulus. However, for verification, further EBSD scans of these two material states are necessary.

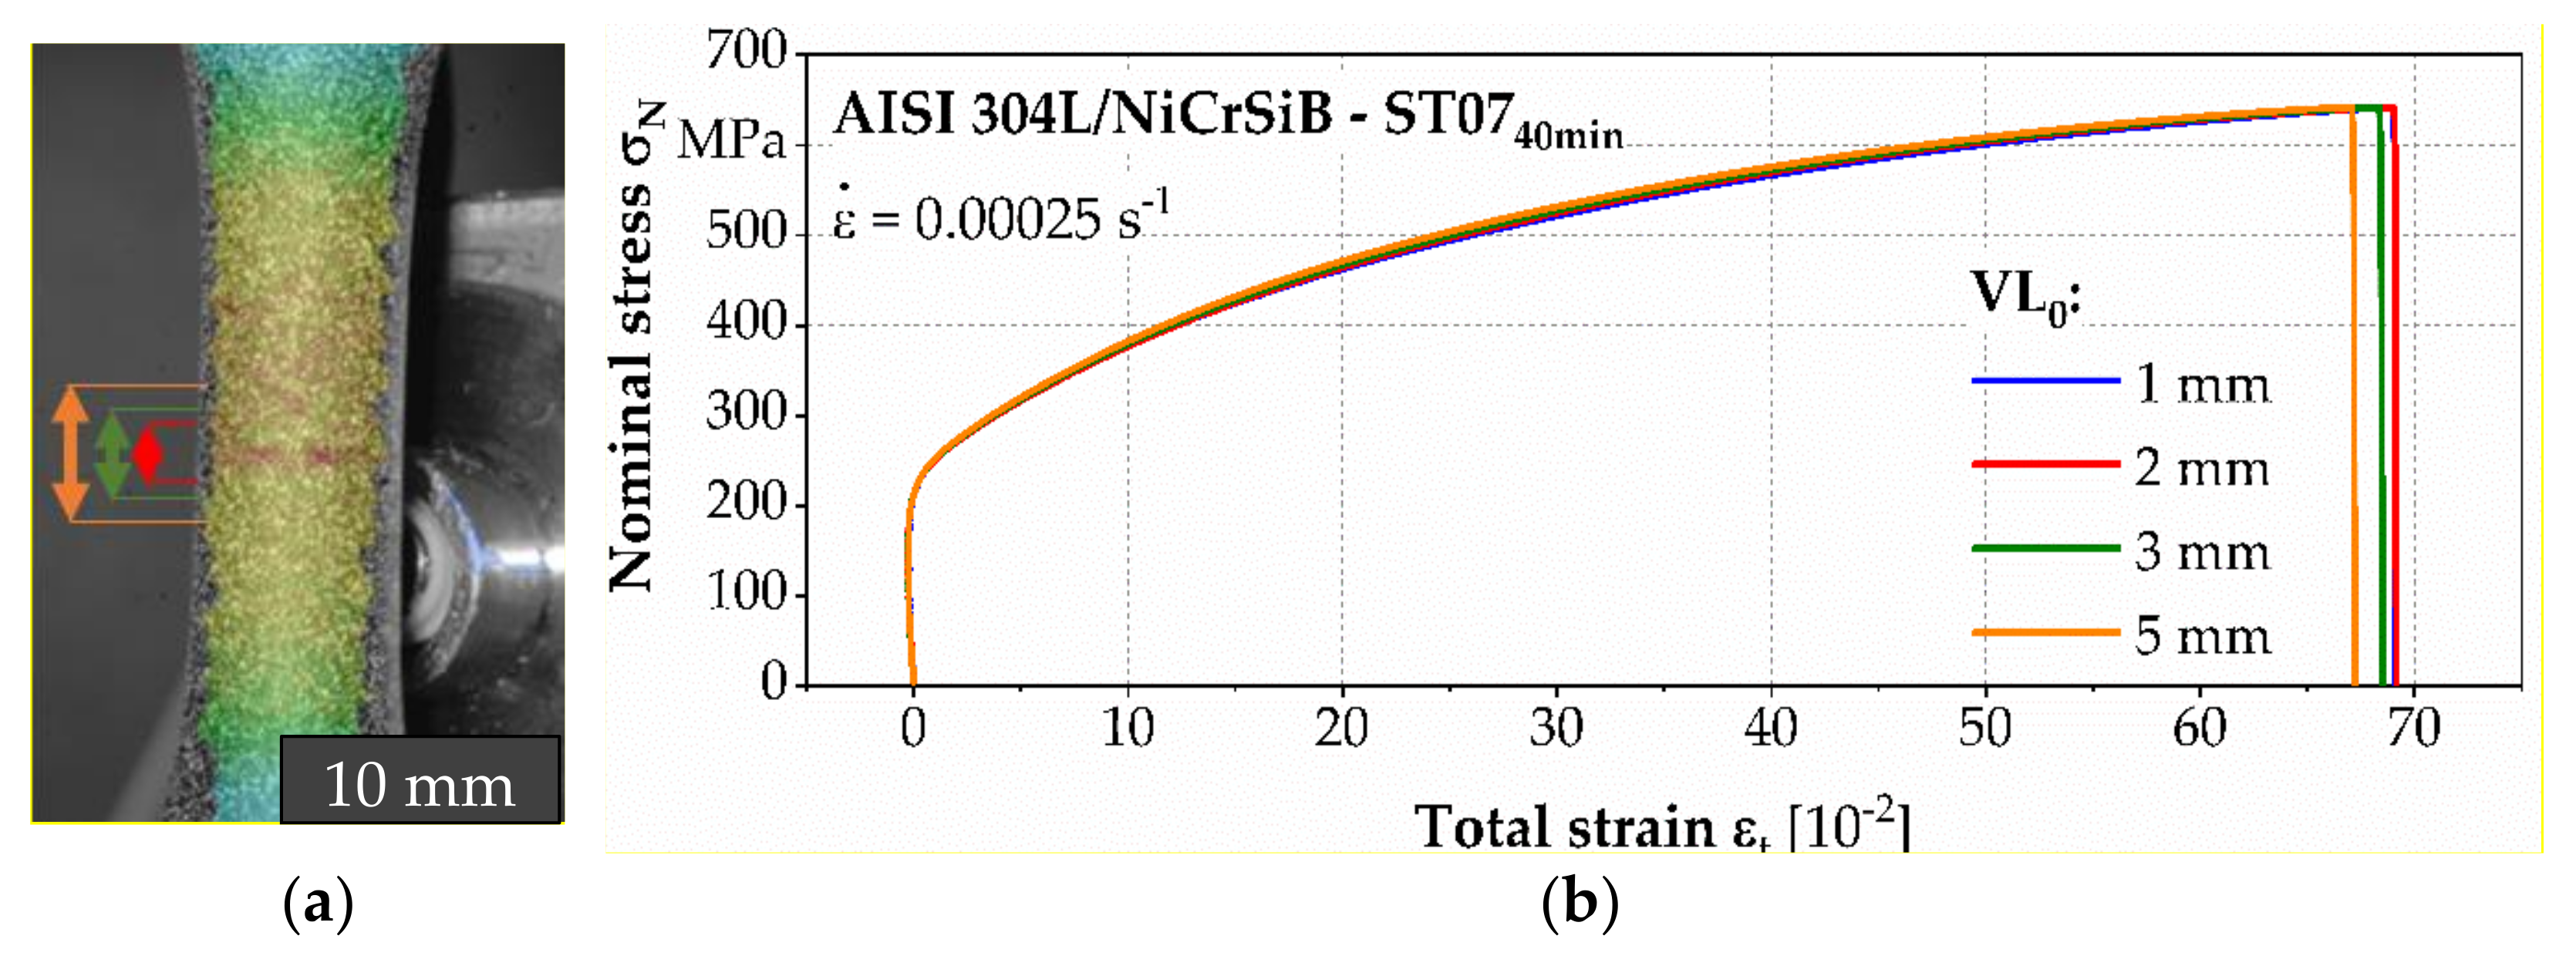
3.3.2. Local Deformation Behavior

An exemplary specimen is shown in Figure 14a. The highest deformation took place in the brazing seam. It is shown in Figure 14b that the difference in strain to failure At between the initial gauge length of a virtual extensometer, VL0 = 1 mm, and VL0 = 5 mm is about 4%. However, with a finer pattern and using a camera with higher resolution, this difference can be higher, as shown in [42] and [25]. For the following experiments, VL0 = 3 mm was chosen, which allowed a qualitatively good evaluation in all tests.
In general, no noticeable necking was observed for the brazed specimens, which is a known phenomen for tight joint clearances, since the geometry restricts the radial deformation of the seam, which would be needed for necking [10]. However, considering the results from 3.1, the following additional-cause hypothesis can be made for the investigated joints: Brittle phases, such as borides and silicides, are part of the load-bearing cross-section, and may already break under deformation in the material due to their lack of ductility. In addition, the differences in the mechanical properties of the surrounding matrix lead to stress peaks, and crack initiation is possible. However, for crack propagation along brittle phases, not only their size, but also their distance from each other is of high importance. The failure of a sufficient number of brittle phases thus reduces the load-bearing cross-section until the remaining cross-section can no longer withstand the applied force. Force fracture occurs before softening mechanisms occur and necking can begin. This hypothesis needs to be evaluated in Section 3.4, which is based on cross-sections of fracture surfaces.

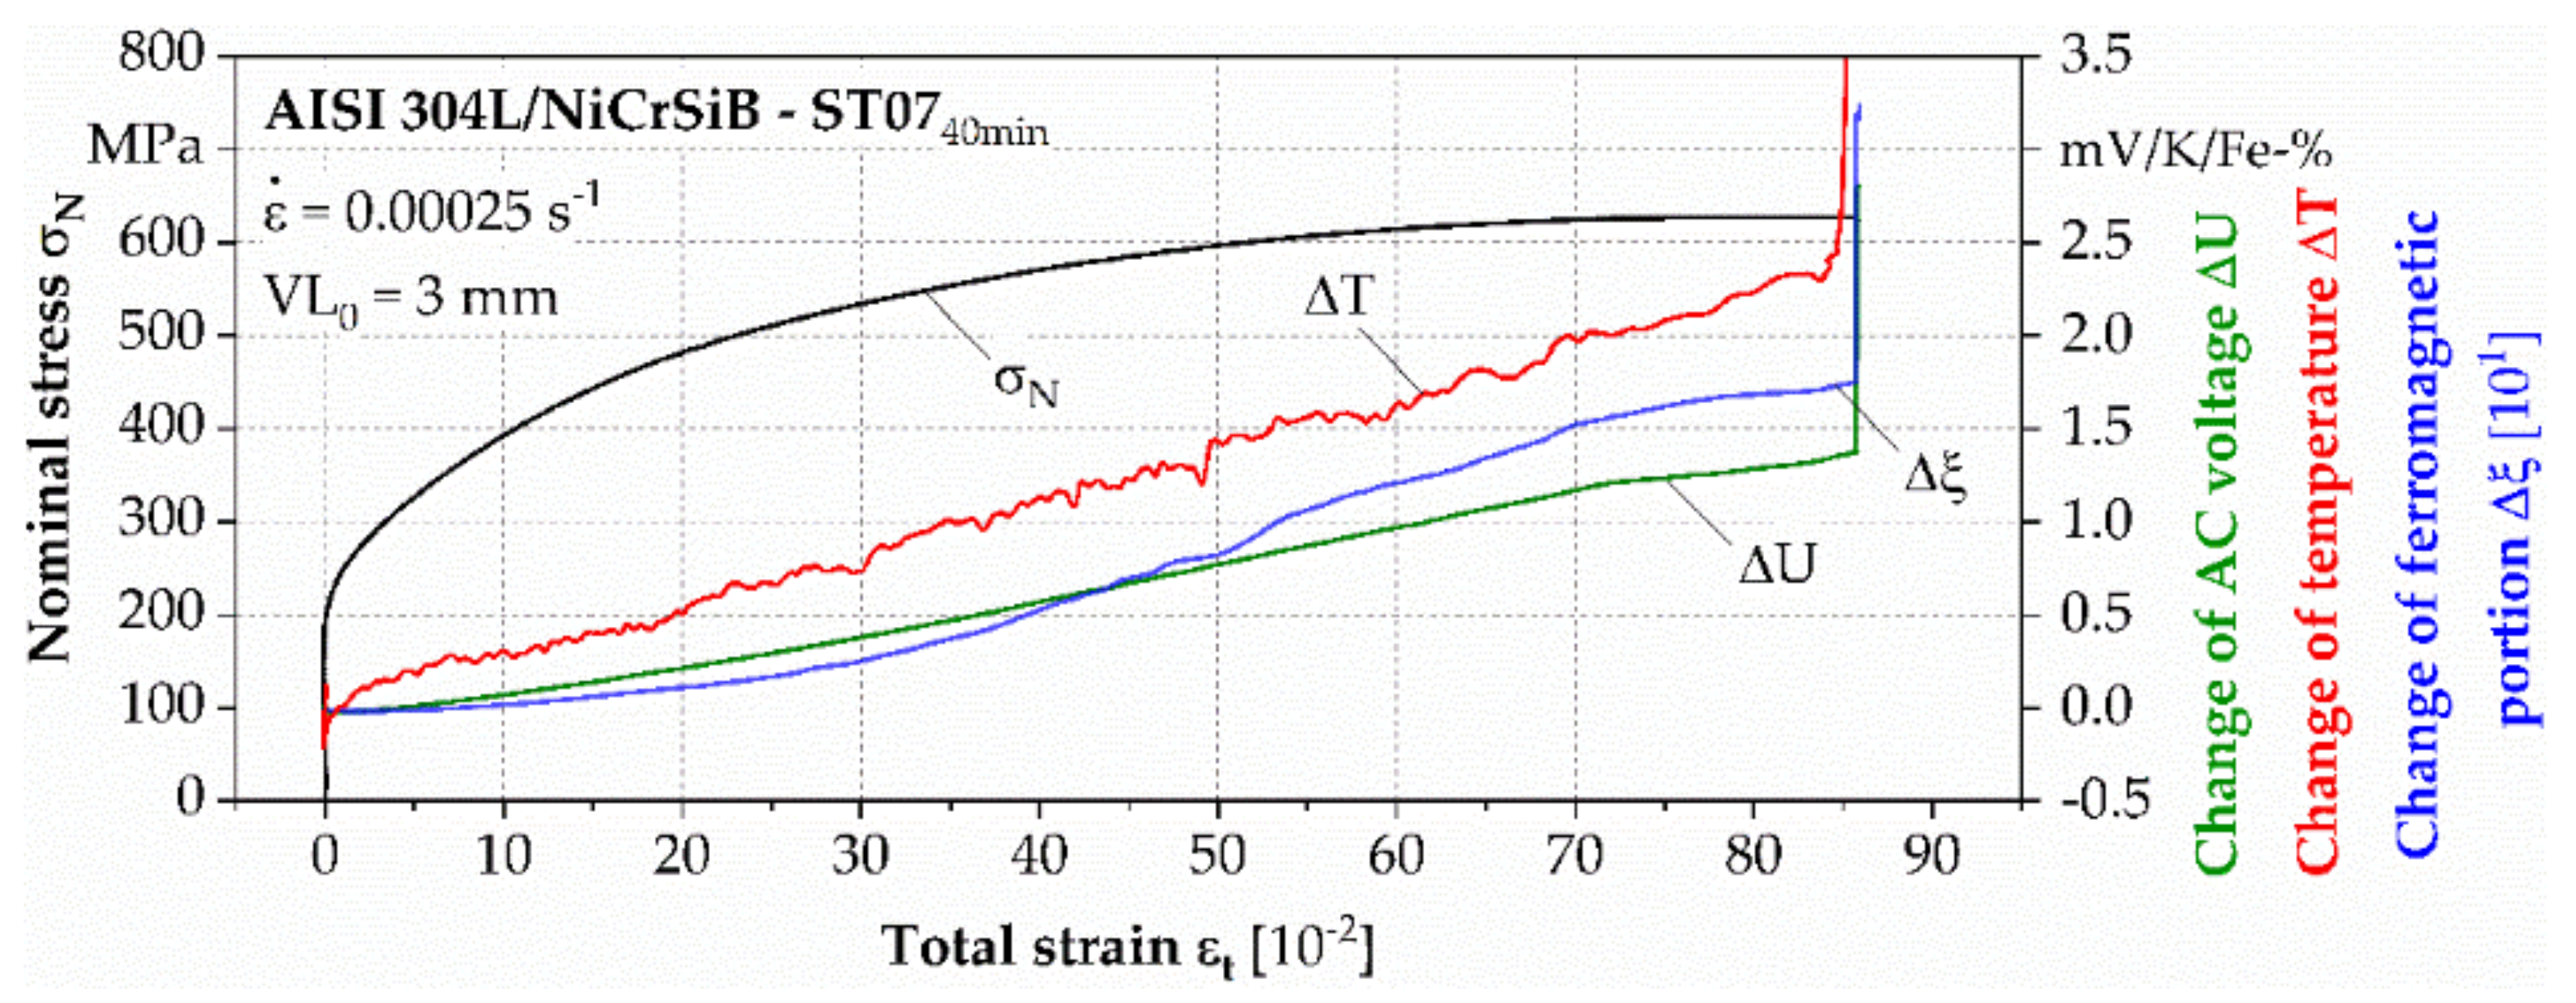
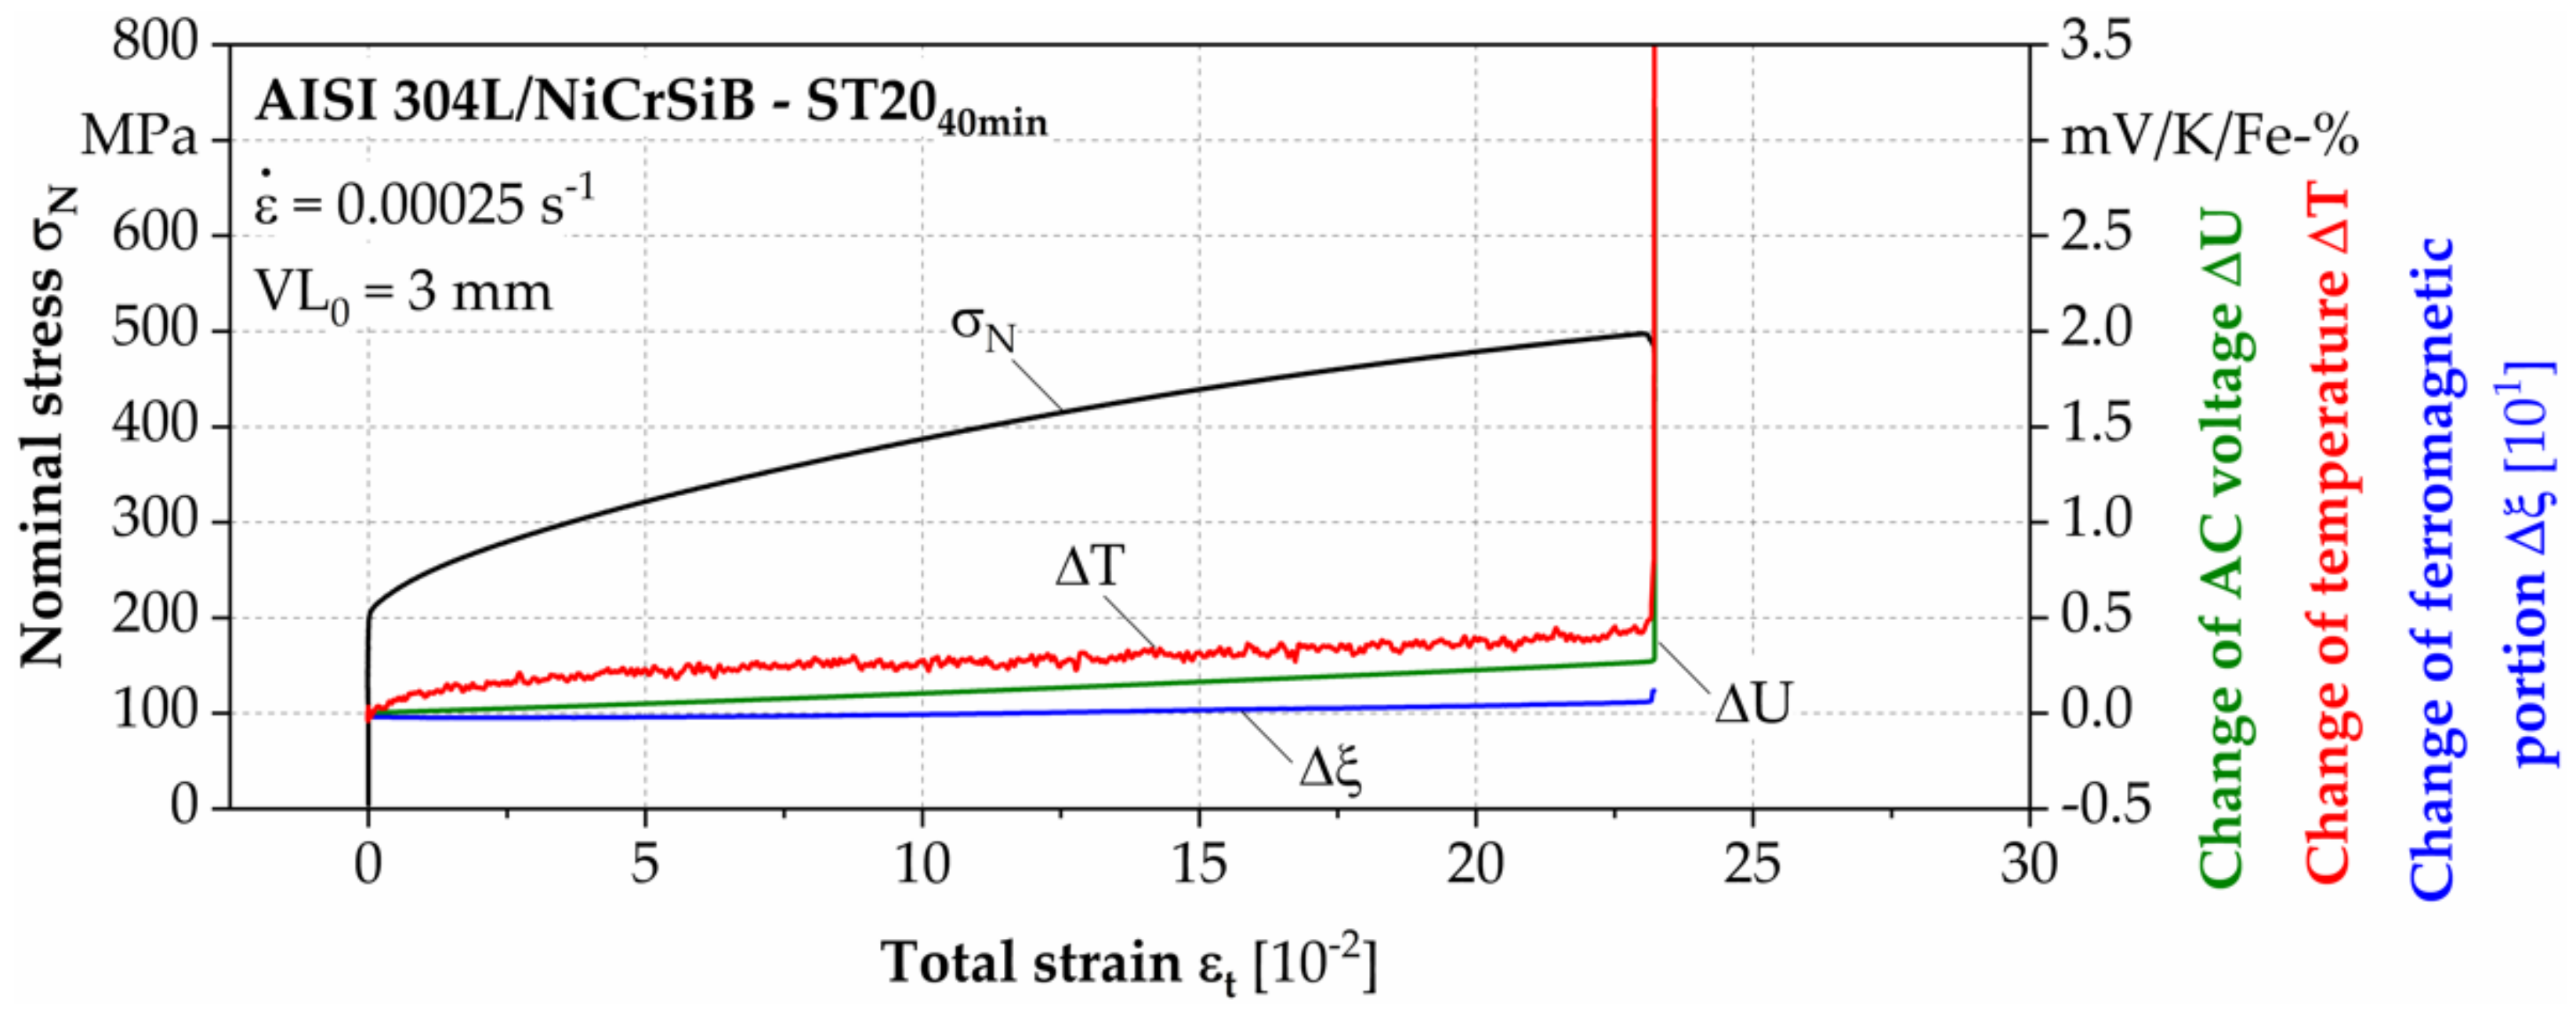
3.3.3. Thermal, Electrical, and Magnetic Material Responses

Figure 15 shows the results of the instrumented tensile test of ST0740min at a low, constant strain rate. Compared to Figure 14, which is a different test for ST0740min, a higher elongation until fracture was observed at a comparable UTS. This difference could be explained by brazing defects (un-wetted areas or pores) inside the joint, which, like brittle phases, contribute to the reduction of the load-bearing cross-section and can be crack-initiating. Differences within an alloy and holding time variation with a comparable portion of brittle phases can therefore be attributed to such defects with high probability, whereby the investigation of the fracture is necessary for exact determination.
In addition to the elongation at fracture, the high strain to fracture is most evident in the specific absorbed energy, calculated according to Equation (2), which, for this test, is ΔEspec = 0.159 J/mm3. This value is comparable—according to [43]—to that of some well-deformable steels that are used for deep drawing, and it is higher than that of the sintered steels investigated in [44]. In general, the mechanical properties of ST0740min and ST1540min are very similar to those of the annealed base material, except for the absence of necking. A measurable ferromagnetic phase transformation, which is most likely related to bcc-martensite, started after about 10% strain at a stress level of about 380 MPa.
The exact determination of the heat (Q) was not trivial due to heat losses during the long test period, but according to Equation (1), it can be assumed that the recorded temperature change is an indicator of the largest fraction of absorbed energy (ΔE). Another fraction of the absorbed energy can be found in microstructural changes. Within this fraction, the approximately 18% ferromagnetic portion is presented. Non-ferromagnetic phase transformations and dislocations that did not lead to phase transformations at all must also be added to this. In [45], it was found in tensile tests for TRIP steels that ΔT of 4.5 K corresponded to about 20% martensite formation.
In comparison to ST0740min, ST2040min shows a significantly reduced UTS (about 25%) and significantly reduced elongation until fracture (about 275%) in Figure 16. The specific absorbed energy was therefore lower, with ΔE = 0.023 J/mm3. Consistently with this result, only small thermal, electrical, and magnetic responses could be measured due to the lower deformation. However, the measured change in temperature, stress, and ferromagnetic portion before fracture was at the level of ST0740min at the same strain level. Until fracture, only a 2% change in ferromagnetic content was measured using the Feritescope®, which needs to be further locally investigated with EBSD in the brazing seam to enable a statement about the influence on the fracture mechanism.

3.3.4. Strain Rate Dependency

Figure 17 shows the stress–strain curve of a high-speed tensile test of the brazed joint of ST0740min. It can be observed that the curve calculated based on the strain gauge values and the calculated Young’s modulus of the base material after annealing (Section 3.3.1) are not affected by travelling stress waves as much, and this is particularly useful for estimating the yield strength. This value was increased compared to the low yield strength in the low-strain-rate tests. Almost no elastic deformation could be noticed, and the joint went directly into plastic deformation. This is a well-known effect for high-speed tests with FCC metals [46]. Furthermore, an increased UTS in connection with a reduced elongation until fracture could be observed. This can be attributed to the fact that dislocations were not given time to change their locations, and thus, plastic deformation was made more difficult [47]. The specific absorbed energy of ΔEspec = 0.164 J/mm3 shows a comparable level (only a 3% increase) to the previously determined energy for ST0740min in Section 3.3.3 at lower strain rates. Therefore, the change in strain rates led to a shift in the mechanical properties, but the possible absorbable energy did not change significantly in this case.

3.3.5. Comparison of Ultimate Tensile Strength and Impact Toughness

Figure 18 presents the combined results of the low-strain-rate tensile tests, high-strain-rate tensile tests, and impact toughness tests. All tests were repeated, but for the tensile tests, only selected specimens are shown, since brazed specimens often contain defects, such as unwetted areas, which can only be identified post-mortem through fractographic inspection and lead to large deviations. Therefore, only defect-free specimens are shown, which can be related to the alloying- and process-dependent microstructure. For a consideration of defects, a large number of specimens would be required for each variation, which was not available for the tensile tests in this study, and thus, no meaningful deviation around the main values could be given.
It is clearly seen that the brazing-mode-related microstructure, in dependence on different filler metal compositions, strongly affects the UTS and impact toughness. In the case of 15 min of holding time, all specimens demonstrated reduced mechanical properties. Due to the presence of individual phases (silicides and borides) in the center of the seam (Figure 9), the greatest decrease in properties was observed for specimens ST15 and ST20, where there was an increased Cr content, and Mo was present. Thus, the worst result of all tests was obtained for ST2015min, which had the largest number of these phases. This indicates the significant effect of these phases on the strength characteristics of the joint, which is especially dangerous for products that experience impact loads. For example, ST2015min showed 2 ± 0.5 J/cm2 of impact toughness, which is extremely low. It is known that toughness is the weak place for joints, both welded and brazed [48]. However, specimens ST0740min and ST1540min showed high impact toughness—86 ±3 J/cm2 and 90 ± 2 J/cm2, respectively—and the best UTS values: about 629 ± 9 MPa for the low-strain-rate tests and 700 ± 5 MPa for the high-strain-rate tests. This demonstrates the positive effect of increased holding time for these alloys. It can also be noted that all specimens were broken across the seam in the case of low-strain-rate tensile tests. However, in the case of high-strain-rate tensile tests, one of three ST0740min was clearly broken (fracture distance to the seam > 2 mm) in the base material. This may have been due to high-plasticity properties of the ST07 seam, which contained the smallest amount of Cr.
A direct comparison of the results of the modified alloying and process parameters to literature values was not possible, but compared to the results of the tensile tests in [49], where several nickel-based industrial filler metals (BNi-2, BNi-,5 and BNi-7) were used to braze AISI 316 joints and a maximum UTS of about 550 MPa was achieved, most of the joints of the current study demonstrated a high quality.

3.4. Fracture Mechanism

Figure 19 shows the fracture surfaces after the impact tests; the direction of the impact was from above (indicated by an arrow). All specimens were broken across the seam. Specimens ST0740min and ST1540min, which showed the best results of the tests, had predominantly ductile fractures, since the surfaces of the fractures had a dimple character, as shown in Figure 20a. The specimen variation ST2015min, which had the lowest toughness and UTS, showed a predominantly brittle fracture, since the surface of the fracture had cleavage formations, as demonstrated in Figure 20b. The specimens ST0715min, ST0740min, and ST1540min had a visually developed surface with a high roughness, whereas ST1540min, ST2015min, and ST2040min showed a smooth surface and low roughness. This correlates with the results in Figure 15 and Figure 16, as the elongation of ST0740min was much higher than that of ST2040min. There were also two fracture areas: I was the first stage of fracture, which had a smoother surface; II was the second stage of fracture, which showed a higher roughness. The specimens that had a large second stage of fracture demonstrated greater plastic deformations and, thus, higher values of impact toughness. Therefore, it can be concluded that strength properties can be reduced by increasing Cr content and decreasing holding time during brazing, during which incomplete athermal solidification occurs.
As shown in Figure 21, the cross-sections of the fracture of ST2015min demonstrate the main failure mechanisms that led to early failure of these brittle specimen variations. It is seen that destruction predominantly occurs through intercrystalline cleavage of silicides (white phases, marked 2 in Figure 21a). The view from above this cleavage is visible in Figure 20b. The cracks occurring in borides that were located in the diffusion zone (gray phases, marked 1 in Figure 21) did not extend into the matrix of the base material. Thus, they are not as dangerous as central and large individual phases, but this demonstrates that brittle phases can already break in the material without having been involved in the final crack propagation. This supports the hypothesis from 3.3.2 regarding the weakening of the load-bearing cross-section due to the early failure of the brittle phases as the cause for the missing necking area.

4. Summary and Conclusions

The resulting microstructures of nickel-based brazed joints were investigated in the present study with respect to the two factors of holding time and alloy composition in terms of the chromium and molybdenum content.
  • It was found that the formation of brittle phases was particularly evident with a high chromium content that, at 20 wt.%, exceeded the content in the base material in combination with molybdenum for a short holding time of 15 min.
  • The longer holding time of 40 min led to the homogenization of the brazing seam with fewer borides and silicides in all filler metals.
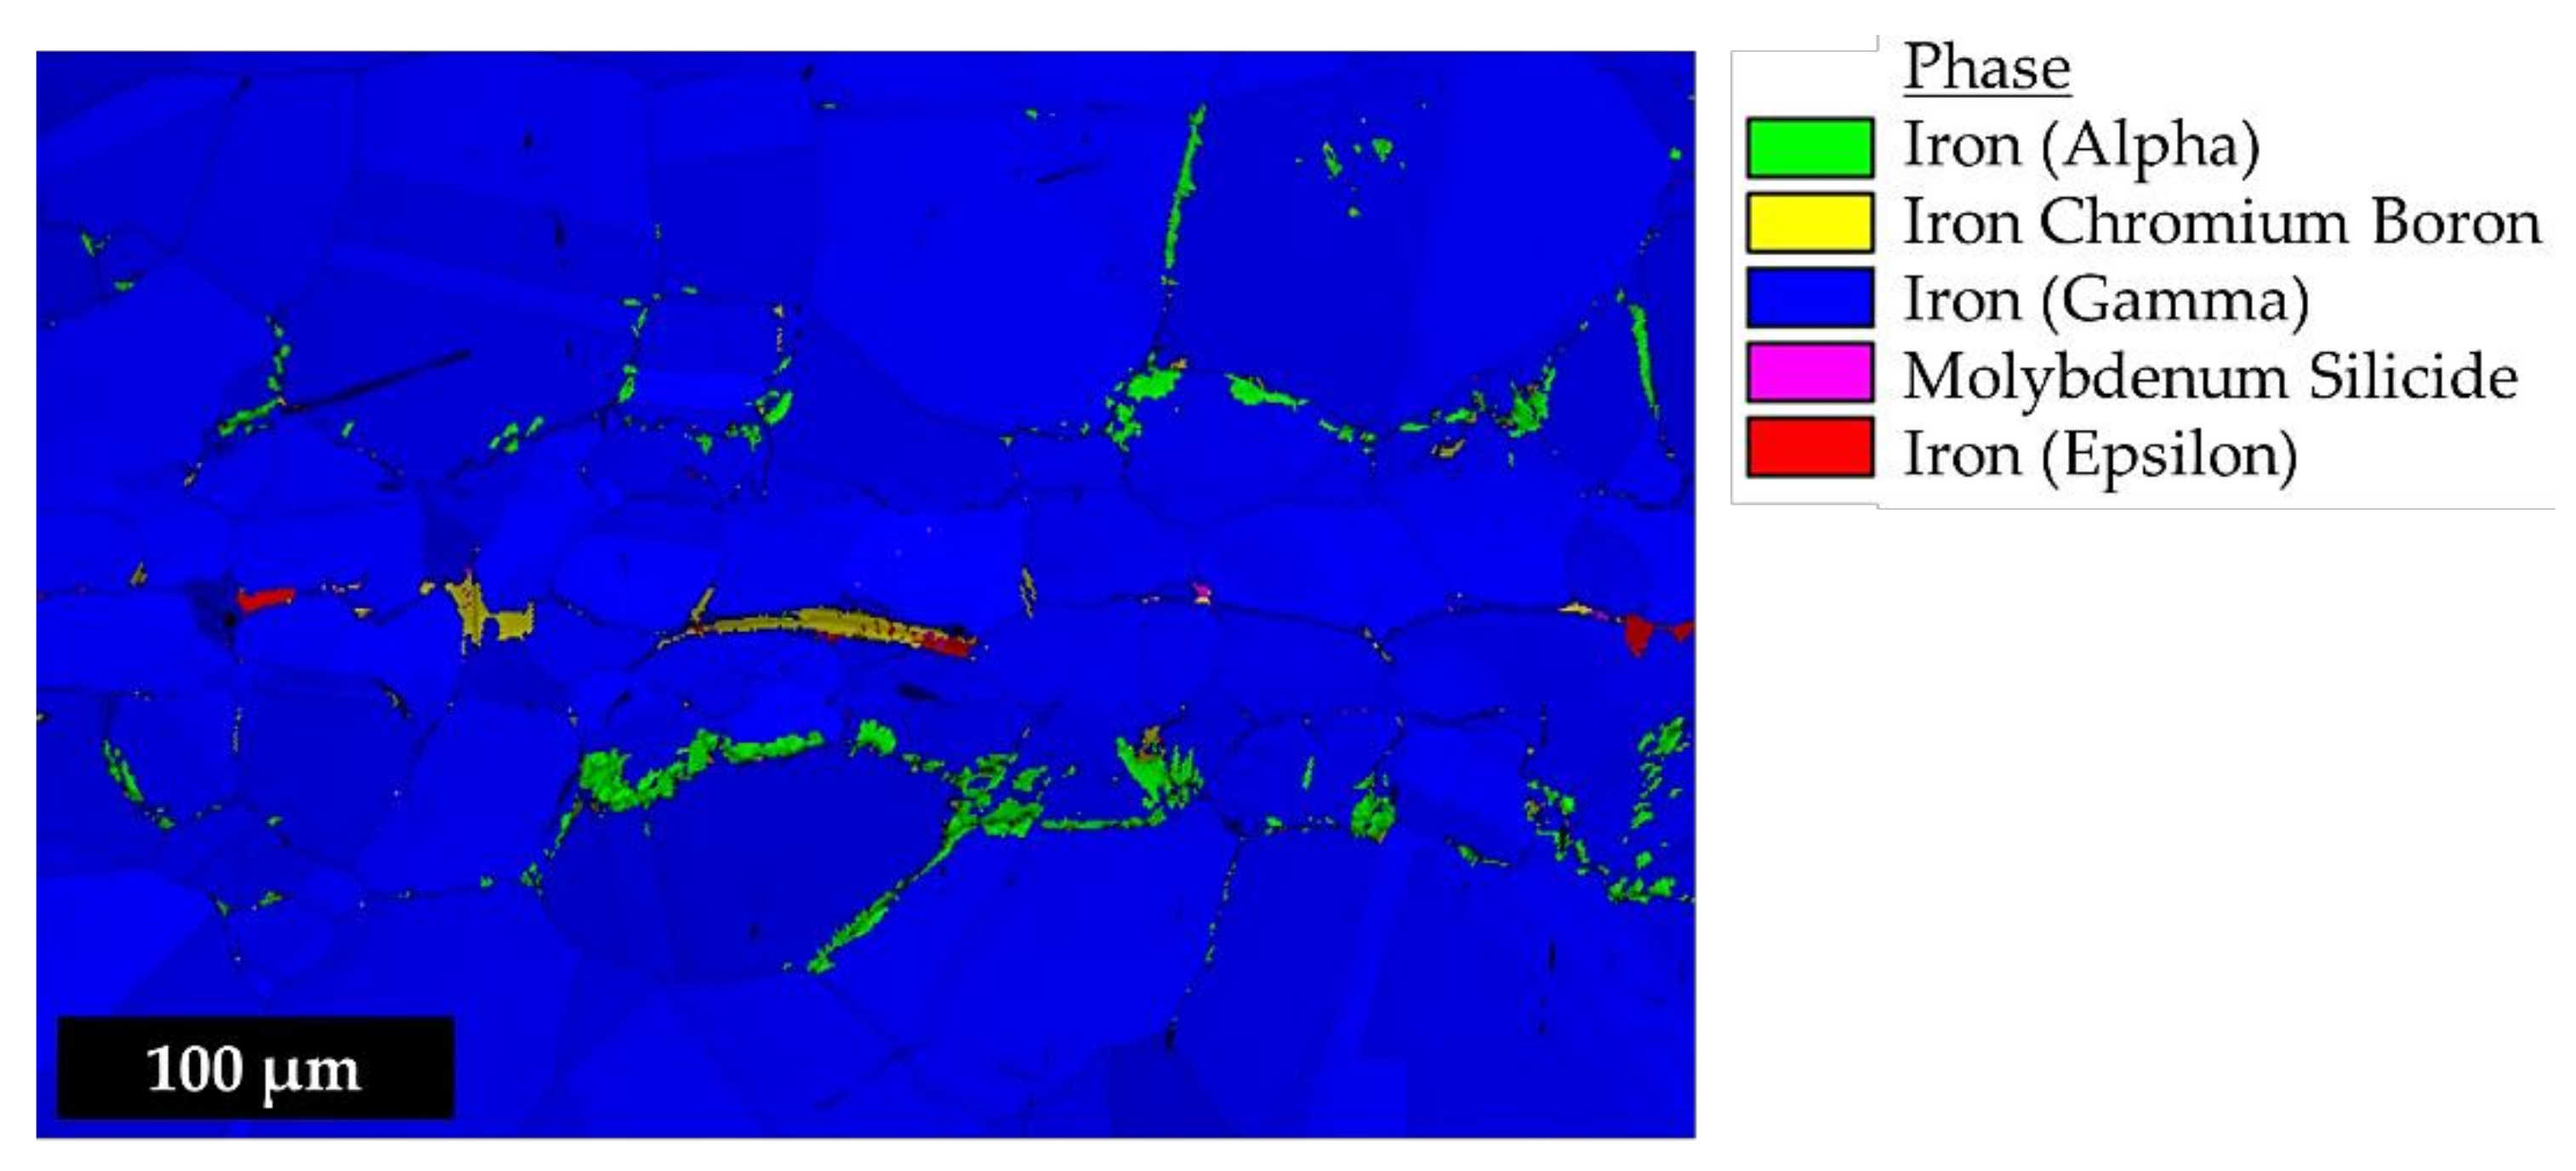
  • Using an EBSD analysis, it was shown that martensite formation can occur in the diffusion zone due to the brazing process.
Since residual stresses are also known to influence the brazing abilities of various components and contribute to the resulting mechanical properties, residual stresses were investigated in this study with respect to the filler alloy compositions used.
  • Using X-ray diffraction measurements, a significant gradient from the brazing seam to the base material was proved, and a dependency on the filler metals used was established.
  • Due to the different diffusion-related sizes of the brazing seam width for the two holding times investigated, it was not possible to compare different holding times for a fixed collimator diameter.
  • An FEM simulation based on an experimentally determined coefficient of thermal expansion showed high compressive residual stresses for the inner seam. These simulated stresses were comparable with the measured residual stresses considering post-processing.
For the mechanical characterization, different kinds of mechanical tests were carried out.
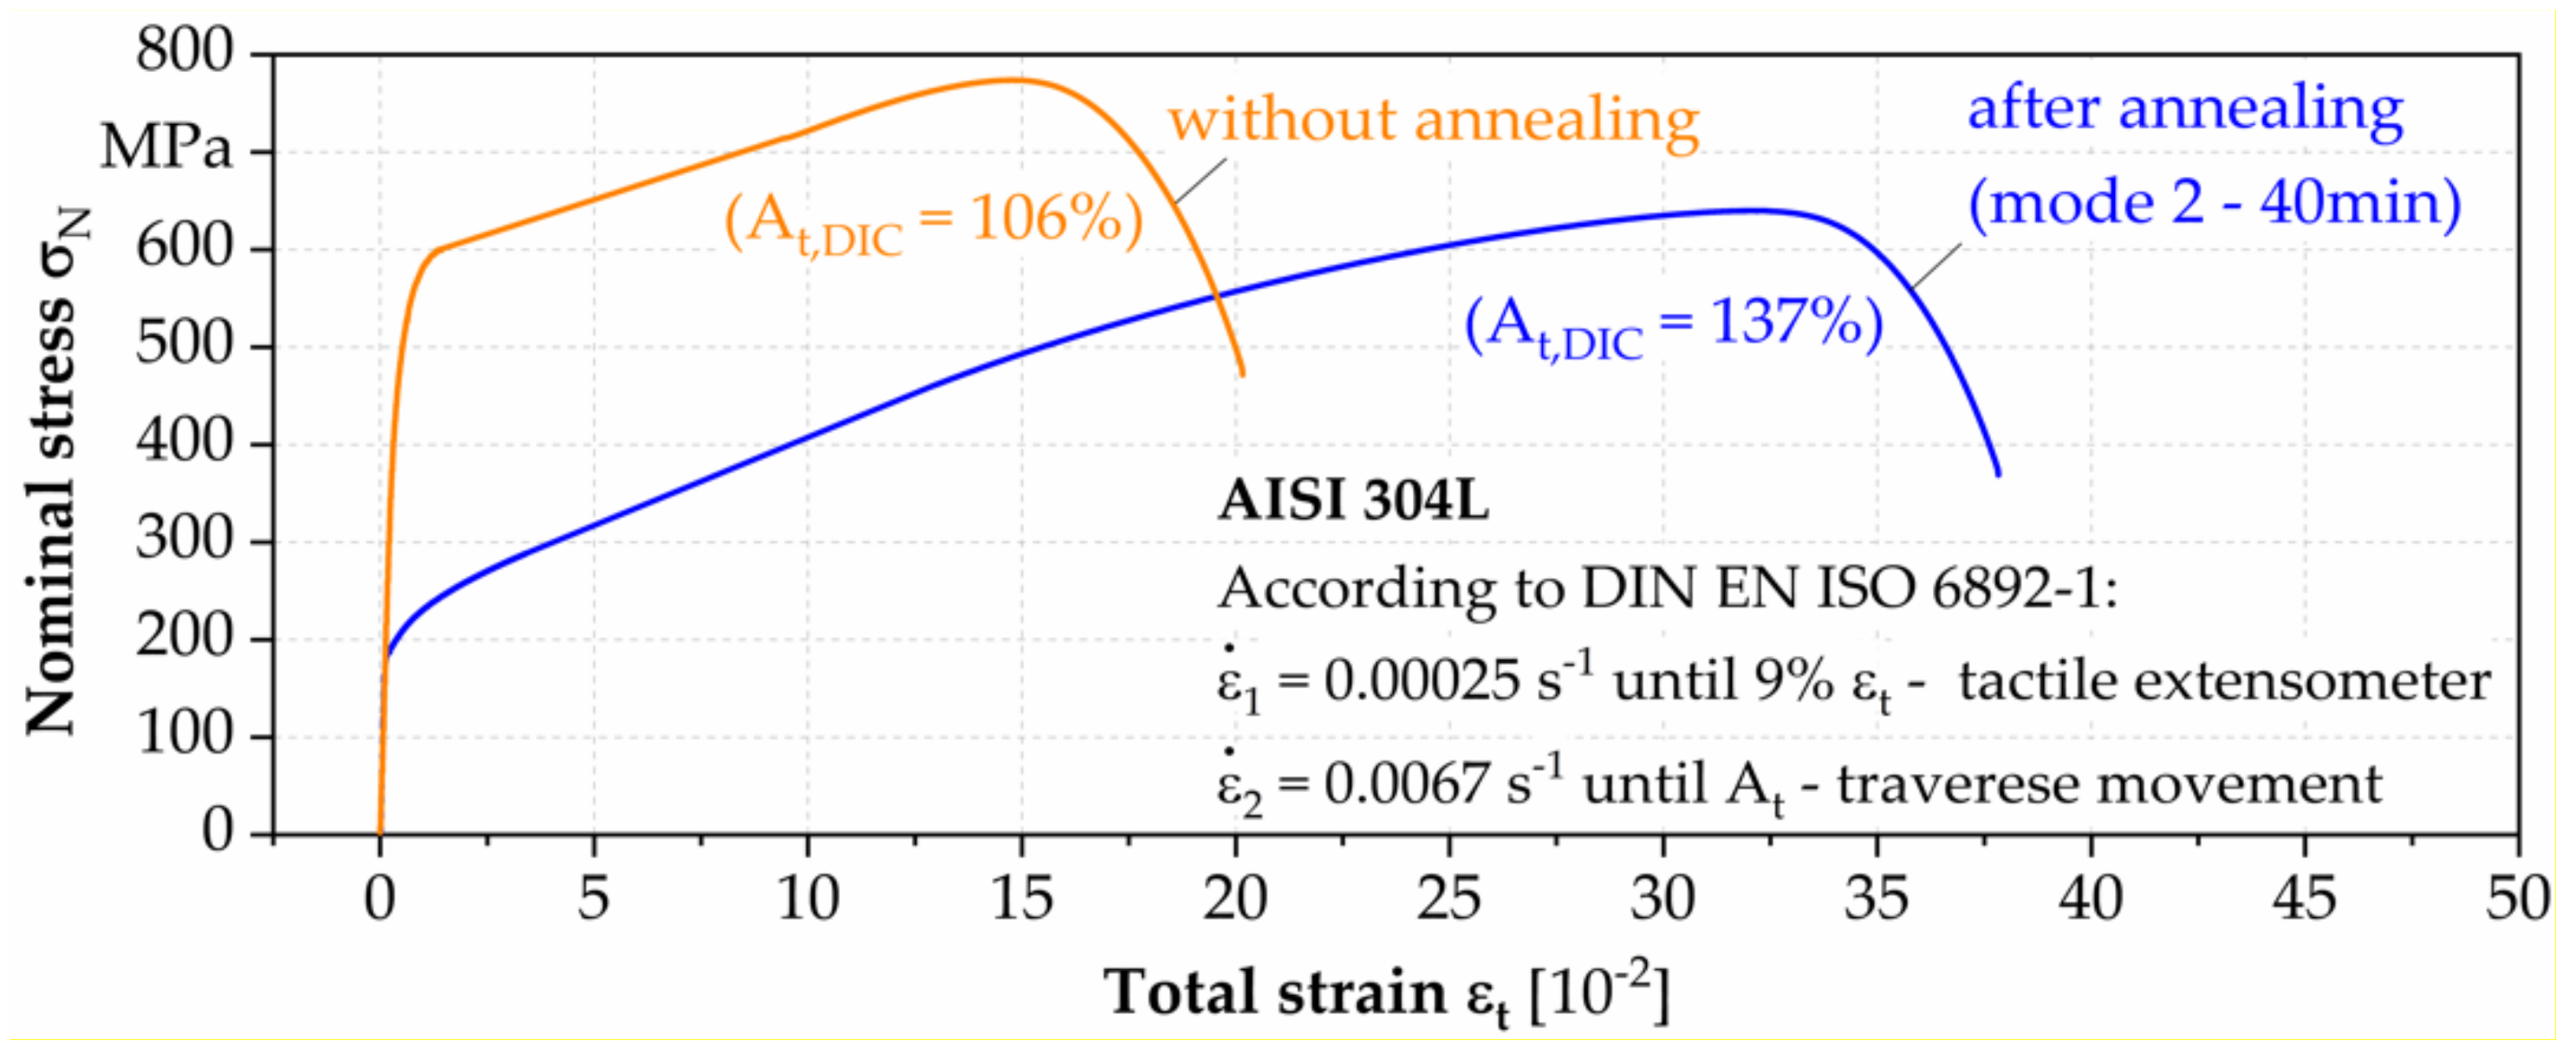
  • The annealing of the base material AISI 304L, according to the time–temperature curve of the brazing process, leads to a tensile strength reduction of about 20%.
  • For two of the three alloy variations, a holding time of 40 min led to an ultimate tensile strength (UTS) that was close to that of the base material in the annealed state.
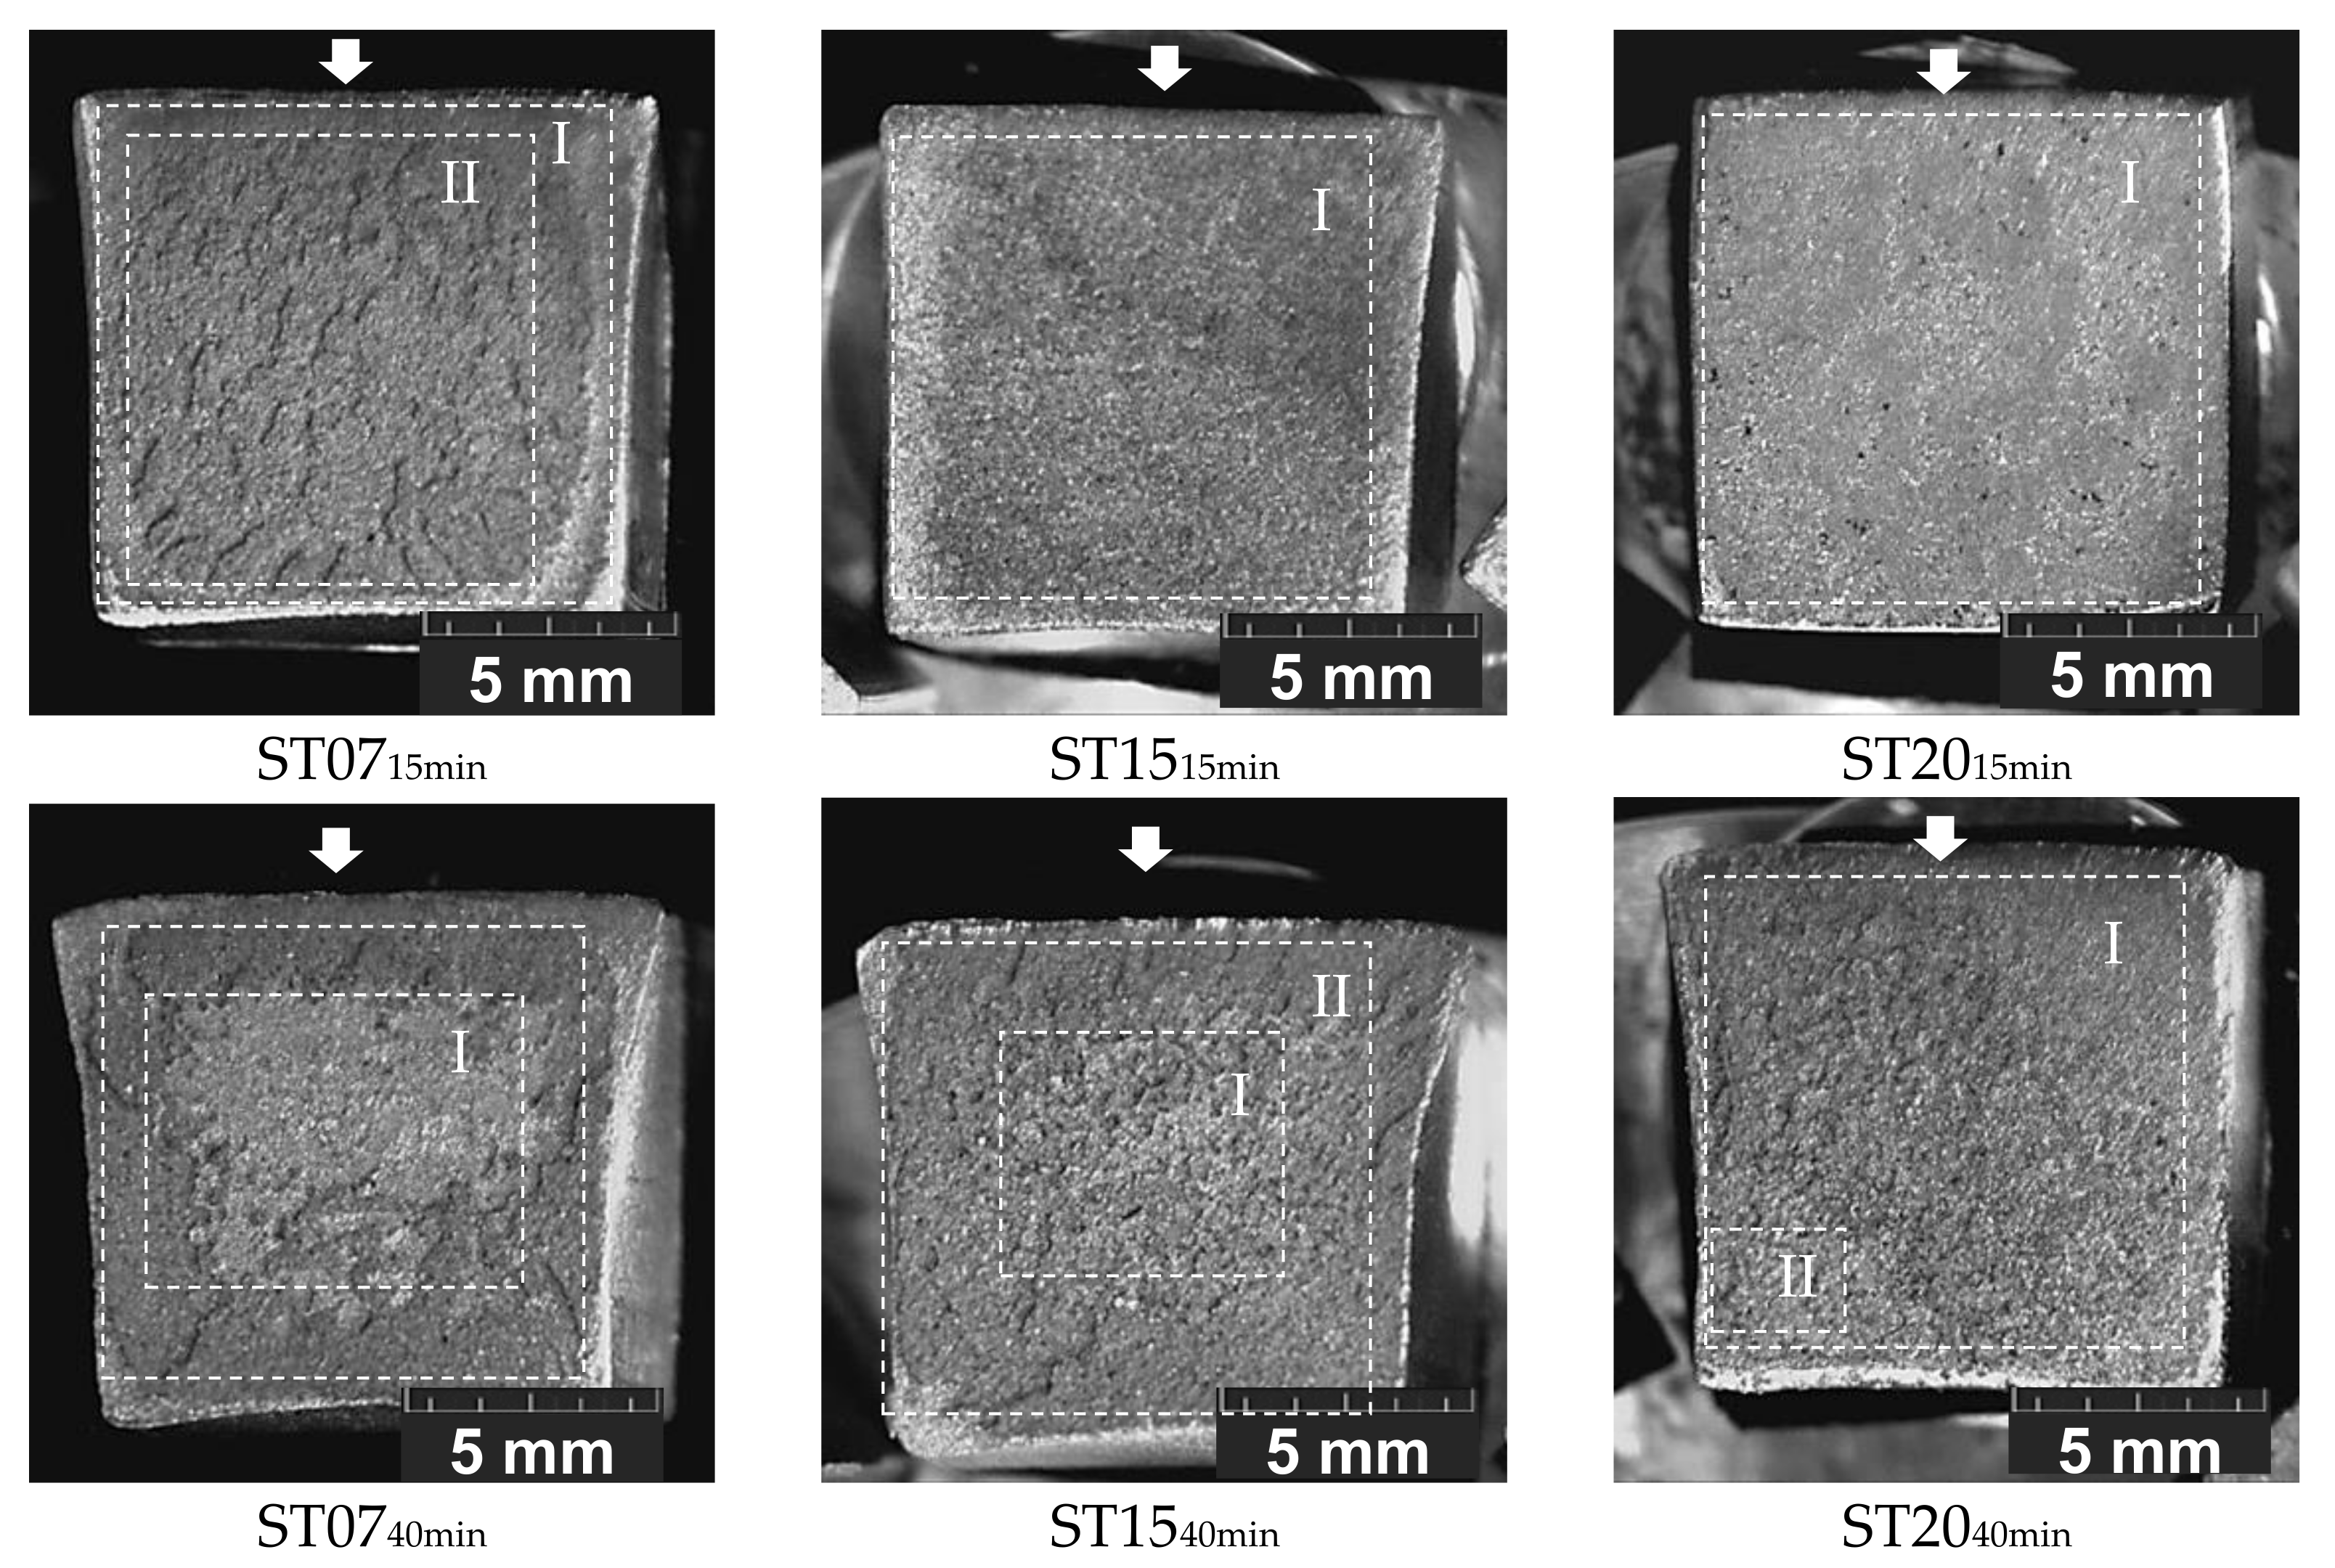
  • The critical effect of brittle phases was most present under impact loadings.
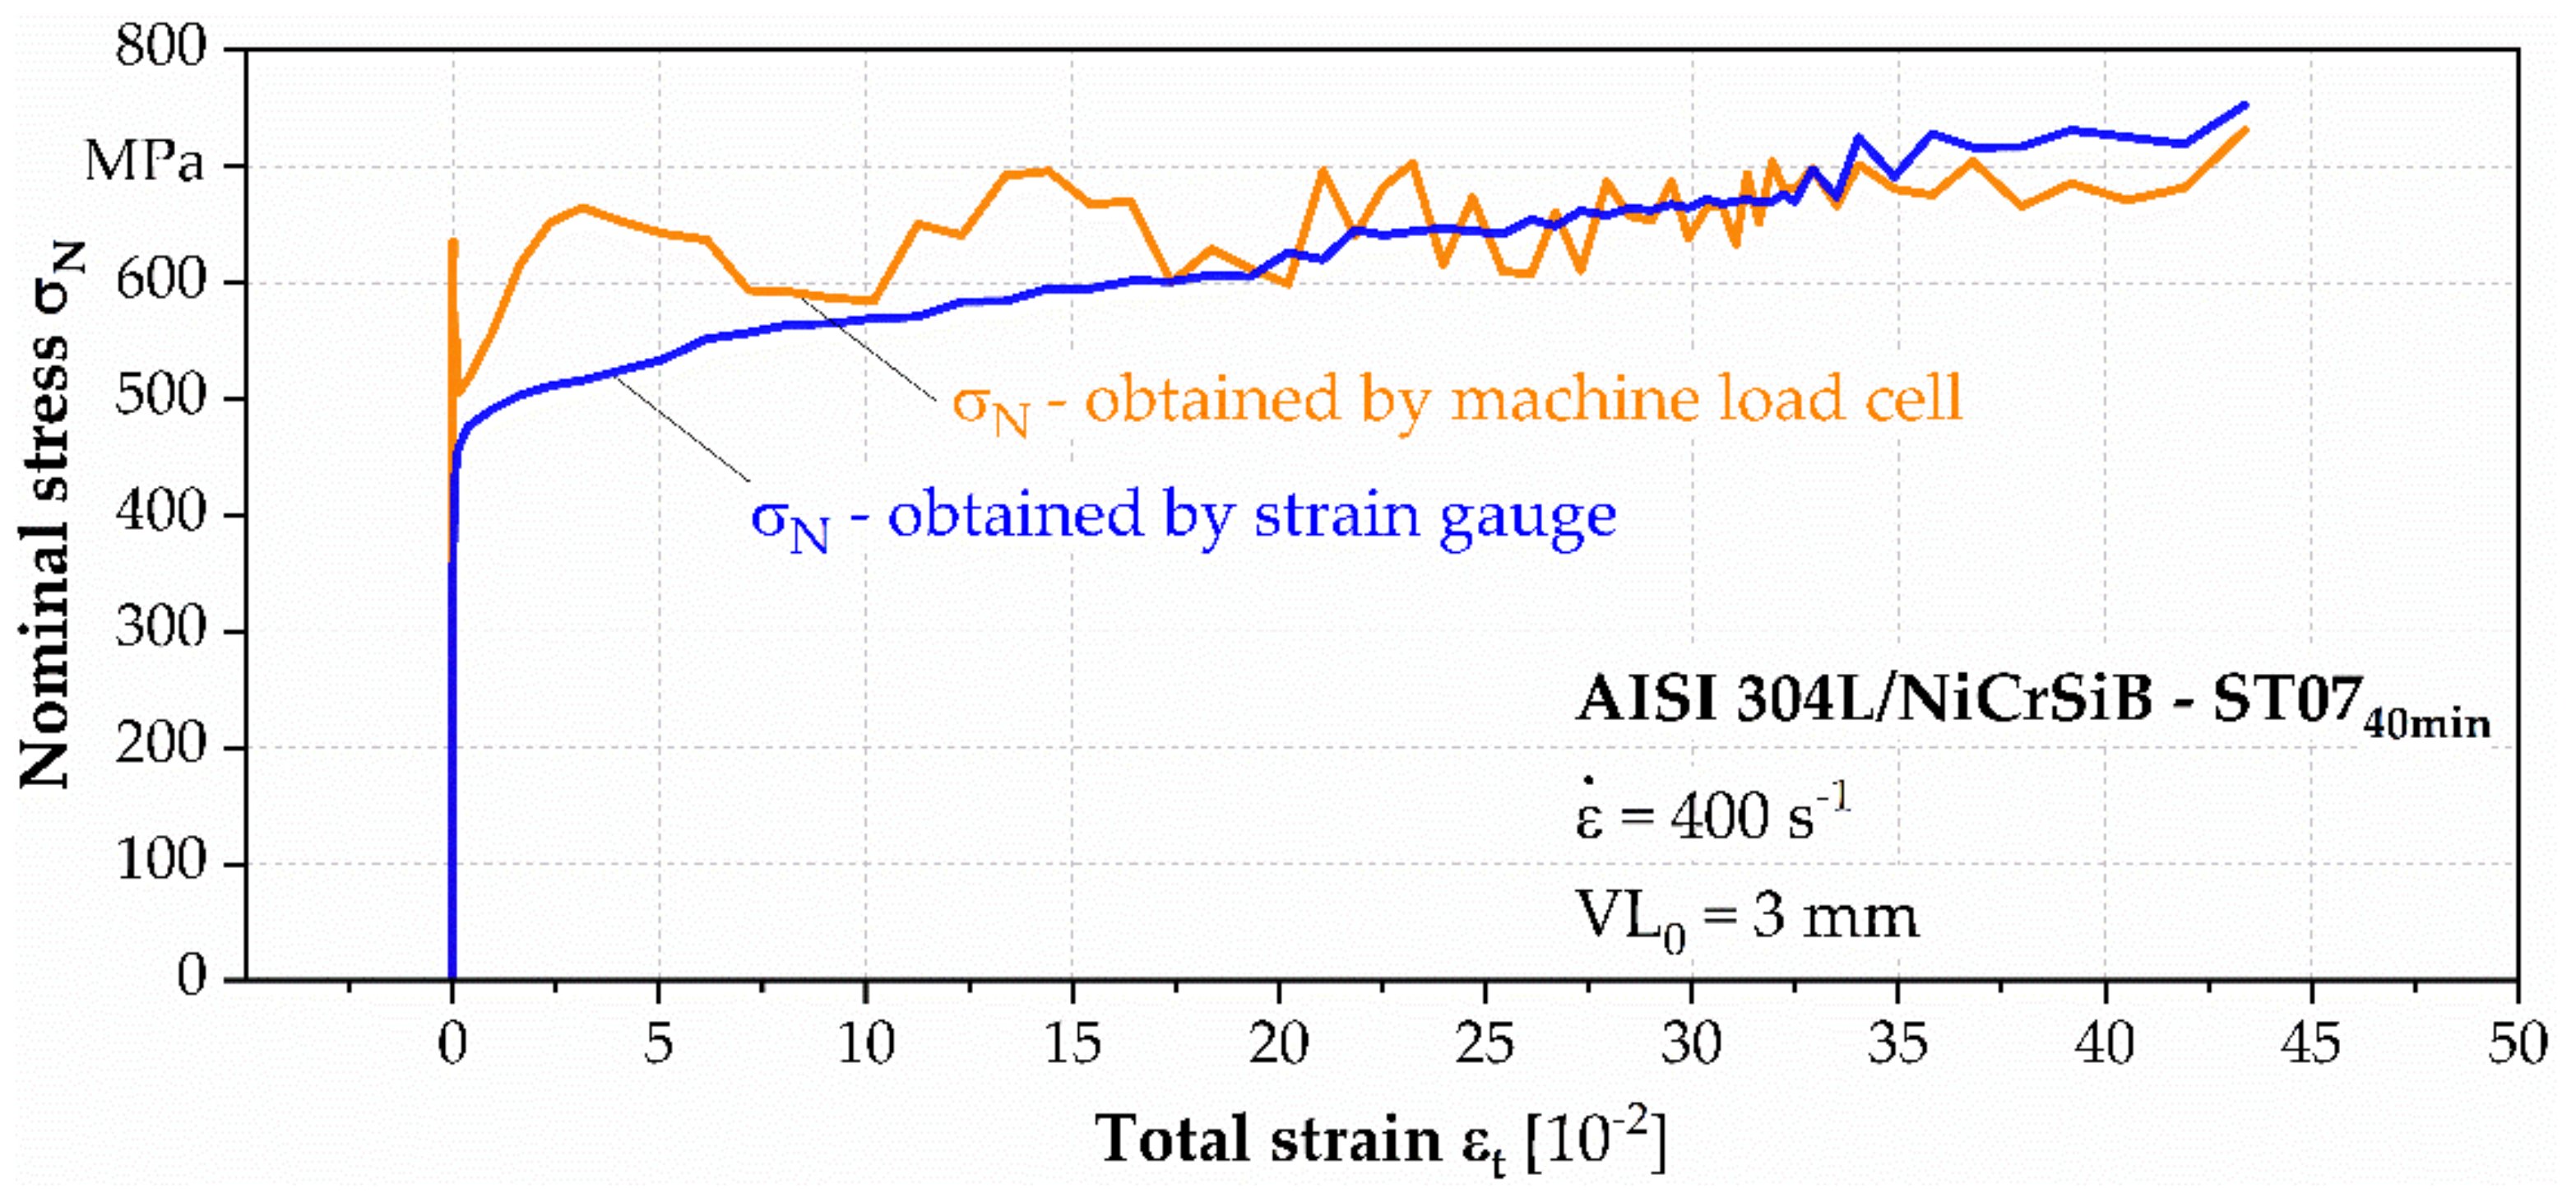
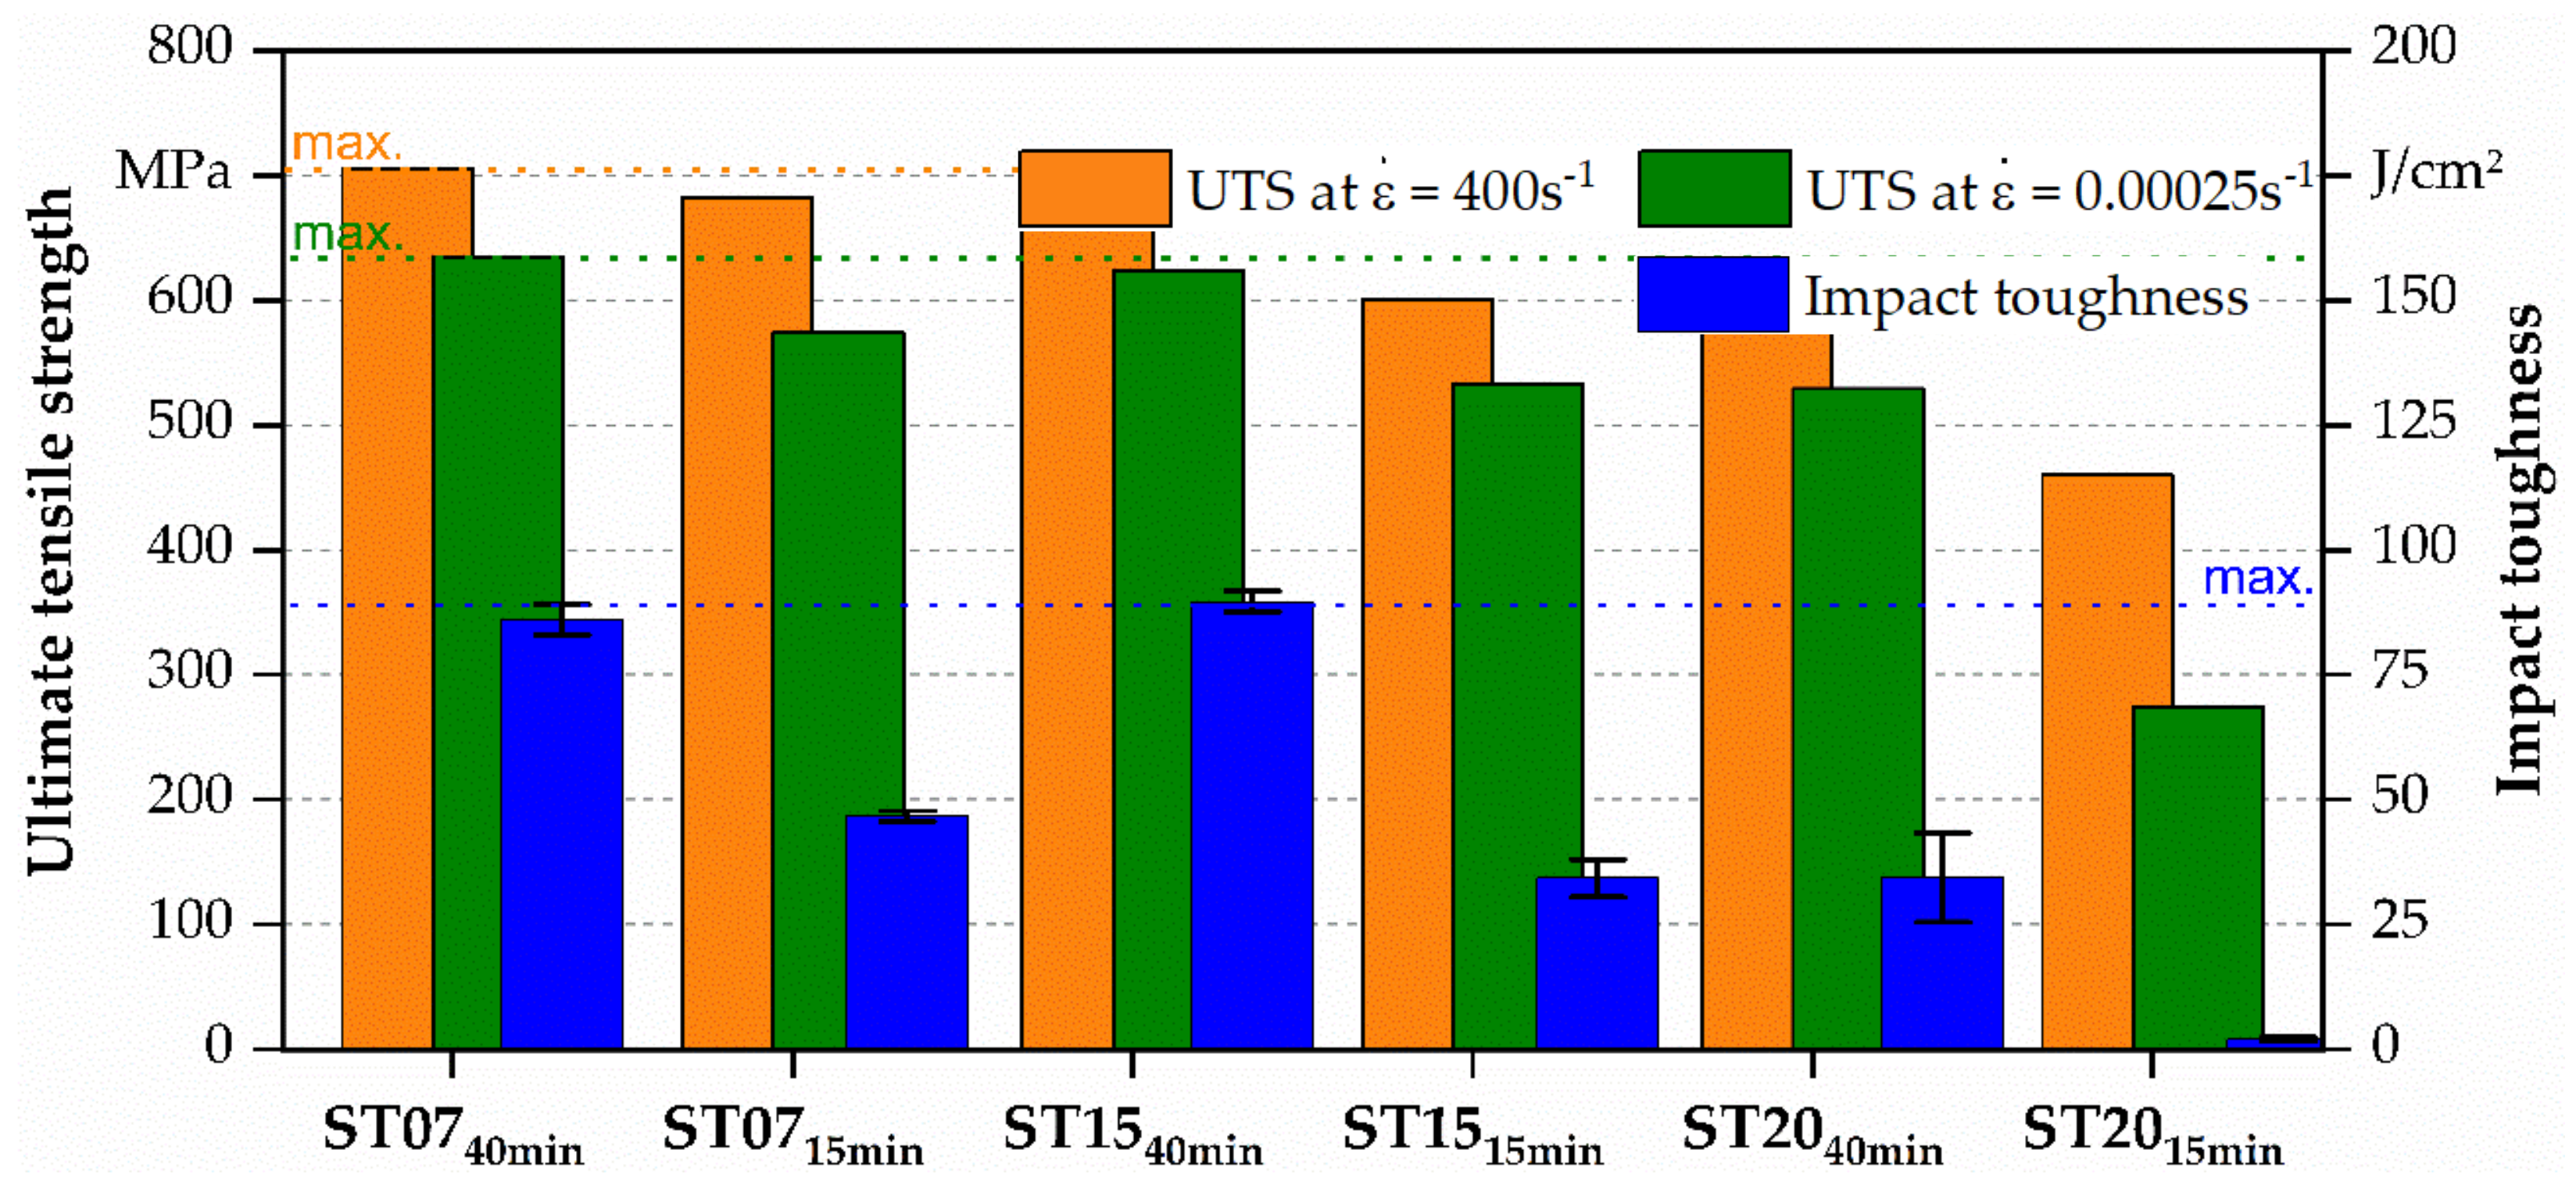
  • In the high-speed tensile tests, it was found that high strain rates increased the UTS of all variations and shifted the other mechanical properties.
  • The best results were shown by the filler metals Ni7Cr7.5Si4Fe1.5B (ST07) and Ni15Cr7.5Si4Fe4Mo1.5B wt.% (ST15), demonstrating impact toughness of 86 ± 3 J/cm2 and 90 ± 2 J/cm2, respectively, as well as almost identical UTS values: 629 ± 9 MPa for the low strain rate and 700 ± 5 MPa for the high strain rate.
Fractographic investigations enabled a further understanding of the failure mechanisms.
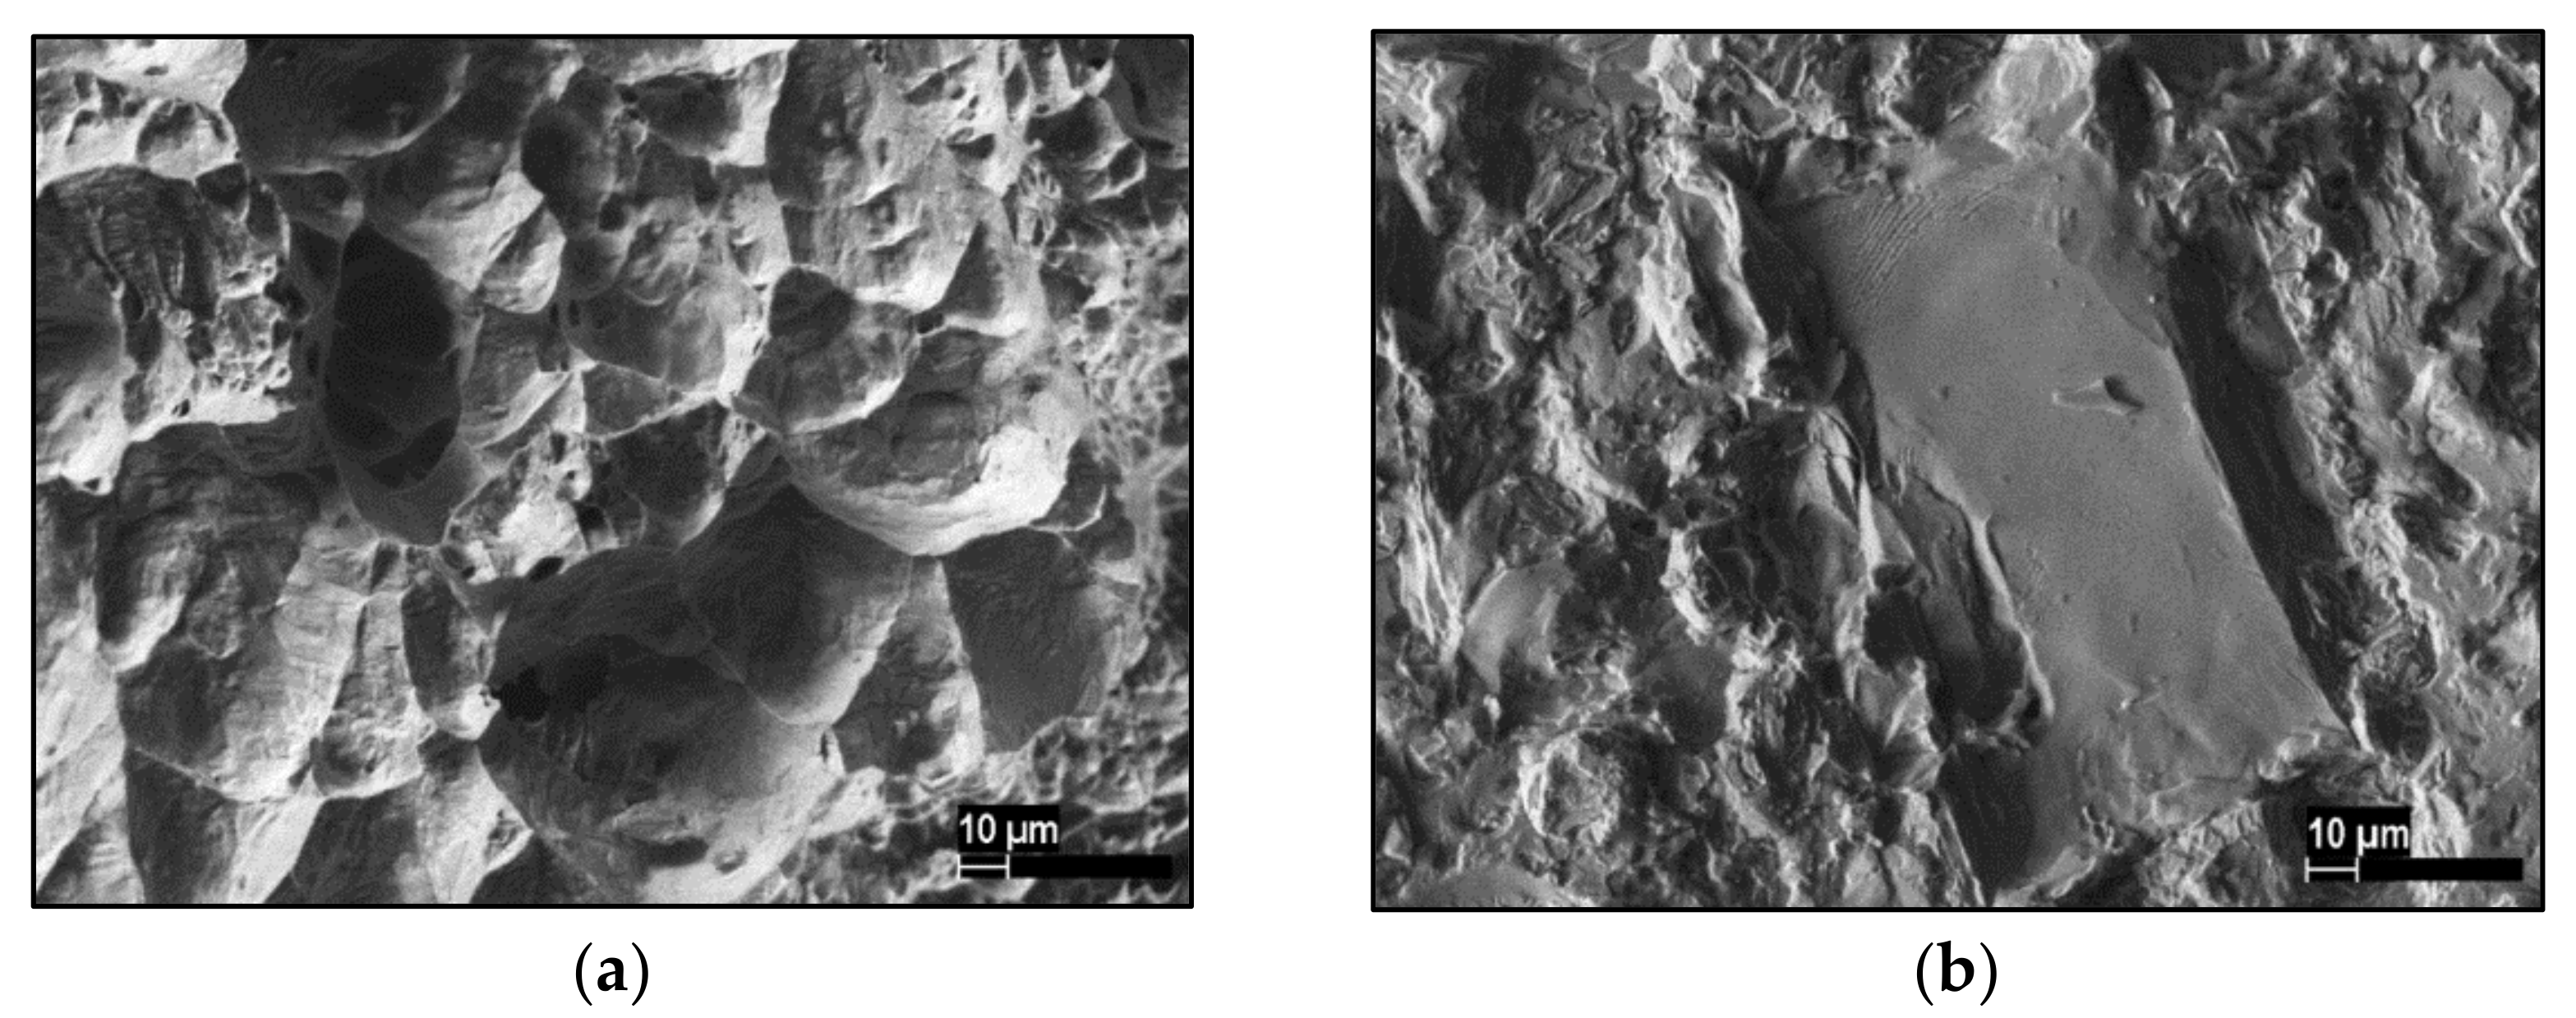
  • Large brittle phases that were located in the center of the brazed seam showed the most negative influence on the initiation and propagation of cracks.
  • Brittle borides in the diffusion zone can break inside the surrounding metal matrix under testing without extending into the matrix of the base material.
An understanding of the alloy–process–structure–properties of vacuum-brazed nickel-based joints was gained, and it can help to improve the quality and safety of brazed joints, which need to be achieved for several applications.

Author Contributions

Conceptualization, J.L.O.; methodology, J.L.O., M.P. and K.M.; validation, J.L.O. and M.P.; investigation, J.L.O., M.P., K.M., L.G. and T.S.; resources, A.I., B.K. and F.W.; data curation, J.L.O., M.P. and K.M.; writing—original draft preparation, J.L.O. and M.P.; writing—review and editing, K.M., L.G., T.S., A.S.-K., A.I. and F.W.; visualization, J.L.O., M.P., K.M. and T.S.; supervision, B.K. and F.W.; project administration, J.L.O. and M.P.; funding acquisition, M.P., A.S.-K., B.K. and F.W. All authors have read and agreed to the published version of the manuscript.

Funding

This study was funded by the Russian Foundation for Basic Research (RFBR)—research project № 19-52-12030—and the German Research Foundation (Deutsche Forschungsgemeinschaft, DFG)—project № 408904168, with the title “Alloying-dependent microstructure influence on corrosion fatigue mechanisms of brazed AISI 304/NiCrSiB joints”.

Acknowledgments

The authors thank the German Research Foundation as well as the Ministry of Innovation, Science, and Research and the Ministry of Culture and Science of North-Rhine-Westphalia (Ministerium fuer Innovation, Wissenschaft und Forschung bzw. Ministerium fuer Kultur und Wissenschaft des Landes Nordrhein-Westfalen, NRW) for their financial support within the Major Research Instrumentation Program for the servohydraulic high-speed testing system (INST 212/371-1 FUGG), the X-ray diffractometer (INST 212/399-1 FUGG), and the high-speed camera system (INST 212/428-1 FUGG).

Conflicts of Interest

The authors declare no conflict of interest.

References

  1. Frazier, W.E.; Polakovics, D.; Koegel, W. Qualifying of metallic materials and structures for aerospace applications. Jom 2001, 53, 16–18. [Google Scholar] [CrossRef]
  2. Goraj, Z.J.; Kustron, K. Review of current research trends in bird strike and hail impact simulations on wing leading edge. Aircr. Eng. Aerosp. Technol. 2018, 90, 602–612. [Google Scholar] [CrossRef]
  3. Schaefer, R.P.; Flynn, J.E.; Doyle, J.R. Brazing filler metal evaluation for an aircraft gas turbine engine application. Weld. J. 1971, 50, 394s–400s. [Google Scholar]
  4. Cook, G.O.; Sorensen, C.D. Overview of transient liquid phase and partial transient liquid phase bonding. J. Mater. Sci. 2011, 46, 5305–5323. [Google Scholar] [CrossRef] [Green Version]
  5. Lichtenfeld, J.A.; Mataya, M.C.; Van Tyne, C.J. Effect of strain rate on stress-strain behavior of alloy 309 and 304L austenitic stainless steel. Metall. Mater. Trans. A Phys. Metall. Mater. Sci. 2006, 37, 147–161. [Google Scholar] [CrossRef]
  6. Talonen, J.; Nenonen, P.; Pape, G.; Hänninen, H. Effect of strain rate on the strain-induced γ,→α′-martensite transformation and mechanical properties of austenitic stainless steels. Metall. Mater. Trans. A Phys. Metall. Mater. Sci. 2005, 36A, 421–432. [Google Scholar] [CrossRef]
  7. Chen, A.Y.; Ruan, H.H.; Wang, J.; Chan, H.L.; Wang, Q.; Li, Q.; Lu, J. The influence of strain rate on the microstructure transition of 304 stainless steel. Acta Mater. 2011, 59, 3697–3709. [Google Scholar] [CrossRef]
  8. Soffa, M.A.; Rommel, M.L. Evaluation of margins of safety in brazed joints. Weld. J. 2009, 88, 31–37. [Google Scholar]
  9. Frick, W.R. Brazing Handbook, 4th ed.; American Welding Society: Miami, FL, USA, 2007; ISBN 9780871710468. [Google Scholar]
  10. Way, M.; Willingham, J.; Goodall, R. Brazing filler metals. Int. Mater. Rev. 2020, 65, 257–285. [Google Scholar] [CrossRef]
  11. Bachurina, D.; Vorkel, V.; Suchkov, A.; Gurova, J.; Ivannikov, A.; Penyaz, M.; Fedotov, I.; Sevryukov, O.; Kalin, B. Overview of the mechanical properties of tungsten/steel brazed joints for the demo fusion reactor. Metals 2021, 11, 209. [Google Scholar] [CrossRef]
  12. Ivannikov, A.A.; Penyaz, M.A.; Dzhumaev, P.S.; Bachurina, D.M.; Sevriukov, O.N. Diffusion brazing of stainless steels influence of Ni-B filler alloy composition. Weld. World 2020. [Google Scholar] [CrossRef]
  13. Lugscheider, E.; Kloehn, K.; Lison, R. Strength of high temperature brazed joints-Influence of brazing parameters. Weld. J. 1979, 58, 296–300. [Google Scholar]
  14. Penyaz, M.; Otto, J.L.; Popov, N.; Ivannikov, A.; Schmiedt-Kalenborn, A.; Walther, F.; Kalin, B. Microstructure influence on corrosion resistance of brazed AISI 304 L/NiCrSiB joints. Met. Mater. Int. 2021. [Google Scholar] [CrossRef]
  15. Otto, J.L.; Penyaz, M.; Schmiedt-Kalenborn, A.; Knyazeva, M.; Ivannikov, A.; Kalin, B.; Walther, F. Effect of phase formation due to holding time of vacuum brazed AISI 304L/NiCrSiB joints on corrosion fatigue properties. J. Mater. Res. Technol. 2020, 9. [Google Scholar] [CrossRef]
  16. Abdolvand, R.; Atapour, M.; Shamanian, M.; Allafchian, A. The effect of bonding time on the microstructure and mechanical properties of transient liquid phase bonding between SAF 2507 and AISI 304. J. Manuf. Process. 2017, 25, 172–180. [Google Scholar] [CrossRef]
  17. DIN EN ISO 6892-1:2017-02, Metallic Materials–Tensile Testing–Part 1: Method of Test at Room Temperature; International Organization for Standardization: Geneva, Switzerland, 2017.
  18. DIN EN ISO 26203-2:2011, Metallic Materials-Testing at High Strain Rates-Part 2: Servo-Hydraulic and Other Test Systems; International Organization for Standardization: Geneva, Switzerland, 2012.
  19. Martinez Krahmer, D.; Polvorosa, R.; López de Lacalle, L.N.; Alonso-Pinillos, U.; Abate, G.; Riu, F. Alternatives for specimen manufacturing in tensile testing of steel plates. Exp. Tech. 2016, 40, 1555–1565. [Google Scholar] [CrossRef]
  20. State Standard 9454-78 Metals. Method for Testing the Impact Strength at Low, Room and High Temperature; Publishing House of Standards: Moscow, Russia, 1979.
  21. Schmiedt, A.; Jaquet, S.; Manka, M.; Tillmann, W.; Walther, F. Tensile and fatigue assessments of brazed stainless steel joints using digital image correlation. MATEC Web Conf. 2018, 165, 1–8. [Google Scholar] [CrossRef] [Green Version]
  22. Koster, M.; Kenel, C.; Lee, W.J.; Leinenbach, C. Digital image correlation for the characterization of fatigue damage evolution in brazed steel joints. Procedia Mater. Sci. 2014, 3, 1117–1122. [Google Scholar] [CrossRef] [Green Version]
  23. Smaga, M.; Walther, F.; Eifler, D. Deformation-induced martensitic transformation in metastable austenitic steels. Mater. Sci. Eng. A 2008, 483–484, 394–397. [Google Scholar] [CrossRef]
  24. Corcoran, J.; Nagy, P.B. Compensation of the skin effect in low-frequency potential drop measurements. J. Nondestruct. Eval. 2016, 35, 1–12. [Google Scholar] [CrossRef] [Green Version]
  25. Schmiedt-Kalenborn, A. Microstructure-Based Assessment of Fatigue and Corrosion Fatigue Behavior of Brazed AISI 304L Stainless Steel Joints Using Nickel- and Gold-Based Brazing Alloys; Reports of Materials Science and Engineering; TU Dortmund University: Dortmund, Germany, 2020. [Google Scholar]
  26. Salvado, F.C.; Teixeira-Dias, F.; Walley, S.M.; Lea, L.J.; Cardoso, J.B. A review on the strain rate dependency of the dynamic viscoplastic response of FCC metals. Prog. Mater. Sci. 2017, 88, 186–231. [Google Scholar] [CrossRef] [Green Version]
  27. Bai, K.; Ng, F.L.; Tan, T.L.; Li, T.; Pan, D. Understanding non-parabolic solidification kinetics in Ni-based alloys during TLP bonding via thermo-kinetic modelling. J. Alloys Compd. 2017, 699, 1084–1094. [Google Scholar] [CrossRef]
  28. Kazazi, A.; Ekrami, A. Corrosion behavior of TLP bonded stainless steel 304 with Ni-based interlayer. J. Manuf. Process. 2019, 42, 131–138. [Google Scholar] [CrossRef]
  29. Yuan, X.; Kim, M.B.; Kang, C.Y. Microstructural evolution and bonding behavior during transient liquid-phase bonding of a duplex stainless steel using two different Ni-B-based filler materials. Metall. Mater. Trans. A Phys. Metall. Mater. Sci. 2011, 42, 1310–1324. [Google Scholar] [CrossRef]
  30. Moreau, E.D.; Corbin, S.F. Application of diffusion path analysis to understand the mechanisms of transient liquid-phase bonding in the Ni-Si-B system. Metall. Mater. Trans. A Phys. Metall. Mater. Sci. 2019, 50, 5678–5688. [Google Scholar] [CrossRef]
  31. Yuan, X.J.; Kim, M.B.; Kang, C.Y. Effects of boron and silicon on microstructure and isothermal solidification during TLP bonding of a duplex stainless steel using two Ni-Si-B insert alloys. Mater. Sci. Technol. 2011, 27, 1191–1197. [Google Scholar] [CrossRef]
  32. Liang, Y.; Li, S.; Ai, C.; Han, Y.; Gong, S. Effect of Mo content on microstructure and stress-rupture properties of a Ni-base single crystal superalloy. Prog. Nat. Sci. Mater. Int. 2016, 26, 112–116. [Google Scholar] [CrossRef] [Green Version]
  33. Zhang, H.K.; Chen, J.S.; Zhang, L.X.; Yu, Z.; Zhang, P.; Zhang, Y.Z.; Yu, C.; Lu, H. Phase stability, elasticity, hardness and electronic structures for binary MnBm (M = Ni, Cr, Mo, W, n = 23, 5, 3, 1, m = 6, 3, 2, 1) borides: A comprehensive study using first principles. Phase Transit. 2020, 93, 158–174. [Google Scholar] [CrossRef]
  34. Akkuzin, S.A.; Litovchenko, I.Y.; Polekhina, N.A.; Tyumentsev, A.N. Effect of thermomechanical treatment modes on structural-phase states and mechanical properties of metastable austenitic steel. AIP Conf. Proc. 2016, 1783. [Google Scholar] [CrossRef] [Green Version]
  35. Das, A. Cyclic plasticity induced transformation of austenitic stainless steels. Mater. Charact. 2019, 149, 1–25. [Google Scholar] [CrossRef]
  36. Reichel, U.; Gabriel, B.; Kesten, M.; Meier, B.; Dahl, W. Technological application of the martensitic transformation of some austentic stainless steels. Steel Res. 1989, 60, 464–468. [Google Scholar] [CrossRef] [Green Version]
  37. Penyaz, M.A.; Ivannikov, A.A.; Kalin, B.A.; Dzhumaev, P.S. Thermal fatigue damage of steel joints brazed with various nickel filler metals. Non Ferr. Met. 2019, 46, 33–39. [Google Scholar] [CrossRef]
  38. Martell, J.J.; Liu, C.R.; Shi, J. Experimental investigation on variation of machined residual stresses by turning and grinding of hardened AISI 1053 steel. Int. J. Adv. Manuf. Technol. 2014, 74, 1381–1392. [Google Scholar] [CrossRef]
  39. Wang, B.; Zhou, G.; Wang, D.; Duan, P. Residual stress simulation based on the effect of element diffusion on 316L/BNi-2 brazed joint. Adv. Eng. Res. 2017, 118, 454–459. [Google Scholar] [CrossRef] [Green Version]
  40. Litovchenko, Y.I.; Akkuzin, S.A.; Tyumentsev, A.N. The effect of short-term annealing on reverse martensite-austenite transformation and recrystallization of metastable austenitic steel. AIP Conf. Proc. 2018, 2053. [Google Scholar] [CrossRef]
  41. Ben Othmen, K.; Haddar, N.; Jegat, A.; Manach, P.Y.; Elleuch, K. Ductile fracture of AISI 304L stainless steel sheet in stretching. Int. J. Mech. Sci. 2020, 172. [Google Scholar] [CrossRef]
  42. Schmiedt, A.; Manka, M.; Tillmann, W.; Walther, F. Local quasi-static and cyclic deformation behaviour of brazed AISI 304L/BAu-4 joints characterised by digital image correlation. Weld. World 2019, 63, 501–509. [Google Scholar] [CrossRef]
  43. Frommeyer, G.; Brüx, U.; Neumann, P. Supra-ductile and high-strength manganese-TRIP/TWIP steels for high energy absorption purposes. ISIJ Int. 2003, 43, 438–446. [Google Scholar] [CrossRef] [Green Version]
  44. Momeni, M.; Danninger, H.; Gierl, C.; Dudrová, E.; Arvand, A. Relationship between tensile toughness and impact energy of Mo prealloyed and Ni-Cu-Mo diffusion bonded sintered steels. Powder Metall. Prog. 2011, 11, 62–68. [Google Scholar]
  45. Rusinek, A.; Klepaczko, J.R. Experiments on heat generated during plastic deformation and stored energy for TRIP steels. Mater. Des. 2009, 30, 35–48. [Google Scholar] [CrossRef]
  46. Follansbee, P.S. High strain rate deformation in FCC metals and alloys. In Proceedings of the International Conference on Metallurgical Applications of Shock-Wave and High-Strain-Rate Phenomena, Portland, OR, USA, 28 July 1985. [Google Scholar]
  47. Austin, R.A.; McDowell, D.L. A dislocation-based constitutive model for viscoplastic deformation of fcc metals at very high strain rates. Int. J. Plast. 2011, 27, 1–24. [Google Scholar] [CrossRef]
  48. Porchilamban, S.; Amaladas, J.R. Structural relationships of metallurgical and mechanical properties influenced by Ni-based fillers on Gas Tungsten Arc Welded Ferritic/Austenitic SS dissimilar joints. J. Adv. Mech. Des. Syst. Manuf. 2019, 13, 1–22. [Google Scholar] [CrossRef] [Green Version]
  49. Luegscheider, E.; Partz, K.-D. High temperature brazing of stainless steel with nickel-base filler metals BNi-2, BNi-5 and BNi-7. In Proceedings of the 12th International AWS-WRC Brazing Conference, Cleveland, OH, USA, 7–9 April 1981. [Google Scholar]
Figure 1. Scheme of the jig construction for brazing.
Metals 11 00593 g001
Figure 2. Specimen geometries for (a) low-strain-rate tensile tests and (b) high-strain-rate tensile tests (all dimensions in mm).
Metals 11 00593 g002
Figure 3. Experimental setup of the X-ray diffractometer.
Metals 11 00593 g003
Figure 4. Measuring points on the specimen surface for (a) all brazed joints and (b) only ST2040min for detailed analysis (all dimensions in mm).
Metals 11 00593 g004
Figure 5. Model of the cylindrical brazed specimen based on the hypothesis of the axis symmetry of the brazed joint.
Metals 11 00593 g005
Figure 6. Impact test scheme with modifications.
Metals 11 00593 g006
Figure 7. Instrumented low-strain-rate tensile test setup.
Metals 11 00593 g007
Figure 8. High-strain-rate tensile test setup.
Metals 11 00593 g008
Figure 9. Cross-sections of the brazing seam with scanning electron microscopy (SEM) with backscattered electron (BSE) detector (all dimensions of white numbers in µm).
Metals 11 00593 g009
Figure 10. Electron backscatter diffraction (EBSD) phase analysis of ST2015min.
Metals 11 00593 g010
Figure 11. Distribution of residual stresses of ST2040min in the (a) axial direction and (b) radial direction—measuring points according to Figure 4b.
Metals 11 00593 g011
Figure 12. Calculated distribution of the normal residual stresses of ST0715min after cooling in the (a) axial direction (y axis) and (b) radial direction (x axis).
Metals 11 00593 g012
Figure 13. Stress–strain curves of tensile tests for the base material with and without heat treatment according to the brazing process.
Metals 11 00593 g013
Figure 14. Local strain distribution (a) via digital image correlation (DIC) and (b) effect of different initial extensometer gauge lengths on the calculated strain.
Metals 11 00593 g014
Figure 15. Instrumented low-strain tensile test with ST0740min.
Metals 11 00593 g015
Figure 16. Instrumented low-strain tensile test with ST2040min.
Metals 11 00593 g016
Figure 17. High-strain-rate tensile test with ST0740min.
Metals 11 00593 g017
Figure 18. Comparison of the results of the low-strain-rate tensile tests, high-strain-rate tensile tests, and impact toughness tests for ST07, ST15, and ST20 for both brazing modes.
Metals 11 00593 g018
Figure 19. Fracture surfaces after impact tests.
Metals 11 00593 g019
Figure 20. Fracture surfaces after impact tests of (a) ST0740min and (b) ST2015min.
Metals 11 00593 g020
Figure 21. Cross-section of ST2015min, which shows the (a) fracture mechanism and (b) cracked borides inside the material after high-speed tensile testing.
Metals 11 00593 g021
Table 1. Chemical compositions of the base material and the filler metals.
AlloyAlloy Composition (wt.%)Melting Range * (°C)
FeNiCrCSiMnMoB
AISI 304Lbal.8.0318.140.0230.301.540.34TsolidusTliquidus
ST074.0bal.7.07.51.59581111
ST154.0bal.15.07.54.01.510491115
ST204.0bal.20.07.54.01.510781125
* error is ± 0.5 °C.
Table 2. Brazing process parameters.
ModeHeating Rate 1First Holding TimeHeating Rate 2Final Holding Time
Mode 140 K/min15 min at 900 °C20 K/min15 min at 1160 °C
Mode 240 K/min15 min at 900 °C20 K/min40 min at 1160 °C
Table 3. Measurement parameters of the residual stress measurements and analysis.
ParameterSign, (Unit)ValueParameterSign, (Unit)Value
Target−, (−)CuTiltψ, (°)+/−0, +/−11.25, +/−22.5, +/−33.75, +/−45
Wavelength kα1λ, (nm)0.1540549Azimuth Positionsφ, (°)0 and 180,
90 and 270
Bragg Angle2θ, (°)147.200Measurement Modus−, (−)Side Inclination
Diffraction Plane {hkl}, (−)420Scale Factor.0s1{hkl},
(10−6 mm2/N)
1.79×10⁻⁶ mm2/N
Currenti, (mA)40Scale Factor½ s2{hkl},
(10−6 mm2/N)
7.48×10⁻⁶ mm2/N
Voltageu, (kV)40Poisson’s Ratioν, (−)0.31
Collimator Diameter−, (µm)0.30Young’s ModulusE, (GPa)176
Table 4. Material properties calculated with the JMatPro software for different temperatures; RT = room temperature (T = 20°C).
Material Density (g/cm3)CTE (10−6 1/K)Young’s Modulus (GPa)Poisson’s Ratio (−)
RTRT1160 °CRT1160 °CRT1160 °C
AISI 304L7.913.921.0193820.120.30
Brazing Seam8.012.223.51951110.310.35
Table 5. Residual stresses, measured according to Figure 4a.
Position
(mm)
Holding Time 40 minHolding Time 15 minAISI 304L
ST20ST15ST07ST20ST15ST07
+2.0−296 ± 30−264 ± 76−261 ± 59−277 ± 23−170 ± 101−103 ± 197−219 ± 73
+1.0−248 ± 27−236 ± 65−209 ± 70−237 ± 91−180 ± 41−183 ± 78−247 ± 58
+ 0.1−314 ± 68−281 ± 47−214 ± 78−293 ± 39−209 ± 68−280 ± 138−249 ± 62
0.0−490 ± 57−475 ± 28−409 ± 36−395 ± 76−384 ± 124−375 ± 107−287 ± 65
−0.1−315 ± 98−291 ± 62−230 ± 68−245 ± 78−293 ± 197−213 ± 211−214 ± 30
−1.0−225 ± 40−242 ± 69−227 ± 74−209 ± 68−217 ± 147−146 ± 62−257 ± 29
−2.0−252 ± 61−278 ± 73−270 ± 56−246 ± 62−212 ± 135−69 ± 73−292 ± 54
Publisher’s Note: MDPI stays neutral with regard to jurisdictional claims in published maps and institutional affiliations.

